Embed Size (px)
Citation preview

�Slope Stability Santiago Chile, November 2009
Enhanced characterization of a soft marl formation using in situ and lab tests, for the prestripping phase of Cobre Las Cruces open pit mine
Cobre Las Cruces mine is located in Gerena (close to Seville, SW Spain). This mine is enclosed in the Faja Pirítica metalogenetic province at the SW of the Iberian Peninsula and it has an estimated reserve of 17.625 Mt. The average grade is the 6.21% Cu. The exploitation is basically an open pit measuring 1600 m long x 900 m wide x 250 m deep. Mineralization is embedded in volcanic and other metamorphic rocks. Prior to reaching the mineralization it is necessary to do a pre-stripping of 120 to 150 m composed by carbonated clay (known as Guadalquivir Blue Marls).This paper describes the lab and in situ site characterization works performed. In order to characterize as accurately as possible these marls, different levels in depth have been distinguished. Secondly, the comparison between the results obtained from lab tests over boreholes samples and the results obtained from samples sculpted during the pit excavation is shown.Thirdly, the discussion about deformability is demonstrated basically by means of soft dilatometer tests. Finally, the observed strain-softening behaviour of these marls is discussed and the results of sophisticated lab tests measuring the post failure behaviour of samples are included.
Keywords: Soft marls, .geomechanical behaviour.
Abstract
J.M. Galera
Geocontrol Chile S.A.
M. Checa, C. Perez
and B. Williams
V. Pozo
Geocontrol S.A.
INTRODUCTION
Cobre Las Cruces mine is located in Gerena (close to Seville, SW Spain) and constitute the largest new mining project in Europe. The mine is owned by INMET and Leucadia, and operated by INMET.
Figure 1 includes the location of the mine as well as the actual lay out of the mine showing its development by the end of June 2009.
Figure 1 - Location Map Showing the Digital Elevation Model of the Open Pit.

� Santiago Chile, November 2009 Slope Stability
This mine is enclosed in the Faja Pirítica metalogenetic province at the SW of the Iberian Peninsula and it has an estimated reserve of 17.625 Mt. The average grade is the 6.21% Cu.
The exploitation consists basically of an open pit measuring 1600 m long x 900 m wide x 250 m deep. Also in the near future small underground mine is foreseen. For this underground phase, the copper ore will be recovered using sublevel stopping and drift and fill methods.
Mineralization is embedded in volcanic and other metamorphic rocks, including massive pyrites and other sulphides.
Prior to reaching the mineralization it is necessary to do a pre-stripping of 120 to 150 m composed by carbonated clay, well known as Guadalquivir Blue Marls (Ayala, F., 1978; Oteo, C., 1976; Tsige, M., 1999). This marls correspond to a marine Tertiary formation aged Miocene. From the geomechanical point of view, this marls constituted the more problematic lithology as they present a weak strength and low deformational parameters. Also they have low permeability as well as discontinuities. As a result they geotechnical behaviour can be considered very poor and problematic.
For this reason, from the surface down to an elevation of -150 m, a general slope of 28 degrees has been used. This average slope is phased in benches of 10 m high and 60º inclination, except the first 2 benches in which 45º of inclination has been adopted.
By the time of writing this contribution the phase 1 of the open pit mine has been finished while the second phase, homothetic from the first one, has reached a state of completion of 50 %.
ROCK MASS CHARACTERIZATION
Below it is described all the lab and in situ tests performed in order to do the site characterization prior to the initiation of the excavation as well as the works done during the excavation phase. It can be clearly observed with depth, the evolution of the strength and deformability.
Geotechnical lab testIn order to characterize as accurately as possible these soft marls, different levels in depth have been distinguished. An intensive
geotechnical characterization has been carried out. This site characterization includes 412 laboratory tests (from borehole undisturbed samples and from sculpted in situ samples) as well as 75 in situ soft dilatometer tests.
Mineralogical compositionThe first types of tests carried out are in relation with the petrology and mineralogy of the marls. For this purpose 44 RX Diffractions
and 154 carbonate content have been done.
Figure 2 shows the distribution of clay minerals and carbonate content with depth.
Figure 2 - Clay Minerals and Carbonates Content

�Slope Stability Santiago Chile, November 2009
It can be observed that illite, from 20 to 40 %, is the main clay mineral. Caolinite decreases with depth disappearing at 100 m while smectite content increase with depth especially after 100 m depth as so does calcite. The carbonate content shows a high scatter at surface in relation with weathering processes and afterwards ranges between 15 and 30 % down to 100 m. At that depth the carbonate content increases to an average value of 30 %. These data are in agreement with the excavation as at that depth explosive are required to excavate the marl.
Petrophysical parametersIn order to characterize the main physical parameters of the marl the following lab tests and determinations have been done:
352 ut. dry density115 ut. specific weight of solid particles359 ut. humidity221 ut. Plasticity index
Figure 3 shows the evolution of these parameters with depth. It can clearly be observed that density measured at in situ samples is higher than the one obtained from undisturbed borehole samples. Consequently the water content on undisturbed samples is higher.
Density increases with depth in the first 31 m, and after a stable tendency down to 80 m, it starts to increase once again. The value of humidity decreases showing a clear linear trend with depth.
••••
Figure 3 - Dry Density, Specific Weight of Solid Particles and Moisture Content.
As it can be observed in the Casagrande plasticity chart (Figure 4) the marls correspond to clay and silts with high plasticity, located parallel to line A of the chart. Any apparent trend with depth can be derived.
Figure 4 - Plasticity Chart.

� Santiago Chile, November 2009 Slope Stability
In most of the tests the natural water content is lower than the humidity of the plastic limit, as correspond to relatively high stiff soils.
Table I resumes the main physical parameters.
Rock strengthThe UCS values constitute a base parameter to determine the shear cohesion and friction angle to be used for the stability analysis
of the pit. The number of tests carried out prior to the excavation is 122 while 106 more have been done while the pit excavation progressed.
Figure 5 shows the evolution in depth of the UCS values. The main following conclusions can be derived:
SECTION DEPTH (m)
SPECIFIC WEIGHTOF SOLID
PARTICLES(t/m3)
DRY DENSITY(t/m3)
MOISTURE CONTENT(%)
PLASTICITY INDEX(%)
MET-1 0-10 2,714 1,415 30,3 34,3
MET-2 10-23 2,714 1,459 28,5 30,2
MET-3 23-31 2,714 1,496 27,1 30,8
LEVEL-1 31-80 2,714 1,528 25,5 38,1
LEVEL-2 80-110 2,714 1,585 24,2 39,1
LEVEL-3 110-115 2,714 1,579 24,2 38,5
LEVEL-4 115-130 2,714 1,620 23,1 37,0
SANDY MARLS 130-140 2,714 1,622 25,7 35,3
Table I - Main Physical Parameters for Each Section.
The values obtained at undisturbed borehole simples are lower than the one obtained from in situ sculpted samples.The scatter in the first 31 m is high. Nevertheless a trend increasing with depth can be observed. This same conclusion can be given for the section between 31 and 80 m depth.A clear tendency showing an increase of UCS with depth can be observed in the section between 80 and 150 m depth.The values of UCS after 115 m corresponds more to a soft rock than to hard soil.There is a notable correlation between UCS and carbonate content.
••
•••
Figure 5 - Uniaxial Compressive Strength
�Slope Stability Santiago Chile, November 2009
Evolution of stiffness with depthIn this section the discussion about deformability is demonstrated basically by means of soft dilatometer tests. The deformational parameters
(rock mass deformational modulus Em and Poisson constant ν) have been obtained by the data processing. The data base derives from 178 laboratory tests (using strain gauges) and 75 soft dilatometers measurements. All these tests were done prior and following the pit excavation.
The determination of the stiffness of the marls is of paramount importance for the stability analysis as these values determine the deformations in the ground and therefore if the marl is behaving with peak properties or with the residual ones.
Figure 6 shows the distribution of the values obtained in all those tests with depth.
Figure 6 - Evolution of Stiffness with Depth
The following conclusions are derived:The values measured at undisturbed borehole samples are lower than the values obtained at sculpted in situ samples. This phenomenon has
been also observed in relation with UCS tests.The values of deformability modulus obtained at soft dilatometers tests correlates in a very reasonable way with the values obtained at lab tests.
An almost negligible scale effect in these marls can be concluded.A clear tendency showing an increase of stiffness with depth can be observed.
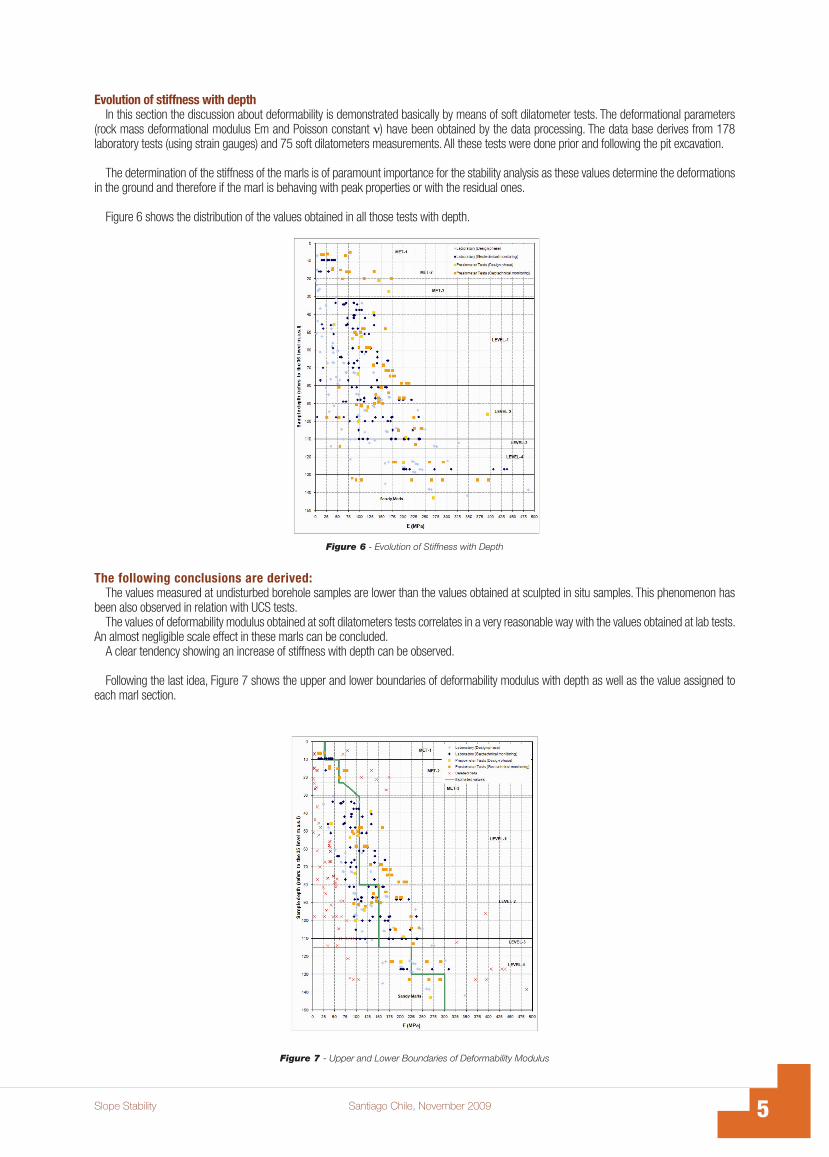
Following the last idea, Figure 7 shows the upper and lower boundaries of deformability modulus with depth as well as the value assigned to each marl section.
Figure 7 - Upper and Lower Boundaries of Deformability Modulus

� Santiago Chile, November 2009 Slope Stability
GEOMECHANICAL SECTORIZATION OF MARLS WITH DEPTH
Apparently the marls seem to be homogeneous but a detailed analysis as the one performed allow distinguishing with depth sections with different behaviour under the mechanical point of view. According with the data included in this paper, the following levels can be established:
a) WEATHERED MARLS: at surface very affected by weathering called MET. Initially two levels were distinguished but finally three sections have been established during its excavation:
MET-1, highly weathered. Brownish coloured. It has 10 m of thickness.MET-2, down to 23 m depth. The marl is heavily weathered and presents vertical desiccation fractures spaced around one meter.MET-3, down to 31 m depth. The marl is moderately weathered. The spacing of desiccation discontinuities is around a dozen of meters. The strength parameters of this level are similar to MET-2 level.
b) FRESH MARLS: After 31 m depth there is no visible signs of weathering showing its typical grey bluish colour. The following four levels can be distinguished:
LEVEL1, “soft marl”, it goes from 31 to 80 m depth. There are no desiccation fractures but several sub-vertical joint sets can be observed as well as horizontal bedding planes spaced 5 m.LEVEL2, “medium marl” it goes down to 110 m. Its strength is characteristic of a soft rock type 0 to 0-1, showing fragile failures.LEVEL3, “soft marl”, it presents the same characteristics of level 1 with a thickness raging from 5 to 10 m. Laterally it disappears between levels 2 and 3 showing strength and deformability properties similar to level above.LEVEL4, “strong marl”. It has a strength characteristic of a soft rock type 0-1. There is an appreciable increase of the strength and stiffness of the marl.
SANDY MARL, just above the sands of the “Niebla-Posadas” aquifer there is a massive layer of sandy marls with an approximate thickness of 5 m.
Figure 8 summarizes all the geotechnical levels that can be observed in the tertiary formation.
COMPARISON BETWEEN THE RESULTS FROM BOREHOLES SAMPLES AND THE OBTAINED FROM IN SITU SAMPLES
At this stage the comparison between the results obtained from lab tests over boreholes samples and the results obtained from samples sculpted during the pit excavation is shown. A discussion about the alterability of undisturbed samples is done as the real strength is higher than the strength obtained from sampling.
As it has been clearly remarked the tests performed on the undisturbed borehole samples showed a lower density and a higher humidity than the values obtained in the tests carried out on samples sculpted manually in situ during the excavation progress.
This fact demonstrates that in this type of relatively soft marls it is not possible to obtain real undisturbed samples. The same phenomenon is observed no matter what type of sampling technique is used at the borehole (Californian, Shelby, etc).
•••
•
••
•
•
Figure 8 - Lithological Schematic Section

�Slope Stability Santiago Chile, November 2009
As a consequence the values obtained in the test done over these boreholes samples provide values of Uniaxial Compressive Strength and Deformability Modulus that are clearly smaller than the ones obtained using samples sculpted in situ and carefully transported to the lab facilities.
There are several factors that affect the alterability of the samples including compressive and shear strains at the sample.
POST FAILURE BEHAVIOUR
The observed strain-softening behaviour of these marls is discussed and the results of sophisticated lab tests measuring the post failure behaviour of samples are included.
According with this progressive failure of marls, a strain-softening constitutive model has been used to obtain marls strength parameters. In this model it is possible to define the cohesion, friction angle and dilation as piecewise-linear functions of softening parameters measuring the plastic shear strain.
This model has been based on the results obtained from 118 tests carried out under constant strain velocity and measuring post failure behaviour of the marl.
Figures 9a, 9b, 9c and 9d, show the results of these tests as well as the average strain-softening model adopted in each case.
Figure 9 - Uniaxial Compressive Strength Test Measuring Post-failure behaviour.
It can be observed that a great deal of scatter is observed in the results of these tests especially in the ones corresponding to the weathered level (MET). This layer shows the most ductile behaviour, with a relatively high deformability and the smaller difference between the peak and the residual strength.
The Level 1 and 2 have a very similar response while Level 3 behaves in a more fragile way showing a higher stiffness and the highest difference between the peak and the residual strength.
Table II resumes the main values obtained from these test for each geotechnical section considered.

� Santiago Chile, November 2009 Slope Stability
SECTIONDEPTH
(m)FAILURE STRAIN
EP (%)
RESIDUAL STRAIN E
R (%)
RESIDUAL/PEAk STRENGHT
(%)Nº OF TESTS
MET 0-31 3,5 4,7 23 12
LEVEL-1 31-80 2,2 3,2 14 47
LEVEL-2 80-110 2,1 3,0 18 50
LEVEL-4 115-130 1,6 2,1 7 9
Table II - Main Values Obtained from Tests Measuring Post-failure Behaviour.
Statistical analysis to determine cohesion and friction angle at each geotechnical level was carried out using 178 uniaxial compressive tests measuring post peak behaviour, 122 shear tests and 112 triaxial consolidated and undrained tests.
The main advantage of the statistical approach used in the strength evaluation parameters lies in the possibility to obtain a non lineal failure envelope as a function of the principal stresses at failure (maximum principal stress σ’
1 and minimum principal stress σ’
3), and also
in function of the shear stresses at failure (shear strength τ’ and cohesion c’).
The failure constitutive model applied to these marls has been the non linear Hoek-Brown criterion (Hoek et al, 2002). As it is well known the failure envelope considered in this model in the plane σ
n-τ is defined as a function of m, s and σc.
Once the curve is fitted it is possible to make at a determine stress σn, a linear adjustment obtaining “instantaneous” pairs of values of the cohesion c and friction angle Φ.
The uniaxial compressive strength, triaxial compressive strength and Brazilian tests provide, each one, a value of σ1 and σ
3 that can be
directly represented at the plane σ1 - σ
3. But the shear test carried out at a shear box provided pairs of values ( τ,σ
n ) that can be directly
represented in the plane σn-τ but not in the plane σ
1 - σ
3.
In order to provide a complete statistical analysis using the results of all the types of tests it is necessary to homogenize the stress planes making the stress equivalence between the planes σ
n-τ y σ
1-σ
3 given by the expressions:
(1)
(2)
As it can be observed the relation between both stress definitions cannot be done directly and depends on the tangent of the non linear failure curve for a given stress (it depends on the value of Φi related with m).
To solve this equivalence (σ1’,σ
3’) an algorithm has been developed making it possible to calculate the values of Φi, h y τ for each trio
(m, s, σc). Consequently the values corresponding to uniaxial/triaxial compressive tests and Brazilian tests are expressed as (σ
1 y σ
3), while
shear tests are represented as (σ1’ y σ
3’). Afterwards the algorithm minimizes the estimation error for the adjustment (m, s, σ
c), minimizing
the r2 distance between (σ1 y σ
3) and the Hoek-Brown failure envelope.
Once the best adjustment for the values of m, s and σc, are obtained from all the tests, the algorithm fits an average linear relationship to the Hoek-Brown curve at each given value of σ
n, estimating the cohesion and friction angle Φ of Mohr-Coulomb failure criterion at each
stress range.
Figure 10 shows an example of the statistical adjustment done for the geotechnical level 2 of the marls. As it can be observed that the algorithm provides the representation of the tests in both planes σ
n–τ and σ
1 y σ
3 in relation with t he Hoek-Brown failure criterion curve
and the evolution of the cohesion and friction angle as a function of the stress range.

�Slope Stability Santiago Chile, November 2009
Finally in Table III it is presented the rock mass parameters recommended for each geotechnical level of the marls for making stability analysis of the pit slopes.
SECTIONDEPTH
(m)σ
CI
(kp/cm2)m s
c (kp/cm2)
Φ (º)R2
(σ1-σ
3)
R2
(σN–τ)
Nº UCS
Nº TRIAXIAL
C T
Nº SHEAR T
MET-1 0-10 3,5 2 1 1,10 22 0,91 0,80 4 0 9
MET-2 10-23 3,8 4 1 1,50 21 0,21 0,73 7 5 18
MET-3 23-31 3,8 4 0,07 1,50 21 0,49 0,51 11 11 6
LEVEL-1 31-80 4,0 6 0,05 2,1 20 0,61 0,65 73 83 126
LEVEL-2 80-110 4,0 6 0,05 2,7 18 0,81 0,74 0 23 129
LEVEL-4 115-130 6,0 6 0,01 2,8 18 - 0,87 0 0 48
Table III - Value of Cohesion and Friction Angle for Each Geotechnical Level and Stress Range
CONCLUSIONS
This paper describes the lab and in situ site characterization works performed at Cobre Las Cruces during the prestripping phase.
The soft marl formation is a very complicated material to be characterized as it ranges between a soft rock and a hard soil with evidence of discontinuities and bedding planes.
It can be clearly observed with depth, the evolution of the strength and deformability. As a consequence at least five different horizons can be distinguished in the marls.
An intensive tests programme was done prior to the excavation as well as a complete test programme during the pit excavation progress. The comparison between the results obtained from lab tests over undisturbed boreholes samples and the results obtained from samples sculpted during the pit excavation, evidences the alterability of undisturbed samples, as the real strength and stiffness are higher than the ones derived from sampling.
These marls present a strain-softening behaviour that has been quantified by means of lab tests measuring the post failure behaviour of samples. According with this progressive failure of marls, a strain-softening constitutive model has been used to obtain marls strength parameters.
Finally, a statistical analysis to determine cohesion and friction angle of each geotechnical horizon at each stress range has been done. The main advantage of this statistical approach used in the strength evaluation parameters lies in the possibility to obtain a non lineal failure envelope as a function of the principal stresses at failure (maximum principal stress σ’
1 and minimum principal stress σ’
ww) taking
into account also the shear tests.
Figure 10 - Statistical Adjustment by Hoek and Brown Criterion

�0 Santiago Chile, November 2009 Slope Stability
ACKNOWLEDGEMENTS
The authors wish to express their grateful thanks to all the technical staff of Cobre Las Cruces that have participate in this job prior and during the pit excavation.
Also thanks are given to the Management Staff of the Company for the permission to publish this contribution.
REFERENCES
1. J.A Botín, P. Ramírez Oyanguren, Mecanismo de rotura del depósito de estériles de la mina de Aznalcóllar, Industria y Minería, Madrid, Spain, 1999.
2. M. Tsige, Microfábrica y mineralogía de las arcillas azules del Guadalquivir y su relación con las propiedades geotécnicas, Monografía 67, Ministerio de Fomento, CEDEX; Madrid, Spain, 1999.
3. M. Tsige, L. González de Vallejo, M. Doval, C. Oteo, and C. Barba, “Microfabric of Guadalquivir blue marls and its engineering geological significance”, Int. Assoc. of Engineering Geology, 1995.
4. F. Ayala, “Engineering Properties of the Guadalquivir river Marly Clays in Cordoba”, 3rd International Conference, International Association of Engineering Geology, Madrid, Spain, 1978, Vol 1, 117-122.
5. E. Hoek, C. Carranza-Torres, and B. Corkum, “Hoek-Brown failure criterion – 2002 Edition”, Proc. 5th North American Rock Mechanics Symposium, Toronto, Canada, 2002, 267-273.
6. C. Oteo, “Las margas azules del Guadalquivir y la inestabilidad de taludes. Rutas”, Revista de la asociación técnica de carreteras, Nº 77, March-April 2000, 17-27.