Embed Size (px)
Citation preview
LECTURE 17
ENGR 151
Materials of Engineering

STEEL CLASSIFICATION
Four-digit number
First two digits indicate alloy content (Ni, Cr)
Last two digits give carbon concentration
1060 (plain carbon steel containing 0.60 wt%
C)

STEEL CLASSIFICATION
HARDENABILITY (HEAT TREATMENT OF STEELS)
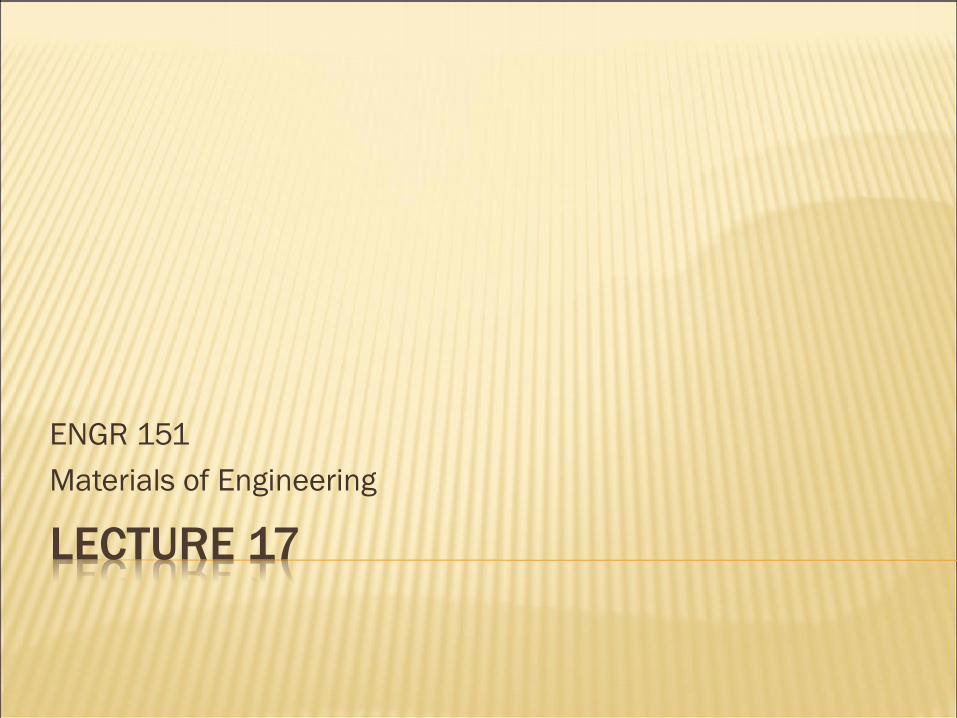
Martensite: A microconstituent (phase) formed when austenized iron-carbon alloys are rapidly cooled (or quenched) to a low temperature relative to ambient.
The ability of a steel alloy to be hardened by the formation of martensite as a result of a given heat treatment
Quenching: continuous rapid cooling of an austenized specimen (iron in austenite state) in a quenching medium such as water, oil or air
Impossible to cool specimen at a uniform rate throughout
Surface always cools faster than interior regions

HARDENABILITY (HEAT TREATMENT OF STEELS)
Hardenability: Term used to describe the ability of an alloy to be hardened by the formation of martensite as a result of a given heat treatment
Hardenability is NOT “hardness,” rather it is the qualitative measure of the rate at which hardness drops off with distance into the interior of the material due to decreased martensite content

HARDENABILITY (HEAT TREATMENT OF STEELS)
Jominy end-quench test:
Determines hardenability
Cylindrical specimen austenized at specified temp and time
Remove from furnace and mount on fixture
Lower end is quenched by jet of water to room temp
Rockwell Hardness test (hardness v. position)
HARDENABILITY CURVES
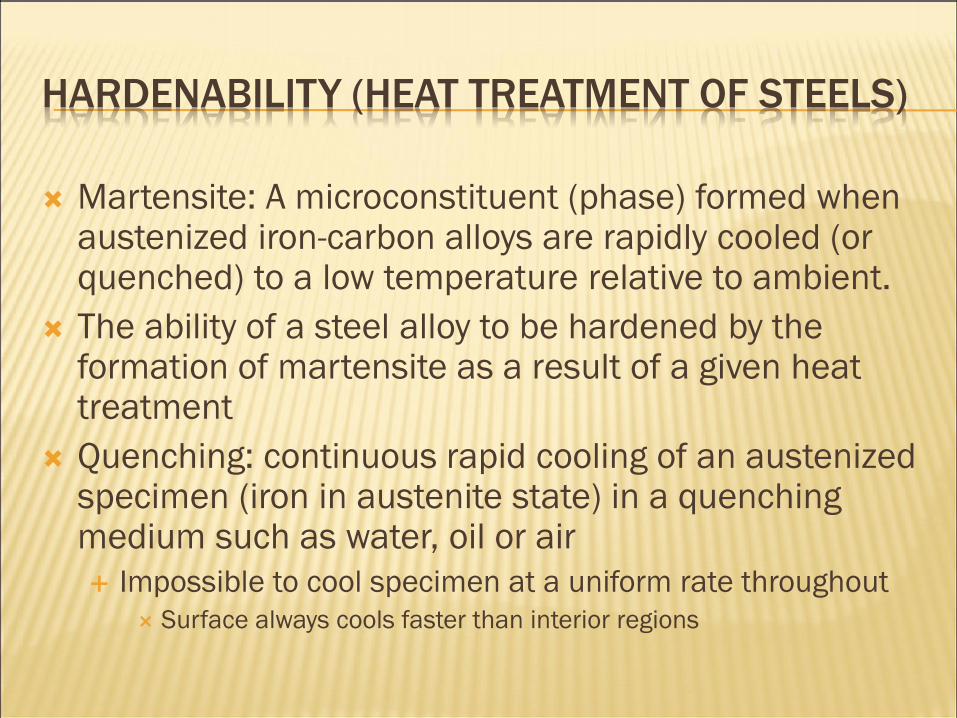
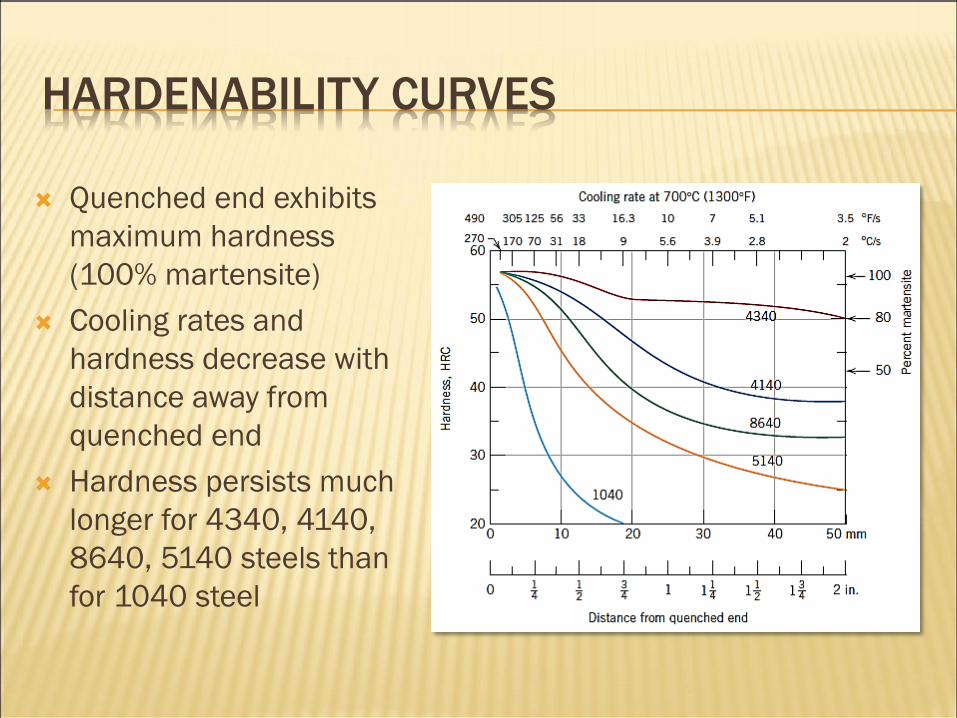
Quenched end exhibits
maximum hardness
(100% martensite)
Cooling rates and
hardness decrease with
distance away from
quenched end
Hardness persists much
longer for 4340, 4140,
8640, 5140 steels than
for 1040 steel

SEVERITY OF QUENCH
Term associated with rate of cooling
The more rapid the quench, the more severe the quench
Water (most severe), oil, air
High-carbon steels cannot stand water quench (warping & cracking)
Air quench preferred (pearlitic structure)
Increasing velocity of medium across specimen surface enhances effectiveness of quench

QUENCH RATE
During quenching, heat must be transported from within material to surface to be dissipated into quenching medium
Cooling rate within an throughout interior of a steel varies with position and depends on geometry and size
Cooling rates are greater for locations within specimen closer to the surface
Cooling rate is decreased for oil quench
Smaller the diameter of specimen, higher the quenching rate
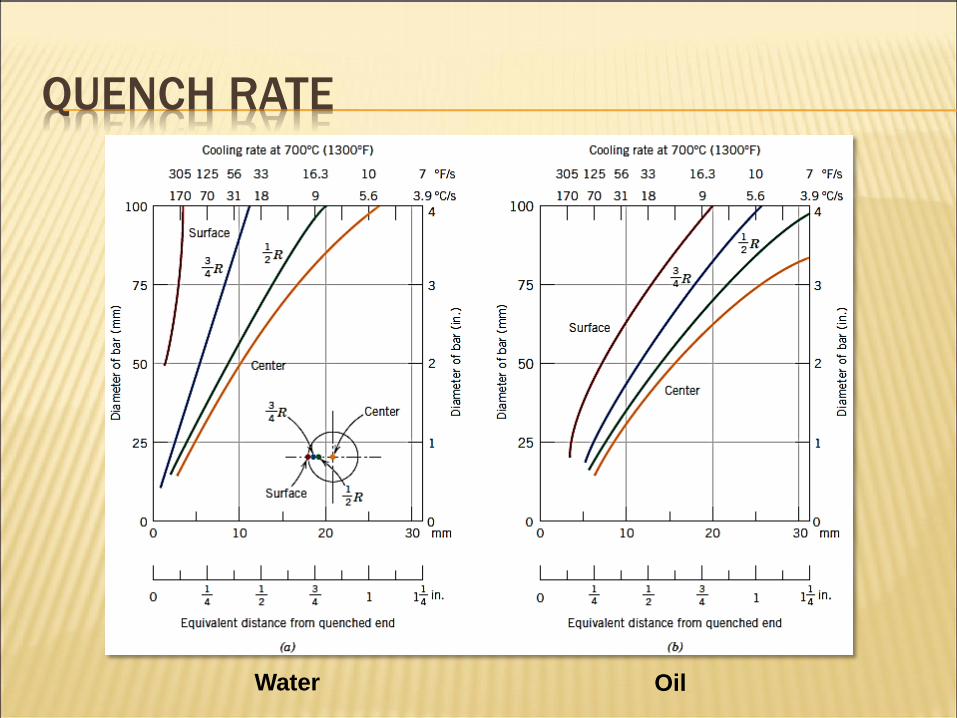
QUENCH RATE
Water Oil
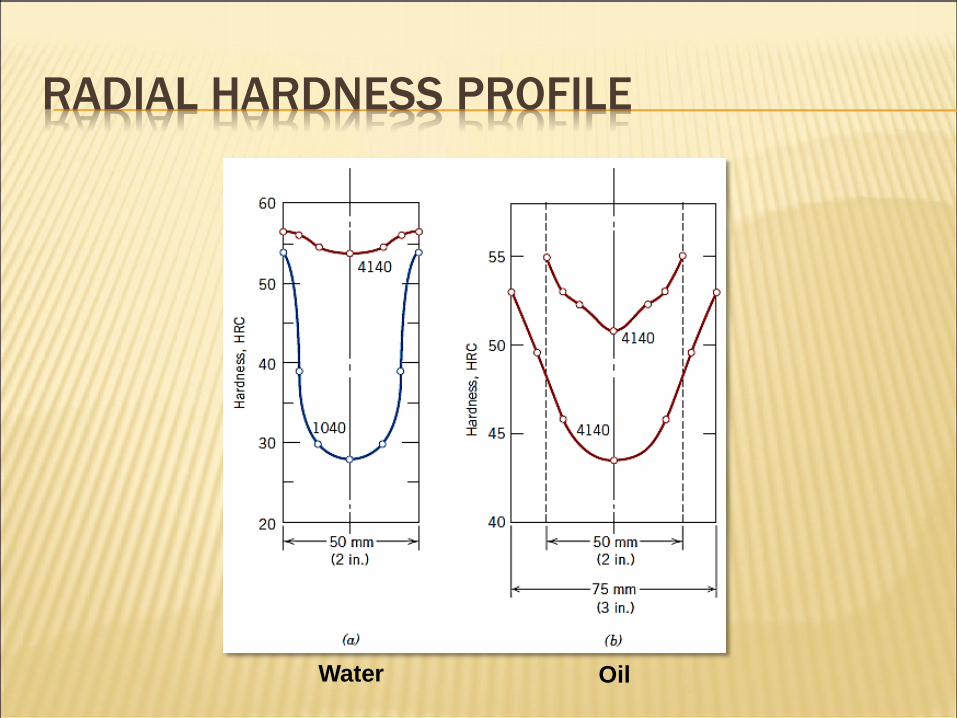
RADIAL HARDNESS PROFILE
Water Oil
SPECIMEN SHAPE
Rate of cooling for a particular quenching
method depends on ratio of surface area to
mass of specimen
Larger surface area provides greater contact with
quenching medium
Larger the ratio = more rapid cooling rate = greater
hardening effect
Edges and corners increase ratio
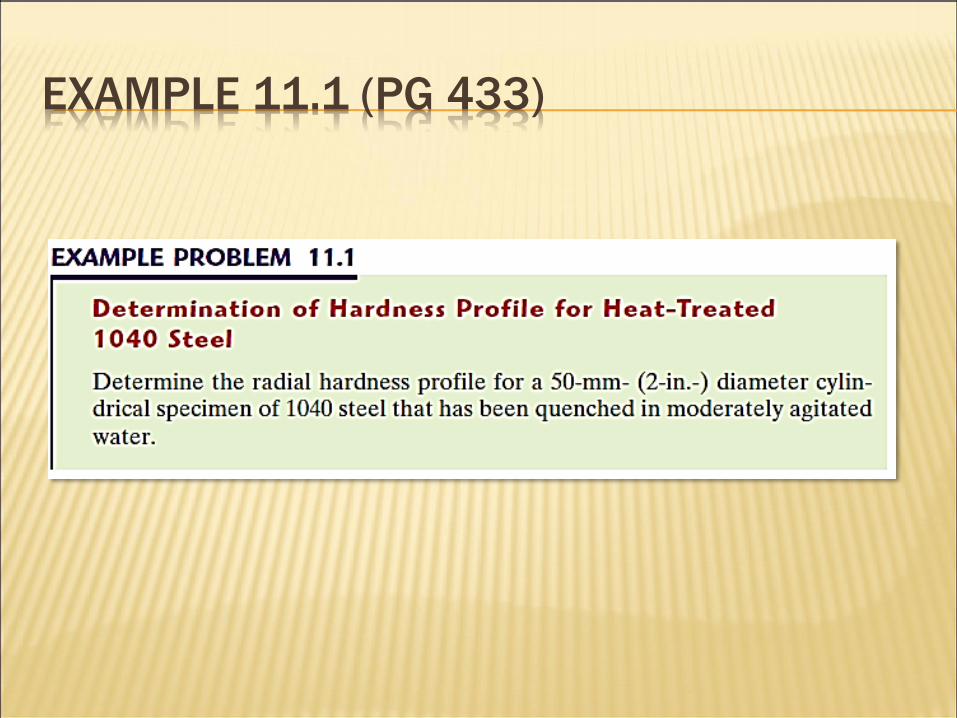
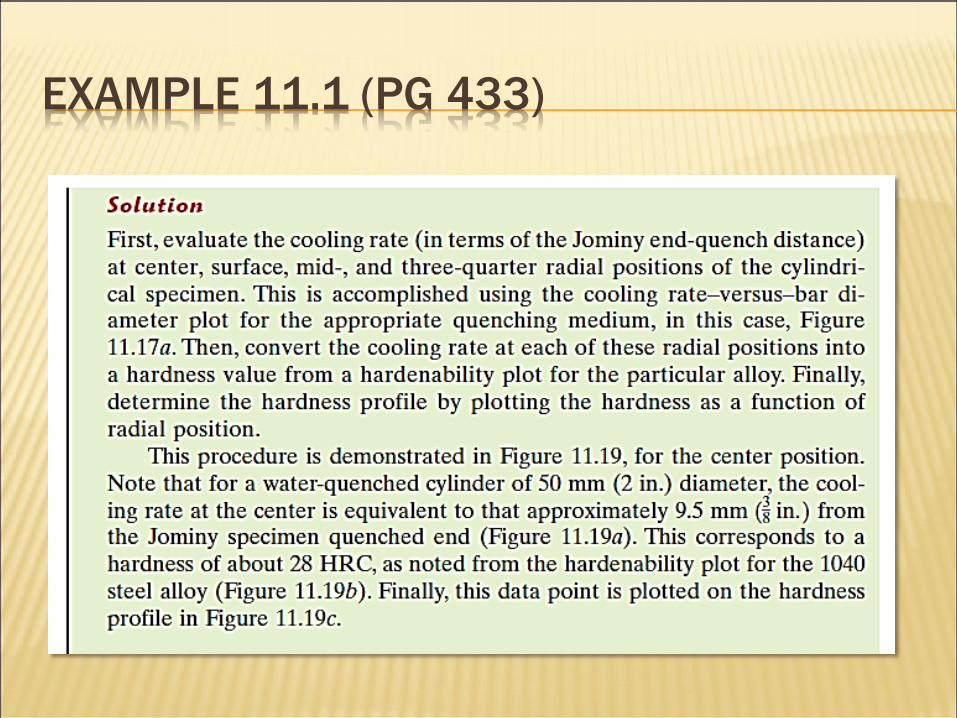
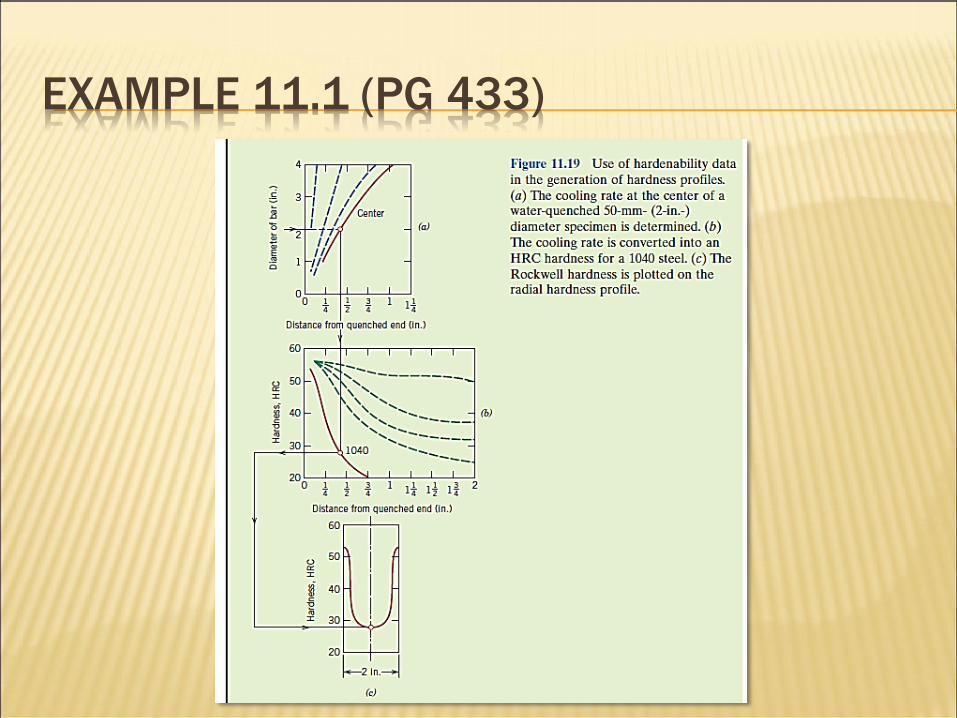
EXAMPLE 11.1 (PG 433)
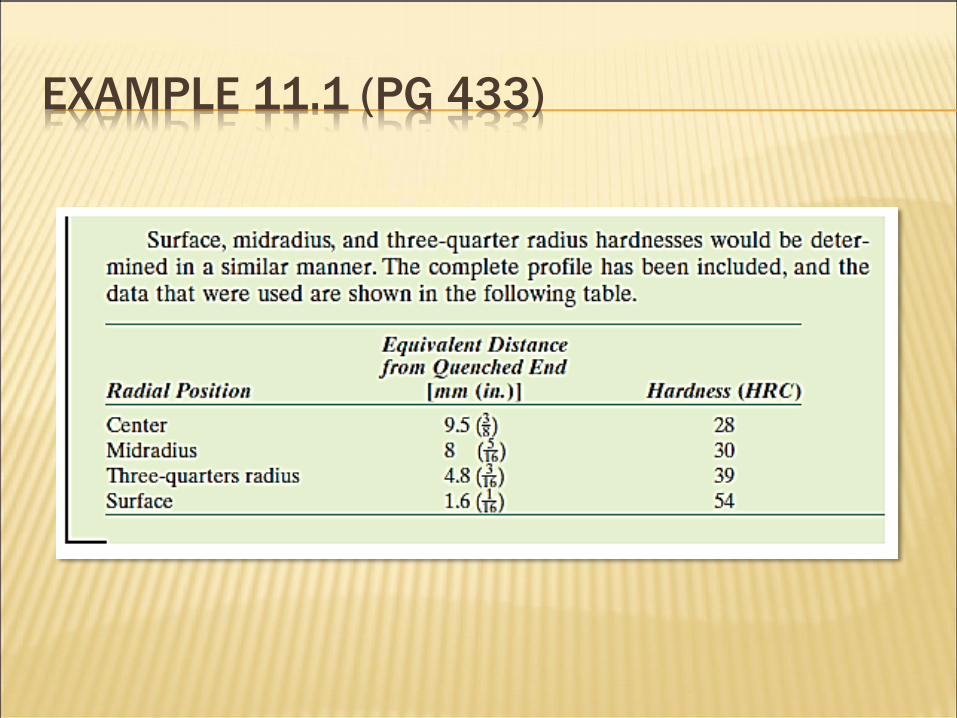
EXAMPLE 11.1 (PG 433)
EXAMPLE 11.1 (PG 433)
EXAMPLE 11.1 (PG 433)
PRECIPITATION HARDENING
Precipitation hardening: Enhance hardness of
metal alloys by forming small uniformly
dispersed particles of a second phase within
the original phase matrix
Examples: Al-Cu, Cu-Be, Cu-Sn, Mg-Al
(hardened by precipitation)

TYPES OF PRECIPITATION HARDENING
Heat Treatments:
Requirements within
phase diagram:
Require a maximum
solubility of one component
within the other (several
percent)
Solubility limit that rapidly
decreases in concentration
of major component with
temperature reduction
Example: both conditions
satisfied (point M & N)

OTHER REQUIREMENTS
Solution Heat Treating:
Solute atoms are dissolved
to form a single-phase solid
solution
Example:
Heat to To at Co (all β
dissolves) – no structure to β
Cool rapidly to T1 (prevents β
from forming)
Diffusion rates at T1 are slow
(retains alpha phase for long
period of time)
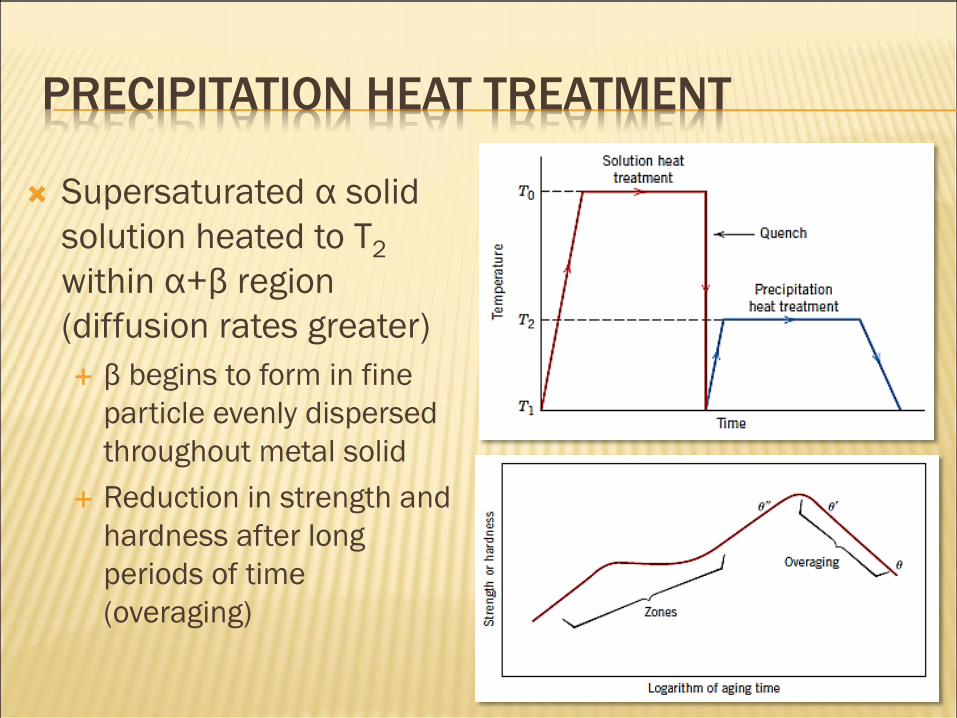
PRECIPITATION HEAT TREATMENT
Supersaturated α solid
solution heated to T2
within α+β region
(diffusion rates greater)
β begins to form in fine
particle evenly dispersed
throughout metal solid
Reduction in strength and
hardness after long
periods of time
(overaging)

MECHANISM OF HARDENING
Precipitation hardening: used with high
strength aluminum alloys (Cu-Al)
96 wt% Al-4 wt% Cu:
Copper atom clusters or “zones” form in small, thin discs
throughout α (1-2 atoms thick, 25 atoms in diameter)
Clusters are not particles since they are so small
Zones pass through two transition phases
Zones become particles as they increase in size

CU-AL PHASE DIAGRAM

CU-AL PHASE DIAGRAM
Desired phase is θ” (overaging associated with
θ’ and θ phases)
Notice the stronger tension bonds created by θ”
presence

CU-AL PHASE DIAGRAM
Notice changes
in yield strength
and ductility
with duration of
heat treatment
25
CHAPTER 12: STRUCTURES & PROPERTIES OF
CERAMICS
ISSUES TO ADDRESS...
• How do the crystal structures of ceramic materials
differ from those for metals?
• How do point defects in ceramics differ from those
defects found in metals?
• How are impurities accommodated in the ceramic lattice?
• How are the mechanical properties of ceramics
measured, and how do they differ from those for metals?
• In what ways are ceramic phase diagrams different from
phase diagrams for metals?

26
• Bonding: -- Can be ionic and/or covalent in character.
-- % ionic character increases with difference in
electronegativity of atoms.
• Degree of ionic character may be large or small:
ATOMIC BONDING IN CERAMICS
SiC: small
CaF2: large

27
CERAMIC CRYSTAL STRUCTURES
Cation – positively charged metal ion
Anion – negatively charged ion – oxide,
halide, etc.
Crystal as a whole must be electrically neutral
Positive and negative charges balanced out
Oxide structures oxygen anions larger than metal cations
Oxygen anions have accepted electrons, metal cations
have given up electrons
close packed oxygen in a lattice (usually FCC)
cations fit into interstitial sites among oxygen ions

28
FACTORS THAT DETERMINE CRYSTAL
STRUCTURE 1. Relative sizes of ions – Formation of stable structures: --maximize the # of oppositely charged ion neighbors.
Adapted from Fig. 12.1,
Callister & Rethwisch 9e.
- -
- - +
unstable
- -
- - +
stable
- -
- - +
stable
2. Maintenance of
Charge Neutrality : --Net charge in ceramic
should be zero.
--Reflected in chemical
formula:
CaF 2 : Ca 2+
cation
F -
F -
anions +
A m X p
m, p values to achieve
charge neutrality
• Cations
touching
anions give
stability
29
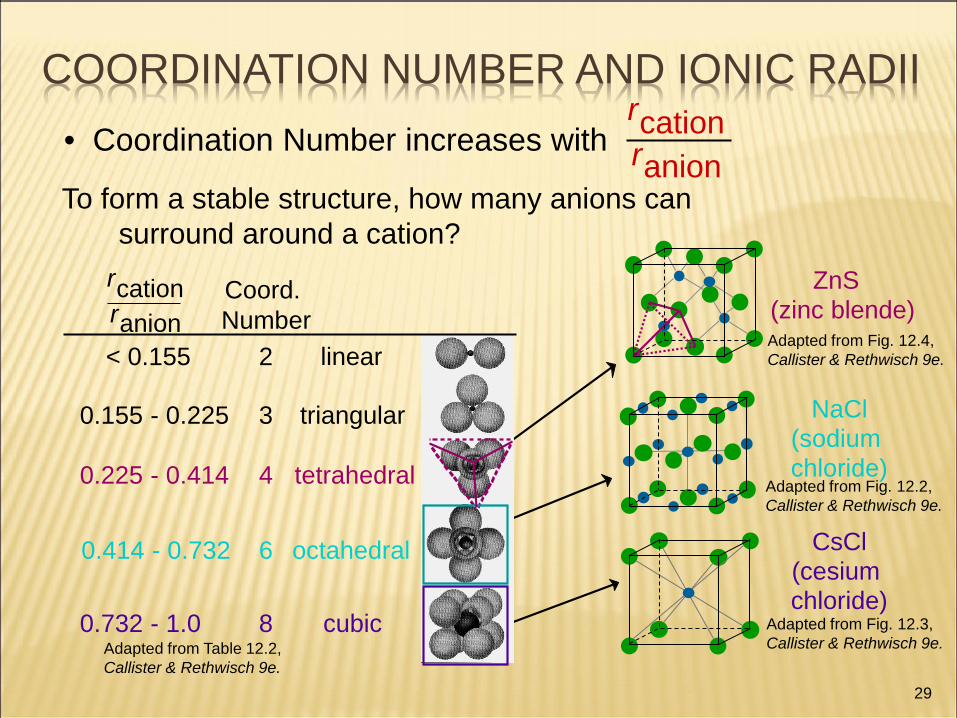
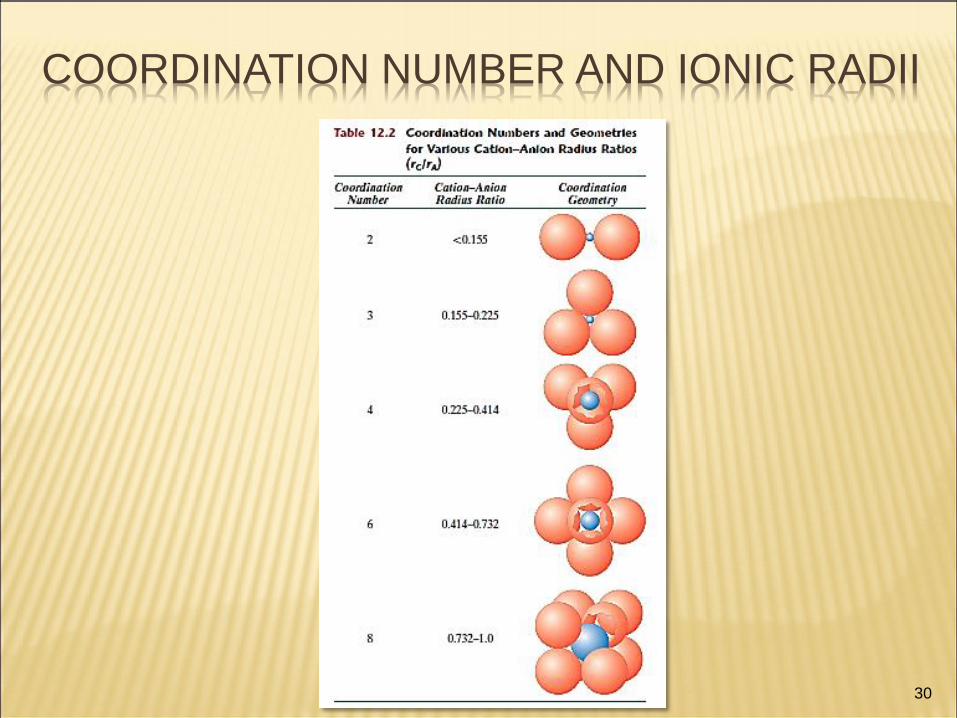
• Coordination Number increases with
COORDINATION NUMBER AND IONIC RADII
Adapted from Table 12.2,
Callister & Rethwisch 9e.
2
r cation r anion
Coord.
Number
< 0.155
0.155 - 0.225
0.225 - 0.414
0.414 - 0.732
0.732 - 1.0
3
4
6
8
linear
triangular
tetrahedral
octahedral
cubic
Adapted from Fig. 12.2,
Callister & Rethwisch 9e.
Adapted from Fig. 12.3,
Callister & Rethwisch 9e.
Adapted from Fig. 12.4,
Callister & Rethwisch 9e.
ZnS
(zinc blende)
NaCl (sodium
chloride)
CsCl (cesium chloride)
r cation r anion
To form a stable structure, how many anions can
surround around a cation?
30
COORDINATION NUMBER AND IONIC RADII
31
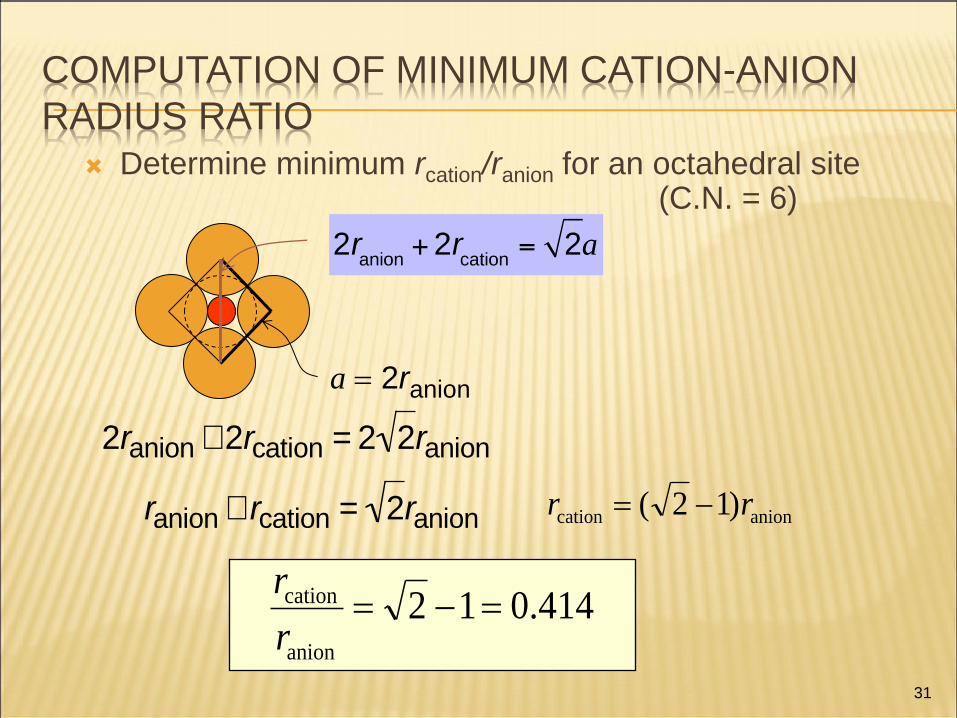
COMPUTATION OF MINIMUM CATION-ANION
RADIUS RATIO Determine minimum rcation/ranion for an octahedral site
(C.N. = 6)
a = 2ranion
2ranion + 2rcation = 2 2ranion
ranion + rcation = 2ranion anioncation )12( rr =
414.012anion
cation ==r
r
32
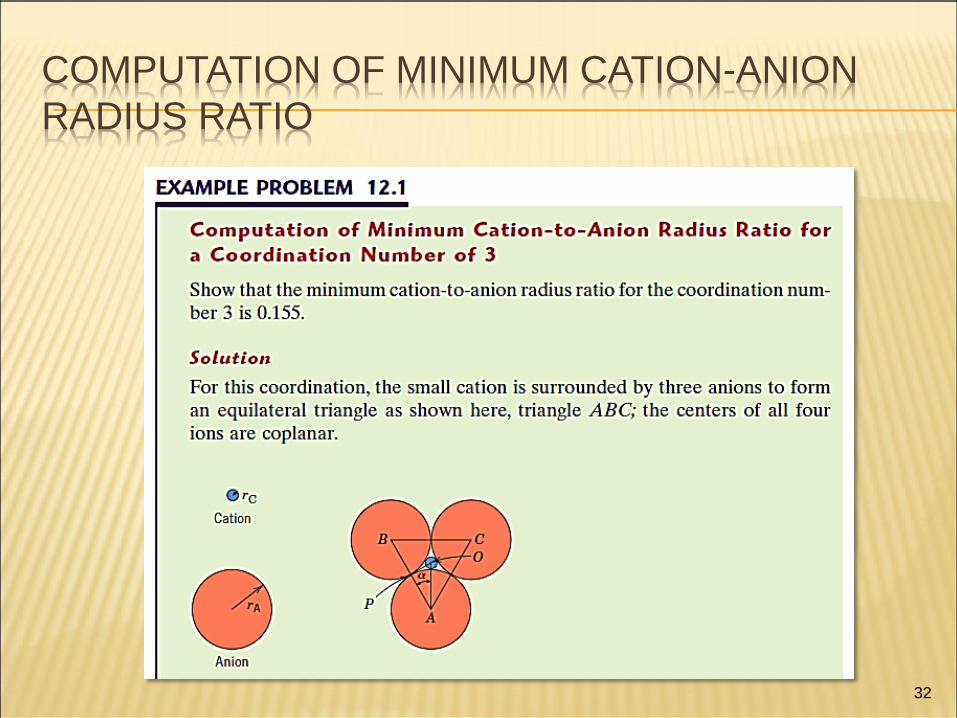
COMPUTATION OF MINIMUM CATION-ANION
RADIUS RATIO
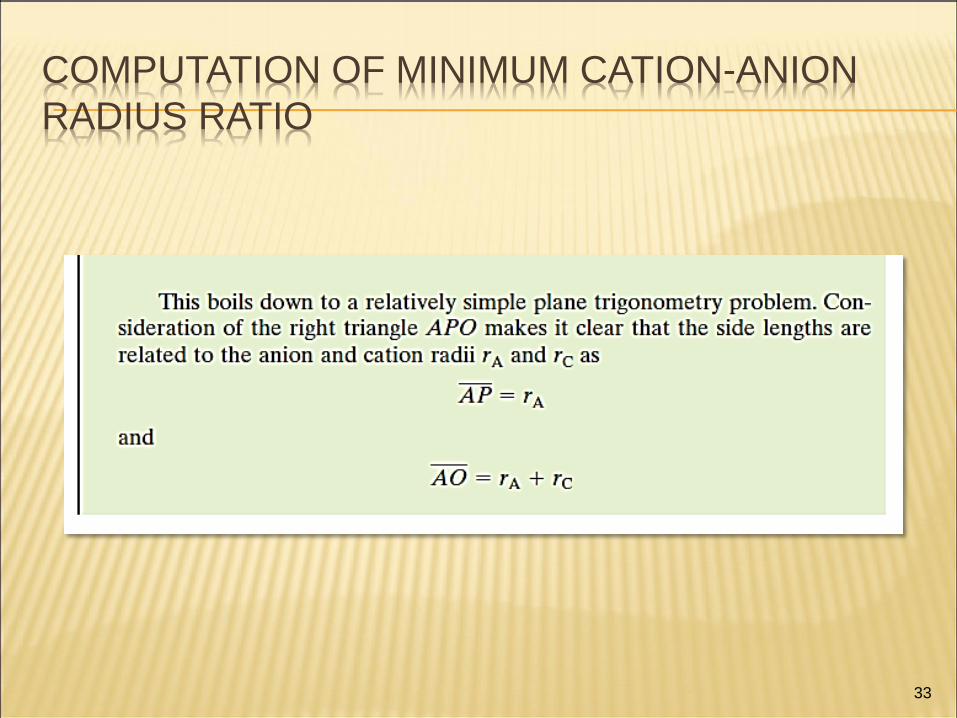
33
COMPUTATION OF MINIMUM CATION-ANION
RADIUS RATIO
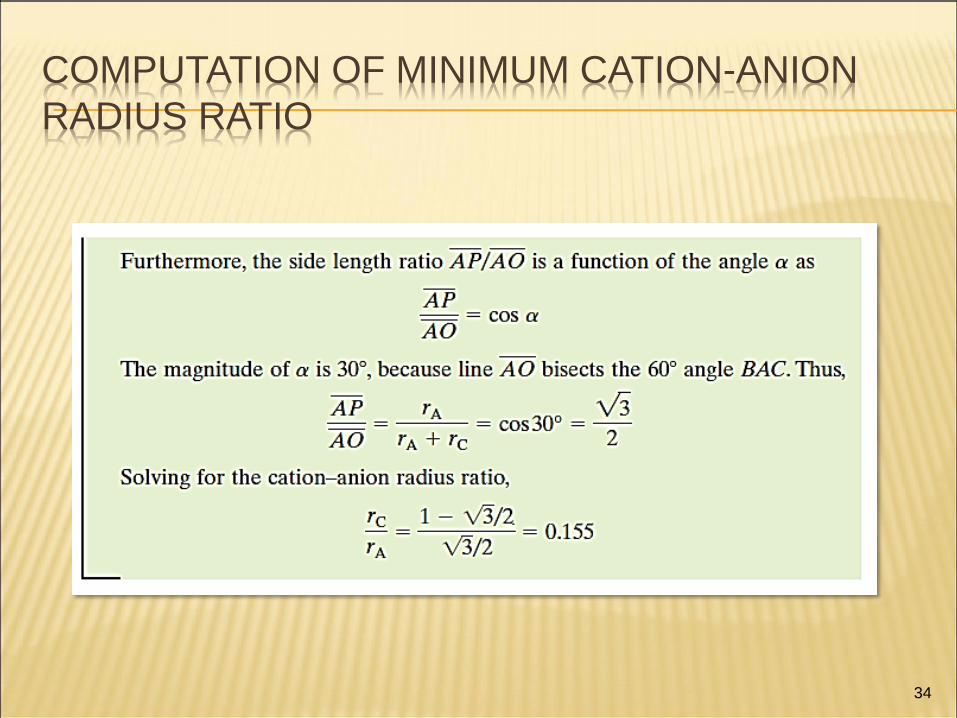
34
COMPUTATION OF MINIMUM CATION-ANION
RADIUS RATIO

HOMEWORK
HW (Due Monday, May 1st )
10.6, 10.8, 10.10, 11.28, 11.29