Embed Size (px)
Citation preview

TECHNICAL REPORT
PART I – SUMMATIVE ASSESSMENT
(AR, IA, LA, OH, NE, WA, WV)
English Language Proficiency Assessment for the 21st Century –
Listening, Reading, Speaking, and Writing
Grades K–12
Spring 2018 Administration
Submitted to: ELPA21
Submitted by: American Institutes for Research
1000 Thomas Jefferson Street, NW Washington, DC 20007
December, 2018

ELPA21 2017-18 Technical Report
i
Table of Contents Chapter 1. Introduction ........................................................................................ 1
Chapter 2. Test Administration ........................................................................... 4
Testing Window .................................................................................................................. 4
Summative Tests ................................................................................................................. 4
Test Administration Manual ............................................................................................. 6
Directions for Administration ..................................................................................... 6
Training/Practice Tests ................................................................................................ 6
Summative Tests ......................................................................................................... 7
Test Security ....................................................................................................................... 7
Chapter 3. Scoring................................................................................................. 8
Estimating Student Ability in Summative Assessment ................................................... 8
Theta to Scale Score Transformation ............................................................................... 8
Lowest/Highest Obtainable Scores ................................................................................... 8
Handscoring ........................................................................................................................ 8
Chapter 4. Standard Setting................................................................................. 9
Chapter 5. State Summary .................................................................................11
2018 Student Participation .............................................................................................. 12
5.2 2018 Student Scale Score and Performance Summary ................................................. 17
Chapter 6. Reliability ..........................................................................................24
Marginal Reliability and Conditional Standard Error of Measurement ................... 24
Marginal Standard Error of Measurement ................................................................... 26
Classification Accuracy and Consistency ....................................................................... 27
Chapter 7. Validity ..............................................................................................31
Evidence on Internal Structure ....................................................................................... 31
Dimensionality Analysis ................................................................................................... 32
Student Abilities vs. Test Difficulties .............................................................................. 32
Second Rater Analysis ..................................................................................................... 33
Chapter 8. Reporting ..........................................................................................34
Online Reporting System ................................................................................................. 34
Types of Online Score Reports ................................................................................. 35
Subgroup Report ........................................................................................................ 37
Paper Report ..................................................................................................................... 38
Chapter 9. Quality Control ................................................................................39
Quality Control in Test Configuration ........................................................................... 39

ELPA21 2017-2018 Technical Report
ii
Platform Review ........................................................................................................ 39
User Acceptance Testing and Final Review .............................................................. 39
Quality Assurance in Scoring .......................................................................................... 40
Quality Assurance in Online Data ............................................................................. 41
Quality Assurance in Handscoring ............................................................................ 41
Handscoring Quality Assurance Monitoring Reports ............................................... 43
Quality Control on Final Scores ................................................................................ 44
Quality Assurance in Reporting...................................................................................... 45
Online Report Quality Assurance .............................................................................. 45
Paper Report Quality Assurance ............................................................................... 45
References ...............................................................................................................47

ELPA21 2017-2018 Technical Report
iii
List of Tables Table 2.1 2018 ELPA21 Testing Windows ..................................................................................................... 4
Table 2.2 Number of Items and Score Points—Online Summative .............................................................. 5
Table 2.3 Number of Items and Score Points—Paper Summative ............................................................... 5
Table 2.4 Number of Items and Score Points—Braille Summative .............................................................. 5
Table 2.5 Number of Field Test Items and Score Points—Summative ......................................................... 5
Table 2.6 Number of Field Test Items Students Should Take-Online Summative ........................................ 6
Table 3.1 Scaling Constants on the Reporting Metric ................................................................................... 8
Table 4.1 ELPA21 Domain Cut Scores by Grade ............................................................................................ 9
Table 5.1 Student Participation in Each State ............................................................................................. 12
Table 5.2 Student Participation by Test Mode – Kindergarten and Grade 1 .............................................. 13
Table 5.2 Student Participation by Test Mode – Grades 2-12 .................................................................... 14
Table 5.3 Student Participation by Subgroups in Each Test ....................................................................... 15
Table 5.4 Scale Score Summary .................................................................................................................. 18
Table 5.5 Percentage of Students by Performance Level – Listening and Reading .................................... 19
Table 5.6 Percentage of Students by Performance Level – Speaking and Writing ..................................... 20
Table 5.7 Percentage of Students by Overall Proficiency Level .................................................................. 21
Table 8.1 Types of Online Score Reports by Level of Aggregation ............................................................. 34
Table 8.2 Types of Subgroups ..................................................................................................................... 37

ELPA21 2017-2018 Technical Report
iv
List of Figures Figure 5.1 Percentage of Students in Performance Levels ......................................................................... 22
Figure 5.2 Percentage of Students in Proficiency Levels ............................................................................ 23
Figure 6.1 Marginal Reliability by Test ........................................................................................................ 26
Figure 6.2 Ratio of Standard Error of Measurement Over Standard Deviation by Test ............................. 27
Figure 6.3 Domain Classification Accuracy ................................................................................................. 29
Figure 6.4 Domain Classification Consistency ............................................................................................. 30
Figure 7.1 Cronbach Alpha by Domain ....................................................................................................... 32
Figure 8.1 ORS Page for Online Reporting System User Guide ................................................................... 36

ELPA21 2017-2018 Technical Report
1
The English Language Proficiency Assessment for the 21st Century (ELPA21) is a testing program that multiple states participate in to support educators, member states, and members of the public as they adopt and implement the English Language Proficiency (ELP) Standards and college- and career-ready standards. The ELPA21 program, called Program below, provides an assessment system that measures growth based on the new ELP Standards and provides valuable information that informs instruction and facilitates academic English proficiency so that all English language learners (ELLs) leave high school prepared for college and career success. The assessment includes tests on listening, reading, speaking, and writing for students in kindergarten, grade 1, grades 2–3, grades 4–5, grades 6–8, and grades 9–12.
The Program conducted test development and item development for the summative ELL assessment, as part of a U.S. Department of Education grant, commencing in 2013 and running through the first operational administration of the assessment in 2016. As part of the development process, Questar Assessment Inc. built multiple fixed-length forms for each test. Items were field-tested in spring 2015 with the Center for Research on Evaluation, Standards, and Student Testing (CRESST)—the program’s psychometrics partner—conducting analysis of item performance and data reviews. The first operational administration was implemented in spring 2016, and again, CRESST further analyzed items, conducted item data review meetings, and finalized item parameters. Pacific Metrics, the organization contracted for standard setting, held a standard-setting workshop in July 2016. Based on recommendations from the workshop, the Program made decisions with respect to domain cut scores that further translated into performance levels for each grade. After the 2017 administration, CRESST calibrated the items field tested in 2017. Based on the finalized item parameters for scoring provided by CRESST and the cut scores decisions from the Program, AIR scored and reported the testing results.
Details about test development, item development, field-test form building, item data review, item calibration, and standard setting can be found in their respective reports provided by the Program or the respective supporting vendors.
In addition to the summative assessment, in 2018, the Program also developed ELPA21 Screener. The purpose of the screener is to identify students who require English Language Development instructions. It is an assessment of a student’s language proficiency in the required domains of Listening, Reading, Writing, and Speaking. The test questions are based on the same English Language Proficiency (ELP) Standards adopted by the ELPA21 member states.
This technical report focuses on the 2018 test administration, test form reliability and validity, scoring, reporting, and quality control applied for Arkansas, Iowa, Louisiana, Nebraska, Ohio, Washington, West Virginia. This technical report has three parts. Part I includes chapters that delineate different aspects of the 2018 administration for the summative assessment:
• Chapter 1. Introduction
• Chapter 2. Test Administration
• Chapter 3. Scoring
ELPA21 2017-2018 Technical Report
2
• Chapter 4. Standard Setting
• Chapter 5. State Summary
• Chapter 6. Reliability
• Chapter 7. Validity
• Chapter 8. Reporting
• Chapter 9. Quality Control
Part II includes chapters that delineate different aspects of the 2018 administration for the screener assessment:
• Chapter 1. Introduction
• Chapter 2. Test Administration
• Chapter 3. 2018 Summary
• Chapter 4. Reliability
• Chapter 5. Validity
• Chapter 6. Reporting
Part III contains appendices about the 2018 summary for each of the seven states as listed below. The pooled analysis is based on data from all the seven states. The other appendices used data from the state.
• Appendix for Pooled Analysis – 2018 Summary
• Appendix for Arkansas – 2018 Summary
• Appendix for Iowa – 2018 Summary
• Appendix for Louisiana – 2018 Summary
• Appendix for Nebraska – 2018 Summary
• Appendix for Ohio – 2018 Summary
• Appendix for Washington – 2018 Summary
• Appendix for West Virginia – 2018 Summary
Each appendix involves the following sections. Because Louisiana, Iowa, and Ohio did not participate in screener tests, Part III for each of those two states does not include Sections 13 through 20.
• Section 1. Summative Assessment – Accommodation Summary

ELPA21 2017-2018 Technical Report
3
• Section 2. Summative Assessment – Student Participation
• Section 3. Summative Assessment – Scale Score Summary
• Section 4. Summative Assessment – Percentage of Students by Domain Performance Level
• Section 5. Summative Assessment – Percentage of Students by Overall Proficiency Level
• Section 6. Summative Assessment – Marginal Reliability
• Section 7. Summative Assessment – Conditional Standard Error of Measurement
• Section 8. Summative Assessment – Classification Accuracy and Consistency
• Section 9. Summative Assessment – Cronbach Alpha
• Section 10. Summative Assessment – Dimensionality
• Section 11. Summative Assessment – Ability vs. Difficulty
• Section 12. Summative Assessment – Mockups for Reporting
• Section 13. Screener Assessment – Student Participation
• Section 14. Screener Assessment – Scale Score Summary
• Section 15. Screener Assessment – Percentage of Students by Domain Performance Level
• Section 16 Screener Assessment – Percentage of Students by Overall Proficiency Level
• Section 17. Screener Assessment – Marginal Reliability
• Section 18. Screener Assessment – Conditional Standard Error of Measurement
• Section 19. Screener Assessment – Classification Accuracy and Consistency
• Section 20. Correlations Between Summative and Screener Scores by Domain
• Section 21. Student Progress by Performance Level from Screener to Summative
• Section 22. Screener Assessment – Mockups for Reporting
As methoed above, only summative assessment is discussed in this document.

ELPA21 2017-2018 Technical Report
4
The 2018 ELPA assessments included summative tests and screener tests. The ELPA21 screener test is used to identify students who require English Language Development instruction. Each of the summative and screener tests were administered to students in kindergarten, grade 1, grades 2–3, grades 4–5, grades 6–8, and grades 9–12. The tests for kindergarten and grade 1 were grade specific. The tests for grades 2 and above were grade-band tests. Both tests are not timed.
Each form of both assessments involves four domains tests. Students could be exempted from one or more domain tests.
TESTING WINDOW
The 2017–2018 testing windows for the seven states are shown in Table 2.1. Iowa and Louisiana did not adopt screener tests in 2018.
Table 2.1 2018 ELPA21 Testing Windows
State Summative Screener
AR 1/29/18 – 3/9/18 8/1/17 – 6/30/18
IA 2/13/18 – 4/13/18 N/A
LA 2/5/18 – 3/16/18 N/A
NE 2/5/18 – 3/16/18 8/1/17 – 6/30/17
OH 2/5/18 – 3/30/18 N/A
OR 1/9/18 – 4/13/18 N/A
WA 2/1/18 – 3/30/18 8/1/17 – 6/30/18
WV 2/13/18 – 3/23/18 3/6/18 – 6/30/18
SUMMATIVE TESTS
The 2018 summative assessment includes three online forms, one paper form, and one braille form for each of the 2018 summative tests. The three online forms have the identical operational items for scoring; however, the item sequences are different. Each form had separate tests for the 4 language domains. In addition to operational items, students were also required to take field test items, which were randomly selected from the field test pool and embedded in the middle of the form. The paper and braille forms did not contain field test items.
Tables 2.2–2.4 list the number of operational items and score points in each online, paper-pencil, and braille form. The tables show that listening and reading have comparable numbers of items in each test. Writing and speaking have fewer but comparable numbers of items in each test. Table 2.5 lists the number of items field tested in each domain test. Table 2.6 shows the number of field test items a student could take by design.

ELPA21 2017-2018 Technical Report
5
Table 2.2 Number of Items and Score Points—Online Summative
Grade/Grade Band
K 1 2–3 4–5 6–8 9–12
Domain Items Score Points Items Score
Points Items Score Points Items Score
Points Items Score Points Items Score
Points
Listening 28 28 24 24 24 26 27 30 33 36 24 27
Reading 23 23 30 30 29 34 26 28 26 31 35 37
Speaking 11 27 9 25 9 25 8 30 7 27 7 27
Writing 9 9 10 10 14 24 13 30 8 28 8 28
Writing Supplement 5 12 4 11
Table 2.3 Number of Items and Score Points—Paper Summative
Grade/Grade Band K 1 2–3 4–5 6–8 9–12
Domain Items Score Points Items Score
Points Items Score Points Items Score
Points Items Score Points Items Score
Points
Listening 28 28 24 24 24 26 24 27 32 35 24 27
Reading 23 23 30 30 27 28 26 28 21 25 35 37
Speaking 11 27 9 25 9 25 8 30 7 27 7 27
Writing 12 19 10 17 10 20 11 28 8 28 8 28
Table 2.4 Number of Items and Score Points—Braille Summative
Grade/Grade Band K 1 2–3 4–5 6–8 9–12
Domain Items Score Points Items Score
Points Items Score Points Items Score
Points Items Score Points Items Score
Points
Listening 18 24 21 21 22 23 23 26 23 25 21 24
Reading 13 13 22 22 23 23 23 25 21 25 34 36
Speaking 3 9 7 17 10 26 6 22 5 19 6 22
Writing 9 19 5 11 9 19 10 27 8 28 8 28
Table 2.5 Number of Field Test Items and Score Points—Summative
Grade/Grade Band K 1 2–3 4–5 6–8 9–12
Domain mode Items Score Points Items Score
Points Items Score Points Items Score
Points Items Score Points Items Score
Points
Listening Online 11 11 20 23 22 22 36 42 13 13
Reading Online 31 31 29 33 43 47 17 19 56 59
Speaking Online 10 10 10 10 10 10 9 9 11 11 10 10
Writing Online 34 34 22 22 5 5

ELPA21 2017-2018 Technical Report
6
Table 2.6 Number of Field Test Items Students Should Take-Online Summative
Grade/Grade Band K 1 2–3 4–5 6–8 9–12
Domain min max min max min Max min max min max min max
Listening 1 1 1 4 1 4 1 5 1 1
Reading 2 5 1 4 1 5 1 7 1 6
Speaking 2 2 2 2 2 2 2 2 2 2 2 2
Writing 2 3 2 2 1 1
TEST ADMINISTRATION MANUAL
Directions for Administration
For the 2018 administrations, the test administration manuals (TAM) was developed, which guided TAs in test administrations for summative test. The TAM usually includes the following key points:
• Overview of the ELPA21 summative assessment • Test Administrator qualifications • Preliminary planning • Materials required • Administrative considerations • Student preparation/Guidance for practice tests • Detailed instructions for preparing and administering the training tests and summative
tests. • Test security instructions • Contact information for user support
Training/Practice Tests
To help TAs and students familiarize themselves with the online registration and test delivery systems, training or practice tests were provided before and during the testing windows. Training/practice tests can be accessed through a non-secure or secure browser.
The summative training tests have two components, one for TAs to create and manage the training/practice test sessions and the other for students to take an actual training/practice test.
The Practice Test Administration site introduces TAs to
• logging in, • starting a test session, • providing the session ID to the students signing in to the TA session, • monitoring students’ progress throughout their tests, and • stopping the test when time is up.
ELPA21 2017-2018 Technical Report
7
The Practice Tests site introduces students to
• signing in, • verifying student information, • selecting a test, • waiting for the TA to check the test settings and approve the participation, • starting the test (adjusting the audio sound, checking the microphone for recording
speaking responses, and reviewing test instructions), • taking the test, and • submitting the test.
Summative Tests
The instructions for summative tests include a brief direction for each domain test. They also provide the detailed instructions for
• logging in to the secure browser, • starting a test session, • providing the session ID to the students, • approving student test sessions, including reviewing and editing students’ test settings
and accommodations, • monitoring students’ progress throughout their tests by checking their testing statuses, and • stopping the session and logging out when time is up.
TEST SECURITY
The test security procedures are consistent across all assessments in each state. Details about student-level testing confidentiality, system security, testing environment security, and documentation of test security violations can be found in Chapter 9, Quality Control.
ELPA21 2017-2018 Technical Report
8
For summative tests, four domain scores and two composite scores are computed. The composite scores include a comprehension score for listening and reading and an overall score that comprises all four domains.
ESTIMATING STUDENT ABILITY IN SUMMATIVE ASSESSMENT
ELPA21 reported scale scores for each domain test, the overall scores for the whole test that includes four domains, and the comprehension scores for the partial test that includes reading and listening domains. Multidimensional item response theory (MIRT) is used to estimate domain scores. The bi-factor model is used to estimate the overall and comprehension scores. The details of the estimations can be found in the ELPA21 Scoring Specification.
In addition, business rules were established to specify rules about domain exemption and the attemptedness at the item, domain, and test levels. Detailed business rules can be found in the appendices.
THETA TO SCALE SCORE TRANSFORMATION
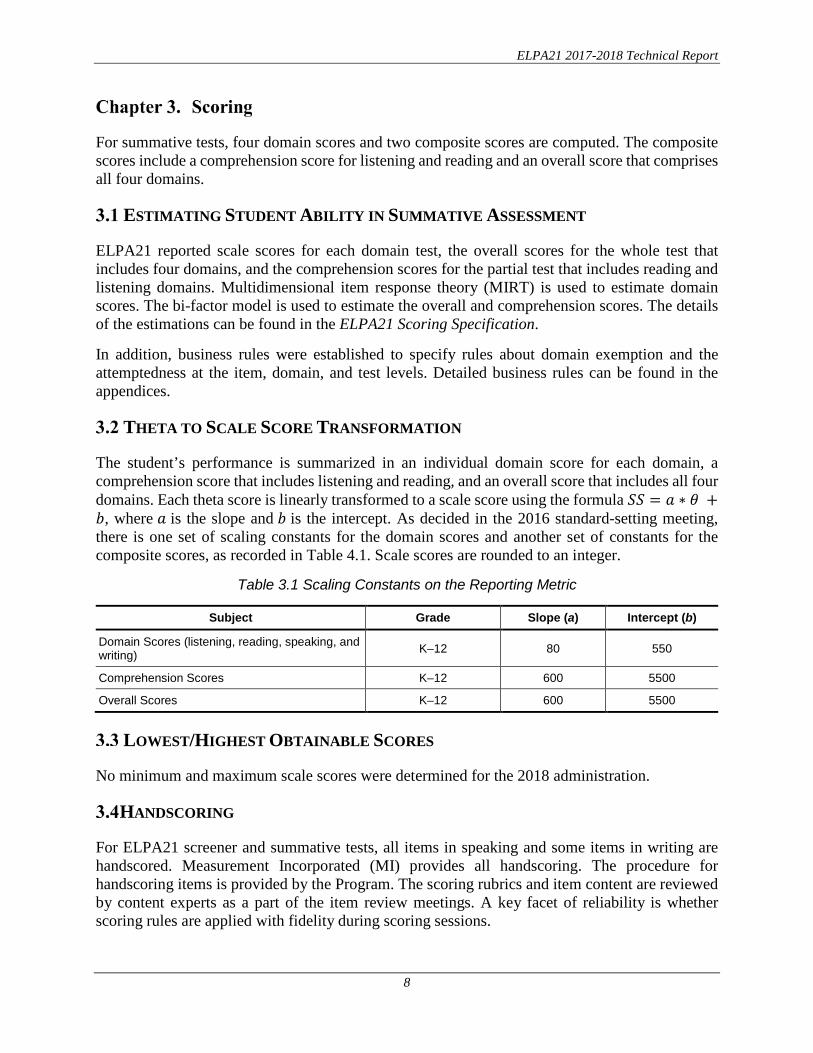
The student’s performance is summarized in an individual domain score for each domain, a comprehension score that includes listening and reading, and an overall score that includes all four domains. Each theta score is linearly transformed to a scale score using the formula 𝑆𝑆𝑆𝑆 = 𝑎𝑎 ∗ 𝜃𝜃 +𝑏𝑏, where 𝑎𝑎 is the slope and 𝑏𝑏 is the intercept. As decided in the 2016 standard-setting meeting, there is one set of scaling constants for the domain scores and another set of constants for the composite scores, as recorded in Table 4.1. Scale scores are rounded to an integer.
Table 3.1 Scaling Constants on the Reporting Metric
Subject Grade Slope (a) Intercept (b)
Domain Scores (listening, reading, speaking, and writing) K–12 80 550
Comprehension Scores K–12 600 5500
Overall Scores K–12 600 5500
LOWEST/HIGHEST OBTAINABLE SCORES
No minimum and maximum scale scores were determined for the 2018 administration.
HANDSCORING
For ELPA21 screener and summative tests, all items in speaking and some items in writing are handscored. Measurement Incorporated (MI) provides all handscoring. The procedure for handscoring items is provided by the Program. The scoring rubrics and item content are reviewed by content experts as a part of the item review meetings. A key facet of reliability is whether scoring rules are applied with fidelity during scoring sessions.
ELPA21 2017-2018 Technical Report
9
For the summative assessment, the domain cut scores and the overall proficiency levels were set through a standard-setting meeting convened by the Program on July 19–22, 2016. Details about the standard setting can be found in the ELPA21 standard-setting report.
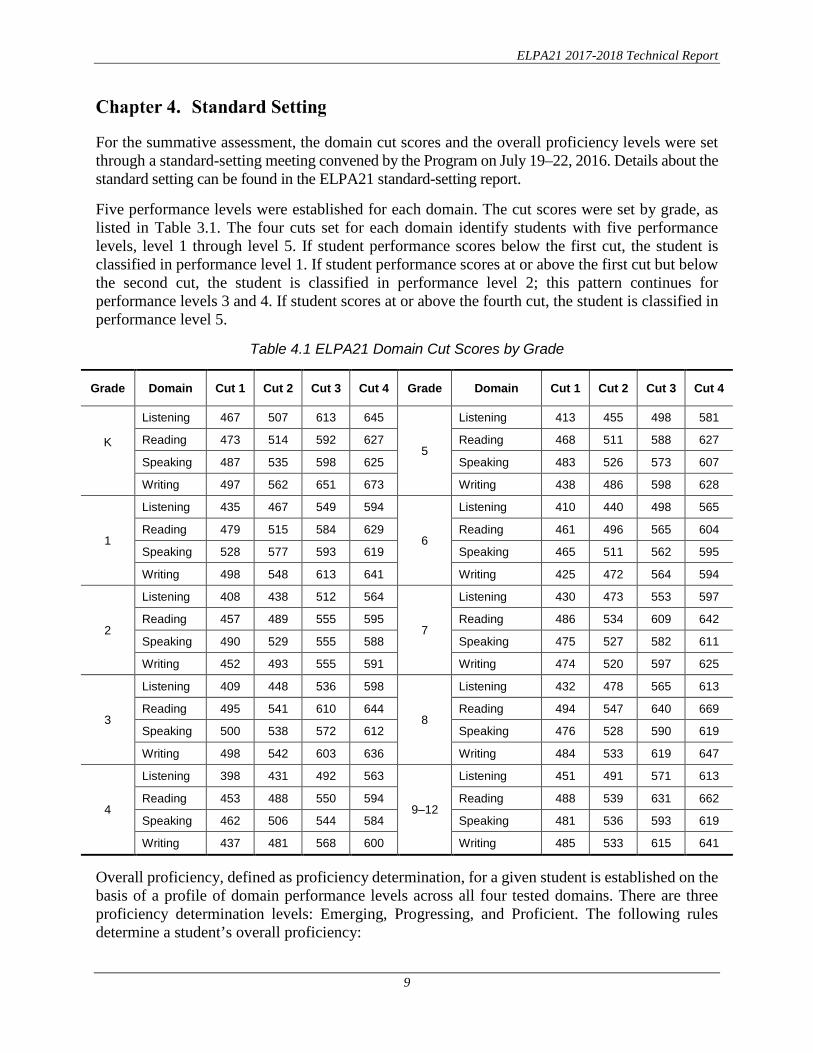
Five performance levels were established for each domain. The cut scores were set by grade, as listed in Table 3.1. The four cuts set for each domain identify students with five performance levels, level 1 through level 5. If student performance scores below the first cut, the student is classified in performance level 1. If student performance scores at or above the first cut but below the second cut, the student is classified in performance level 2; this pattern continues for performance levels 3 and 4. If student scores at or above the fourth cut, the student is classified in performance level 5.
Table 4.1 ELPA21 Domain Cut Scores by Grade
Grade Domain Cut 1 Cut 2 Cut 3 Cut 4 Grade Domain Cut 1 Cut 2 Cut 3 Cut 4
K
Listening 467 507 613 645
5
Listening 413 455 498 581
Reading 473 514 592 627 Reading 468 511 588 627
Speaking 487 535 598 625 Speaking 483 526 573 607
Writing 497 562 651 673 Writing 438 486 598 628
1
Listening 435 467 549 594
6
Listening 410 440 498 565
Reading 479 515 584 629 Reading 461 496 565 604
Speaking 528 577 593 619 Speaking 465 511 562 595
Writing 498 548 613 641 Writing 425 472 564 594
2
Listening 408 438 512 564
7
Listening 430 473 553 597
Reading 457 489 555 595 Reading 486 534 609 642
Speaking 490 529 555 588 Speaking 475 527 582 611
Writing 452 493 555 591 Writing 474 520 597 625
3
Listening 409 448 536 598
8
Listening 432 478 565 613
Reading 495 541 610 644 Reading 494 547 640 669
Speaking 500 538 572 612 Speaking 476 528 590 619
Writing 498 542 603 636 Writing 484 533 619 647
4
Listening 398 431 492 563
9–12
Listening 451 491 571 613
Reading 453 488 550 594 Reading 488 539 631 662
Speaking 462 506 544 584 Speaking 481 536 593 619
Writing 437 481 568 600 Writing 485 533 615 641
Overall proficiency, defined as proficiency determination, for a given student is established on the basis of a profile of domain performance levels across all four tested domains. There are three proficiency determination levels: Emerging, Progressing, and Proficient. The following rules determine a student’s overall proficiency:
ELPA21 2017-2018 Technical Report
10
• Students whose domain performance levels are 1 or 2 across all four domains are identified as Emerging.
• Students with domain performance levels that do not fit with Emerging or Proficient (as defined above and below) are identified as Progressing
• Students whose domain performance levels are 4 or 5 across all four domains are identified as Proficient.
In addition, set the item score to 0 for items without responses in domain tests that are attempted.

ELPA21 2017-2018 Technical Report
11
The 2018 student accommodation, participation, and performance statistics are presented in Sections 1–5 (summative assessment) and in Sections 13–16 (screener) of the appendix for each state and pooled analysis based on all seven states. The figures and tables included in Sections 1–5 are listed below:
• Section 1. Summative Assessment – Accommodation Summary
o Table S1.1 shows the types of the accommodations, the subtype (Value) within each type of accommodation, the number of students accommodated in each subtype by grade, and the total number of students in each subtype of accommodation.
• Section 2. Summative Assessment – Student Participation
o Table S2.1 displays the number and percentage of students in each test mode of braille, Paper-Pencil, and online in each grade and across the state.
o Table S2.2 lists the number and percentage of students taking each test by subgroups including grade, gender, ethnicity, primary disabilities, and other groups such as ELL, homeless, economic status, limited English proficiency (LEP) group, migrant, special education (SPED), Title I, and/or Section 504 Plan. Subgroups can vary across the states.
• Section 3. Summative Assessment – Scale Score Summary
o Tables S3.1–S3.13 present the number of students taking each domain test, their average scores and standard deviation of scores across the state and by subgroups in each grade of kindergarten to grade 12. At the end of each table, the total number of students who have valid overall and comprehension scores, their average scores, and the standard deviations of the scores are also presented.
• Section 4. Summative Assessment – Percentage of Students by Domain Performance Level
o Figure 4.1 shows the percentage of students in each performance level in each domain test across grades in the state.
o Tables S4.1–S4.13 present the total number of students taking each domain test and the percentage of students in each performance level by domain test across the state and by subgroups.
• Section 5. Summative Assessment – Percentage of Students by Overall Proficiency Level
o Figure S5.1 shows the percentage of students in each overall proficiency level across grades in the state.

ELPA21 2017-2018 Technical Report
12
o Tables S5.1–S5.13 present the total number of students who are categorized in each of the overall proficiency levels: Emerging, Progressing, and Proficient, or not assigned an overall proficiency level (N) across the state and by subgroups.
2018 STUDENT PARTICIPATION
Test participation presented in this chapter is based on data from all seven states. Table 5.1 summarizes student participation in each state.
Table 5.1 Student Participation in Each State
Grade Arkansas Iowa Louisiana Nebraska Ohio Washington West Virginia Total
KG 3850 3755 3005 3348 7767 17680 198 39603
01 3957 3395 3140 3115 7472 17518 209 38806
02 3779 3134 3153 2938 6473 16153 191 35821
03 3652 2894 2783 2376 5591 13279 199 30774
04 3315 2651 2549 1785 4279 11708 177 26464
05 3254 2397 1870 1179 3761 10016 135 22612
06 2795 2312 1426 1005 3463 8675 109 19785
07 2494 2168 1345 850 3205 7957 114 18133
08 2616 1848 1350 800 3202 7113 101 17030
09 2795 1917 1574 1018 4007 6232 145 17688
10 2770 1862 1226 1156 3148 5953 153 16268
11 2421 1373 946 795 2377 4719 141 12772
12 1918 1204 647 754 1822 4264 96 10705
Total 39616 30910 25014 21119 56567 131267 1968 306461
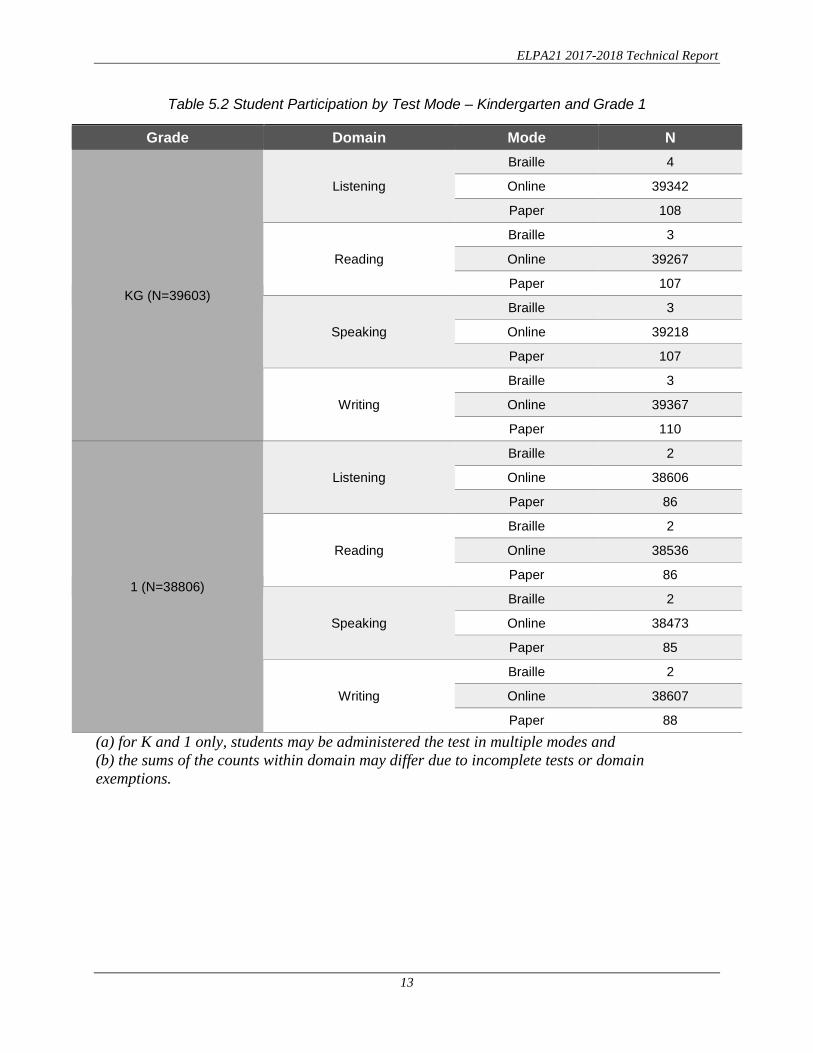
The parts of Table 5.2 present student participation in each test across the seven states. In Kindergarten and grade 1, a student could take the online test in one domain and paper tests in other domains; and the result is summarized in the table for kindergarten and grade 1. For the rest of the test, students could only elect to take online and paper tests. The result is presented in a separate table below.
ELPA21 2017-2018 Technical Report
13
Table 5.2 Student Participation by Test Mode – Kindergarten and Grade 1
Grade Domain Mode N
KG (N=39603)
Listening Braille 4 Online 39342 Paper 108
Reading Braille 3 Online 39267 Paper 107
Speaking Braille 3 Online 39218 Paper 107
Writing Braille 3 Online 39367 Paper 110
1 (N=38806)
Listening Braille 2 Online 38606 Paper 86
Reading Braille 2 Online 38536 Paper 86
Speaking Braille 2 Online 38473 Paper 85
Writing Braille 2 Online 38607 Paper 88
(a) for K and 1 only, students may be administered the test in multiple modes and (b) the sums of the counts within domain may differ due to incomplete tests or domain exemptions.

ELPA21 2017-2018 Technical Report
14
Table 5.3 Student Participation by Test Mode – Grades 2-12
Braille Online Paper-Pencil Grade Total N % N % N %
02 35821 3 0.0 35754 99.8 64 0.2 03 30774 30704 99.8 70 0.2 04 26464 26414 99.8 50 0.2 05 22612 22580 99.9 32 0.1 06 19785 4 0.0 19752 99.8 29 0.1 07 18133 1 0.0 18102 99.8 30 0.2 08 17030 1 0.0 17002 99.8 27 0.2 09 17688 2 0.0 17675 99.9 11 0.1 10 16268 1 0.0 16260 100.0 7 0.0 11 12772 2 0.0 12765 99.9 5 0.0 12 10705 2 0.0 10696 99.9 7 0.1
Total 306461 22 0.0 306107 99.9 332 0.1
* Please see Table 5.4 Students Participated by Test Mode – Kindergarten and Grade 1.
Table 5.3 shows the student participation by gender and ethnicity. Generally, the number of student participation decreased as the grade level increased until grade 8. The pattern repeated in high school. There were more male students than female students. In each test, most students were in the group of Hispanic or Latino (53.9%–65.3%), followed by Asian students (10.7%–16.6%), and White students (8.3%–11.4%).

ELPA21 2017-2018 Technical Report
15
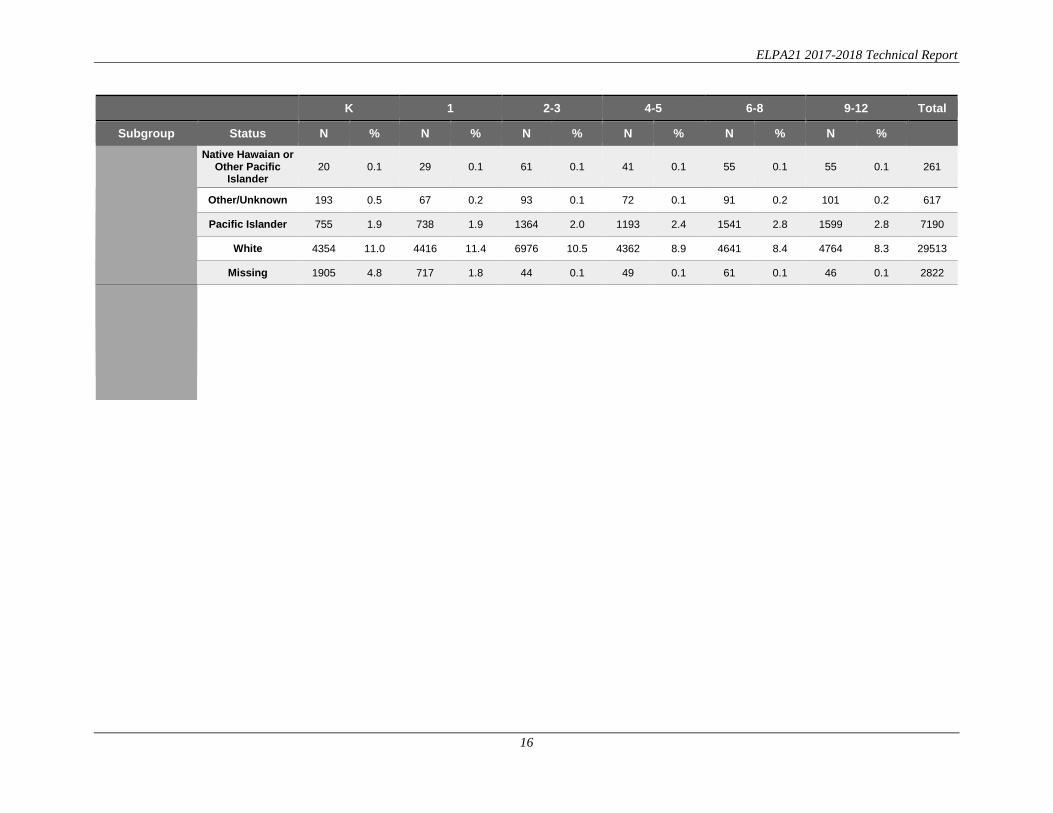
Table 5.5 Student Participation by Subgroups in Each Test
K 1 2-3 4-5 6-8 9-12 Total Subgroup Status N % N % N % N % N % N %
Total 39603 100.0 38806 100.0 66595 100.0 49076 100.0 54948 100.0 57433 100.0 306461
Grade
KG 39603 100.0 39603 01 38806 100.0 38806 02 35821 53.8 35821 03 30774 46.2 30774 04 26464 53.9 26464 05 22612 46.1 22612 06 19785 36.0 19785 07 18133 33.0 18133 08 17030 31.0 17030 09 17688 30.8 17688 10 16268 28.3 16268 11 12772 22.2 12772 12 10705 18.6 10705
Gender Female 18144 45.8 18210 46.9 31040 46.6 22176 45.2 24041 43.8 25463 44.3 139074
Male 19531 49.3 19836 51.1 35465 53.3 26860 54.7 30853 56.1 31889 55.5 164434 Missing 1928 4.9 760 2.0 90 0.1 40 0.1 54 0.1 81 0.1 2953
Ethnicity
African American 3003 7.6 3086 8.0 5231 7.9 3750 7.6 4676 8.5 5823 10.1 25569 American Indian
or Alaskan Native 242 0.6 253 0.7 601 0.9 546 1.1 702 1.3 535 0.9 2879
Asian 6590 16.6 5950 15.3 8434 12.7 5396 11.0 5902 10.7 7963 13.9 40235 Hispanic or Latino 21330 53.9 22240 57.3 41469 62.3 32028 65.3 35350 64.3 34787 60.6 187204
Multiple Races 1211 3.1 1310 3.4 2322 3.5 1639 3.3 1929 3.5 1760 3.1 10171
ELPA21 2017-2018 Technical Report
16
K 1 2-3 4-5 6-8 9-12 Total Subgroup Status N % N % N % N % N % N %
Native Hawaian or Other Pacific
Islander 20 0.1 29 0.1 61 0.1 41 0.1 55 0.1 55 0.1 261
Other/Unknown 193 0.5 67 0.2 93 0.1 72 0.1 91 0.2 101 0.2 617 Pacific Islander 755 1.9 738 1.9 1364 2.0 1193 2.4 1541 2.8 1599 2.8 7190
White 4354 11.0 4416 11.4 6976 10.5 4362 8.9 4641 8.4 4764 8.3 29513 Missing 1905 4.8 717 1.8 44 0.1 49 0.1 61 0.1 46 0.1 2822

ELPA21 2017-2018 Technical Report
17
5.2 2018 STUDENT SCALE SCORE AND PERFORMANCE SUMMARY
Student performance in the 2018 administration across the seven states is summarized for the entire population and by subgroup.

ELPA21 2017-2018 Technical Report
18
Table 5.6 Scale Score Summary
Listening Reading Speaking Writing Grade N Mean SD N Mean SD N Mean SD N Mean SD
KG 39416 548 72.5 39342 547 72.4 38991 556 75.1 38236 538 73.7 01 38668 558 68.6 38571 549 72.5 38369 566 68.5 37529 545 78.3 02 35773 539 66.4 35703 526 66.5 35493 542 64.9 35681 526 68.8 03 30713 565 68.7 30627 559 69.3 30494 567 68.0 30612 559 69.5 04 26420 536 71.3 26348 528 68.1 26234 545 72.4 26337 530 72.2 05 22571 555 75.4 22517 551 73.4 22380 560 73.5 22499 553 75.9 06 19734 532 65.1 19669 526 62.4 19521 545 65.2 19652 523 64.3 07 18085 540 70.7 18031 539 67.5 17789 552 70.8 18012 533 69.2 08 16977 550 76.5 16937 553 73.8 16681 561 75.2 16912 544 75.4 09 17619 528 70.9 17582 527 68.0 17196 536 69.1 17530 529 78.2 10 16155 538 69.5 16143 539 70.0 15795 547 65.5 16074 542 74.7 11 12697 547 66.5 12681 550 68.7 12417 557 63.8 12613 553 69.9 12 10623 548 62.4 10562 551 65.8 10345 558 61.7 10526 555 65.6
ELPA21 2017-2018 Technical Report
19
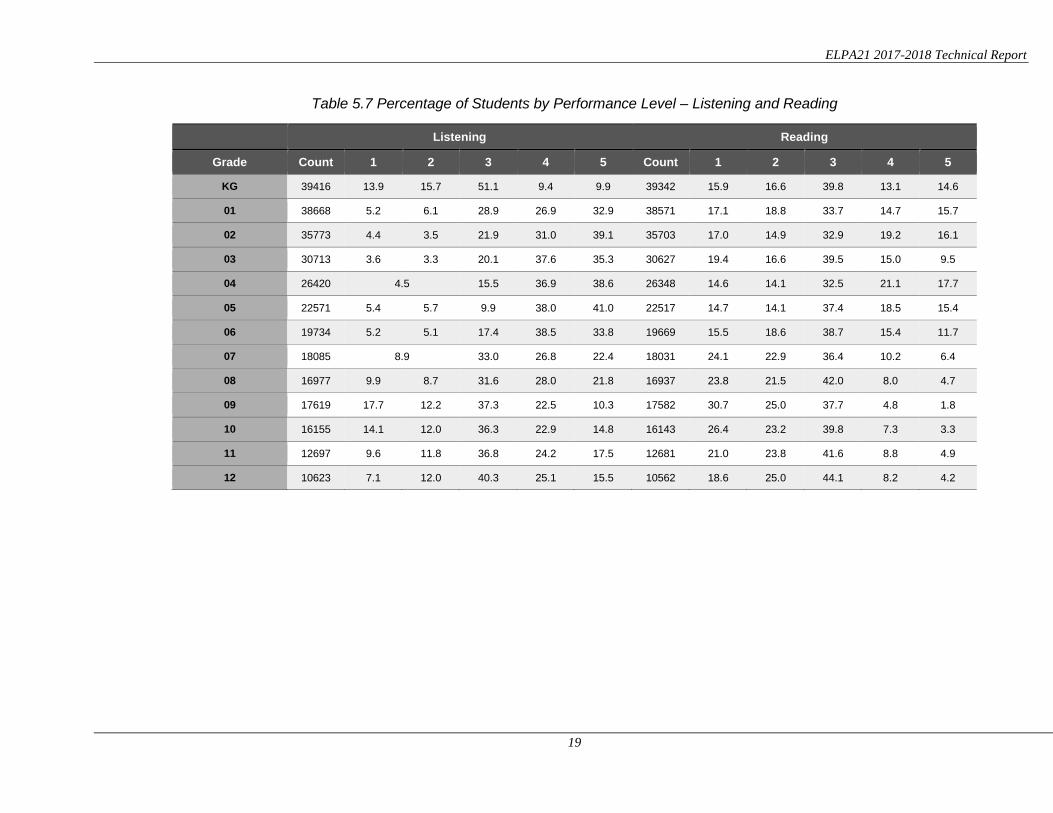
Table 5.7 Percentage of Students by Performance Level – Listening and Reading
Listening Reading Grade Count 1 2 3 4 5 Count 1 2 3 4 5
KG 39416 13.9 15.7 51.1 9.4 9.9 39342 15.9 16.6 39.8 13.1 14.6 01 38668 5.2 6.1 28.9 26.9 32.9 38571 17.1 18.8 33.7 14.7 15.7 02 35773 4.4 3.5 21.9 31.0 39.1 35703 17.0 14.9 32.9 19.2 16.1 03 30713 3.6 3.3 20.1 37.6 35.3 30627 19.4 16.6 39.5 15.0 9.5 04 26420 4.5 15.5 36.9 38.6 26348 14.6 14.1 32.5 21.1 17.7 05 22571 5.4 5.7 9.9 38.0 41.0 22517 14.7 14.1 37.4 18.5 15.4 06 19734 5.2 5.1 17.4 38.5 33.8 19669 15.5 18.6 38.7 15.4 11.7 07 18085 8.9 33.0 26.8 22.4 18031 24.1 22.9 36.4 10.2 6.4 08 16977 9.9 8.7 31.6 28.0 21.8 16937 23.8 21.5 42.0 8.0 4.7 09 17619 17.7 12.2 37.3 22.5 10.3 17582 30.7 25.0 37.7 4.8 1.8 10 16155 14.1 12.0 36.3 22.9 14.8 16143 26.4 23.2 39.8 7.3 3.3 11 12697 9.6 11.8 36.8 24.2 17.5 12681 21.0 23.8 41.6 8.8 4.9 12 10623 7.1 12.0 40.3 25.1 15.5 10562 18.6 25.0 44.1 8.2 4.2

ELPA21 2017-2018 Technical Report
20
Table 5.8 Percentage of Students by Performance Level – Speaking and Writing
Speaking Writing Grade Count 1 2 3 4 5 Count 1 2 3 4 5
KG 38991 16.7 16.0 36.4 14.4 16.4 38236 32.7 31.8 27.3 3.6 4.6 01 38369 23.3 29.3 10.8 15.9 20.6 37529 26.9 21.2 31.9 9.3 10.7 02 35493 16.8 19.7 17.6 22.2 23.8 35681 15.1 14.8 33.1 19.2 17.7 03 30494 13.1 13.0 20.2 28.4 25.2 30612 17.7 16.2 37.9 17.3 10.9 04 26234 12.3 11.2 18.1 26.9 31.5 26337 11.5 10.1 46.4 17.1 14.8 05 22380 13.6 11.6 25.7 22.8 26.4 22499 8.9 8.1 53.9 15.0 14.1 06 19521 11.2 13.2 31.5 22.6 21.5 19652 8.2 9.3 57.6 14.3 10.7 07 17789 13.4 16.2 34.1 17.4 18.9 18012 16.7 18.7 48.8 9.4 6.5 08 16681 13.3 13.7 33.2 17.8 22.0 16912 18.3 19.7 47.9 8.5 5.6 09 17196 19.6 22.9 36.7 12.1 8.6 17530 25.2 18.0 45.9 7.4 3.5 10 15795 15.5 21.4 37.2 14.6 11.2 16074 21.0 18.1 45.5 9.3 6.1 11 12417 11.5 20.2 37.7 15.7 14.8 12613 15.7 17.9 47.6 10.5 8.2 12 10345 10.4 19.3 40.3 16.2 13.7 10526 13.5 18.0 51.5 10.0 6.9
ELPA21 2017-2018 Technical Report
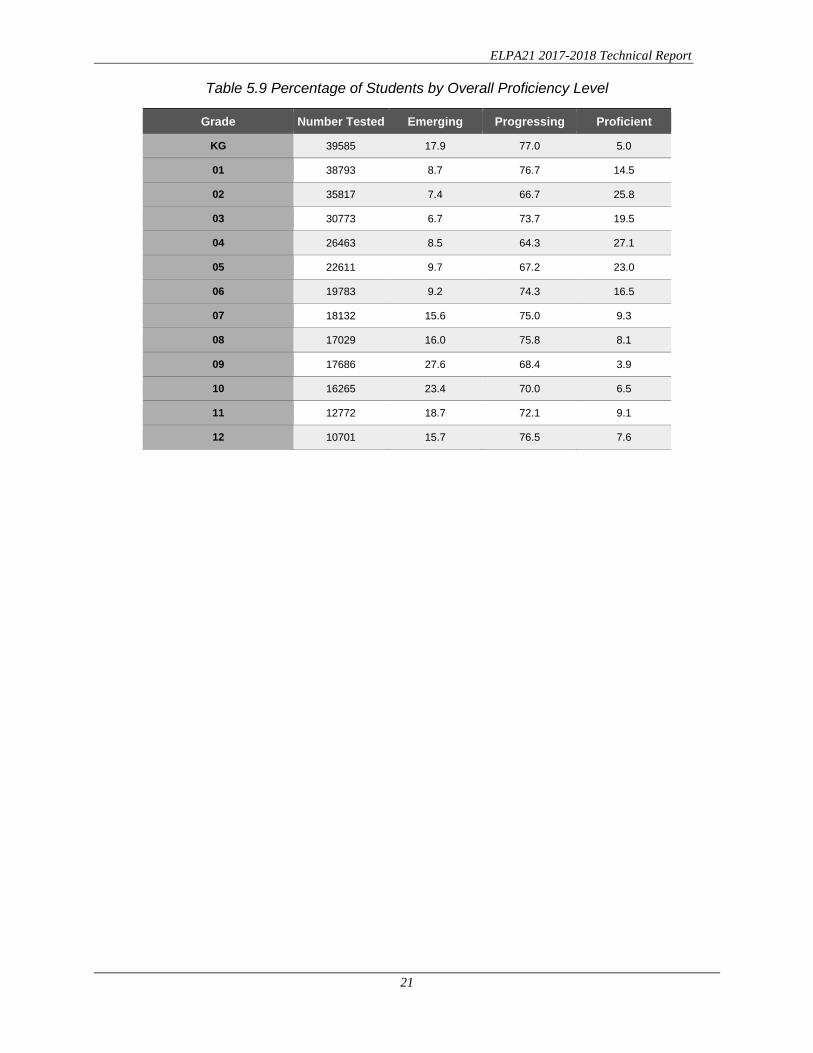
21
Table 5.9 Percentage of Students by Overall Proficiency Level
Grade Number Tested Emerging Progressing Proficient KG 39585 17.9 77.0 5.0 01 38793 8.7 76.7 14.5 02 35817 7.4 66.7 25.8 03 30773 6.7 73.7 19.5 04 26463 8.5 64.3 27.1 05 22611 9.7 67.2 23.0 06 19783 9.2 74.3 16.5 07 18132 15.6 75.0 9.3 08 17029 16.0 75.8 8.1 09 17686 27.6 68.4 3.9 10 16265 23.4 70.0 6.5 11 12772 18.7 72.1 9.1 12 10701 15.7 76.5 7.6

ELPA21 2017-2018 Technical Report
22
Figure 5.1 Percentage of Students in Performance Levels
The percentage of students by performance level in each domain test is plotted in Figure 5.1.
For both reading and writing, the plot shows that, most students are in performance level 3 except writing grade K. The percentages of students in performance level 4 and 5 follows the similar pattern, which increases from grade K to grade 2 or grade 4, then decreases to grade 9, and then slight increase afterwards.
For both listening and speaking, the percentages of students in performance level 4 and 5 increases from grade K to grade 4 or 5, then drops to grade 9, and becomes stable or slightly increases afterwards.

ELPA21 2017-2018 Technical Report
23
Figure 5.2 Percentage of Students in Proficiency Levels
The percentage of students in each proficiency level is summarized in Figure 5.2. The figure shows that most students are in the Progressing category in all grades (64% to 77%). The percentage of students who are proficient increases from kindergarten to grade 4 (with slight drop in grade 3), then consistently decreases until grade 9, and slightly increases after grade 9. The percentage of students in the Emerging category is relatively stable until grade 6, increases until grade 9, and then consistently drops afterwards.

ELPA21 2017-2018 Technical Report
24
Test reliability for both summative and screener tests is assessed using
• marginal reliability based on all students in the state and by subgroup of students,
• marginal standard error of measurement,
• conditional standard error of measurement, and
• classification accuracy and consistency.
The following sections describes the methods used in the computation. The results are included in Sections 6–8 for the summative assessment. The figures and the tables in each section are illustrated below:
• Section 6. Summative Assessment – Marginal Reliability
o Figure S6.1 presents the marginal reliability for each domain test across grades.
o Figure S6.2 shows the ratio of standard error of measurement and the standard deviation of scale scores at the test level.
o Figure S6.3 presents the marginal reliability by gender for each domain test across grades.
o Figures S6.4 present the marginal reliability by other subgroups for each domain test across grades. Depending on the state, the subgroups may vary.
• Section 7. Summative Assessment – Conditional Standard Error of Measurement (CSEM)
o Figures S7.1–S7.6 show the CSEM plots for each domain tests. If an ELPA test applies to multiple grades, the CSEM plots are broken down by grade.
• Section 8. Summative Assessment – Classification Accuracy and Consistency
o Figure S8.1 shows the classification accuracy for each domain tests of each across grades.
o Figure S8.2 shows the classification consistency for each domain tests of each across grades.
MARGINAL RELIABILITY AND CONDITIONAL STANDARD ERROR OF MEASUREMENT
Marginal reliability (Sireci, Thissen, & Wainer, 1991) assesses the precision of scoring. It is based on the average of the conditional standard error of measurements (CSEM) for the estimated theta scores. By the definition, it is the proportion of true score variance among the observed score variance. A posterior density by summing the posterior distribution of each student, that is, a normal distribution using theta estimate as the mean and the conditional standard error of
ELPA21 2017-2018 Technical Report
25
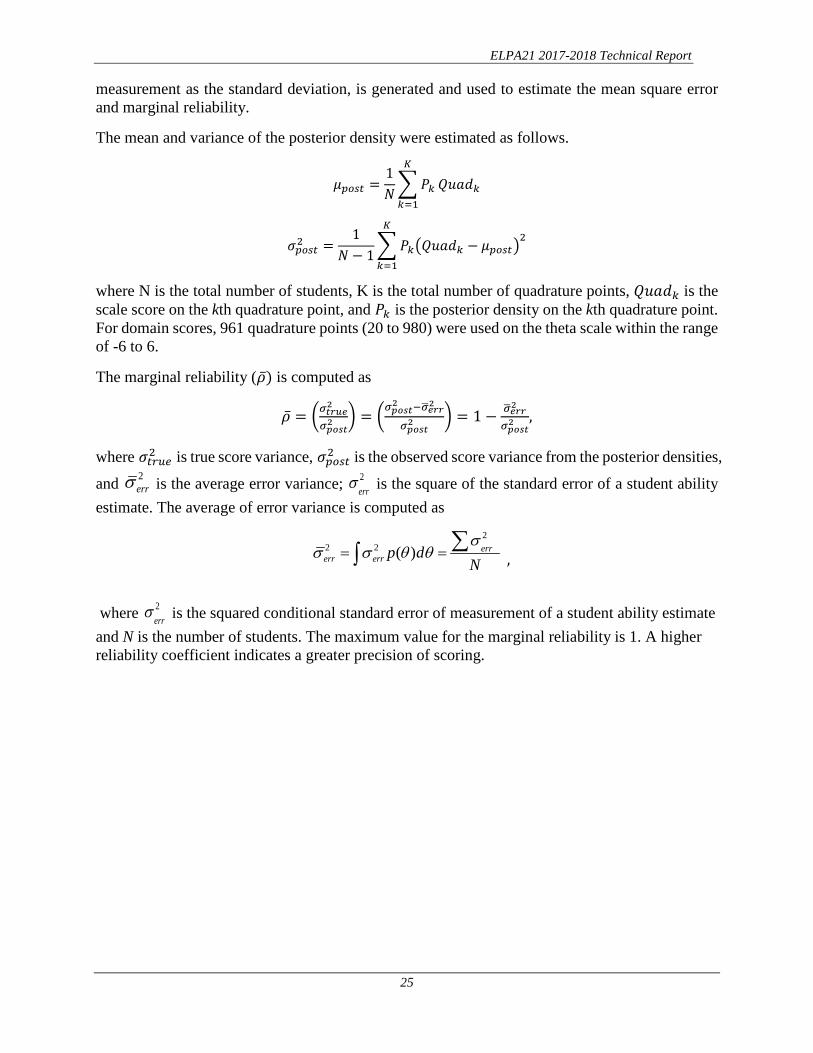
measurement as the standard deviation, is generated and used to estimate the mean square error and marginal reliability.
The mean and variance of the posterior density were estimated as follows.
𝜇𝜇𝑝𝑝𝑝𝑝𝑝𝑝𝑝𝑝 =1𝑁𝑁�𝑃𝑃𝑘𝑘
𝐾𝐾
𝑘𝑘=1
𝑄𝑄𝑄𝑄𝑎𝑎𝑑𝑑𝑘𝑘
𝜎𝜎𝑝𝑝𝑝𝑝𝑝𝑝𝑝𝑝2 =1
𝑁𝑁 − 1�𝑃𝑃𝑘𝑘�𝑄𝑄𝑄𝑄𝑎𝑎𝑑𝑑𝑘𝑘 − 𝜇𝜇𝑝𝑝𝑝𝑝𝑝𝑝𝑝𝑝�
2𝐾𝐾
𝑘𝑘=1
where N is the total number of students, K is the total number of quadrature points, 𝑄𝑄𝑄𝑄𝑎𝑎𝑑𝑑𝑘𝑘 is the scale score on the kth quadrature point, and 𝑃𝑃𝑘𝑘 is the posterior density on the kth quadrature point. For domain scores, 961 quadrature points (20 to 980) were used on the theta scale within the range of -6 to 6.
The marginal reliability (�̅�𝜌) is computed as
�̅�𝜌 = �𝜎𝜎𝑡𝑡𝑡𝑡𝑡𝑡𝑡𝑡2
𝜎𝜎𝑝𝑝𝑝𝑝𝑝𝑝𝑡𝑡2 � = �𝜎𝜎𝑝𝑝𝑝𝑝𝑝𝑝𝑡𝑡2 −𝜎𝜎�𝑡𝑡𝑡𝑡𝑡𝑡2
𝜎𝜎𝑝𝑝𝑝𝑝𝑝𝑝𝑡𝑡2 � = 1 − 𝜎𝜎�𝑡𝑡𝑡𝑡𝑡𝑡2
𝜎𝜎𝑝𝑝𝑝𝑝𝑝𝑝𝑡𝑡2 ,
where 𝜎𝜎𝑝𝑝𝑡𝑡𝑡𝑡𝑡𝑡2 is true score variance, 𝜎𝜎𝑝𝑝𝑝𝑝𝑝𝑝𝑝𝑝2 is the observed score variance from the posterior densities,
and 2errσ is the average error variance; 2
errσ is the square of the standard error of a student ability
estimate. The average of error variance is computed as
where 2err
σ is the squared conditional standard error of measurement of a student ability estimate and N is the number of students. The maximum value for the marginal reliability is 1. A higher reliability coefficient indicates a greater precision of scoring.
,
22 2 ( ) errerr err p d
Nσ
σ σ θ θ= = ∑∫

ELPA21 2017-2018 Technical Report
26
Figure 6.1 Marginal Reliability by Test
MARGINAL STANDARD ERROR OF MEASUREMENT
Another way to examine score reliability is with the marginal standard error of measurement (MSEM), computed as the square root of 2
errσ . A smaller value of MSEM indicates a greater accuracy of test scores. The marginal reliability �̅�𝜌 and the test MSEM behave oppositely: the higher the �̅�𝜌, the lower the MSEM and vice versa.
The ratio of MSEM and the standard deviation of scale scores can also indicate the measure errors.

ELPA21 2017-2018 Technical Report
27
Figure 6.2 Ratio of Standard Error of Measurement Over Standard Deviation by Test
CLASSIFICATION ACCURACY AND CONSISTENCY
When student performance is reported in terms of achievement levels, a reliability of achievement classification is computed in terms of the probabilities of consistent classification of students as specified in Standard 2.16 in the Standards for Educational and Psychological Testing (American Educational Research Association, American Psychological Association, & National Council on Measurement in Education, 2014). This index considers the consistency of classifications for the percentage of examinees that would, hypothetically, be classified in the same category on an alternate, equivalent form.
Classification accuracy (CA) analysis investigates how precisely students are classified into each performance level. By definition, classification consistency (CC) analysis investigates how consistently students are classified into each performance level across two independent administrations of equivalent forms. Since obtaining test scores from two independent administrations is not feasible due to issues such as logistics and cost constraints, the CC index is computed with the assumption that the same test is independently administered twice to the same group of students.
For ELPA21, since the overall proficiency is based on domain performance level, the CA and CC are examined at each cut point in each domain test. Five performance levels divided by four cuts, cut 1 to cut 4, are established for each domain test. Forms with an n count fewer than 50 are excluded from the analysis; for this reason, the paper-pencil and braille forms are excluded. Four domain cut scores divided the scale range into five performance levels.
The method used for computing CA and CC is described below. Both indices are based on empirical data. For CA, assuming the estimated ability of student i is 𝜃𝜃�𝑖𝑖 with SEM of 𝑠𝑠𝑠𝑠�𝜃𝜃�𝑖𝑖�, and

ELPA21 2017-2018 Technical Report
28
the estimated ability is distributed as 𝜃𝜃�𝑖𝑖~𝑁𝑁 �𝜃𝜃𝑖𝑖 , 𝑠𝑠𝑠𝑠�𝜃𝜃�𝑖𝑖��, assuming a normal distribution, where 𝜃𝜃𝑖𝑖is the unknown true ability of the ith student. The probability of the true score at performance level l based on the cut scores 𝑐𝑐𝑙𝑙−1 and 𝑐𝑐𝑙𝑙 is estimated as
𝑝𝑝𝑖𝑖𝑙𝑙 = 𝑝𝑝(𝑐𝑐𝑙𝑙−1 ≤ 𝜃𝜃𝑖𝑖 < 𝑐𝑐𝑙𝑙) = 𝑝𝑝� 𝑐𝑐𝑙𝑙−1 − 𝜃𝜃�𝑖𝑖𝑠𝑠�𝜃𝜃�𝑖𝑖�
≤𝜃𝜃𝑖𝑖 − 𝜃𝜃�𝑖𝑖𝑠𝑠�𝜃𝜃�𝑖𝑖�
< 𝑐𝑐𝑙𝑙 − 𝜃𝜃�𝑖𝑖𝑠𝑠�𝜃𝜃�𝑖𝑖�
�
= 𝑝𝑝�𝜃𝜃�𝑖𝑖 − 𝑐𝑐𝑙𝑙𝑠𝑠�𝜃𝜃�𝑖𝑖�
≤𝜃𝜃�𝑖𝑖 − 𝜃𝜃𝑖𝑖𝑠𝑠�𝜃𝜃�𝑖𝑖�
< 𝜃𝜃�𝑖𝑖 − 𝑐𝑐𝑙𝑙−1𝑠𝑠�𝜃𝜃�𝑖𝑖�
� = Φ�𝜃𝜃�𝑖𝑖 − 𝑐𝑐𝑙𝑙−1𝑠𝑠�𝜃𝜃�𝑖𝑖�
� −Φ�𝜃𝜃�𝑖𝑖 − 𝑐𝑐𝑙𝑙𝑠𝑠�𝜃𝜃�𝑖𝑖�
�.
For level 1, 𝑐𝑐0 = −∞, and for level L, 𝑐𝑐𝐿𝐿 = ∞.
Using 𝑝𝑝𝑖𝑖𝑙𝑙, a 𝐿𝐿 × 𝐿𝐿 matrix is constructed as follows
�𝑛𝑛𝑎𝑎11 ⋯ 𝑛𝑛𝑎𝑎1𝐿𝐿⋮ ⋮ ⋮
𝑛𝑛𝑎𝑎𝐿𝐿1 ⋯ 𝑛𝑛𝑎𝑎𝐿𝐿𝐿𝐿�
where 𝑛𝑛𝑎𝑎𝑙𝑙𝑎𝑎 = ∑ 𝑝𝑝𝑖𝑖𝑎𝑎𝑝𝑝𝑙𝑙𝑖𝑖=𝑙𝑙 which is the sum of the probabilities for each expected performance level at each observed performance level. In the matrix, the row represents the observed level and the column represents the expected level.
Based on the above matrix, the classification accuracy (CA) for the cut 𝑐𝑐𝑙𝑙 (𝑙𝑙 = 1,⋯ , 𝐿𝐿 − 1) is
𝐶𝐶𝐶𝐶𝑐𝑐𝑙𝑙 =∑ 𝑛𝑛𝑎𝑎𝑘𝑘𝑎𝑎𝑙𝑙𝑘𝑘,𝑎𝑎=1 + ∑ 𝑛𝑛𝑎𝑎𝑘𝑘𝑎𝑎𝐿𝐿
𝑘𝑘,𝑎𝑎=𝑙𝑙+1
𝑁𝑁
where 𝑁𝑁 is the total number of students.
The CA for a single cut, for example, the CA at the cut 2 is the sum of the 𝑛𝑛𝑎𝑎𝑙𝑙𝑎𝑎 values in blue (∑ 𝑛𝑛𝑎𝑎𝑘𝑘𝑎𝑎𝑙𝑙
𝑘𝑘,𝑎𝑎=1 ) assigned in the levels equal to or below cut 2 at both expected and observed levels and in green (∑ 𝑛𝑛𝑎𝑎𝑘𝑘𝑎𝑎𝐿𝐿
𝑘𝑘,𝑎𝑎=𝑙𝑙+1 ) assigned in the levels above cut 2 at both expected and observed levels divided by the total number of students.
⎝
⎜⎛
𝑛𝑛𝑎𝑎11𝑛𝑛𝑎𝑎21𝑛𝑛𝑎𝑎31𝑛𝑛𝑎𝑎41𝑛𝑛𝑎𝑎51
𝑛𝑛𝑎𝑎12 𝑛𝑛𝑎𝑎22 𝑛𝑛𝑎𝑎32 𝑛𝑛𝑎𝑎42 𝑛𝑛𝑎𝑎52
𝑛𝑛𝑎𝑎13 𝑛𝑛𝑎𝑎23𝑛𝑛𝑎𝑎33𝑛𝑛𝑎𝑎43𝑛𝑛𝑎𝑎53
𝑛𝑛𝑎𝑎14 𝑛𝑛𝑎𝑎24 𝑛𝑛𝑎𝑎34 𝑛𝑛𝑎𝑎44 𝑛𝑛𝑎𝑎54
𝑛𝑛𝑎𝑎15 𝑛𝑛𝑎𝑎25 𝑛𝑛𝑎𝑎35 𝑛𝑛𝑎𝑎45 𝑛𝑛𝑎𝑎55⎠
⎟⎞
For classification consistency using 𝑝𝑝𝑖𝑖𝑙𝑙, similar to classification accuracy, a similar 𝐿𝐿 × 𝐿𝐿 table is constructed by assuming the test is administered twice independently to the same student group,
�𝑛𝑛𝑐𝑐11 ⋯ 𝑛𝑛𝑐𝑐1𝐿𝐿⋮ ⋮ ⋮
𝑛𝑛𝑐𝑐𝐿𝐿1 ⋯ 𝑛𝑛𝑐𝑐𝐿𝐿𝐿𝐿�
where 𝑛𝑛𝑐𝑐𝑙𝑙𝑎𝑎 = ∑ 𝑝𝑝𝑖𝑖𝑙𝑙𝑝𝑝𝑖𝑖𝑎𝑎𝑁𝑁𝑖𝑖=1 which is the sum of the probabilities multiplied by each paired
combination of performance.
The classification consistency for the cut 𝑐𝑐𝑙𝑙 (𝑙𝑙 = 1,⋯ , 𝐿𝐿 − 1) is

ELPA21 2017-2018 Technical Report
29
𝐶𝐶𝐶𝐶𝑐𝑐𝑙𝑙 =∑ 𝑛𝑛𝑐𝑐𝑘𝑘𝑎𝑎𝑙𝑙𝑘𝑘,𝑎𝑎=1 + ∑ 𝑛𝑛𝑐𝑐𝑘𝑘𝑎𝑎𝐿𝐿
𝑘𝑘,𝑎𝑎=𝑙𝑙+1
𝑁𝑁
The CA and CC indices are affected by the interaction of the magnitude of se (θ ), the distance between adjacent cuts, the location of the cuts on the ability scale, and the proportion of students around a cut point. The larger the se (θ ), the closer the two adjacent cuts, and the greater the proportion of students around a cut point, the lower the indices.
The pooled analysis results for each cut are presented in Figures 6.3 and 6.4. For each cut, all CAs are above 0.8 and all CCs are above 0.75. In listening and speaking, both indices for cut 3 and/or cut 4 are relatively lower in elementary school grades, which indicates lack of difficult items. For each domain test, the CAs and CCs are lower.
Figure 6.3 Domain Classification Accuracy

ELPA21 2017-2018 Technical Report
30
Figure 6.4 Domain Classification Consistency
ELPA21 2017-2018 Technical Report
31
Validity refers to the degree to which evidence and theory support the interpretation of test scores for the proposed uses of tests (America Educational Research Association [AERA], American Psychological Association [APA], & National Council on Measurement in Education [NCME], 2014). It is the central concern underlying test development, administration, scoring, reporting, and the uses and interpretations of test scores. The validity of an intended interpretation of test scores relies on all the evidence accrued about the technical quality of a testing system, including test development and construction procedures, test score reliability, accurate scaling and equating, procedures for setting meaningful achievement standards, standardized test administration and scoring procedures, and attention to fairness for all test takers. The appropriateness and usefulness of ELPA21 depends on the assessments meeting the relevant standards of validity.
Discussions about test development, form construction, scaling, equating, and standard setting can be found in the related documents from ELPA21.
In this technical report, the standardized test administration can be found in Chapter 2, scoring in Chapter 4, reporting in Chapter 8, and quality control in Chapter 9.
In this chapter, validity for the summative assessment is measured on the internal structure of the items, the comparison of student abilities versus the difficulty of the items, and handscore precision analysis for the summative assessment. The domain test internal structure is measured using Cronbach’s alpha and domain dimensionality. The appropriateness of the assessment for the student population is assessed by comparing student abilities vs. test difficulties. The handscore precision is measured by the consistencies of first raters and second raters. The analysis results are summarized in the following sections for the summative assessment:
• Section 9. Summative Assessment – Cronbach Alpha
o Figure S9.1 shows the Cronbach Alpha for each domain tests across grades.
• Section 10. Summative Assessment – Dimensionality
o Figures S10.1–S10.6 present the scree plots for each domain test. If a test involves multiple forms, the plots is broken down by grade.
• Section 11. Summative Assessment – Ability vs. Difficulty
o Figures S11.1–S11.6 present the comparison of student ability vs. test difficulty on the logit scale for each domain test for each grade of students, respectively.
• Section 24. Summative Assessment – Second Rater Analysis
EVIDENCE ON INTERNAL STRUCTURE
Cronbach’s alpha (Cronbach, Lee J.; Shavelson, Richard J., 2004) is used to access the internal consistency of items in each test for each domain. It is conceptually defined as “the degree to which measures are free from error and therefore yield consistent results” (Peter, 1979, p.6). As such, it places a limit on the construct validity of a test (Peterson, 1994).
ELPA21 2017-2018 Technical Report
32
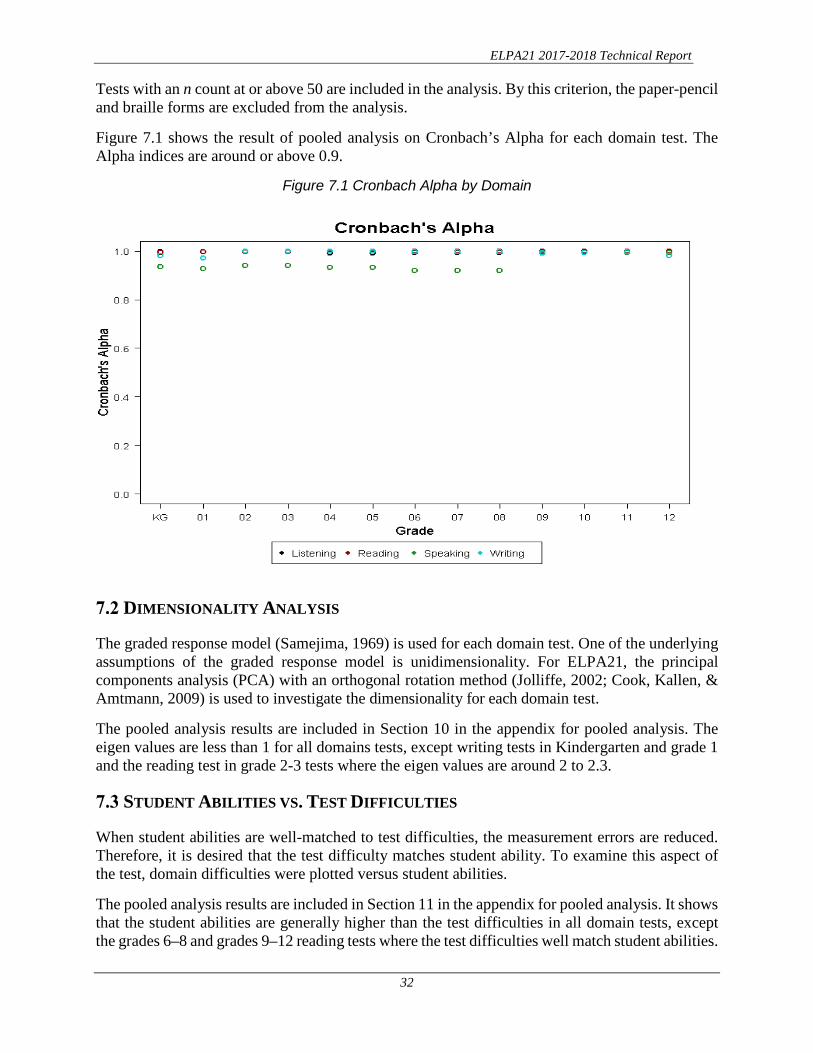
Tests with an n count at or above 50 are included in the analysis. By this criterion, the paper-pencil and braille forms are excluded from the analysis.
Figure 7.1 shows the result of pooled analysis on Cronbach’s Alpha for each domain test. The Alpha indices are around or above 0.9.
Figure 7.1 Cronbach Alpha by Domain
DIMENSIONALITY ANALYSIS
The graded response model (Samejima, 1969) is used for each domain test. One of the underlying assumptions of the graded response model is unidimensionality. For ELPA21, the principal components analysis (PCA) with an orthogonal rotation method (Jolliffe, 2002; Cook, Kallen, & Amtmann, 2009) is used to investigate the dimensionality for each domain test.
The pooled analysis results are included in Section 10 in the appendix for pooled analysis. The eigen values are less than 1 for all domains tests, except writing tests in Kindergarten and grade 1 and the reading test in grade 2-3 tests where the eigen values are around 2 to 2.3.
STUDENT ABILITIES VS. TEST DIFFICULTIES
When student abilities are well-matched to test difficulties, the measurement errors are reduced. Therefore, it is desired that the test difficulty matches student ability. To examine this aspect of the test, domain difficulties were plotted versus student abilities.
The pooled analysis results are included in Section 11 in the appendix for pooled analysis. It shows that the student abilities are generally higher than the test difficulties in all domain tests, except the grades 6–8 and grades 9–12 reading tests where the test difficulties well match student abilities.

ELPA21 2017-2018 Technical Report
33
SECOND RATER ANALYSIS
The fidelity of handscoring is monitored using a second rater. Scores from first and second raters were compared. Second raters are usually teachers, test administrators, administrators, or other qualified staff.
In 2018, there were 18 handscore items in kindergarden and 13 handscore items in each of the other grade or grade-band tests. Twenty percent of handscores were monitored by second raters.
Handscore score reliability is examined using Cohen’s weighted Kappa coefficient. The coefficient allows differential weighting of disagreement and a measure of agreement corrected for chance. In addition, the frequencies and percentages of the exact match between first rater and second rater, the exact match plus +1/-1 score differences, +2/-2 and above differences are computed. The results for both summative and screener assessments are included in the last section of the appendices for pooled analysis and each state.
Table S24.1 contains the total number of handscore items in each test, the total number of handscores that were monitored by second raters, the weighted Kappa coefficient, and the frequencies of exact matches, exact matches plus +1/-1 off, and +2/-2 or more off on item scores. The table show that, across the state, 73-80% of handscores are consistent between the first rater and the second rater; 18-28% of handscores are off by one point between two raters; and less than 2% of handscores are off by two or more points across the six tests. The weighted Kappa coefficients range from 0.81 to 0.85.
The inter-rater consistencies are also accessed by item.
ELPA21 2017-2018 Technical Report
34
For both summative and screener tests, the ELPA21 results are available in the Online Reporting System (ORS) and ORS generated paper family reports to be sent home with the students. Arkansas and Washington ordered paper score reports that were shipped to districts.
The mockups or snapshots for online reporting can be found in the Section 12 for Summative assessments and Section 22 for Screener assessment for each state.
ONLINE REPORTING SYSTEM
The ORS generates a set of online score reports that includes reliable and valid information describing student performance for students, parents, educators, and other stakeholders for both summative and screener assessments. Because the score reports on student performance are updated each time students complete tests, and those tests are handscored if needed, authorized users (e.g., school principals, teachers) may view student performance on the tests and can use the results to improve student learning. In addition to the individual student’s score report, the ORS produces aggregate score reports for teachers, schools, districts, and states. Additionally, the ORS provides participation data that help monitor the student participation rate.
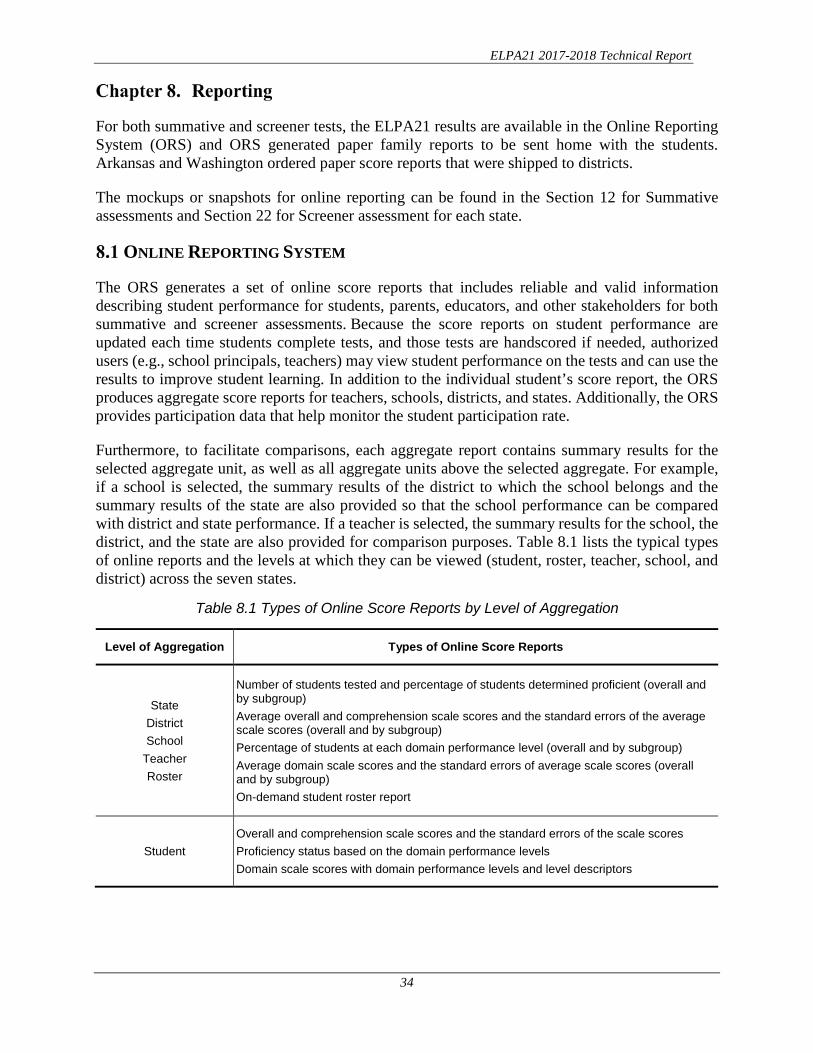
Furthermore, to facilitate comparisons, each aggregate report contains summary results for the selected aggregate unit, as well as all aggregate units above the selected aggregate. For example, if a school is selected, the summary results of the district to which the school belongs and the summary results of the state are also provided so that the school performance can be compared with district and state performance. If a teacher is selected, the summary results for the school, the district, and the state are also provided for comparison purposes. Table 8.1 lists the typical types of online reports and the levels at which they can be viewed (student, roster, teacher, school, and district) across the seven states.
Table 8.1 Types of Online Score Reports by Level of Aggregation
Level of Aggregation Types of Online Score Reports
State District School
Teacher Roster
Number of students tested and percentage of students determined proficient (overall and by subgroup) Average overall and comprehension scale scores and the standard errors of the average scale scores (overall and by subgroup) Percentage of students at each domain performance level (overall and by subgroup) Average domain scale scores and the standard errors of average scale scores (overall and by subgroup) On-demand student roster report
Student Overall and comprehension scale scores and the standard errors of the scale scores Proficiency status based on the domain performance levels Domain scale scores with domain performance levels and level descriptors

ELPA21 2017-2018 Technical Report
35
Types of Online Score Reports
The ORS is designed to help educators, students, and parents answer questions regarding how well students have performed in the assessment for each domain. The ORS is designed with great consideration for stakeholders who are not technical measurement experts (e.g., teachers, parents, students). It ensures that test results are easily readable. Simple language is used so that users can quickly understand assessment results and make valid inferences about student achievement. In addition, the ORS is designed to present student performance in a uniform format. For example, similar colors are used for groups of similar elements, such as achievement levels, throughout the design. This design strategy allows state-, district-, and school-level users to compare similar elements and to avoid comparing dissimilar elements.
Once authorized users log in to the ORS and select Score Reports, the online score reports are presented hierarchically. The ORS starts by presenting summaries on student performance by grade at a selected aggregate level. In order to view student performance for a specific aggregate unit, users can select the specific aggregate unit from a drop-down menu with a list of aggregate units (e.g., schools within a district or teachers within a school) to choose from. For more detailed student assessment results for a school, a teacher, and a roster, users can select the grade on the online score reports.
Generally, the ORS provides two categories of online score reports: aggregate score reports and student score reports. Table 8.1 summarizes the typical types of online score reports available at the aggregate level and the individual student level. Detailed information about the online score reports and instructions on how to navigate the online score reporting system can be found in the Online Reporting System User Guide for each state, accessible by the help button in the ORS, as an example shown in Figure 8.1.

ELPA21 2017-2018 Technical Report
36
Figure 8.1 ORS Page for Online Reporting System User Guide

ELPA21 2017-2018 Technical Report
37
Subgroup Report
The aggregate score reports at a selected aggregate level are provided for students overall and by subgroups. Users can see student assessment results by any subgroup. Table 8.2 presents the typical subgroups and subgroup categories provided in the ORS. Different states can have more or less subgroups, depending on the preference of the state.
Table 8.2 Types of Subgroups
Breakdown by Category Displayed Category
Ethnicity Hispanic or Latino
American Indian or Alaska Native
Asian
Black or African American
White
Native Hawaiian or Other Pacific Islander
Two or More Races
Gender Male
Female
Limited English Proficiency Status Yes
No
504 Plan Status Yes
No
Unknown/Cannot Provide
Enrolled Grade Kindergarten
Grade 01
Grade 02
Grade 03
Grade 04
Grade 05
Grade 06
Grade 07
Grade 08
Grade 09
Grade 10
Grade 11
Grade 12

ELPA21 2017-2018 Technical Report
38
PAPER REPORT
The ORS provides the functionality for users to print out reports described above. The ORS also allows users to print out the family report for each student. The mockup for the paper report can be found in the appendix for each state.

ELPA21 2017-2018 Technical Report
39
Thorough quality control has been integrated into every aspect of ELPA21 summative and screener tests. ELPA21, the states, Questar, AIR, and MI have built in multiple layers of reviews and verifications to ensure that outputs are of the highest quality in areas such as materials prepared for item writing workshops, test form constructions, test booklet development and printing, post-test score quality control processes, and reporting, The quality control for item writing workshops, test form construction, and test booklet development and printing can be found in the related documents prepared by ELPA21 and associated vendors. This chapter describes the quality control procedures related to test administrations, scoring, and reporting. The service was provided by AIR and MI.
QUALITY CONTROL IN TEST CONFIGURATION
For online summative and screener testing, the test configuration files contain the complete information required for test administration and scoring, such as the test blueprint specifications, slopes and intercepts for theta-to-scale score transformation, cut scores, and the item information (i.e., answer keys, item attributes, item parameters, passage information). The accuracy of the configuration file is checked and confirmed independently numerous times by multiple teams prior to the testing window. Scoring is also verified before the open of test windows.
Platform Review
AIR’s online test delivery system (TDS 1) supports a variety of item layouts for online test administration to many populations of students, including students who need designated supports and accommodations to test online. Each item on the assessment goes through an extensive platform device review on different operating systems, including Windows, Linux, and iOS, to ensure that the item displays consistently across all platforms. Some of the layouts have the stimulus and item response options/response area displayed side by side. In each of these layouts, both the stimulus and the response options have independent scroll bars.
Platform review is a process in which each item is checked to ensure that it is displayed appropriately (i.e., rendered) on each tested platform. A platform is a combination of a hardware device and an operating system. In recent years, the number of platforms has proliferated, and platform review now takes place on various platforms that are significantly different from one another.
Platform review is conducted by AIR’s quality assurance team. The team leader projects every item from AIR’s item tracking system (ITS2), and team members, each behind a different platform, look at the same item to ensure that it renders as expected.
User Acceptance Testing and Final Review
Both internal and external user, usually the states, acceptance testing (UAT) was conducted before the testing window opened. Detailed protocols were developed for the review process of TDS, and 1 TDS is AIR’s online test delivery system. Students take online tests via TDS. 2 ITS is AIR’s item bank for ELPA21. It contains all information that relates to each item, such as item content categories at all levels, item type, maximum score points, item statistics from each administration, etc.

ELPA21 2017-2018 Technical Report
40
reviewers were given thorough instructions to note or report issues related to system functionality, item display, and scoring.
During the internal UAT, AIR staff took all ELPA21 online tests that covered the entire range of possibilities of item responses and the complete set of scoring rules in TDS. When issues were found, AIR took immediate actions to solve them. When TDS was updated, the tests were taken again to ensure the issues were fixed. The process was repeated until all issues were resolved during the UAT period prior to operational testing.
State staff were also able to conduct a hands-on review of the system prior to the testing window opening. The states approved TDS before the system was opened for testing.
Before the ORS opened, AIR and the state staff conducted internal and external UAT of the system similar with that of TDS to ensure that the ORS would function as intended when opened to the public for scoring reporting.
QUALITY ASSURANCE IN SCORING
The quality assurance of scoring includes the assurance of the online data, the precision of handscoring, the correctness of machine scoring, and the strictness when applying the business rules in scoring. This section describes the details of scoring quality assurance.
The kindergarten and grade 1 writing supplements and the writing constructed-response items were handscored by MI. For online tests, the responses for the handscored items were transferred between AIR and MI on a rolling basis via Ledger.3 That is, as soon as a student submitted a test to TDS, the responses to handscored items were transformed into XLM format, and were then sent to Ledger, from which MI retrieved responses for hand scoring. When scoring was done, the record was sent to Ledger, from which AIR download the record for final scoring. The data transmission process is automatic.
For paper-pencil tests, after test administration, student responses were entered into the AIR Data Entry Interface (DEI) on the state testing portal for all ELPA21 domain tests, with the exception of the kindergarten and grade 1 writing supplements and the writing constructed-response items. The item responses of the writing supplements and writing constructed-response items were mailed to MI for scoring via secure shipping. After scoring, MI transmitted the scores to the Ledger system, from which AIR retrieved the item scores for final scoring. To answer speaking items, students who took paper-pencil tests spoke into the DEI directly, and the item responses followed the online procedure for scoring.
For braille tests, item responses were entered into the braille Data Entry Interface (DEI) by Test Administrators. The data were processed following the online data processing procedure, and the secure testing materials were returned to the scoring vendor, MI.
3 Ledger is an electronic system that AIR and MI use to transmit data from one vendor to the other for purposes of transmitting and reporting handscored item scores. Individual response can be tracked at all times through the ledger system before a record is reported.

ELPA21 2017-2018 Technical Report
41
Quality Assurance in Online Data
AIR’s TDS has a real-time quality monitoring component built in. After a test is administered to a student, TDS passes the resulting data to our quality assurance (QA) system. QA conducts a series of data integrity checks, ensuring, for example, that the record for each test contains information for each item, keys for multiple-choice items, score points in each item, and total number of items, and that the test record contains no data from items that have been invalidated.
Data pass directly from the Quality Monitoring System (QMS4) to the Database of Record (DoR), which serves as the repository for all test information and from which all test information for reporting is pulled. The data extract generator (DEG) is the tool that is used to pull data from the DoR for delivery to each state. AIR staff ensure that data in the extracted files match the DoR prior to delivery to the state.
Quality Assurance in Handscoring
MI’s scoring process is designed to employ a high level of quality control. The quality control procedures are implemented in each stage of the scoring process, which includes scorer recruitment, leader recruitment, training, and various reports that help to ensure scoring quality.
Scorer Recruitment/Qualifications
MI retains scorers who have years of experience in handscoring, and those scorers made up approximately 65% of the scorer pool. To complete the scorer staffing for this project, MI placed advertisements on various job boards, in local papers, in publications, and at regional colleges and universities. Recruiting events were held, and applications for scorer positions were screened by MI recruiting staff. Candidates were personally interviewed, and references and proof of a four-year college degree were collected. Candidates completed a placement test for ELA (reading, writing, and analytics) and/or mathematics. In this screening process, preference was given to candidates with previous experience scoring large-scale assessments and with subject-specific degrees (mathematics, science, teaching, English, journalism, education). Because scorers had to have a strong content-specific background, the scorer pool consisted of educators, writers, editors, and other professionals who were valued for their experience, but who were also required to set aside their own biases about student performance and accept the scoring standards.
Leadership Recruitment/Qualifications
Scoring directors and team leaders had experience as successful scorers and leaders on previous MI projects and had strong backgrounds in scoring content-specific projects. These individuals demonstrated strong organization, leadership, and management skills. All scoring directors, team leaders, and scorers were required to sign confidentiality agreements prior to training with ELPA21 materials or handling secure materials.
Each room of scorers was assigned a scoring director or assistant scoring director. This individual led the handscoring for the duration of the project and was monitored by the scoring project
4 QMS is AIR’s quality monitoring system. It ensures that the information in a student record, such as item key, score point, etc., is correct.

ELPA21 2017-2018 Technical Report
42
manager. The scoring director conducted the team leader training and was responsible for training the scorers.
In general, team leaders assisted the scoring directors/assistant scoring directors with scorer training and monitoring by working with their teams in small group discussions and answering individual questions that scorers may not have felt comfortable asking in a large group. Once scorers were qualified, the team leaders were responsible for maintaining the accuracy and workload of team members. The ongoing monitoring identified those scorers who were having difficulty scoring and resulted in individual scorers receiving one-on-one retraining. If this process did not correct inaccuracies in scoring, individual scorers were released from the project.
Training
To train ELPA21 scorers, MI scoring staff used approved rubrics and training materials. The training materials were composed of anchor, qualifying, and training responses provided by the Program. Training materials included a comprehensive annotated scoring guide for each item. The guide contained the anchor set scorers referenced while evaluating live student responses. The scoring guides also contained several typical student responses presented in score point order.
Guides included detailed annotations explaining how the scoring criteria applied to each response’s specific features and why the response merited a particular score. Guides included responses that were most useful in making scoring decisions, including some that fell within the upper and lower ranges of the score point to help scorers define the lines between score points.
Anchor and qualifying sets were designed to help the scorers learn to apply the criteria illustrated in the scoring guide, ensure that they become familiar with the process of scoring student responses, and assess the scorers’ understanding of the ELPA21 scoring criteria before they were allowed to begin live scoring.
The item-specific rubrics served as the scorers’ constant reference. Scorers were instructed on how to apply the rubrics and were required to demonstrate a clear comprehension of each anchor set by performing well on the training materials that were presented for each grade and item.
Team leaders assisted the scoring directors with the training and monitoring of scorers. The scoring director conducted the team leader training before the scorer training. This training followed much of the same process as the scorer training, but additional time was allotted for review, discussion, and addressing anticipated scorer questions and concerns. To facilitate scoring consistency, it was imperative that each team leader imparted the same rationale for each response that other team leaders used. Once team leaders qualified, leadership responsibilities were reviewed and team assignments were given. A ratio of one team leader for 8–10 scorers ensured adequate monitoring of the scorers.
Scorer training involved an intensive review of the rubric and anchor responses, provided by the scoring director, to help the scorers internalize the scoring criteria. The scoring director and team leaders led a thorough discussion of the training materials with the entire group. All responses were discussed using the annotations from rangefinding. A similar process was followed in training for writing and speaking items.
Once the scoring guidelines were discussed, scorers were required to apply the scoring criteria by qualifying (i.e., scoring with acceptable agreement to the “true” scores decided upon at

ELPA21 2017-2018 Technical Report
43
rangefinding) on at least one of the qualifying sets. Scorers who failed to achieve the qualifying criteria were given additional training to acquire the highest degree of accuracy possible. Scorers who did not perform at the required level of agreement for a given item or related group of items by the end of the qualifying process were not permitted to score live student work.
Training was an ongoing process that did not end after the qualifying rounds. Feedback was an integral part of several reliability checks that were performed throughout the project. Primarily, team leaders monitored scorers’ reliability by conducting read/listen behinds on an as-needed basis. This was a process whereby team leaders reread or re-listened to the responses and checked the scores of each scorer on their team to catch potential scorer drift so that the scorer could have immediate feedback and be retrained in a timely fashion. The percentage of read/listen behinds conducted for an individual scorer was not fixed but varied based on current levels of performance. Scorers were removed from scoring an item or a related group of items if they were unable to score consistently with the rubric and the anchor responses after retraining.
Development and rangefinding of the materials used with the 2017 administration were completed by a previous vendor. This information is available from the Program.
Handscoring Quality Assurance Monitoring Reports
MI scorer accuracy was monitored throughout the scoring sessions by producing real-time, on-demand reports to ensure that an acceptable level of scoring accuracy was maintained. Interscorer reliability was tracked and monitored with multiple quality control reports that were reviewed by MI scoring staff. These reports were reviewed by the program manager, scoring project director, scoring directors, and team leaders. The following reports, available in daily, cumulative, and summary formats, were used during handscoring:
Interscorer Reliability Reports displayed how often scorers were in exact agreement and supported maintaining an acceptable agreement rate. These reports provided exact, adjacent, and nonadjacent interscorer agreement, as well as mismatches between scores and nonscorable codes and within nonscorable codes. They also indicated the number of responses read by each scorer.
Score Point Distribution Reports displayed the percentage of responses that had been assigned each of the score points and nonscorable codes.
Validity Reports tracked how the scorers performed by comparing predetermined scored responses to scores assigned by the selected scorer on the same set of responses. If the assigned score of the selected scorer fell outside of a determined percentage of agreement, remediation occurred and additional responses were reviewed by the team leader of the individual(s) who needed to be monitored more closely.
Item Status Reports tracked each item and indicated the status (e.g., “first read complete,” “Tabled”). This report was used to monitor the overall status and progress of handscoring.
Maintaining Consistency
MI utilized numerous processes to ensure scorer accuracy and detect drift. The objective of the scoring process is to make sure that scorers rate student responses in a manner consistent with ELPA21 standards, within a single administration of ELPA21 as well as across multiple administrations.

ELPA21 2017-2018 Technical Report
44
The validity selection process involved MI scoring staff selecting 30–75 responses per item from live responses from the current administration to serve as validity responses. Validity responses were selected to illustrate trends identified by leadership in live responses but not strongly reflected in the anchor sets, represent particular types of responses identified as challenging to score during training, and assess transfer of scorers’ knowledge of the anchor responses. Vetting of new validity responses involved identification and recommendation by team leaders while conducting read/listen behinds, review and approval by scoring directors, and review and approval by the scoring project director.
The validity responses were used during handscoring to verify scorer accuracy. Validity responses were dispersed intermittently to the scorers throughout scoring at a rate of at least 10% of the total responses. These validity responses were blind reads, meaning that scorers saw these responses the same as they saw the actual live student responses; there was no distinguishable difference. This helped ensure the internal validity of the process. All scorers who received validity responses had already successfully completed the training and qualifying process.
Next, the scores that the scorers assigned to the validity responses were compared to the predetermined scores in order to determine the validity of the scorers’ scores. For each item, the percentage of exact agreement and the percentage of high and low scores were computed. The same data were also computed for each specific scorer. Using these data, various validity reports could be produced in real time and used to monitor for potential drift.
If results indicated that there was drift, or shifts in scoring over time, for a particular response, item, or scorer, immediate action was taken to correct it. This was in the form of individual scorer retraining, room-wide retraining/recalibration, and/or rescoring responses where it was determined a scorer had been errantly assigning scores. Sometimes, when a particular validity response generated low agreement, an example of a similar response could be found in the existing training materials. If this was the case, a review of that particular training response was pursued in order to realign the scorer.
Recalibration sets consisting of a validation set representing a variety of score points in random score point order were also used to maintain consistency. Sets varied in size from three to five responses based on particular issues observed during scoring. The recalibration sets were distributed at the beginning of the morning on a weekly basis. MI also recalibrated approximately once a week with scorers who had missed a required day’s scoring session and were required to recalibrate. Those scorers achieving less than an acceptable percentage of correct scores on these responses were monitored closely throughout that day. Scorers who did not demonstrate improvement received personal and extensive retraining. These scorers continued to be monitored on an individual basis until the next recalibration round took place.
By implementing these scoring procedures—using the same training materials whenever possible, utilizing a suite of real-time reports, and making training decisions based on report data—MI maximized scoring reliability and validity.
Quality Control on Final Scores
AIR’s scoring engine is used to produce final scores upon receiving handscores. Before operational scoring, AIR created mock-ups of student records to verify the accuracy of the scoring engine. Both AIR’s analysis team (responsible for the scoring engine) and psychometricians independently
ELPA21 2017-2018 Technical Report
45
computed scores on the mock-ups of student records. They compared their results iteratively until a 100% match was reached.
During operational scoring, AIR’s psychometricians independently scored students and compared the scores with the results from the scoring engine. Discrepancies were iteratively resolved until a 100% match was reached.
Before final scores were delivered to the state, they were also compared with the unofficial scores from CRESST, if needed. Discrepancies were again investigated and resolved until a 100% match was reached.
QUALITY ASSURANCE IN REPORTING
In 2017–2018, two types of score reports were produced for both summative and screener tests: online reports and printed reports (family reports only).
Online Report Quality Assurance
Every test undergoes a series of validation checks. Once the QMS system signs off, data are passed to the DoR, which serves as the centralized location for all student scores and responses, ensuring that there is only one place where the official record is stored. Only after scores have passed the QA checks and are uploaded to the DoR are they passed to the ORS, which is responsible for presenting individual-level results and calculating and presenting aggregate results. Absolutely no score is reported in the ORS until it passes all of the QA system’s validation checks.
Paper Report Quality Assurance
Statistical Programming
The family reports contain custom programming and require rigorous quality assurance processes to ensure their accuracy. All custom programming is guided by detailed and precise specifications in our reporting specifications document. Upon approval of the specifications, analytic rules are programmed and each program is extensively tested on test decks and real data from other programs. The final programs are reviewed by two senior statisticians and one senior programmer to ensure that they implement agreed-upon procedures. Custom programming is implemented independently by two statistical programming teams working from the specifications. Only when the output from both teams matches exactly are the scripts released for production. Quality control, however, does not stop there.
Much of the statistical processing is repeated, and AIR has implemented a structured software development process to ensure that the repeated tasks are implemented correctly and identically each time. AIR’s software developers write small programs called macros that take specified data as input and produce data sets containing derived variables as output. Approximately 30 such macros reside in AIR’s library. Each macro is extensively tested and stored in a central development server. Once a macro is tested and stored, changes to the macro must be approved by the director of score reporting and the director of psychometrics, as well as by the project directors for affected projects.

ELPA21 2017-2018 Technical Report
46
Each change is followed by a complete retesting with the entire collection of scenarios on which the macro was originally tested. The main statistical program is mostly made up of calls to various macros, including macros that read in and verify the data and conversion tables and macros that do the many complex calculations. This program is developed and tested using artificial data generated to test both typical and extreme cases. In addition, the program goes through a rigorous code review by a senior statistician.
Display Programming
The paper report development process uses graphical programming, which takes place in a Xerox-developed programming language called VIPP and allows virtually infinite control of the visual appearance of the reports. After designers at AIR create backgrounds, our VIPP programmers write code that indicates where to place all variable information (data, graphics, and text) on the reports. The VIPP code is tested using both artificial and real data. AIR’s data generation utilities can read the output layout specifications and generate artificial data for direct input into the VIPP programs. This allows the testing of these programs to begin before the statistical programming is complete. In later stages, artificial data are generated according to the input layout and run through the score reporting statistical programs, and the output is formatted as VIPP input. This enables us to test the entire system. Programmed output goes through multiple stages of review and revision by graphics editors and the score reporting team to ensure that design elements are accurately reproduced and data are correctly displayed. Once we receive final data and VIPP programs, the AIR score reporting team reviews proofs that contain actual data based on our standard quality assurance documentation. In addition, we compare data independently calculated by AIR psychometricians with data on the reports. A large sample of reports is reviewed by several AIR staff members to make sure that all data are correctly placed on reports. This rigorous review is typically conducted over several days and takes place in a secure location at AIR. All reports containing actual data are stored in a locked storage area. Prior to printing the reports, AIR provides a live data file and individual student reports with sample districts for the state staff review. AIR works closely with each state to resolve questions and correct any problems. The reports are not delivered until the state approves the sample reports and data file.
ELPA21 2017-2018 Technical Report
47
REFERENCES
American Educational Research Association, American Psychological Association, & National Council on Measurement in Education. (2014). Standards for educational and psychological testing. Washington, DC: American Educational Research Association.
American Institutes for Research. (2017). Additional Rules for 2018 Spring ELPA21 Summative Test Scoring. Washington, DC: Author.
Cook, K. F., Kallen, M., & Amtmann, D. (2009). Having a fit: Impact of number of items and non-normality on tests of IRT’s unidimensionality assumption. Quality of Life Research, 18(4), 447–460.
Cronbach, L. J., & Shavelson, R. J. (2004). My Current Thoughts on Coefficient Alpha and Successor Procedures. Educational and Psychological Measurement, 64(3), 391–418.
Gibbons, R. D., Bock, R. D., Hedeker, D., Weiss, D. J., Segawa, E., Bhaumik, D. K., & Stover, A. (2007). Full-information item bifactor analysis of graded response data. Applied Psychological Measurement, 31(1), 4–19.
Han, K. C. T., & Paek, I. (2014). A review of commercial software packages for multidimensional IRT modeling. Applied Psychological Measurement, 38(6), 486–498.
Jolliffe, I. (2002). Principal Component Analysis (2nd ed). New York: Springer.
Nunnally, J. C. (1978). Psychometric Theory, 2d ed., New York: McGraw-Hill.
Peter, J. P. (1979). Reliability: A Review of Psychometric Basics and Recent Marketing Practices. Journal of Marketing Research, 16(1), 6–17.
Peterson, R. A. (1994). A Meta-Analysis of Cronbach’s Coefficient Alpha. Journal of Consumer Research, 21, 381–391.
Reckase, M. D. (2009). Multidimensional Item Response Theory. New York: Springer.
Rudner, L. M. (2005). Expected Classification Accuracy. Practical Assessment Research & Evaluation, 10(13). https://pareonline.net/pdf/v10n13.pdf
Samejima, F. (1969). Estimation of Latent Ability Using a Response Pattern of Graded Scores (Psychometric Monographs No. 17). Richmond, VA: Psychometric Society.
Sireci, S. G., Thissen, D., & Wainer, H. (1991). On the reliability of testlet-based tests. Journal of Educational Measurement, 28(3), 234–247.
Yurdugul, H. (2008). Minimum Sample Size for Cronbach’s Coefficient Alpha: A Monte Carlo Study. Hacettepe. Üniversitesi Journal of Education, 35, 397–405. https://www.researchgate.net/publication/268809872_Minimum_Sample_Size_for_Cronbach%27s_Coefficient_Alpha_A_Monte_Carlo_Stdy.