Embed Size (px)
Citation preview
Chapter: 2/Participation in EducationSection: Elementary/Secondary Enrollment
For more information, see the Reader’s Guide and the Guide to Sources.
English Language Learners
The percentage of public school students in the United States who were English language learners (ELL) was higher in 2010–11 (10 percent) than in 2002–03 (9 percent). In 2011, the achievement gaps between ELL and non-ELL students in the NAEP reading assessment were 36 points at the 4th-grade level and 44 points at the 8th-grade level.
English language learner (ELL) refers to students being served in appropriate programs of language assistance (e.g., English as a Second Language, High Intensity Language Training, bilingual education). The percentage
of public school students in the United States who were English language learners was higher in 2010–11 (10 percent, or an estimated 4.7 million students) than in 2002–03 (9 percent, or an estimated 4.1 million students).
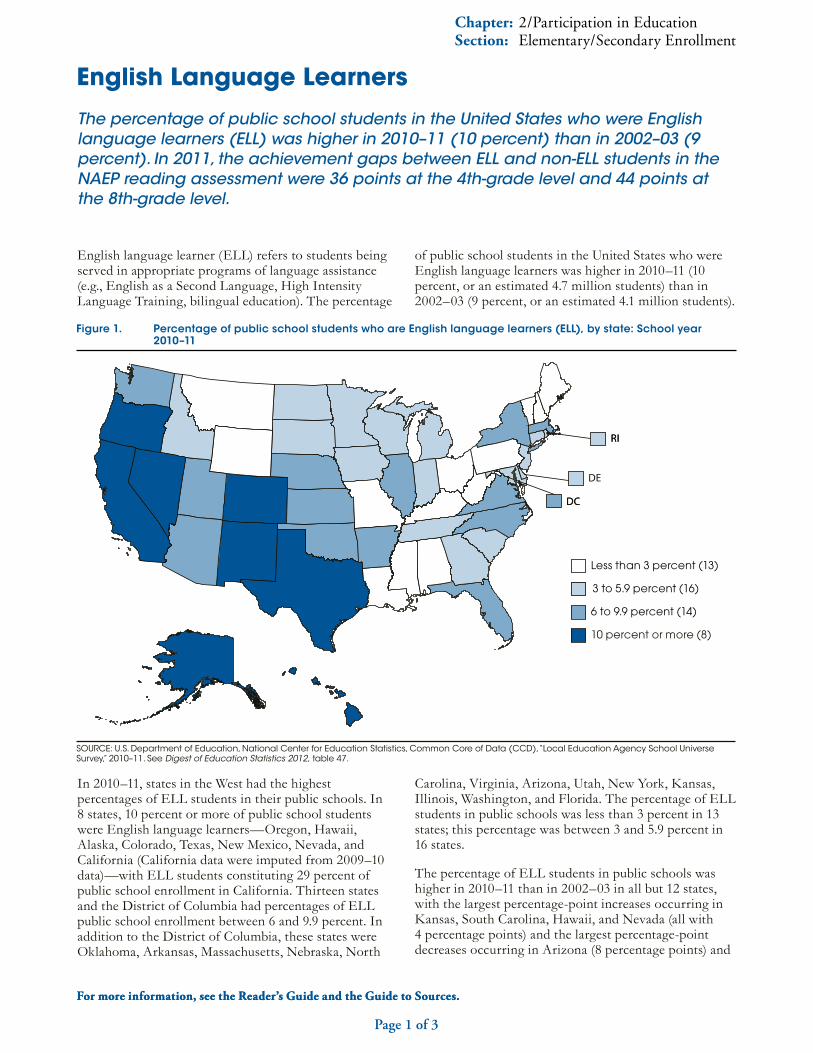
Figure 1. Percentage of public school students who are English language learners (ELL), by state: School year 2010–11
Less than 3 percent (13)
6 to 9.9 percent (14)
DE
RI
DC
RI
DC
3 to 5.9 percent (16)
10 percent or more (8)
SOURCE: U.S. Department of Education, National Center for Education Statistics, Common Core of Data (CCD), “Local Education Agency School Universe Survey,” 2010–11. See Digest of Education Statistics 2012, table 47.
In 2010–11, states in the West had the highest percentages of ELL students in their public schools. In 8 states, 10 percent or more of public school students were English language learners—Oregon, Hawaii, Alaska, Colorado, Texas, New Mexico, Nevada, and California (California data were imputed from 2009–10 data)—with ELL students constituting 29 percent of public school enrollment in California. Thirteen states and the District of Columbia had percentages of ELL public school enrollment between 6 and 9.9 percent. In addition to the District of Columbia, these states were Oklahoma, Arkansas, Massachusetts, Nebraska, North
Carolina, Virginia, Arizona, Utah, New York, Kansas, Illinois, Washington, and Florida. The percentage of ELL students in public schools was less than 3 percent in 13 states; this percentage was between 3 and 5.9 percent in 16 states.
The percentage of ELL students in public schools was higher in 2010–11 than in 2002–03 in all but 12 states, with the largest percentage-point increases occurring in Kansas, South Carolina, Hawaii, and Nevada (all with 4 percentage points) and the largest percentage-point decreases occurring in Arizona (8 percentage points) and
Page 1 of 3
For more information, see the Reader’s Guide and the Guide to Sources.

Chapter: 2/Participation in EducationSection: Elementary/Secondary Enrollment
For more information, see the Reader’s Guide and the Guide to Sources.
New Mexico (6 percentage points). The percentage of ELL students in public schools was higher in 2010–11 than in 2009–10 in just over half of the states (28 states), with the largest increase in percentage points occurring in Nevada (3 percentage points) and the largest decrease in percentage points occurring in Minnesota (2 percentage points).
In 2011 and in all previous assessment years since 2002, the National Assessment of Educational Progress (NAEP) reading scale scores for non-ELL 4th- and 8th-graders were higher than their ELL peers’ scores. This disparity is known as an achievement gap—in NAEP reading scores, the achievement gap is seen by the differences between the average scores of two student
Figure 2. Average reading scores of 4th-grade students, by English language learner (ELL) status: Selected years, 2002–11
Year
Scale score
Non-ELL students
ELL students
0
150
175
200
225
250
275
300
500
2002 2003 2005 2007 2009 2011
Figure 3. Average reading scores of 8th-grade students, by English language learner (ELL) status: Selected years, 2002–11
NOTE: Scale ranges from 0 to 500. SOURCE: U.S. Department of Education, National Center for Education Statistics, National Assessment of Educational Progress (NAEP), selected years, 2002–11 Reading Assessments, NAEP Data Explorer. See Digest of Education Statistics 2012, table 142.
NOTE: Scale ranges from 0 to 500. SOURCE: U.S. Department of Education, National Center for Education Statistics, National Assessment of Educational Progress (NAEP), selected years, 2002–11 Reading Assessments, NAEP Data Explorer. See Digest of Education Statistics 2012, table 142.
Year
Scale score
Non-ELL students
ELL students
0
150
175
200
225
250
275
300
500
2002 2003 2005 2007 2009 2011
Page 2 of 3
Chapter: 2/Participation in EducationSection: Elementary/Secondary Enrollment
For more information, see the Reader’s Guide and the Guide to Sources.
subgroups on the standardized assessment. In 2011, the achievement gap between non-ELL and ELL students was 36 points at the 4th-grade level and 44 points at the 8th-grade level. At grade 4, this achievement gap was not measurably different from that in any assessment year
since 2002. At grade 8, the achievement gap between non-ELL and ELL students in reading scores was 3 points smaller in 2011 than in 2009 (47 points), but not measurably different from the achievement gap in 2002.
Page 3 of 3
Reference table: Digest of Education Statistics 2012, tables 47, 142
Glossary: Achievement gap, English language learner, Public school