Embed Size (px)
Citation preview

THE EFFECT OF USING COOPERATIVE INTEGRATED READING
AND COMPOSITION (CIRC) TECHNIQUE ON STUDENTS’
READING COMPREHENSION AT THE EIGHT GRADE
OF JUNIOR HIGH SCHOOL 06 BATANGHARI
THESIS
ANGGIA WAHYUNI
TE. 140963
ENGLISH EDUCATION PROGRAM
FACULTY OF EDUCATION AND TEACHER TRAINING
THE STATE ISLAMIC UNIVERSITY OF STS JAMBI
2018

THE EFFECT OF USING COOPERATIVE INTEGRATED READING
AND COMPOSITION (CIRC) TECHNIQUE ON STUDENTS’
READING COMPREHENSION AT THE EIGHT GRADE
OF JUNIOR HIGH SCHOOL 06 BATANGHARI
THESIS
Submitted as Partial Fulfillment of the Requirements to Gain an Undergraduate
Degree (S.1) in English Education
ANGGIA WAHYUNI
TE. 140963
ENGLISH EDUCATION PROGRAM
FACULTY OF EDUCATION AND TEACHER TRAINING
THE STATE ISLAMIC UNIVERSITY OF STS JAMBI
2018


DEDICATION
Thanks to Allah SWT, The most Gracious, The most Merciful
for the blessing and leading me.
I could finally finish writing this thesis.
Sholawat to the Prophet Muhammad SAW.
His coming really changed the world
This Thesis I dedicate special to:
My adored father M. SALEH, A.Md., my adored mother HARTATI, my
beloved sister PUSPA NIRWANA, S.IP. and my beloved brothers DEDY
HARWANSYAH and BENY KURNIAWAN, S.H. who always love and
encourage me and never stop praying for my success now and in the future with
endless love, always being with and guiding me, your prayers are really powerful.
My lovely Friends Yusnida Tanjung, Diah Oktriana, Titis Eka Rahayu, Ani
Safitri, All members of Rempong’s Squad who always stand by me no matter
what you guys are always there beside me, support me, help me and won‟t let my
tears down.
Thanks a lot to all of my classmate (PBI C 2014), my KKN friends, and my PPL
friends who cannot say your name one by one, thank you for being my best
friends in giving support every day, thanks for help, suggestions and spirit in
arranging this thesis, without all of you I don‟t mean.
May Allah SWT always bless us.
Aamiin .

MOTTO
بسم ٱلله ٱلرحم ن ٱلرحيم
علق (١)اق رأباسمربكالذيخلق (٢)خلقاإلنسانمن
(٣) اق رأوربكاألكرم (٤) الذيعلمبالقلم (٥)علماإلنسانمالمي علم
Meaning: Recite in the name of your Lord who created. Create man from a
clinging substance. Recite and your Lord is the most Generous. Who taught by the
pen (Al- Alaq, 1-5)
(Al-Qur‟an Al- Kareem in English Translation, 2018)
Artinya: “Bacalah (wahai Muhammad) dengan nama Tuhanmu yang menciptakan
(sekalian makhluk). Ia menciptakan manusia dari sebuku darah beku; Bacalah,
dan Tuhanmu Yang Maha Pemurah,yang mengajarkan manusia melalui pena dan
tulisan.

ACKNOWLEDGEMENT
Alhamdulillahirabbil‟alamin, thanks to Allah SWT because the writer
could complete this research as one of the requirements for getting undergraduate
degree (S1) in English Department of Tarbiyah faculty of State Islamic University
Sulthan Thaha Saifuddin Jambi by presenting a thesis entitled: “The Effect of
using Cooperative Integrated Reading and Composition (CIRC) Technique on
Students’ Reading Comprehension at the Eight Grade of Junior High School
06 Batanghari”
The writer would not have been completed without supports, guidance,
advice and special recognition for their invaluable help in accomplishing this
thesis. Therefore, the writer would like to express deep appreciation to:
1. Dr. H. Hadri Hasan, MA as a rector of the state Islamic University Sulthan
Thaha Saifuddin Jambi
2. Prof. Dr. Sualdi, M.A.Phd, Dr. H. Hidayat, M.Pd, and Dr. Hj. Fadila
Husen, M.Pd as the vice rectors I, II, III of The State Islamic University
Sulthan Thaha Saifuddin Jambi
3. Dr. Hj. Armida, M.Pd.I as the Dean of Tarbiyah Faculty and Teacher
Training The State Islamic University Sulthan Thaha Saifuddin Jambi
4. Dr. H. Lukman Hakim, M.Pd, Dr. Zawaki Afidal Jamil, M.Pd.I, Dr.
Kemas Imran, M.Pd.I as the vice dean I, II, and III Tarbiyah Faculty and
Teacher Training The State Islamic University Sulthan Thaha Saifuddin
Jambi
5. Amalia Nurhasanah, M.Hum as the chief of English Study Program in
Tarbiyah Faculty of State Islamic University Sulthan Thaha Saifuddin
Jambi
6. Dr. Siti Raudhatul Jannah, M.Pd.I as the first advisor who has given a lot
of input such as correction, idea, and contribution of thought and
beneficial idea toward the progress of this thesis

7. Faiqah Mahmudah, M.Pd as the second advisor who has given a lot of
input such as correction, idea, and contribution of thought and beneficial
idea toward the progress of this thesis
8. All of lectures in Tarbiyah Faculty of State Islamic University Sulthan
Thaha Saifuddin Jambi who have given knowledge to the writer.
9. Drs. Indra Darmius as the Principle of Junior High School 6 Batanghari
and his staff and teachers who have given their kindness as long as the
writer took the data
10. Zamris, S.Pd, the English teacher of Junior High School 6 Batanghari who
has given the writer guide and advice in conducting the research.
Finally, the writer expects this thesis will give contribution to be teaching
of English especially. The writer hopes critics and suggestions of the readers for
the perfection of this thesis. May Allah SWT always give guidance and blessing
for me and readers. Aamiinyarabbalalamin.
The writer,

ABSTRACT
Name : Anggia Wahyuni
Major : English Educational Program
Tittle : The Effect of Using Cooperative Integrated Reading and
Composition (CIRC) Technique on Students’ Reading
Comprehension at the Eight Grade of Junior High School 06
Batanghari
This study aimed to find out the effect of using cooperative integrated
reading and composition (CIRC) technique on students‟ reading comprehension at
the eight grade of junior high school 06 batanghari, this research was quantitative
research and it was conducted by using quasi-experimental design with
nonequivalent control group design . The subject of this research was 50 students,
25 students in experimental class and 25 students in control class. The result of
the analysis indicated that the mean of post-test score in experimental class
(72.30) was higher than the mean of pre-test score in experimental class (48.16)
and the score of t-test by using paired sample t-test with a significant level (α)
0.05 was ttest ≥ ttable (-20,30 ≥ -2,02). So that H0 was rejected. It means there was a
significant effect on students‟ reading comprehension before and after being
taught by using cooperative integrated reading and composition (CIRC)
technique. Next, the result of the analysis indicated that the mean of post-test
score in experimental class (72.30) was higher than the mean of post-test score in
control class (57.28) and the score of t-test by using independent sample t-test
with a significant level (α) 0.05 was ttest ≥ ttable (3,53 ≥ 2,02). So, H0 was rejected.
It means, there was a significant differences on students‟ reading comprehension
between the students‟ taught by using cooperative integrated reading and
composition (CIRC) technique and those who were not at the eight grade of junior
high school 06 batanghari.
Keyword : CIRC Technique, Reading Comprehension.

ABSTRAK
Nama : Anggia Wahyuni
Jurusan : Pendidikan Bahasa Inggris
Judul : Pengaruh menggunakan CIRC Teknik terhadap Pemahaman
Membaca Siswa pada kelas delapan di SMP 06 Batanghari.
Penelitian ini bertujuan untuk mengetahui pengaruh menggunakan teknik
CIRC terhadap pemahaman membaca siswa pada kelas delapan di SMP 06
Batanghari, penelitian ini adalah kuantitatif, yang menggunakan quasi
eksperimental design dan subjek penelitian ini adalah 50 siswa. 25 siswa di kelas
percobaan dan 25 kelas di kelas kontrol Dari hasil analisis peneliti mengindikasi
bahwa hasil dari rata-rata nilai post-test dikelas eksperimen (72.23) lebih tinggi
dari nilai rata-rata pre-test dikelas eksperimen (48,16) dan hasil dari paired sample
t-test dengan signifikansi 0,05 adalah ttest ≥ ttable (-20,30 ≥ -2,02). jadi, H0 ditolak.
Itu artinya ada pengaruh yang signifikan terhadap pemahaman membaca siswa
sebelum dan sesudah diajarkan dengan menggunakan teknik CIRC. Selanjutnya,
dari hasil analisis peneliti mengindikasi bahwa hasil dari rata-rata nilai post-test
dikelas eksperimen (72,32) lebih tinggi dari nilai rata-rata post-test dikelas kontrol
(57,28) dan hasil dari independent sample t-test dengan signifikansi 0,05 adalah
ttest ≥ ttable (3,53 ≥ 2,02), jadi, H0 ditolak. Itu artinya ada perbedaan yang signifikan
pada pemahaman membaca siswa yang menggunakan teknik CIRC dengan siswa
yang tidak menggunakan teknik CIRC pada kelas delapan di SMP 06 Batanghari.
Kata Kunci : Teknik CIRC, Pemahaman Membaca.
TABLE OF CONTENT
Page of Tittle ...........................................................................................................
Official Note........................................................................................................... i
Thesis Approval .................................................................................................... ii
Originality Statement ........................................................................................... iii
Dedication ............................................................................................................ iv
Motto ..................................................................................................................... v
Acknowledgement................................................................................................ vi
Abstract .............................................................................................................. viii
Abstrak ................................................................................................................. xi
Table of Content .................................................................................................... x
List of Table ........................................................................................................ xii
List of Appendix ................................................................................................ xiii
CHAPTER I : INTRODUCTION
A. Background of The Research .................................................................... 1
B. Identification of The Problem ................................................................... 3
C. Limitation of The Problem ........................................................................ 4
D. Formulation of The Problem ..................................................................... 4
E. Purpose of The Research ........................................................................... 5
F. Significance of The Research.................................................................... 5
CHAPTER II : REVIEW OF RELATED LITERATURE
A. Theory Framework .................................................................................... 6
B. Relevant Studies ...................................................................................... 16
C. Conceptual Framework ........................................................................... 18
D. Hypothesis of The Research .......................................................................

CHAPTER III : METHODOLOGY OF THE RESEARCH
A. Place and Time of The Research ............................................................. 21
B. Design of The Research .......................................................................... 21
C. Population and Sample ............................................................................ 22
D. Variable of The Research ........................................................................ 24
E. Instrument of Data Collecting ................................................................. 24
F. Technique of Analysis The Data ............................................................. 26
G. Statistical Hypothesis .............................................................................. 32
H. Schedule of The Research ....................................................................... 33
CHAPTER IV RESEARCH FINDING AND INTERPRETATIONS
A. The Descriptive Analysis ........................................................................ 35
B. Statistical Analysis .................................................................................. 38
C. Interpretations ......................................................................................... 43
CHAPTER V
A. Conclusion .............................................................................................. 46
B. Suggestion ............................................................................................... 47
REFERENCES
APPENDIX
CURRICULUM VITAE
LIST OF TABLE
Table 2.1 Generic Structure of Descriptive Text .................................................. 9
Table 2.2 Generic Structure of Recount Text ..................................................... 11
Table 2.3 Global Problem in Teaching and Learning Process of Reading ......... 20
Table 3.1 The Nonequivalent Control Group ..................................................... 22
Table 3.2 Population of The Research ................................................................ 23
Table 3.3 Total Sample of Population ................................................................ 24
Table 4.1 Students‟ Score of Experimental Class ............................................... 35
Table 4.2 Students‟ Score of Control Class ........................................................ 37
Table 4.3 The Result of Normality Test Pre-test ................................................ 39
Table 4.4 The Result of Normality Test Post-test ............................................... 40

LIST OF APPENDICES
Appendix 1 : Kisi-Kisi of Instruments ........................................................... 51
Appendix 2 : The Instruments and Answer Key of The Test ........................ 52
Appendix 3 : Students Score .......................................................................... 59
Appendix 4 : The Result of Normality Test ................................................... 61
Appendix 5 : The Result of Homogeneity Test ............................................. 77
Appendix 6 : The Result of Paired Sample T-test ......................................... 83
Appendix 7 : The Result of Independent Sampl T-test .................................. 86
Appendix 8 : Table Lilliefors ......................................................................... 90
Appendix 9 : Table Z .................................................................................... 91
Appendix 10 : Table Distribution F ................................................................. 92
Appendix 11 : Table Distribution T ................................................................. 96
Appendix 12 : Lesson Plan in Experimental Class .......................................... 97
Appendix 13 : Lesson Plan in Control Class ................................................. 111
Appendix 14 : Syllabus Curriculum 2013 ...................................................... 125
Appendix 15 : Documentation ....................................................................... 131

CHAPTER I
INTRODUCTION
A. Background of the Research
English is an international language. Every human being needs language
as a medium of communication between individuals or even nations. This
language used in sciences, knowledge, and technology as well as education,
business and other activities inn world. In the past, English is the first foreign
language which is taught formally in junior high schools and senior high schools
in Indonesia and now it is also taught in elementary schools even in some
kindergartens. In fact, although English is not the new thing for junior high
school students, but they still get many difficulties in learning English because
English is neither their native language nor their second language. Such condition
makes the students not acquainted with English, whether in spoken or written
form. In teaching English, there are four language skills which should be teach to
the students. The skills are speaking, listening, reading and writing. The four skills
can be divided into two types there are receptive skills and productive skills.
According to Harmer (2007, p. 265), receptive skills (Listening and Reading) are
skills to summarize the meaning of discourse, while productive skills (Speaking
and Wriitng) are skills where students must produce their own language.
The four skills are essential in teaching and learning English. One of
them is reading. Reading is one of the English skill that is important to be improve
especially for academic. Reading is the way a person gets information from
written texts and words. Harmer (1991, in Darmayanti, 2014) stated that reading
is a skill controlled by the eyes and the brain. The eyes receive messages and then
the brain must determine the meaning of the messages. People read for various
reasons. They can read for pleasure when reading a story book, or for knowledge
as when reading a history book. In other words, Reading is important to readers
because they can increase their knowledge and get information after reading (Ayu,
et al. 2017)

Reading comprehension has multiple definitions and explanation.
According to Snow (2010, p. 417), reading comprehension is a complex activity
that involves interaction between the reader and the text. It means that to build
comprehension, there are two elements the readers itself and the text. The readers
build connection with the text to know the writers purpose in the text. It is a
process which involves between the readers and the reading materials to get
comprehension and meaning of the text.
Based on the result of interview that doing by the writer to some of the
eight grade students of Junior High S chool 06 Batanghari, the writer concluded
that the students have difficulties in reading comprehension, such as lack of
vocabulary, the concept of the words, unfamiliar syntatical grammar, etc. Beside
that, the students felt uninteresting when they were in process of learning the
English because the teacher just asked the students to read the text every meeting,
identifying the difficult words, translating the words and look up the dictionary if
they didn‟t know the meaning. This condition becomes the reason why the writer
wants to conduct a research by using technique that is cooperative integrated
reading and composition (CIRC) which will help the students to increasing their
ability of reading comprehension.
Cooperative integrated reading and composition (CIRC) technique is one
of the learning techniques based on cooperation that is designed to develop
reading, writing and other language skills in the education. Slavin (1995, p. 104)
proposes that CIRC is a comprehensive program for reading and writing in the
upper elementary grades. While, according to Zainuddin (2015, p. 15), CIRC
came from cooperative learning which makes it easier for students to understand
the text given. Moreover, according to Slavin (2005, p. 186), Cooperative learning
can be defined as a learning approach in with small, mixed student group form
both in the class and out of the class environments to ensure students each other in
learning an academic subject in the scope of a common goal; where their self
esteem increases and their communication, solving - problem and critical

thinking skills develop; and where they actively participate in the teaching-
learning process.
CIRC is group of study that consists of students from different levels to
work of a series cooperative activities, partner reading, making predictions, etc.
The steps of applying CIRC in the class sre teacher presentation, grouping
consisted of four or three students, giving a text that appropriate with the topic,
working in group in doing some tasks based on the text and topic, discussion (they
will work together until all the members of group understand about the text, so
they can identify the text and answer the questions of reading comprehension
exercises), presenting the result of students‟ work, teacher‟ conclusion, and
closing. According to Suprijono (2009, p. 130-131), some steps of conducting
CIRC that students can be active in joining the teaching learning process are: a).
Grouping the class that consists of four students heterogeneously; b). Teacher
gives a text/ clipping which is appropriate with the topic; c). Students work
together in reading and finding main idea and giving idea toward the discourse/
clipping which is and they are written on paper; d). Presenting/reading the result;
e). Teacher gives conclusion together; f). Closing. Therefore, the goals of
cooperative integrated reading and composition is to improve reading
comprehension by minimizing the heterogeneous of students‟ ability in order to
make the teacher easy to teach in teaching learning process.
Based on the explanation and problems above, the researcher intends to
conduct the research entitled, “The Effect of using Cooperative Integrated
Reading and Composition (CIRC) Technique on Students’ Reading
Comprehension at the Eight Grade of Junior High School 06 Batanghari”.
B. Identification of the Problem
In this research, the writer identifies about the problem that related to
learning reading. In fact, reading skill is very less to implement in the learning
process. The students have difficulties in reading comprehension, such as lack of
vocabulary, the concept of the words, unfamiliar syntatical grammar. Beside that,

the students felt uninteresting when they were in process of learning the English
because the teacher just asked the students to read the text every meeting,
identifying the difficult words, translating the words and look up the dictionary if
they didn‟t know the meaning.
C. Limitation of the Problem
In this research, in order not to deviate from its original purpose and
given the limitations, capabilities and time that the authors have, as well as to
study and achieve the targeted goals, there should be restrictions on the problem,
they are :
1. This research examines English language lessons especially in student
reading skill
2. In this research, the researcher only focuses on the students at the
eighth grade of Junior High School 6 Batanghari.
3. The influence of CIRC Technique for the reading skill.
D. Formulation of the Problem
The problems of this research are formulated as follows:
1. Is there any significant effect on students‟ reading comprehension before
and after being taught by using cooperative integrated reading and
composition (CIRC) technique at the eighth grade of Junior High
School 6 Batanghari. ?
2. Is there any significant difference on students‟ reading comprehension
between the students who taught by using cooperative integrated reading
and composition (CIRC) technique and those who were not at the
eighth grade of Junior High School 6 Batanghari. ?
E. Purpose of the Research
The purpose of this research as follows:
1. To know the effect on students‟ reading comprehension before and after
being taught by using cooperative integrated reading and composition
(CIRC) technique at the eighth grade of Junior High School 6 Batanghari.
2. To find out the difference on students‟ reading comprehension between the
students who taught by using cooperative integrated reading and
composition (CIRC) technique and those who were not at the eighth grade
of Junior High School 6 Batanghari.
F. Significance of the Research
Hopefully, the result of this research is useful for teacher, students, and
all readers. The results will be used for the following:
1. For the teacher
The research expected to can be an alternative strategy in teaching
reading and make the English teacher knows that teaching reading is don‟t uses
monotonous teaching.
2. For the student
The research expected to help students increase their ability in learning
reading, and make students interest in learning reading.
3. For the writer
This research will help the writer to enlarge, improve the skills and
knowledge in conducting the research to find out the effect of using CIRC toward
the students‟ reading comprehension.
CHAPTER II
REVIEW OF RELATED LITERATURE
A. Theory Framework
1. Reading Comprehension
According to Tarigan (2008, p. 9), reading is a process in which done by
reader to get message or information from the writer through printed media. It is
very complex process in which recognize and comprehend written symbols are
influenced by perceptual skill, decoding, experiences, language background, mind
set and reasoning of reader.
Reading comprehension has multiple definitions and explanation.
Comprehension has same meaning with understanding. It is capability to grasp
meaning in a text and also the writer‟s idea. It is readers‟ ability to understand the
author‟s message which is influenced by their background knowledge in the topic
given by the text. According to Hornby (1995, p.235), comprehension is means
and has excessive aimed in improving or testing one‟s understands of a language
whether written or spoken. Comprehension is not only need in student‟s reading
activities, but also to measure the ability of each student in classroom. Snow
(2010, p. 417) said that reading comprehension is a complex activity that involves
interaction between the reader and the text.
Carrel (1988, p. 213) stated that reading comprehension in general
viewed is the resulting from the four way interaction between readers, text, task,
and structured activity. The success of this interaction depends of the availability
of quality of content and strategist schemata to new problem solving
situations. Moreover, reading comprehension is the process of simultaneously
extracting and constructing meaning through interaction and involvement with
written language. It entails three elements: the reader who is doing the
comprehending, the text that is to be comprehended, and the activities.

In short, reading comprehension is the act of understanding what readers are
being read. It is an intentional, active, interactive process that occurs before,
during and after a person reads a particular piece of writing.Without
comprehension, reading is nothing more than tracking symbols on a page with
eyes and sounding them out. People read for many reasons but understanding is
always a part of their purpose. Reading comprehension is important because
without it, reading doesn‟t provide the reader with any information.
According to Nuttal in Somadoyo (2011, p. 11), the purpose of reading is
a part of the process on reading comprehension, readers get the message or
meaning of the text, the message can be in the form of information of the text.
Tarigan in Somadoyo (2011, p.12) stated that the main purpose of reading
comprehension to find the answer in questions that is provided by the reader based
on the text of the reading. According to Grabe and Stoller (2009, p. 11) purposes
of reading into several points, they are as follows (1) Reading to search for simple
information; (2) Reading to skim quickly; (3) Reading to learn from the text; (4)
Reading to integrated information; (5) Reading to write; (6) Reading critique
texts; (7) Reading for general comprehension.
Based on the purpose of reading comprehension above, it can be
conclude that reading comprehension has a purpose to seek and obtain the
information, and make closely connected to a person‟s motivation for reading.
According to English Syllabus of School Unit Level Curriculum (K13),
there are two kinds of texts that must be learned by students. There are short
functional texts and text types. The short functional texts are short English texts
which exist in real life for example announcements, invitations, greeting cards,
etc. The text types include narrative, recount, and descriptive texts. Based on K13,
in the first semester at the eight grades using descriptive and recount text. As
stated in the basic competences and the syllabus of School Unit Level Curriculum,
there are kinds of texts are taught in order that students will achieve reading
comprehension. And the appropriate level for the eighth grade is literal
comprehension level that is a level of proficiency in which students can

communicate using both written and oral language to get things done. In this
research, the writer used Descriptive and Recount text.
1. Descriptive Text
Anderson (2003, p. 26) said that descriptive text describes particular
person, place, or things. Meanwhile, according to Zumakhsin (2005) in Fitri‟s
journal (2017, p. 3) , descriptive text is to describe what we see. In conclusion,
from all theories of descriptive text the writer make conclusion that descriptive
text is a text to retell about person, thing, and place. Its purpose is to describe and
reveal a particular person, place, or thing.
a) Generic Structure of Descriptive Text
According to Bamanti and Oktaviani (2011, p. 50) the generic structure of
descriptive text is divided into two parts, there are:
1. Identification
It identifies the particular participant (person, place, thing, etc) that
will be described.
2. Description
It describes the particular participant detail including the physical
description, characteristic, etc.
b) The languages features in a descriptive text
1. Focusing on specific participants (person, place, animal, thing),
2. The use of attributive and identifying processes,
3. Frequent use of epithets classifiers in nominal groups (adjective use),
4. The use of Simple Present Tense.
c) The Example of Descriptive Text
Adapted from 2nd
grade junior high school of English text book in fitri‟s
thesis (2017, p. 23), the example of recount text can be see in table below :

Table 2.1 Generic Structure of Descriptive Text
Generic Structure Barack Obama
Identification Barack Obama is the most phenomenal state
leader oF USA. He was broken the myth of the
impossibilities. He become the first black US
president. He was underestimated since the
nomination but the finally won the ticket to the
White House where he lives and manages US.
Description His full name is Barack Hussein Obama.
People often call him Barack Obama or Obama
only. He is African-American. He was born on 4
August 1961 in Honolulu, USA. Obama is quite
tall, 183 cm. He has oval face, baldheaded, and
black skin. His face looks patient and strong. He
always keeps smiles when he gives speech.
Obama has got married to Michelle. They have 2
daughters, Malia and Natasha Obama. Obama‟s
hobby is having sport. He likes playing golf in
his spare time. Obama also loves blogging. He
writes on his twitter quite often.
2. Recount Text
Anderson (1997, p. 48) in Junariyah (2014) stated that recount text is a
pieces of a text that retells past events, usually in the order in which they
happened. This statement also supported by Pardiyono (2006, p. 58) in Nurvasari
(2017), he said that recount text is the record of events in the past time. In

addition, Hartono (2005, p. 6) stated that the sosial function of recount text is to
retell events for the purpose of informing or entertaining.
From those statements above, it can be conclude that recount text is a text
which retells events or xperiences in the past to inform or entertain the audience
(listeners or readers), or both.
a) Generic Sturucture of Recount Text
There are three important generic structures that take account on recount
text. According to Harris (1993, p. 42) in Nurvasari (2017), the structure of the
recount text are orientation, events, and evaluation.
1. Orientation
This is the introductory part of the story. It provide the background
information where the author tell the reader who is in the story, where the
story is happening, and when the story take place. From this part the reader
can get the insight what will happens in the next part of the story.
2. Events
It present events; what people do ? It tells the events chronologically.
It uses conjuctions or connectives like: first, next, then, finally and so on.
They show sequence of events.
3. Re-orientation
It presents the concluding comments. It expresses the author‟s
personal opinion regarding the events described.
b) Language Feature of Recount Text
There are some of language feature in recount text. According to
Anderson (1997, p. 50) in Junariyah (2014), the language featurs usually found in
a recount text are :

a) Proper nouns to identify those involved in the text
b) Descriptive words to give details about who, when, where, what, and how
c) The use of the past tense to retell the events
d) Words that show the order of events (for example: first, next, then, etc)
c) The Example of Recount Text
Adapted from 2nd
grade junior high school of English text book in
Junariyah (2014, p. 17-18), the example of recount text can be see in table below :
Tabel 2.2 Generic Structure of Recount Text
Generic Structure A Beautiful Day at Jogja
Orientation This morning my friends and I went to EOS
studio. It‟s not very far from our school, so we
just rode our bicycles.
Events First, we met Shanty and Rico outside the
studio. Then, they look us into the studio and
showed us around. After that, we had lunch at
EOS canteen. The food was delicious. Before we
went home, we took some photographs with
Shanty and Rico.
Re-orientation It was tiring bu we were very happy.
3. Cooperative Integrated Reading and Composition (CIRC)
CIRC stand for (Cooperative Integrated Reading and Composition).
Cooperative integrated reading and composition (CIRC) technique is one of the
learning techniques based on cooperation that is designed to develop reading,

writing and other language skills in the education. Zainuddin (2015, p. 15) said
that CIRC came from cooperative learning which makes it easier for students to
understand the text given. Cooperative Integrated Reading and Composition
(CIRC) is one of the types of a cooperative learning method. It is a comprehensive
program for teaching reading and writing. Slavin (1995, p. 104) proposes that
CIRC is a comprehensive program for reading and writing in the upper
elementary grades. Madden (2004) studies that CIRC is teaching technique that
focuses on two skills, reading and writing. This two skills drill students‟ mastery
of language arts. The technique guides teachers in motivating students to work in
group at the same or different reading level.
CIRC technique activities are suitable to increase students reading
comprehension. It is noted by her three main elements of the technique, there are
basic activity, direct teaching of reading comprehension, and language art
(Sharan, 1999, p. 56).
As Durukan‟s thesis (2010, p.21), CIRC technique is realization of
cooperative learning that accommodates reading, writing and other language
skills. He adds that skill-based reading groups approach encourages development
of this technique.
1) The Major Components of CIRC
According to Slavin (1995, p. 106-108), the major components of CIRC
are presented as follows :
a) Reading Groups
If reading groups are used, students are divided into two or these groups
according to their reading level as determined by the teacher.
b) Teams
Students are assigned to pairs or triads within their reading groups, and
then the pairs make a team composed from different level. For example, a team

might be composed from two students from high level group and two from low
level group. Team members receive points based on their individual performance
on all quizzes, compositions, and book reports, and these points from teams score.
c) Story-Related Activities
Students use descriptive and recount text. Texts are introduced and
discussed in teacher – led reading groups. In these groups, teacher set a purpose of
reading, introduce new vocabulary, review old vocabulary, discuss the story after
students have read it, and etc.
d) Partner Reading
Students read the text silently, and take turns with other to read aloud,
alternating each paragraph. These listeners correct any errors the readers make.
The teachers assess the students‟ reading by going around from one group to
another and listening to them.
e) Story Grammar and Listening to them
Students are given questions related to the text that emphasize text
grammar.
f) Word out loud
Students are given a list of new of difficult words, and asked to read the
word correctly. They practice with their partners or teammates until they can read
the words correctly.
g) Word meaning
Students are given a list of new words, and asked them to look for the
definition in the dictionary, paraphrase, and make sentence by using those words.

h) Story Retell
After reading the text and discussing it in their groups, students
summarize the main points of the text to their partner.
i) Spelling
Students pretest one another a list of spelling words each week, and then
over the course of the week to help one another master the list.
j) Tests
At the end of class period, students are given a comprehension test on the
story, asked to read aloud the list of difficult words, and write meaningful
sentences for those words.
k) Independent Reading and Book reports
Students are asked to read a book of their choice and make book reports.
They contribute bonus points for their teams if they complete book reports
regularly.
2) Steps of CIRC
CIRC consists of three principal elements: basal-related activities, direct
instruction in reading comprehension, and integrated language arts and writing.
Slavin (1995, p. 106) proposed some steps in CIRC, they are teacher presentation,
team practice, independent practice, peer pre-assessment, additional practice, and
testing.
Huda (2011, p. 126-127) states some steps in conducting CIRC as
follows.
a) Students are placed in small groups, not only homogeny but also
heterogeneously
b) They follow teacher‟s instructions in reading and writing ability

c) Practice
d) Pre-assessment
e) Quiz
While, Suprijono (2009, p. 130-131) also proposes some steps of
conducting CIRC that students can be active in joining the teaching learning
process.
a) Grouping the class that consists of four students heterogeneously
b) Teacher gives a text/ clipping which is appropriate with the topic
c) Students work together in reading and finding main idea and giving idea
toward the discourse/ clipping which is and they are written on paper
d) Presenting/reading the result
e) Teacher gives conclusion together
f) Closing.
In reference to the explanation above, the steps of CIRC used in the
classroom activities contribute to the students‟ reading learning process. The steps
of CIRC should be appropriate to the students. So, the teacher can achieve the
target of achieving students‟ learning process. From the explanation of the steps of
CIRC from some experts above, it can be concluded that the steps of CIRC should
be included with teacher presentation, grouping consisted of four or three
students, giving a text that appropriate with the topic, working in group in doing
some tasks based on the text and topic, discussion, presenting the result of
students‟ work, teacher‟ conclusion, and closing.

3) Advantages of CIRC
According to Slavin (1995, p. 105), there are four advantages of CIRC as
follow :
a) Increase students‟ opportunities to read aloud and receive feedback on
their reading
b) Train the students to respond to one another‟s reading
c) The students learn broadly app increase licable reading comprehension
skill
d) Increase reading comprehension of low-achieving students.
B. Relevant Studies
The writer has found three relevant studies which related to this research.
First research comes from Tri Widiastuti (2014) conducted a research which
entitled ”Improving Students‟ Reading Comprehension Through CIRC Strategy
(Cooperative Integrated Reading and Composition) at Second Class of Junior
High School 25 Jambi”. The research method used in this research was clasrrom
action research. In this research, the researher used observation checklist, field
note, test and giving questionare to the students at second class of junior high
school 25 Jambi. Based on the findings and discussion of the research, it can be
concluded that the implementing of cooperative integrated reading and
composition strategy in reading was successful to improve students‟ reading
comprehension and students‟ active participation in teaching-learning of reading
comprehension.
Second, a reseach was done by Siti Mursidah (2013) who analyze “The
Effect of Cooperative Learning Type Cooperative Integrated Reading and
Composition (CIRC) Towards Students‟ Reading Achievement at Eleventh Grade
Islamic Senior High School Olak Kemang Jambi City”. The research used
quantitative research which employed quasi experimental-nonequivalent control

group design. data collection that she used in her research was test. in experiment
class she used Cooperative Type CIRC, while in control class without using
CIRC. Based on the research, researcher found that the use of CIRC strategy
significantly effect the results of student learning English in Islamic Senior High
School Olak Kemang Jambi City. The result of this study was effective to
improve students‟ Reading Achievement.
Third, a research of Junariyah (2014) which entitled “The Effectivness of
Using CIRC Technique to Improve Students‟ Reading Comprehension on
Recount Text. This research was a pre-experimental study at second year students
of MtsN Rajeg-Tanggerang. Based on the result of the study, it showed that there
are significance different between students‟ score in learning reading
comprehension on recount text before and after applying CIRC technique. it can
be seen that t0 is 6,67 and degree of freedom (df) is 24, whereas the value of tt on
the degree or significance 5% and 1% are 2.064 and 2.797. In other word, the
value of t0 (tobservation) is higher than tt (ttable). It means that the alternative
hypothesis (Ha) is accepted and the null hypothesis (H0) is rejected. So, CIRC
technique is effective to improve students‟ reading comprehension on recount
text.
Those relevant studies above have differences with this research. This
research was held at the eight grade students of Junior High School O6 Batanghari
which analyze students‟ reading comprehension on recount text by using CIRC
technique. in thia research, the writer used quasi experimental design which is
consist of two classes. The first class is experiment class and the second class is
control class. In the quasi experimental design of this research, the writer used
nonequivalent control group design whose groups were not randomly selected.
Moreover, the instrument used in this research only used pre-test and post test and
also only focus on reading.

C. Conceptual Framework
In order to avoid misunderstanding toward the research and to clarify the
theory that writer uses in this research, the writer would like to explain briefly
about variable of this research. This research is experimental research which
focuses on gaining the effect of using cooperative integrated reading and
composition toward students‟ reading comprehension. Therefore, in analyzing the
problem in this research there are two variables used in this research:
1. Variable X is Cooperative integrated reading and composition (CIRC)
technique as an independent variable. It refers to the technique used by the
teacher to teach reading.
2. Variable Y is a dependent variable and it refers to the students reading
comprehension.
Reading is one of the language skills that students should be mastered and
it involves texts of different types. It is the skill or ability of getting information
from a text. Thus, the teaching and learning of reading at the school should be
carefully prepared and managed. However, some problems of reading in the grade
VIII students were found. The grade VIII students at SMP Negeri 6 Batanghari,
have difficulties to retrieve information and construct meaning of a text. It can be
detected from their difficulty in generating the main idea and identifying detail
information while both of those problems are included as the skills of reading.
The students also seemed to have difficulties in vocabulary. They are so
struggle to translate every single word in the text when they actually can try
guessing the meaning from the context. Regarding to the problems found at the
school, some possible ways are proposed to solve them. In the matter of students‟
vocabulary difficulty, grouping can facilitate the students to guess the meaning
from context and answer the questions of the text. Making a group is also
proposed to support the students in connecting their prior knowledge to the
information of the texts.

Cooperative integrated reading and composition (CIRC) technique is one
of the learning techniques based on cooperation that is designed to develop
reading, writing and other language skills in the education. CIRC technique
activities are suitable to increase students reading comprehension because the
technique guides teachers in motivating students to work in group at the same or
different reading level. The steps of CIRC used in the classroom activities
contribute to the students‟ reading learning process. The steps of CIRC should be
appropriate to the students. So, the teacher can achieve the target of achieving
students‟ learning process. From the explanation of the steps of CIRC from some
experts above, it can be concluded that the steps of CIRC should be included with
teacher presentation, grouping consisted of four or three students, giving a text
that appropriate with the topic, working in group in doing some tasks based on the
text and topic, discussion, presenting the result of students‟ work, teacher‟
conclusion, and closing.
This research, however, does not improve all of the skills (micro and
macro skills) of reading at once. It merely strengthens some points considered
from the students‟ problems in reading as mentioned earlier. Cooperative
integrated reading and composition (CIRC) mainly focuses on improving the
students‟ reading comprehension especially the students‟ problem in reading
comprehension, such as lack of vocabulary, the concept of the words, unfamiliar
syntaticcal grammar, etc. Beside that, the students feel monotonous and
uninteresting when they are in process of learning because the teacher just asked
the students to read the text every meeting, identifying the difficult words,
translating the words and look up the dictionary if they don‟t know the meaning.
By using Cooperative Integrated Reading and Composition (CIRC) both
the teacher and the students can be assisted in their own roles during the teaching
and learning of reading. The students can be helped to improve their
comprehension and the teacher can be more involved and active to guide the
students during the reading.

Table 2.3
Global Problems in Teaching and Learning Process of Reading
D. Hypothesis of the Research
H01 : There is a significant effect on students‟ reading comprehension
before and after being taught by using cooperative integrated reading
and composition (CIRC) technique.
Ha1 : There is no a significant effect on students‟ reading comprehension
before and after being taught by using cooperative integrated reading
and composition (CIRC) technique.
H02 : There is a significant difference on students‟ reading comprehension
between the students who taught by using cooperative integrated
reading and composition (CIRC) technique and those who were not.
Ha2 : There is no a significant difference on students‟ reading
comprehension between the students who taught by using cooperative
integrated reading and composition (CIRC) technique and those who
were not.
Global problems in teaching and
learning process of reading in class
VIII-A SMP Negeri 6 Batanghari
Vocabulary difficulty
The lack interest of Reading
Comprehension
Students‟ less participation
The teacher teach by using
conventional strategy
Resolution of the problems
Pre-teaching vocabulary
and introducing the key
words
Teaching reading using
CIRC
Group discussion,
interesting media.

CHAPTER III
METHODOLOGY OF THE RESEARCH
A. Place and Time of the Research
This research conducted at the eight grade of junior high school 06
Batanghari which was located at Jl. Sungai Abang Kel. Kampung Baru Kec.
Muara Tembesi Kab. Batanghari. The writer choose this school because based on
the students problems experienced in learning English especially Reading, the
writer thought that applying CIRC technique at the eight grade of this school was
appropriate with the research. The writer conducted the research about one month.
The research will held in August until September 2018 at the first semester in
academic year 2018/2019.
B. Design of the Research
This research, the writer used quantitative-experimental approach to
collect the data. According to Latief (2015, p. 95), Experimental research
measured the effect of one manipulated and controlled (independent) variable
to another (dependent) variable, like the effect of different methods of teaching
to the students‟ achievement, the effect of an English training methods to
participants‟ English skills. Experimental research is a powerful research
method to establish cause-and-effect relationship (Borg, W.R., Gall, M.D.
1989, p. 639) as cited in Latief (2015, p. 95).
The design of this research was quasi experimental research. Sugiyono
(2013, p. 77) stated that quasi experimental research is a type of research that
have a control group, but not fully functional to control external variables that
affect the experiment. In the quasi experimental research, the writer used
nonequivalent control group design. This design was done in two groups; the
experimental group and the control group which is not randomly selected.

The aims of this research is to know the significant effect of using
CIRC technique on reading comprehension at the eight grade students‟ of
junior high school 06 Batanghari. Before providing treatment, both groups gave
a pretest to find out the extent of the students‟ initial knowledge in reading
comprehension. In this research, experimental groups was the groups that
received treatment by CIRC technique, while the control group was the group
that did not received treatment without using CIRC technique. furthermore,
both groups were given a posttest to know the result of using CIRC technique
in descriptive and recount text on students‟ reading comprehension. Sugiyono
(2013, p. 79) described the design as follow :
Table 3.1 The Nonequivalent Control Group Design
O1 X O2
O3 O4
Where :
O1 : Pre-test of experimental group
O2 : Post-test of experimental group
O3 : Pre-test of control group
O4 : Post-test of control group
X : Treatment
C. Population and Sample
1. Population
According to Sugiyono (2013, p. 80), population is a generalization
area consisting of; objects or subjects that have the same qualities and
characteristics. The populations of this research were all of eight grade
students of junior high school 06 Batanghari. Totaling the students of eight
grades was 117 students and divided into 6 classes.

Table 3.2 Population of the Research
No Class Number of Students
1 VIII A 29
2 VIII B 29
3 VIII C 29
4 VIII D 28
5 VIII E 29
6 VIII F 29
2. Sample
Sample is a small group in population. Arikunto (2010, p. 174)
defined that sample is a part or the representative of the population that will
be studied. Furthermore, According to Sapsford and Jupp (2006, p. 26), a
sample is a set of elements selected in some way from a population. In this
research, the writer used purposive sampling technique to get the sample.
Kasmadi and Sunariah (2013, p. 66) stated that purposive sampling
technique is the technique of determination of samples with specific
samples and specific consideration. The writer took samples in this research
based on the purpose. The purpose of the writer is to find a homogeneous
ability of the students in the class. Therefore, the way of writer selects the
sample by asking one of the English teacher at the school and looking at the
list of students grades from each class. So, it can be concluded that the
students who have homogenenous ability in the class were VIII A and VIII
C. VIII A as an experimental class and VIII C as a control class. The
students in both classes have medium ability. In this research, the writer
took 25 students from these class as the sample for conducting the process
of data analysis because those students were constantly followed all the
treatments given from the beginning until the end of the research.

Table 3.3 Total Sample of Population
No Class Number of Students
1 VIII A 25
2 VIII C 25
Total 50 Students
D. Variable of the Research
Variable is the object of research that became the focus of the
writer in a research. Sugiyono (2013, p. 38) said that variable is an
anttributes or the nature or value of a person, object or activity that has a
certain variation set by the writer to be studied and then drawn conclusion.
There are two variables in this research, namely independent and dependent
variable.
Independent variable is variable that influences the change of the
dependent variable. According Sugiyono (2013, p. 39), independent variable
is a variable that affects or that causes the change or the emergence of the
dependent variable. Independent variable in this research is Cooperative
Integrated Reading and Composition technique.
Dependent variable is variable that changes because the cause of
the variables that influence. Sugiyono (2013, p. 39) stated that dependent
variable is variable that is influenced or which becomes the effect because
of the independent variable. Dependent variable in this research is students‟
reading comprehension.
E. Intrument of Data Collecting
In this research the writer only used test to collect the data. The test
was distributed to measure the students‟ reading comprehension. The test
was divided into two tests; pre-test was given before the treatment, and post-

test was given after doing the treatment. The type of the test was multiple
choice tests which consisted of 25 items (Descriptive text and Recount text).
Every test item consisted of four answer options (a, b, c, and d). The
proportion of every item was 4. Therefore, the total score was 100 if the
students could answer all the items correctly.
The procedure of collecting the data for experimental group can be
seen as follows :
a. Pre test
The pre-test carried out to determine the students‟ comprehension
with their score. The items used for pre-test consist of 25 items (descriptive
text and recount text). The test was about reading comprehension.
b. Treatment
The treatment conducted for experimental group by using
cooperative integrated reading and composition (CIRC) was applied for six
meetings.
c. Post test
After conducting the treatment, the post-test administered and
analyzed as final data of this research. The post-test given was the same test
as the pre-test.
While, the procedure of collecting data for control group :
a. Pre test
The control group was given pre test to know their reading
comprehension. The test was the same as experimental group.
b. Conventional Strategy
In this case, the teaching of reading comprehension for control
group by using conventional strategy or classical method. It means, in
control group, the writer did not use cooperative integrated reading and
composition (CIRC) in learning process.
c. Post test
Post test also given to control group and the result analyzed and
used as final data for this research.
The test gives to experimental and control class, it purposes for
knowing the validity and reliability of pre-test and post-test.
1. Validity of the test instrument
Validity is measurement, which level valid an instrument.
According to Gay and Peter (2000, p. 161) , validity is the appropriateness
of the interpretations made from tests score. Clear validity is the core future
for the test. Furthermore, Gay said that there are three kinds of validity.
They are content validity, criterion-related validity, and construct validity.
All of them have different usage and function.
In this research, the writer adopted a instrument test of Junariyah‟s
thesis entitled The Effectiveness of Using CIRC Technique to Improve
Students’ Reading Comprehension on Recount Text. In her research, she
implemented a content validity to the test.
F. Technique of Analysis the Data
1. Descriptive Analysis
The data would be analyzed in the term of total score, mean, and
gained score of both of class.
2. Statistical Analysis
In analyzing the data, the writer use statistical analysis. Which statistical
analysis is fundamental to all experiment that use statistic as a research
methodology (Creswell, 2014 p. 96). Before the writer calculated the value of ttest

to look at the hypothesis, the writer have to analyze the normality and
homogeneity of the data. The examination of normality needed to know whether
the data has been normally distributed or not. Then, after getting the normality,
the next step was calculating the homogeneity of data. It aims to look at whether
the data is homogeneous or heterogeneous.
1) Normality test
Normality test calculated to see whether the data were normally or not.
The normality test was employed by using Liliefors test because the sample of
this research ≤ 30. According to Sudjana (2005, p. 466-467), the ways to look
for normality tests as follows :
a. Sort the sample data from small to large data ( )
b. Calculate the average of sample score by using a single average
c. Calculate the Standard Deviation
d. Determine the Z value of each data by the formula :
e. Determine the Ztable based on the Zvalue
f. Determine the F(Zi) based on the Ztable
If Zi negative (-), so 0,5 - Ztable
If Zi positive (+), so 0,5 + Ztable
g. Determine the S(Zi) by the formula :
S(Zi) =
h. Calculate the Lcount by the formula : F(Z1) – S(Zi)
i. If , so the sample of the data is normally distributed.
2) Homogeneity test
The purpose of homogeneity test was to The test of homogeneity used
homogeneity variance. The writer using Fisher test to tested the homogeneity in
both of class. According to Riduwan (2013, p.120), the formula used in
homogeneity test can be seen as a follows:
Fcount =
𝑡ℎ𝑒 ℎ𝑖𝑔ℎ𝑒𝑠𝑡 𝑣𝑎𝑟𝑖𝑎𝑛𝑐𝑒
𝑡ℎ𝑒 𝑙𝑜𝑤𝑒𝑠𝑡 𝑣𝑎𝑟𝑖𝑎𝑛𝑐𝑒

systematic calculation:
a. Conduct assessment of the students test result
b. Determining for variance X (Sx2)
c. Determining for variance Y (Sy2)
d. Calculate the largest variance and smallest variance
e. Compare the ftable with fcount
and
f. Criteria of test with the significance ơ = 0,05
If fcount ftable then the data homogeneus
If fcount ftable then the data not homogeneus
3) T-test
In this part, the writer calculated the data by using two sample t-test.
They are paired sample t-test and independent sample t-test. Paired sample t-
test is used to see whether or not there is a significant effect of students‟
reading comprehension before and after the treatment. The independent sample
t-test is used to compare the means of one variable for two groups of cases
(Taniredja, 2014 p. 38).
a. Paired Sample T-test
According to Sugiyono (2013, p. 197), the formula of Paired Sample
T-test is express as follows:
√
( √
) ( √
)
Where :
t0 : T-test
X1 : Mean score of pre-test experimental class
X2 : Mean score of post-test experimental class
S1 : Standard deviation of of pre-test experimental class

S2 : Standard deviation of post-test experimental class
S12 : Variance of pre-test experimental class
S22 : Variance of post-test experimental class
: Total of sample
: The correlation between pre-test and post-test experimental class
The formula above is the main formula. Before using the formula, the
writer also used some calculation procedure such as below :
1. Determining mean of variable X1 (Pre-test experimental class), with the
formula: ∑
2. Determining mean of variable X2 (Post-test experimental class), with the
formula: ∑
3. Determining variance (s12) and standard deviation (s1) of variable X1, with
the formula: s12
∑
and s1
= √
2
4. Determining variance (s22) and standard deviation (s2) of variable X2, with
the formula: s22
∑
and s2
= √ 2
5. Determining Correlation (r)
The writer calculated the score of correlation by using correlation
calculator in
https://ncalculators.com/statistics/correlation-coefficient-calculator.htm.
6. Determining t0 (t-test), with the formula:
√
( √
) ( √
)
7. Give the interpretation to t-test (to) to several process as follow:
a. Formulating the hypothesis of the research and statistic hypothesis
b. Test significance of to by comparing the amount of to with ttable by
setting of degrees of freedom (df) or (db), by the formula of df/db =
N-1

c. Determining criticism of „t‟ in the table value of „t‟ by adhering to the
df or db have been obtained, both at a significance of 5%
d. Conduct the comparing between to and ttable as bellow:
Criteria Hypothesis Decision
To > ttable H0 Rejected
Ha Accepted
To < ttable H0 Accepted
Ha Rejected
8. Conclusion
b. Independent Sample T-test
According to Sudijono (2000, p.297) in Diktat Statistik Pendidikan
(2016, p.55), the formula of Independent Sample T-test is express as follows:
Where:
t0 : „t‟ test
M1 : Mean of experimental class
M2 : Mean of control class
SEM1-M2 : Standard error
The formula above is the main formula. Before using the formula, the
writer also used some calculation procedure such as below :
1. Determining mean of variable X, with the formula :
∑
2. Determining mean of variable Y, with the formula :
∑

3. Determining standard of deviation score of variable X, with the formula
√∑
4. Determining standard of deviation score of variable Y, with the formula :
√∑
5. Determining standard error mean of variable X, with the formula
√
6. Determining standard error mean of variable Y, with the formula :
√
7. Determining standard error of different mean of variable X of variable Y,
with the formula :
√
8. Determining t0 (t-test), with the formula :
9. Give the interpretation to t-test (to) to several process as follow:
e. Formulating the hypothesis of the research and statistic hypothesis
f. Test significance of to by comparing the amount of to with ttable by
setting of degrees of freedom (df) or (db), by the formula of df/db = N-1
g. Determining criticism of „t‟ in the table value of „t‟ by adhering to the
df or db have been obtained, both at a significance of 5%
h. Conduct the comparing between to and ttable as bellow:
Criteria Hypothesis Decision
To > ttable H0 Rejected
Ha Accepted

To < ttable H0 Accepted
Ha Rejected
10. Conclusion
G. Statistical Hypothesis
Hypothesis is the statements in quantitative research in which the
investigator makes a research. Hypothesis is a prediction of the possible outcomes
of the research. According to Sugiyono (2013, p. 64), statistical hypothesis exist
when a research works with samples, if the research does not work by using a
sample, so there is not statictical hypothesis. According to Sugiyono (2013, p. 69)
The formula of statistical hypothesis in this research can be seen as :
1. : ≥
: ≤
2. : ≡
: ≠
Where :
H01 : There is a significant effect on students‟ reading comprehension before and
after being taught by using cooperative integrated reading and composition
(CIRC) technique.
Ha1 : There is no a significant effect on students‟ reading comprehension before
and after being taught by using cooperative integrated reading and
composition (CIRC) technique.
H02 : There is a significant difference on students‟ reading comprehension
between the students who taught by using cooperative integrated reading
and composition (CIRC) technique and those who were not.
Ha2 : There is no a significant difference on students‟ reading comprehension
between the students who taught by using cooperative integrated reading
and composition (CIRC) technique and those who were not.

H. Schedule of the Research
The writer arranged the schedule of research in order to make the
research be effective and finish with the specified time. So, the writer created a
research schedule are as follows:


CHAPTER IV
FINDING AND DISCUSSION
A. The Descriptive Analysis
After conducting the data, the writer got data from students‟ score in
pre-test and post-test. The data will be described into two points as the data
of experimental class and the data of controll class.
1. The Data of Experimental Class
The writer makes a table of students‟ score in both pre-test and
posttest. The table also shows the scores gained by students.
Table 4.1
Students’ Score of Experimental Class
No Students Pre-test Post-test Gained Score
1 AMS 40 60 20
2 AAIR 40 52 12
3 AP 40 72 32
4 AJS 60 88 28
5 AAIR 48 76 28
6 AS 52 80 28
7 BS 40 64 24
8 CN 56 84 28
9 DAK 48 76 28
10 FTH 44 68 24
11 FAG 72 92 20
12 HMS 64 88 24
13 IA 32 60 28
14 MRKA 36 64 28
15 MPR 36 48 12
16 MNA 60 84 24
17 NN 36 36 0
18 NPA 44 72 28
19 PR 56 80 24

20 PO 52 80 28
21 RRHF 48 76 28
22 RM 44 76 32
23 RIS 36 68 32
24 TR 56 80 24
25 VLM 64 84 20
Total Score 1204 1808 604
Mean Score 48,16 72,32 24,16
Max 72 92 32
Min 32 36 0
Table 4.1 shows the scores of the experimental class. It also
mentions the score of pre-test and post-test of each students. The KKM
score in junior high school 6 Batanghari was 75. Based on the table,the
result of pre-test score students showed that no one students reach kkm
score, but there was a student who almost reaches the kkm score in
experimental class. The minimum score of pretest is 32 which is owned by
one student and the maximum score is 72 which is also owned by a student
while in the post-test result, there are 14 students got scores above kkm. the
minimum score of post-test is 36 which is owned by one student and the
maximum score of post-test is 92 which is owned by one student. The table
also informs that the total score of pretest is 1204, the total score of post-test
is 1808, and the total score of gained score is 604. It also shows that the
mean of pre-test is 48,16, the mean of post test is 72,32 and the mean of
gained score is 24,16.
2. The Data of Control Class
After calculating and make the table about the pretest and posttest
in experimental class, the writer also calculates and makes a table for
control class. This table is table of control class students‟ score in both pre-
test and post-test. The table also shows the scores gained by students.

Table 4.2
Students’ Score of Control Class
No Students Pre-test Post-test Gained Score
1 ASA 56 76 20
2 BTAP 32 44 12
3 BG 44 40 -4
4 CDS 40 40 0
5 DF 44 48 4
6 DAP 40 56 16
7 EMF 64 80 16
8 FN 60 68 8
9 FK 60 60 0
10 FHBB 60 80 20
11 GBY 48 56 8
12 HR 48 52 4
13 IT 40 48 8
14 MHA 52 76 24
15 NH 36 44 8
16 RT 36 32 -4
17 RK 72 84 12
18 RD 48 60 12
19 RS 32 48 16
20 RAP 52 72 20
21 SM 32 32 0
22 SW 44 52 8
23 TWS 64 84 20
24 TR 56 64 8
25 WD 32 36 4
Total Score 1192 1432 240
Mean Score 47,68 57,28 9,6
Max
72 84 24
Min 32 32 -4
Table 4.2 shows the scores of the controll class. It also mentions
the score of pre-test and post-test of each students. Based on the table, No
one students reach kkm score in pretest of control class. The minimum score

of pretest is 32 which is owned by four students and the maximum score is
72 which is also owned by a student while in the post-test result, there are 6
students got scores above kkm. The minimum score of post-test is 32 which
is owned by two students and the maximum score of post-test is 82 which is
also owned by two students.
The table also informs that the total score of pretest is 1192, the
total score of post-test is 1432, and the total score of gained score is 240. It
also shows that the mean of pre-test is 47,68, the mean of post test is 57,28
and the mean of gained score is 9,6.
B. Statistical Analysis
After the writer got and described the data, then she analyzed the data.
The analysis of data will be presented in three points namely normality test,
homogeneity test, and hypothesis test.
1. Normality Test
The normality test is proposed to know whether the data is
normally distributed or not. The writer uses Liliefors to do the normality
test. After finishing the normality test, the writer got two kinds of value;
Lmax and Ltable. The both values can be used to see the normality of the data.
We use the criteria below to see the normality of data:
Ha : Lcount> Ltable
H0 : Lcount ≤ Ltable
Note: Ha = Data is not normally distributed
H0 = Data is normally distributed

a) The Result of Normality Test Pre-test
The writer tested normality test after she got score of pre-test
students reading comprehension in experimental and control class. The
result of normality test pretest in experimental and control class, it can be
seen in the table below :
Table 4.3
The Result of Normality Test Pre-test
Based on the table 4.3 above, Lcount is 0,1423 in experimental class.
Therefore, H0 is accepted because the result shows that Lcount is lower than
Ltable or 0,1423 ≤ 0,1730. While in control class, Lcount is 0,1117. Therefore,
H0 is accepted because the result shows that Lcount is lower than Ltable or
0,1117 ≤ 0,1730. So, it can be concluded that the data of pre-test
experimental and control class are normally distributed. For the calculating
of normality test, it can be seen in appendix 3.
No Statistics Pre-test
Control Eksperimen
1
2 48,16
3
4
5
6 Conclusion So, the data of pre-
test experimental and control class
are normally distributed.

b) The Result of Normality Test Post-test
The writer tested normality test after she got score of post-test
students reading comprehension in experimental and control class. The
result of normality test pretest in experimental and control class, it can be
seen in the table below :
Table 4.4
The Result of Normality Test Post-test
Based on the table 4.4 above, Lcount is 0,1303 in experimental class.
Therefore, H0 is accepted because the result shows that Lcount is lower than
Ltable or 0,1303 ≤ 0,1730. While in control class, Lcount is 0,1157. Therefore,
H0 is accepted because the result shows that Lcount is lower than Ltable or
0,1157 ≤ 0,1730. So, it can be concluded that the data of post-test
experimental and control class are normally distributed. For the calculating
of normality test, it can be seen in appendix 3.
No Statistics Post-test
Control Eksperimen
1
2 72,32
3
4
5 0,1730
6 Conclusion So, the data of pre-
test experimental and control class
are normally distributed.

2. Homogeneity Test
The writer tested homogeneity test was to see whether the data or
sample in both classes were homogenous or heterogeneous. The writer uses
Fisher test to do the homogeneity test. After finishing the homogeneity test,
the writer got two kinds of value; and . The both values can be
used to see the homogeneity of the data.
The writer used the criteria below to see the homogeneity of data:
α = 0.05
H0 : ≤
Ha : ≥
Note : H0 = The experimental class is homogenous to the control class
Ha = The experimental class is not homogenous to the control class
Based on the calculation, the result showed that the data of
experimental and control class post-test was homogenous. It can be seen
from ≤ or 1,50 ≤ 1,98. For the calculating of homogeneity test,
it can be seen in appendix 4.
C. T-test
In this part, the writer calculated the data by using two sample t-
test. They are paired sample t-test and independent sample t-test.
c. Paired Sample T-test
The writer used paired sample t-test to test the hypothesis that
whether there was a significant effect of students‟ reading comprehension
before and after being taught by using cooperative integrated reading and
composition (CIRC) technique.

The writer used the criteria below to analyze the test hypothesis :
1. If t-test (t0) ≥ t-table (tt) in the significance degree of 0,05, H0 (null
hypothesis) is rejected
2. If t-test (t0) ≤ t-table (tt) in the significance degree of 0,05, H0 (null
hypothesis) is accepted
Where :
H01 : There is a significant effect on students‟ reading comprehension
before and after being taught by using cooperative integrated reading
and composition (CIRC) technique.
Ha1 : There is no a significant effect on students‟ reading comprehension
before and after being taught by using cooperative integrated reading
and composition (CIRC) technique.
Based on the writer‟s calculation, the result of paired sample t-
testshowed that H0 was rejected because the t-test( was higher than t-table
(tt) or -2,30≥ -2,02. So, it means that there was a significant effect on
students‟ reading comprehension before and after being taught by using
cooperative integrated reading and composition (CIRC) technique. For the
calculating of paired sample t-test, it can be seen in appendix 5.
d. Independent Sample T-test
The writer used independent sample t-testto test the hypothesis that
whether there was a significant difference on students‟ reading
comprehension between the students who taught by using cooperative
integrated reading and composition (CIRC) technique and those who were
not.
The writer used the criteria below to analyze the test hypothesis :
1. If t-test (t0) ≥ t-table (tt) in the significance degree of 0,05, H0 (null
hypothesis) is rejected
2. If t-test (t0) ≤ t-table (tt) in the significance degree of 0,05, H0 (null
hypothesis) is accepted

Where :
H02 : There is a significant difference on students‟ reading comprehension
between the students who taught by using cooperative integrated
reading and composition (CIRC) technique and those who were not.
Ha2 : There is no a significant difference on students‟ reading
comprehension between the students who taught by using cooperative
integrated reading and composition (CIRC) technique and those who
were not.
Based on the calculation,the result showed that H0 was rejected
because the t-test ( was higher than t-table (tt)or 3,53 ≥ 2,02. It means that
there was a significant difference on students‟ reading comprehension
between the students who taught by using cooperative integrated reading and
composition (CIRC) technique and those who were not. For the calculating
of independent sample t-test, it can be seen in appendix 6.
C. Interpretation
The aims of this research were to find out whether or not there was a
significant effect on students‟ reading comprehension before and after being
taught by using cooperative integrated reading and composition (CIRC) technique
and there was a significant difference on students‟ reading comprehension
between the students who taught by using cooperative integrated reading and
composition (CIRC) technique and those who were not at the eighth grade of
junior high school.
Based on the analysis,it can be seen from the pre-test and post-test result
in both of class. The mean score of pre-test in experimental class was 48,16 and
the mean score of post-test was 72,32. Meanwhile, the mean score of pre-test in
control class was 47,68 and the mean score of post-test was 57,28. Both of class
from pre-test and post-test score got a normality and homogeneity data with the
significant (ơ = 0,05). Where the result of pretest score in experimental class
shows that Lcount is lower than Ltable or 0,1423 ≤ 0,1730 and the pretest score in in
control class shows that Lcount is lower than Ltable or 0,1117 ≤ 0,1730. Meanwhile,
the result of posttest score in experimental class shows that Lcount is lower than
Ltable or 0,1303 ≤ 0,1730 and the posttest score in control class shows that Lcount is
lower than Ltable or 0,1157 ≤ 0,1730. So, it can be concluded that the data of
pretest and post-test in experimental and control class are normally distributed.
Furthermore, The result of calculated the homogeneity test shows that the data of
experimental and control class post-test is also homogenous. It can be seen from
≤ or 1,50 ≤ 1,98. Besides that, the gained of hypothesis of test by
using paired sample t-test showed that tvalue is higher than ttableor (-20,30 ≥ -2,02),
while the gained of hypothesis of test by using independent sample t-test showed
that tvalue is higher than ttableor (3,53 ≥ 2,02). The ttable value is based on the number
of degrees of freedom (df) which is 48 with a significant level (α) 0.05 or 95%
confidence level.
Cooperative Integrated Reading and Composition (CIRC) as technique
as the treatment in experimental class. Before the treatment was conducted in this
class, the atmosphere of classroom is passive during the lesson. The students feel
uninteresting when they are in process of learning because the teacher just asked
the students to read the text every meeting, identifying the difficult words,
translating the words and look up the dictionary if they don‟t know the meaning.
So, the students have difficultiesin reading comprehension, such as lack of
vocabulary, the concept of the words, unfamiliar syntaticcal grammar, etc. But,
the atmosphere of classroom was changed during treatment, the students felt that
they had new innovation when they learnt English by using Cooperative
Integrated Reading and Composition (CIRC).According to Slavin (1995, p. 105),
there are four advantages of CIRC as follow: (a) Increase students‟ opportunities
to read aloud and receive feedback on their reading; (b) Train the students to
respond to one another‟s reading; (c) The students learn broadly
appincreaselicable reading comprehension skill; (d) Increase reading
comprehension of low-achieving students. Furthermore, Lehr & osborn theory
(2005: p. 20) as cited in Sholihah, (2016; p.34) said that Reading strategy as
follows : (a) strategies help to improve reading comprehension as well as
efficiency in reading; (b) By using strategies, students will be reading in the way
that expert readers do. (c) Strategies help readers to process the text actively, to
monitor their copmrehension, and to connect what they are reading to their own
knowledge and to other parts of the text.
The result of the test showed that students‟ score on reading
comprehension before and after being taught by using Cooperative Integrated
Reading and Composition (CIRC) as a technique in experimental class was
improved. It can be seen from the mean score of pre-test in experimental class had
lower than the mean score of posttest. So, it can be concluded that there was a
significant effect on students‟ reading comprehension before and after being
taught by using cooperative integrated reading and composition (CIRC) technique
at the eighth grade of junior high school 06 batanghari.
Furthermore, the mean score of post-test in experimental class which
given treatment by using CIRC technique had higher score compared with control
class was using conventional strategy or tradition method while reading
comprehnsion process. So,it means that there was a significant difference on
students‟ reading comprehension between the students who taught by using
cooperative integrated reading and composition (CIRC) technique and those who
were not at the eighth grade of junior high school 06 batanghari.

CHAPTER V
CONCLUSION AND SUGGESTION
A. Conclusion
After conducting the research, there were some conclusions about the
study of the effect of using Cooperative Integrated Reading and Composition
(CIRC) technique on students‟ reading comprehension as follows:
1. The result of reading comprehension in pre-test of experimental class was
48,16 and the result of students‟ reading comprehension in post-test of
experimental class was 72,23 or (72,23 ≥ 48,16), Moreover, the score of t-test
by using paired sample t-test with a significant level (α) 0.05 showed that ttest
was higher than ttable or (-20,30 ≥ -2,02). So, it can be concluded that
Cooperative Integrated Reading and Composition (CIRC) technique is
effective to be used to increase students‟ reading comprehension at the eighth
grade of junior high school 06 Batanghari because there was a significant
effect on students‟ reading comprehension before and after being taught by
using cooperative integrated reading and composition (CIRC) technique at the
eight grade of junior high school 06 batanghari..
2. The result of reading comprehension in post-test of students‟ reading
comprehension in experimental class was 72,23 and the result of students‟
reading comprehension in control class was 57,28 or (72,23 ≥ 57,28), Besides
that, the score of t-test by using independent sample t-test with a significant
level (α) 0.05 showed that ttest is higher than ttable or (3,53 ≥ 2,02). So, it means
that that Cooperative Integrated Reading and Composition (CIRC) technique
is effective to be used to increase students‟ reading comprehension at the
eighth grade of junior high school 06 Batanghari because there was a
significant difference on students‟ reading comprehension between the
students who taught by using cooperative integrated reading and composition
(CIRC) technique and those who were not at the eight grade of junior high
school 06 batanghari.

B. Suggestion
Based on the conclusion above and based on the study that has been
done, the writer would like to offer some suggestions. The teachers, especially
those teach at Junior High School 6 Batanghari could use Cooperative Integrated
Reading and Composition (CIRC) as an alternative technique to improvement
students reading comprehension score. It can be useful to improve their English
teaching and learning especially for teaching reading comprehension. The teacher
should be well prepared before entering the classroom. The learning material
should be related to the context of the students lives in order to make the students
easier to relate new information and their background knowledge.
The teacher must be a creative teacher to make the teaching learning
activity more interesting by using this technique. The reason is to make the
students enjoy in teaching and learning activity and make them interested in learn
English, most of them do not like English because they feel boring and think that
English is difficult for them to understand. The teacher asks the students to bring
the dictionary, it will help them when they found the difficult words. For other
researchers who want to conduct the research in teaching reading could use the
result of this research as a source for conducting the research and as an additional
references for further relevant research certainly with different material and
sample. The other researchers also can consider the weaknesses of the result from
this research to conduct a better research.

REFERENCES
Arikunto, S. (2010). Prosedur Penelitian Suatu Pendekatan Praktik. Jakarta:
Rineka Cipta
Asriani, T. (2015). The Effectiveness of Suggestopdia on Students’ Reading
Comprehension in Narrative Text. Thesis. Jakarta: Syarif Hidayatullah
State Islamic University
Ayu, Y. M., Suparman, U., & Putrawan, G. E. (2017). The Implementation of
Cooperative Integrated Reading and Composition (CIRC) Technique to
Improve Students’ Reading Narrative Text in the Second Grade of Junior
High School 7 Bandar Lampung. Bandar Lampung: p.2
Brown, H. D. (2004). Language Assesment: Principle and Clasroom Practices.
White Plains, NY: Parson Education
Carrell, P. (1988). Interactive Text Processing: Implication for ESL/Second
Language Reading Classrooms. Cambridge: Cambridge University
Durukan, E. (2010). Effects of Cooperative Integrated Reading and Composition
(CIRC) Technique on Reading-Writing Skills. Educational Research and
Reviews, 6(1), 102-109.
Fitri, I. (2017). An Analysis of Students’ Skill in Writing Descriptive Text at the
Eighth Grade of SMPN 7 Tambusai Utara. Thesis. University of Pasir
Pengaraian
Gay, L. R. and Peter, A. (2000). Educational Research: Competence for analysis
an application (6th ed). New Jersey: Merrill Prentice Hall
Harmer, J. (2007). The Practice of English Language Teaching, Fourth Edition.
United Kingdom: Perason Longman.
Hornby, A. S. (1995). Oxford Advanced Learner’s Dictionary of Current English.
Fifth Edition. Oxford: Oxford University Press

Huda, M. (2011). Cooperative Learning Metode, Teknik, Struktur, dan
Penerapan. Yogyakarta: Pustaka Pelajar
Junariyah. (2014). The Effectiveness of Using CIRC Techniqu to Improve
Students’ Reading Comprehension on Recount Text. Thesis. Jakarta:
Syarif Hidayatullah State Islamic University
Kasmadi & Sunariah, S. N. (2013). Panduan Modern Penelitian Kuantitaif.
Bandung: CV Alfabeta
Latief, M. A. (2015). Research Methods on Language Learning: An Introduction
(2nd ed). Malang: Universitas Negeri Malang
Mursidah, S. (2013). The Effect of Cooperative Learning Type Cooperative
Integrated Reading and Composition (CIRC) Towards Students’ Reading
Achievement at Eleventh Grade Islamic Senior High School Olak
Kemang Jambi City. Jambi; IAIN Sulthan Thaha Saifuddin Jambi
Riduwan. (2013). Dasar-dasar Statistika. Bandung: Alfabeta
Sapsford, R. and Jupp, V. (2006). Data Collection and Analysis (2nd ed). London:
SAGE Publication Ltd
Sharan, S. (1999). Handbook of Cooperative Learning. London: Praen er
Westport
Slavin, R. E. (1995). Cooperative Learning (2nd ed). Boston: Ally and Bacon
Slavin, R. E. (2005). Cooperative Learning: Theory, Research, and Practice.
London: Allyn and Bacon.
Somadoyo, S. (2011). Strategi dan Teknik Pembelajaran Membaca. Yogyakarta:
Graha Ilmu
Sudjana. (2005). Metode Statistika Edisi ke – 6. Bandung: Tarsito

Sugiyono. (2013). Metode Penelitian Kuantitatif, Kualitatif, fan R&D. Bandung:
Alfabeta
Suprijono, A. (2009). Cooperative Learning Teori dan Aplikasi PAIKEM.
Yogyakarta: Pustaka Pelajar
Taridi, M. (2016). Diktat Materi Kuliah Statistik Pendidikan. Jambi
Tarigan, H. G. (2008). Membaca Sebagai Suatu Keterampilan Berbahasa.
Bandung: CV Angkasa
Widiastuti, T. (2014). Improving Students’ Reading Comprehension Through
CIRC Strategy (Cooperative Integrated Reading and Composition) at
Second Class of Junior High School 25 Jambi. Jambi: IAIN Sulthan
Thaha Saifuddin Jambi
Zainuddin. (2015). The Effect of Cooperative Integrated Reading and
Composition Technique on Students’ Reading Descriptive Text
Achievement. English Language Teaching, 8(5), 15. doi:
10.5539/elt.v8n5p11

APPENDIXS

Appendix 1 :
KISI-KISI SOAL
TAHUN PELAJARAN 2018/2019
Mata Pelajaran : Bahasa Inggris
Kelas/Semester : VIII/Ganjil
Kompetensi Dasar Indikator Materi Jenis
Soal
Nomor
Soal
Merespon makna
dan langkah retorika
dalam esay pendek
sederhana secara
akurat, lancar, dan
brterima yang
berkaitan dengan
lingkungan sekitar
dalam teks
berbentuk
descriptive dan
recount.
Diberikan sebuah
pertanyaan tentang
informasi tertentu
dalam teks
descriptive (terkait
dengan orang),
siswa dapat
menentukan
jawabannya
dengan tepat
Information
about
descriptive
text (person)
Multiple
Choices
1-9
Merespon makna
dan langkah retorika
dalam esay pendek
sederhana secara
akurat, lancar, dan
brterima yang
berkaitan dengan
lingkungan sekitar
dalam teks
berbentuk
descriptive dan
recount.
Diberikan sebuah
pertanyaan tentang
informasi tertentu
dalam teks
recount, siswa
dapat menentukan
jawabannya
dengan tepat
Information
about recount
text
10-25

Appendix 2 :
INSTRUMENT OF TEST
Multiple Choices 25 questions
Choose the best answer to each question from the alternative given !
Text for number 1 – 4
Dr. Mohammad Hatta was born in Bukit Tinggi, West Sumatra, Dutch Eas
Indies (now Indonesia). He was Indonesia‟s first vice presidents, later also served as
the country‟s prime minister known as the “proclamator”. He and a number of
Indonesian people from Dutch. Despite his efforts to gain Indonesia independence, he
studied in the Netherlands from 1921 until 1932.
Moreover after his early education, he studied in Dutch schools in Indonesia.
He is more remembered as bung Hatta (bung is an affectionate title used to address
colleagues, popular in the early 1900 and is still used by Indonesians).
1. When was Mohammad Hatta born ?
a. West Sumatra c. North Sumatra
b. East Sumatra d. South Sumatra
2. Based on the text above, we know that ...
a. Ir. Soekarno is usually called by bung Karno
b. Bung Hatta studied in Indonesia before 1932
c. Bung Karno and bung Hatta was closed friend
d. Bung Hatta was first president of Indonesia
3. What is the purpose of the text ?
a. To announced a person‟s life
b. To tell past events and achievement in a person‟s life
c. To amuse students about person‟s life
d. To describe a person‟s activity
4. Known as the “Proclamator”. He .... (Paragraph 1)
The underline word means a person who ...
1. Announced officially and publicly
2. Is popular in Indonesia
3. Helps president duty
4. Leads a country and nation
Text for number 5 – 9
William Shakespeare was born in 1564 at Stratford-on-Avon in England. At
the time Elizabeth I had been queen for six years.
His father was a shopkeeper and his mother was a daughter of a farmer.
William went to Stratford grammar school, where he learnt Latin, scripture, and
mathematics.
When he left school, William was employed by his father. He married a
local girl, Anne Hathaway, when he was eighteen. Three years later he left Straford
and went to London. Shakespeare‟s life was between the year 1585 and 1590. By the
end of 1590 he had joined a group of actors and had started writing plays. During the
next twenty years he wrote thirty two plays. He wrote possible more plays, which he
did not have published or performed.
Shakespeare went back to Stratford-on-Avon a few years before he died in
1616 at the age of 52.
5. Where Shakespeare was born ?
a. England b. France c. America d. Corsica
6. What is the purpose of the text ?
a. To tell about Shakespeare‟s life c. To tell Albert Einstein‟s life
b. To repport the accident d. To ask the information

7. When was Shakespeare born ?
a. 1585 b. 1564 c. 1583 d. 1590
8. What subject that Shakespeare did not learn ?
a. Latin b. Scripture c. Mathematics d. Social
9. On what paragraph are telling about orientation of the text ?
a. 1 b. 4 c. 2 d. 3
Text for number 10 - 14
Yesterday my mother was ill. My father and I took her to the doctor. First, my
father talked to the lady who was in charge of registration. She typed the data about
my mother on the computer. Then we waited for my mother‟s turn.
When her turn comes, i accompanied her to enter the doctor‟s room. The doctor
listened to my mother‟s complained patiently. Then, he examined my mother by
putting the stethoscope on her chest. After that, a nurse, to take my mother‟s
temperature so she put a thermometer in my mother‟s armpit. He told me that my
mother had a bad influenza. He wrote a prescription and gave it to me. He advised my
mother to stay in bed for three days and come back after a week.
Then, my father took my mother home directly and I went to the nearest
dispensary.
10. Who was sick yesterday ?
a. The reader‟s mother c. My father
b. The writer‟s mother d. The writer‟s father
11. What did the doctor do first after the patience enter his room ?
a. Examined the patient first after the patients enter his room
b. Took the patient‟s blood pleasure by using spignomonometer
c. Listened to the patient‟s complain patiently
d. Wrote a precription and gave it to the writer

12. What is used to take the patient‟s temperature ?
a. Thermometer c. Spignomonometer
b. Stethoscope d. Electrocardiograph
13. On what paragraph are telling about reorientation of the text ?
a. 1 b. 2 c. 3 d. 4
14. What is the antonym of ill according to the text in paragraph 1 ?
a. Sick b. Fit c. Diseased d. Sore
Text for number 15 – 17
I want to tell you about my memorable time in Singapore. It was one of the best
holidays I ever had.
I shall never forget the spectacular sight of the city I saw from Moount Fable
that night. The roller-coaster ride, the stunts performed by the dolphins and the killer
whale at the Sea World were also exciting. I shall remember the thrill of having been
on one of longest rides in the monorail in Sentosa Island for many years to come.
I also enjoyed various varieties of seafood at the makeshift roadside stalls at the
Chinatown night market. I also enjoyed the shopping trips. My family and friends
agreed that the souvenirs were value for money, especially the silk scarves with pretty
prints and the attractive key chains.
15. The communicative purpose of this text is ...
a. To describe about animal story
b. To describe about the writer‟s story
c. To tell the rader about animal story
d. To tell the reader about the one story
16. What does the first sentence tell you ?
a. The past event c. The shopping trips
b. The opening of the story d. The varieties of seafood

17. “I shall never forget the spectacular sight of the city ..... “ (Paragraph 2)
What does the underlined word mean ?
a. Nice b. Usual c. Amazing d. Ordinary
Text for number 18 - 20
My family and I went on trip to Solo. We went on Monday by car and stayed at
my grandparents‟ house.
On Tuesday, we went tp Tawangangu. We enjoyed scenic view of its waterfall
and had lunch there. They served traditional custine like wedangronde, tempebacm,
fried fish and fried chicken. After that we continued our journey to Taman Jurug.
The next day, we went to Kasunan palace. We saw a lot of historical heritages
in the palace. After that we went shopping to Klewer market and solo grandmall. We
bought some souvenirs for my cousins. In the evening, we went sightseing town.
On Thursday morning, we said goodbye to our grandparents and came back to
our home. I really enjoyed my holiday. It was fun.
18. What sentence explains event in the text above ?
a. My family and I went on trip to Solo
b. On Tuesday, we went tp Tawangangu
c. The next day, we went to Kasunan palace
d. On Thursday morning, we said goodbye to our grandparents
19. When did the writer go on Wednesday ?
a. Taman Jurug c. Grandparents‟ house
b. Tawangmangu d. Kasunan Palace
20. When did the writer go home ?
a. On Thursday c. On Wednesday
b. On Tuesday d. On Monday
Text for number 21 – 25
On Saturday night, we went to the Town Hall. It was the last day of the year
and a large crowd of people had gathered under the Town Hall clock. It would strike
twelve in twenty minutes‟ time. Fifteen minutes passed and then, at five to twelve, the
clock stopped. The big minute hand did not move. We waited and waited, but nothing
happened. Suddenly someone shouted, “It‟s two minutes past twelve! The clock has
stopped!”
I looked at my watch. It was true. The big clock refused to welcome the
New Year. At that moment, everybody began to laugh and sing.
21. Which of the following is not true according to the text ?
a. The writer was waiting to celebrate the New Year
b. The writer brought a watch
c. The writer was very happy
d. The writer celebrated the New Year with his family
22. What probably happened when someone shouted that the clock stopped ?
a. Everybody directly celebrated the New Year
b. Everybody sings and laugh
c. Everybody looked for a watch
d. Everybody shouted too
23. What does the first sentence tell you ?
a. The problem that the writer met c. The funny thing in the story
b. The opening of the story d. The past event
24. “It would strike twelve in twenty minutes‟ time.”
The underlined word refers to ...
a. The clock c. The town
b. Author‟s watch d. The place

25. “The big clock refused to welcome the New Year.”
What is the antonym of the underline word ...
a. Reject c. Prevent
b. Accept d. Repel
ANSWER KEY
1. A 6. A 11. C 16. B 21. D
2. B 7. B 12. A 17. C 22. B
3. B 8. D 13. C 18. A 23. B
4. A 9. A 14. B 19. D 24. A
5. A 10. B 15. D 20. A 25. B

Appendix 3 :
Students’ Score of Experimental Class
No Students Pre-test Post-test
1 AMS 40 60
2 AAIR 40 52
3 AP 40 72
4 AJS 60 88
5 AAIR 48 76
6 AS 52 80
7 BS 40 64
8 CN 56 84
9 DAK 48 76
10 FTH 44 68
11 FAG 72 92
12 HMS 64 88
13 IA 32 60
14 MRKA 36 64
15 MPR 36 48
16 MNA 60 84
17 NN 36 36
18 NPA 44 72
19 PR 56 80
20 PO 52 80
21 RRHF 48 76
22 RM 44 76
23 RIS 36 68
24 TR 56 80
25 VLM 64 84

Students’ Score of Control Class
No Students Pre-test Post-test
1 ASA 56 76
2 BTAP 32 44
3 BG 44 40
4 CDS 40 40
5 DF 44 48
6 DAP 40 56
7 EMF 64 80
8 FN 60 68
9 FK 60 60
10 FHBB 60 80
11 GBY 48 56
12 HR 48 52
13 IT 40 48
14 MHA 52 76
15 NH 36 44
16 RT 36 32
17 RK 72 84
18 RD 48 60
19 RS 32 48
20 RAP 52 72
21 SM 32 32
22 SW 44 52
23 TWS 64 84
24 TR 56 64
25 WD 32 36
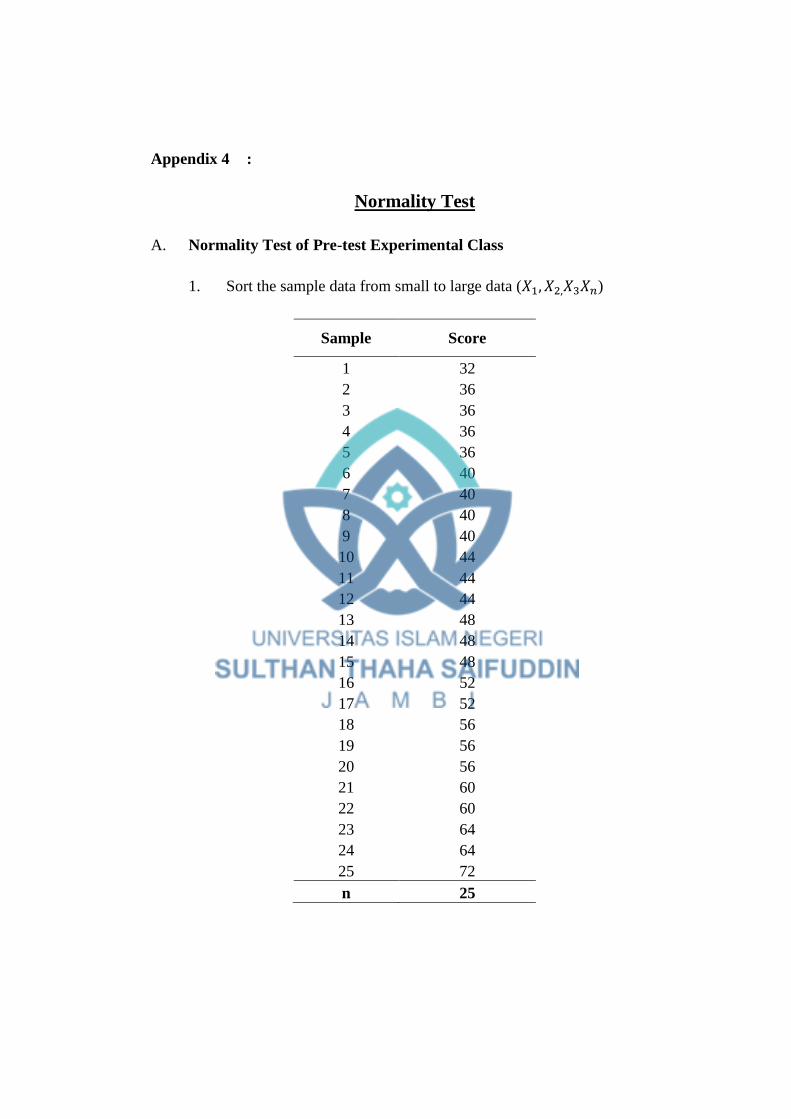
Appendix 4 :
Normality Test
A. Normality Test of Pre-test Experimental Class
1. Sort the sample data from small to large data ( )
Sample Score
1 32
2 36
3 36
4 36
5 36
6 40
7 40
8 40
9 40
10 44
11 44
12 44
13 48
14 48
15 48
16 52
17 52
18 56
19 56
20 56
21 60
22 60
23 64
24 64
25 72
n 25

2. Calculate the average of sample score by using a single average
X F FX
32 1 32
36 4 144
40 4 160
44 3 132
48 3 144
52 2 104
56 3 168
60 2 120
64 2 128
72 1 72
Total 25 1204
The formula of mean :
3. Calculate the Standard Deviation
X F FX X x2 fx2
32 1 32 -16,16 261,1456 261,1456
36 4 144 -12,16 147,8656 591,4624
40 4 160 -8,16 66,5856 266,3424
44 3 132 -4,16 17,3056 51,9168
48 3 144 -0,16 0,0256 0,0768
52 2 104 3,84 14,7456 29,4912
56 3 168 7,84 61,4656 184,3968
60 2 120 11,84 140,1856 280,3712

64 2 128 15,84 250,9056 501,8112
72 1 72 23,84 568,3456 568,3456
Total 25 1204 22,4 1528,576 2735,36
The formula of Standard Deviation :
√∑
√
√
√
8
4. Determine the Z value of each data by the formula :
-1,51
To Calculate Z2 and so on, thfollow the method of calculating Z1
5. Determine the Ztable based on the Zvalue
Z1 = round it into two numbers behind the comma become -1,51, then
the minus value is released to be positive then in the table the critical
value of the normal distribution is obtained by the value of Z1 is
0,4345
To find the Ztable from Z2 and so on can follow the method above.
6. Determine the F(Zi) based on the Ztable
If Zi negative (-), so 0,5 - Ztable
If Zi positive (+), so 0,5 + Ztable
Z1 = -1,51 , because the value of Z1 is negative, so calculate the F(Zi)
as follow :

F(Z1) = 0,5 – 0,4345 = 0,0655
To find the F(Z2) and so on can follow the method above.
7. Determine the S(Zi) by the formula :
S(Zi) =
0,04
8. Calculate the Lcount by the formula : F(Z1) – S(Zi)
L1 = |F(Z1) – S(Zi)| = |0,0655 – 0,04| = 0,0255
So that the table as below is found :
No Xi zi Ztable f(zi) f(kum) s(zi) Ifzi-szil
1 32 -1,51 0,4345 0,0655 1 0,04 0,0255
2 36 -1,14 0,3729 0,1271 2 0,08 0,0471
3 36 -1,14 0,3729 0,1271 3 0,12 0,0071
4 36 -1,14 0,3729 0,1271 4 0,16 0,0329
5 36 -1,14 0,3729 0,1271 5 0,20 0,0729
6 40 -0,76 0,2764 0,2236 6 0,24 0,0164
7 40 -0,76 0,2764 0,2236 7 0,28 0,0564
8 40 -0,76 0,2764 0,2236 8 0,32 0,0964
9 40 -0,76 0,2764 0,2236 9 0,36 0,1364
10 44 -0,39 0,1517 0,3483 10 0,40 0,0517
11 44 -0,39 0,1517 0,3483 11 0,44 0,0917
12 44 -0,39 0,1517 0,3483 12 0,48 0,1317
13 48 -0,01 0,0040 0,4960 13 0,52 0,0240
14 48 -0,01 0,0040 0,4960 14 0,56 0,0640
15 48 -0,01 0,0040 0,4960 15 0,6 0,1040
16 52 0,36 0,1406 0,6406 16 0,64 0,0006
17 52 0,36 0,1406 0,6406 17 0,68 0,0394
18 56 0,73 0,2673 0,7673 18 0,72 0,0473
19 56 0,73 0,2673 0,7673 19 0,76 0,0073
20 56 0,73 0,2673 0,7673 20 0,80 0,0327
21 60 1,11 0,3665 0,8665 21 0,84 0,0265
22 60 1,11 0,3665 0,8665 22 0,88 0,0135
23 64 1,48 0,4306 0,9306 23 0,92 0,0106
24 64 1,48 0,4306 0,9306 24 0,96 0,0294
25 72 2,23 0,4871 0,9871 25 1 0,0129

9. The value of Ltable with the significance ơ = 0,05 and n = 25 , then
found the Ltable of the critical value for the lilliefors test is 0,1730.
Based on the table, Lcount is 0,1364. Therefore, H0 is accepted because
the result shows that Lcount is lower than Ltable or 0,1364 ≤ 0,1730. It
means that the data in pre-test experimental class is normally
distributed.
B. Normality Test of Pre-test Control Class
1. Sort the sample data from small to large data ( )
Sample Score
1 32
2 32
3 32
4 32
5 36
6 36
7 40
8 40
9 40
10 44
11 44
12 44
13 48
14 48
15 48
16 52
17 52
18 56
19 56
20 60
21 60
22 60
23 64
24 64
25 72
N 25
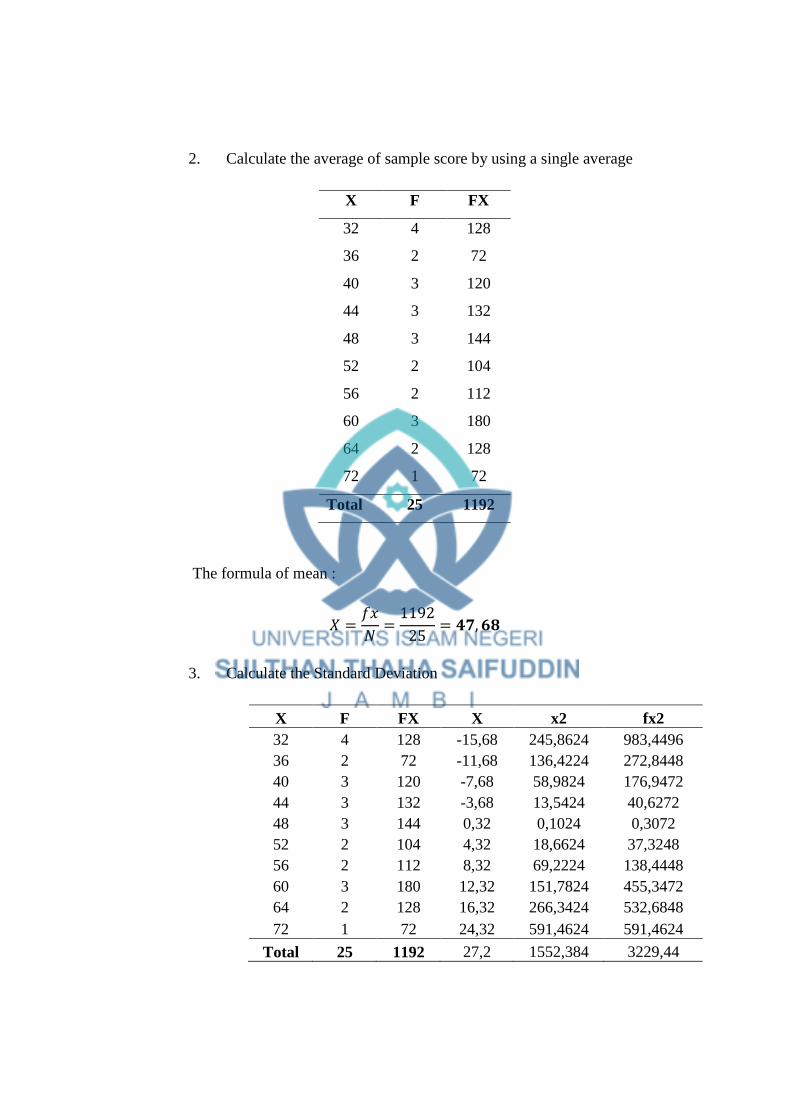
2. Calculate the average of sample score by using a single average
X F FX
32 4 128
36 2 72
40 3 120
44 3 132
48 3 144
52 2 104
56 2 112
60 3 180
64 2 128
72 1 72
Total 25 1192
The formula of mean :
3. Calculate the Standard Deviation
X F FX X x2 fx2
32 4 128 -15,68 245,8624 983,4496
36 2 72 -11,68 136,4224 272,8448
40 3 120 -7,68 58,9824 176,9472
44 3 132 -3,68 13,5424 40,6272
48 3 144 0,32 0,1024 0,3072
52 2 104 4,32 18,6624 37,3248
56 2 112 8,32 69,2224 138,4448
60 3 180 12,32 151,7824 455,3472
64 2 128 16,32 266,3424 532,6848
72 1 72 24,32 591,4624 591,4624
Total 25 1192 27,2 1552,384 3229,44

The formula of Standard Deviation :
√∑
√
√
√
4. Determine the Z value of each data by the formula :
-1,35
To Calculate Z2 and so on, thfollow the method of calculating Z1
5. Determine the Ztable based on the Zvalue
Z1 = round it into two numbers behind the comma become -1,35, then
the minus value is released to be positive then in the table the critical
value of the normal distribution is obtained by the value of Z1 is
0,4115
To find the Ztable from Z2 and so on can follow the method above.
6. Determine the F(Zi) based on the Ztable
If Zi negative (-), so 0,5 - Ztable
If Zi positive (+), so 0,5 + Ztable
Z1 = -1,35 , because the value of Z1 is negative, so calculate the F(Zi)
as follow :
F(Z1) = 0,5 – 0,4115 = 0,0885
To find the F(Z2) and so on can follow the method above.
7. Determine the S(Zi) by the formula :
S(Zi) =
0,04

8. Calculate the Lcount by the formula : F(Z1) – S(Zi)
L1 = |F(Z1) – S(Zi)| = |0,0885 – 0,04| = 0,0485
So that the table as below is found :
No Xi zi Ztable f(zi) f(kum) s(zi) Ifzi-szil
1 32 -1,35 0,4115 0,0885 1 0,04 0,0485
2 32 -1,35 0,4115 0,0885 2 0,08 0,0085
3 32 -1,35 0,4115 0,0885 3 0,12 0,0315
4 32 -1,35 0,4115 0,0885 4 0,16 0,0715
5 36 -1,01 0,3483 0,1562 5 0,20 0,0438
6 36 -1,01 0,3483 0,1562 6 0,24 0,0838
7 40 -0,66 0,2454 0,2546 7 0,28 0,0254
8 40 -0,66 0,2454 0,2546 8 0,32 0,0654
9 40 -0,66 0,2454 0,2546 9 0,36 0,1054
10 44 -0,32 0,1255 0,3745 10 0,40 0,0255
11 44 -0,32 0,1255 0,3745 11 0,44 0,0655
12 44 -0,32 0,1255 0,3745 12 0,48 0,1055
13 48 0,03 0,0120 0,5120 13 0,52 0,0080
14 48 0,03 0,0120 0,5120 14 0,56 0,0480
15 48 0,03 0,0120 0,5120 15 0,60 0.0880
16 52 0,37 0,1443 0,6443 16 0,64 0,0043
17 52 0,37 0,1443 0,6443 17 0,68 0,0357
18 56 0,72 0,2642 0,7642 18 0,72 0,0442
19 56 0,72 0,2642 0,7642 19 0,76 0,0042
20 60 1,06 0,3554 0,8554 20 0,80 0,0554
21 60 1,06 0,3554 0,8554 21 0,84 0,0154
22 60 1,06 0,3554 0,8554 22 0,88 0,0246
23 64 1,41 0,4207 0,9207 23 0,92 0,0007
24 64 1,41 0,4207 0,9207 24 0,96 0,0393
25 72 2,10 0,4821 0,9821 25 1 0,0179
9. The value of Ltable with the significance ơ = 0,05 and n = 25 , then
found the Ltable of the critical value for the lilliefors test is 0,1730.
Based on the table, Lcount is 0,1055. Therefore, H0 is accepted because
the result shows that Lcount is lower than Ltable or 0,1055 ≤ 0,1730. It
means that the data in pre-test experimental class is normally
distributed.

C. Normality Test of Experimental Class Post-test
1. Sort the sample data from small to large data ( )
Sample Score
1 36
2 48
3 52
4 60
5 60
6 64
7 64
8 68
9 68
10 72
11 72
12 76
13 76
14 76
15 76
16 80
17 80
18 80
19 80
20 84
21 84
22 84
23 83
24 83
25 92
N 25
2. Calculate the average of sample score by using a single average
X F FX
36 1 36
48 1 48
52 1 52

60 2 120
64 2 128
68 2 136
72 2 144
76 4 304
80 4 320
84 3 252
88 2 176
92 1 92
Total 25 1808
The formula of mean :
3. Calculate the Standard Deviation
X F FX X x2 fx2
36 1 36 -36,32 1319,1424 1319,1424
48 1 48 -24,32 591,4624 591,4624
52 1 52 -20,32 412,9024 412,9024
60 2 120 -12,32 151,7824 303,5648
64 2 128 -8,32 69,2224 138,4448
68 2 136 -4,32 18,6624 37,3248
72 2 144 -0,32 0,1024 0,2048
76 4 304 3,68 13,5424 54,1696
80 4 320 7,68 58,9824 235,9296
84 3 252 11,68 136,4224 409,2672
88 2 176 15,68 245,8624 491,7248
92 1 92 19,68 387,3024 387,3024
Total 25 1808 -47,84 3405,3888 4381,44

The formula of Standard Deviation :
√∑
√
√
√
4. Determine the Z value of each data by the formula :
-2,69
To Calculate Z2 and so on, thfollow the method of calculating Z1
5. Determine the Ztable based on the Zvalue
Z1 = round it into two numbers behind the comma become -2,69, then
the minus value is released to be positive then in the table the critical
value of the normal distribution is obtained by the value of Z1 is
0,4964
To find the Ztable from Z2 and so on can follow the method above.
6. Determine the F(Zi) based on the Ztable
If Zi negative (-), so 0,5 - Ztable
If Zi positive (+), so 0,5 + Ztable
Z1 = -2,69 , because the value of Z1 is negative, so calculate the F(Zi)
as follow :
F(Z1) = 0,5 – 0,4964 = 0,0036
To find the F(Z2) and so on can follow the method above.
7. Determine the S(Zi) by the formula :
S(Zi) =
0,04
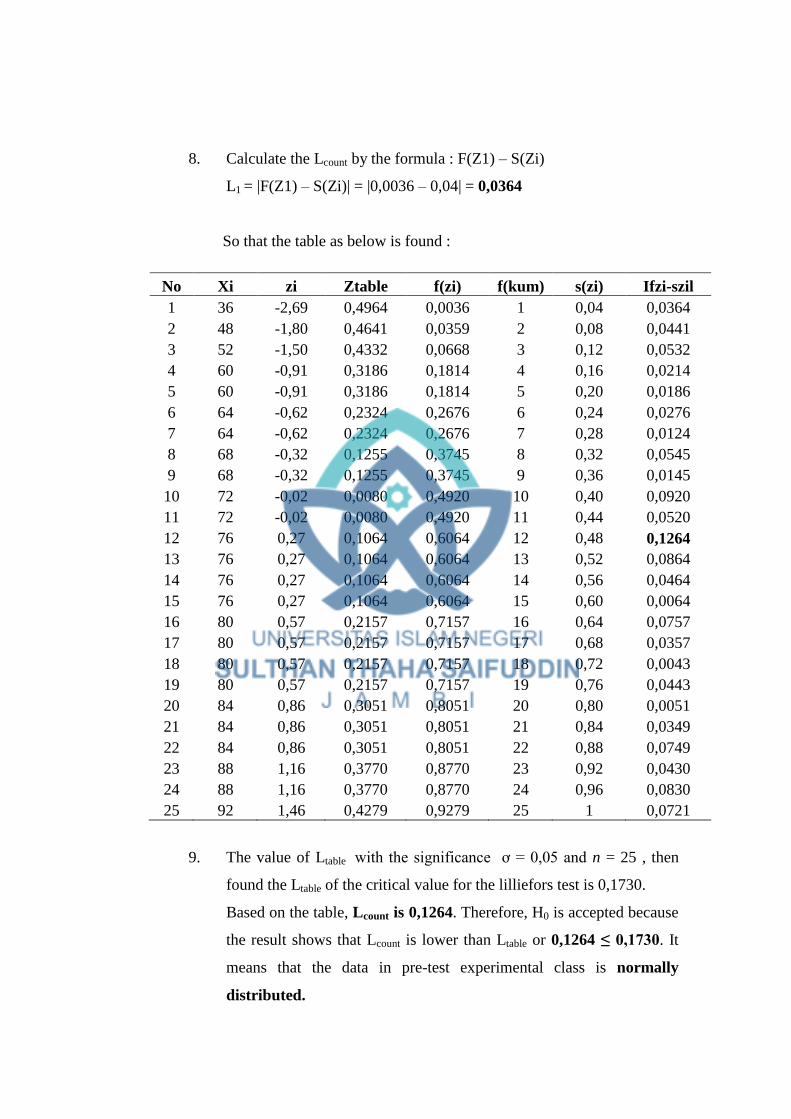
8. Calculate the Lcount by the formula : F(Z1) – S(Zi)
L1 = |F(Z1) – S(Zi)| = |0,0036 – 0,04| = 0,0364
So that the table as below is found :
No Xi zi Ztable f(zi) f(kum) s(zi) Ifzi-szil
1 36 -2,69 0,4964 0,0036 1 0,04 0,0364
2 48 -1,80 0,4641 0,0359 2 0,08 0,0441
3 52 -1,50 0,4332 0,0668 3 0,12 0,0532
4 60 -0,91 0,3186 0,1814 4 0,16 0,0214
5 60 -0,91 0,3186 0,1814 5 0,20 0,0186
6 64 -0,62 0,2324 0,2676 6 0,24 0,0276
7 64 -0,62 0,2324 0,2676 7 0,28 0,0124
8 68 -0,32 0,1255 0,3745 8 0,32 0,0545
9 68 -0,32 0,1255 0,3745 9 0,36 0,0145
10 72 -0,02 0,0080 0,4920 10 0,40 0,0920
11 72 -0,02 0,0080 0,4920 11 0,44 0,0520
12 76 0,27 0,1064 0,6064 12 0,48 0,1264
13 76 0,27 0,1064 0,6064 13 0,52 0,0864
14 76 0,27 0,1064 0,6064 14 0,56 0,0464
15 76 0,27 0,1064 0,6064 15 0,60 0,0064
16 80 0,57 0,2157 0,7157 16 0,64 0,0757
17 80 0,57 0,2157 0,7157 17 0,68 0,0357
18 80 0,57 0,2157 0,7157 18 0,72 0,0043
19 80 0,57 0,2157 0,7157 19 0,76 0,0443
20 84 0,86 0,3051 0,8051 20 0,80 0,0051
21 84 0,86 0,3051 0,8051 21 0,84 0,0349
22 84 0,86 0,3051 0,8051 22 0,88 0,0749
23 88 1,16 0,3770 0,8770 23 0,92 0,0430
24 88 1,16 0,3770 0,8770 24 0,96 0,0830
25 92 1,46 0,4279 0,9279 25 1 0,0721
9. The value of Ltable with the significance ơ = 0,05 and n = 25 , then
found the Ltable of the critical value for the lilliefors test is 0,1730.
Based on the table, Lcount is 0,1264. Therefore, H0 is accepted because
the result shows that Lcount is lower than Ltable or 0,1264 ≤ 0,1730. It
means that the data in pre-test experimental class is normally
distributed.

D. Normality Test of Post-test Control Class
1. Sort the sample data from small to large data ( )
Sample Score
1 32
2 32
3 36
4 40
5 40
6 44
7 44
8 48
9 48
10 48
11 52
12 52
13 56
14 56
15 60
16 60
17 64
18 68
19 72
20 76
21 76
22 80
23 80
24 84
25 84
N 25
2. Calculate the average of sample score by using a single average
X F FX
32 2 64
36 1 36
40 2 80

44 2 88
48 3 144
52 2 104
56 2 112
60 2 120
64 1 64
68 1 68
72 1 72
76 2 152
80 2 160
84 2 168
Total 25 1432
The formula of mean :
3. Calculate the Standard Deviation
X F FX X x2 fx2
32 2 64 -25,28 639,0784 1278,1568
36 1 36 -21,28 452,8384 452,8384
40 2 80 -17,28 298,5984 597,1968
44 2 88 -13,28 176,3484 352,7168
48 3 144 -9,28 86,1184 258,3552
52 2 104 -5,28 27,8784 55,7568
56 2 112 -1,28 1,6384 3,2768
60 2 120 2,72 7,3984 14,7968
64 1 64 6,72 45,1584 45,1584
68 1 68 10,72 114,9184 114,9184
72 1 72 14,72 216,6784 216,6784
76 2 152 18,72 350,4384 700,8768
80 2 160 22,72 516,1984 1032,3968
84 2 168 26,72 713,9584 1427,9168
Total 25 1432 10,08 3647,2476 6551,04
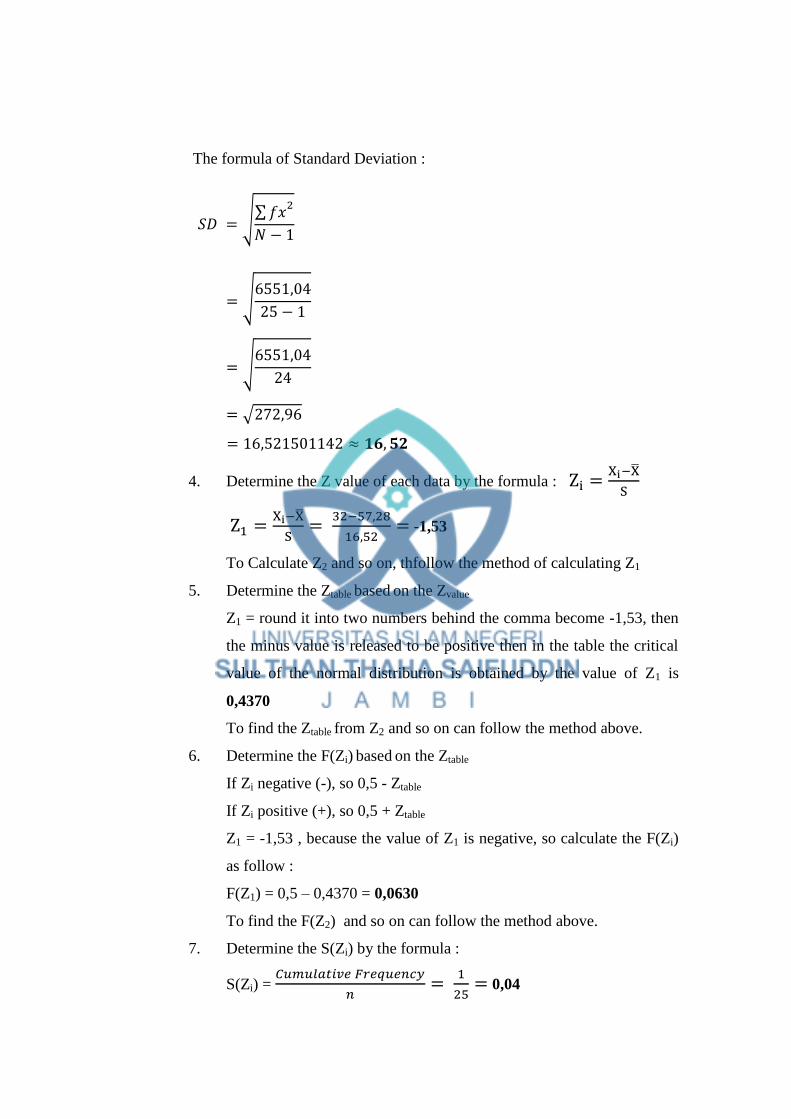
The formula of Standard Deviation :
√∑
√
√
√
4. Determine the Z value of each data by the formula :
-1,53
To Calculate Z2 and so on, thfollow the method of calculating Z1
5. Determine the Ztable based on the Zvalue
Z1 = round it into two numbers behind the comma become -1,53, then
the minus value is released to be positive then in the table the critical
value of the normal distribution is obtained by the value of Z1 is
0,4370
To find the Ztable from Z2 and so on can follow the method above.
6. Determine the F(Zi) based on the Ztable
If Zi negative (-), so 0,5 - Ztable
If Zi positive (+), so 0,5 + Ztable
Z1 = -1,53 , because the value of Z1 is negative, so calculate the F(Zi)
as follow :
F(Z1) = 0,5 – 0,4370 = 0,0630
To find the F(Z2) and so on can follow the method above.
7. Determine the S(Zi) by the formula :
S(Zi) =
0,04

8. Calculate the Lcount by the formula : F(Z1) – S(Zi)
L1 = |F(Z1) – S(Zi)| = |0,0630 – 0,04| = 0,0230
So that the table as below is found :
No Xi zi Ztable f(zi) f(kum) s(zi) Ifzi-szil
1 32 -1,53 0,4370 0,0630 1 0,04 0,0230
2 32 -1,53 0,4370 0,0630 2 0,08 0,0170
3 36 -1,29 0,4370 0,0985 3 0,12 0,0215
4 40 -1,05 0,3531 0,1469 4 0,16 0,0131
5 40 -1,05 0,3531 0,1469 5 0,20 0,0531
6 44 -0,80 0,2881 0,2119 6 0,24 0,0281
7 44 -0,80 0,2881 0,2119 7 0,28 0,0681
8 48 -0,56 0,2123 0,2877 8 0,32 0,0323
9 48 -0,56 0,2123 0,2877 9 0,36 0,0723
10 48 -0,56 0,2123 0,2877 10 0,40 0,1123
11 52 -0,32 0,1255 0,3745 11 0,44 0,0655
12 52 -0,32 0,1255 0,3745 12 0,48 0,1055
13 56 -0,08 0,0319 0,4681 13 0,52 0,0519
14 56 -0,08 0,0319 0,4681 14 0,56 0,0919
15 60 0,16 0,0636 0,5636 15 0,60 0,0364
16 60 0,16 0,0636 0,5636 16 0,64 0,0764
17 64 0,41 0,1591 0,6591 17 0,68 0,0209
18 68 0,65 0,2422 0,7422 18 0,72 0,0222
19 72 0,90 0,3159 0,8156 19 0,76 0,0556
20 76 1,13 0,3708 0,8708 20 0,80 0,0708
21 76 1,13 0,3708 0,8708 21 0,84 0,0308
22 80 1,38 0,4162 0,9162 22 0,88 0,0362
23 80 1,38 0,4162 0,9162 23 0,92 0,0038
24 84 1,62 0,4474 0,9474 24 0,96 0,0126
25 84 1,62 0,4474 0,9474 25 1 0,0526
9. The value of Ltable with the significance ơ = 0,05 and n = 25 , then
found the Ltable of the critical value for the lilliefors test is 0,1730.
Based on the table, Lcount is 0,1123. Therefore, H0 is accepted because
the result shows that Lcount is lower than Ltable or 0,1123 ≤ 0,1730. It
means that the data in pre-test experimental class is normally
distributed.

Appendix 5 :
Homogeneity Test
In order to know the homogeneity of the data, the writer did the
homogeneity test. To do the homogeneity test, he tested the score of pretest and
post-test in both experiment and control class using Fisher test.
Hypothesis:
H0 : The experimental class is homogenous to the control class
Ha : The experimental class is not homogenous to the control class
The criteria of the test:
α = 0.05
H0 : ≤
Ha : ≥
The formula used in homogeneity test can be seen as follows :
ℎ ℎ ℎ
ℎ
With :
∑

A. Homogeneity Test of Experimental and Control Class Post-test
a. Score of Experimental Class Post-test
No Students Score
1 AMS 60
2 AAIR 52
3 AP 72
4 AJS 88
5 AA 76
6 AS 80
7 BS 64
8 CN 84
9 DAK 76
10 FTH 68
11 FAG 92
12 HMS 88
13 IA 60
14 MRKA 64
15 MPR 48
16 MNA 84
17 NN 36
18 NPA 72
19 PR 80
20 PO 80
21 RRHF 76
22 RM 76
23 RIS 68
24 TR 80

25 VLM 84
From the data above, can be obtained :
No Students Score X-Xbar (x-x)2
1 AMS 60 -12,32 151,782
2 AAIR 52 -20,32 412,902
3 AP 72 -0,32 0,1024
4 AJS 88 15,68 245,862
5 AA 76 3,68 13,5424
6 AS 80 7,68 58,9824
7 BS 64 -8,32 69,2224
8 CN 84 11,68 136,422
9 DAK 76 3,68 13,5424
10 FTH 68 -4,32 18,6624
11 FAG 92 19,68 387,302
12 HMS 88 15,68 245,862
13 IA 60 -12,32 151,782
14 MRKA 64 -8,32 69,2224
15 MPR 48 -24,32 591,462
16 MNA 84 11,68 136,422
17 NN 36 -36,32 1319,14
18 NPA 72 -0,32 0,1024
19 PR 80 7,68 58,9824
20 PO 80 7,68 58,9824
21 RRHF 76 3,68 13,5424
22 RM 76 3,68 13,5424

23 RIS 68 -4,32 18,6624
24 TR 80 7,68 58,9824
25 VLM 84 11,68 136,422
Total Score
1808 0 4381,44
b. Score of Control Class Post-test
No Students Score
1 ASA 76
2 BTAP 44
3 BG 40
4 CDS 40
5 DF 48
6 DAP 56
7 EMF 80
8 FN 68
9 FK 60
10 FHBB 80
11 GBY 56
12 HR 52
13 IT 48
14 MHA 76
15 NH 44
16 RT 32
17 RK 84

18 RD 60
19 RS 48
20 RAP 72
21 SM 32
22 SW 52
23 TWS 84
24 TR 64
25 WD 36
From the data above, can be obtained :
No Students Score X-Xbar (x-x)2
1 ASA 76 18,72 350,4384
2 BTAP 44 -13,28 176,3484
3 BG 40 -17,28 298,5984
4 CDS 40 -17,28 298,5984
5 DF 48 -9,28 86,1184
6 DAP 56 -1,28 1,6384
7 EMF 80 22,72 516,1984
8 FN 68 10,72 114,9184
9 FK 60 2,72 7,3984
10 FHBB 80 22,72 516,1984
11 GBY 56 -1,28 1,6384
12 HR 52 -5,28 27,8784
13 IT 48 -9,28 86,1184
14 MHA 76 18,72 350,4384
15 NH 44 -13,28 176,3484
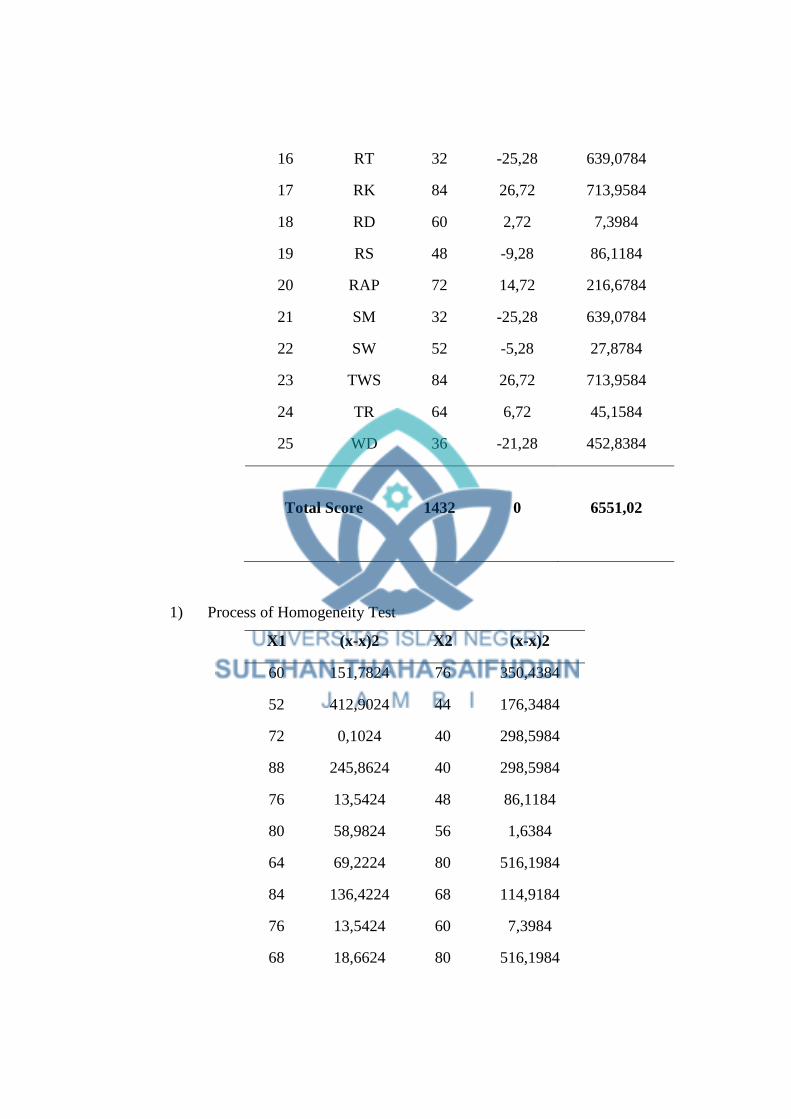
16 RT 32 -25,28 639,0784
17 RK 84 26,72 713,9584
18 RD 60 2,72 7,3984
19 RS 48 -9,28 86,1184
20 RAP 72 14,72 216,6784
21 SM 32 -25,28 639,0784
22 SW 52 -5,28 27,8784
23 TWS 84 26,72 713,9584
24 TR 64 6,72 45,1584
25 WD 36 -21,28 452,8384
Total Score
1432 0 6551,02
1) Process of Homogeneity Test
X1 (x-x)2 X2 (x-x)2
60 151,7824 76 350,4384
52 412,9024 44 176,3484
72 0,1024 40 298,5984
88 245,8624 40 298,5984
76 13,5424 48 86,1184
80 58,9824 56 1,6384
64 69,2224 80 516,1984
84 136,4224 68 114,9184
76 13,5424 60 7,3984
68 18,6624 80 516,1984

92 387,3024 56 1,6384
88 245,8624 52 27,8784
60 151,7824 48 86,1184
64 69,2224 76 350,4384
48 591,4624 44 176,3484
84 136,4224 32 639,0784
36 1319,1424 84 713,9584
72 0,1024 60 7,3984
80 58,9824 48 86,1184
80 58,9824 72 216,6784
76 13,5424 32 639,0784
76 13,5424 52 27,8784
68 18,6624 84 713,9584
80 58,9824 64 45,1584
84 136,4224 36 452,8384
Total 4381,44 6551,02
X 72,32 57,28
∑
∑

2) Compare with
With the formula as follow :
with the significance ơ = 0,05 is 1,98
According to the calculation above, the data of experimental and controll
class pre-test is homogenous. It can be seen from ≤ or 1,50 ≤
1,98.

Appendix 6 :
Paired Sample T-test
The formula of Paired Sample t-test is as follows :
√
( √
) ( √
)
The formula above is the main formula. Before using the formula, the writer
also used some calculation procedure such as below :
7. Determining mean of variable X1 (Pre-test experimental class)
∑
8. Determining mean of variable X2 (Post-test experimental class)
∑
9. Determining variance (s12) and standard deviation (s1) of variable X1
S12
∑
S1
= √ 2
= √
8
10. Determining variance (s22) and standard deviation (s2) of variable X2
S12
∑

S1
= √ 2
= √
11. Determining Correlation (r)
The writer calculated the score of correlation by using correlation
calculator in https://ncalculators.com/statistics/correlation-coefficient-
calculator.htm. The result of correlation (r) = 0,9055.
12. Determining t0 (t-test)
√
( √
) ( √
)
√
(
√ ) (
√ )
√
(
) (
)
√
√
13. Determining degree of freedom (df)
atau
Because = 48 is not in the table, whereas in the tables there is =
45 and 50, interpolation is done as follows ::
With significance ơ = 0,05

C = 2,01 – 0,006
,02
So, the value of df = 48 at the degree freedom of significance ơ =
0,05 ( ) is ,02.
14. The testing of hypothesis
The statistical hypothesis of the research is :
H01 : There is a significant effect on students‟ reading comprehension
before and after being taught by using cooperative integrated reading
and composition (CIRC) technique.
Ha1 : There is no a significant effect on students‟ reading comprehension
before and after being taught by using cooperative integrated reading
and composition (CIRC) technique.
The criteria used to analyze the test hypothesis is such below :
3. If t-test (t0) ≥ t-table (tt) in the significance degree of 0,05, H0 (null
hypothesis) is rejected
4. If t-test (t0) ≤ t-table (tt) in the significance degree of 0,05, H0 (null
hypothesis) is accepted
Based on the calculating above,. H0 is rejected because the result
shows that the t-test ( is highest than t-table (ttable) or -20,30 ≥ -2,02. It
means that there is a significant effect on students‟ reading comprehension
before and after being taught by using cooperative integrated reading and
composition (CIRC) technique.

Appendix 7 :
Independent Sample T-test
The formula of independent sample t-test is as follows :
The formula above is the main formula. Before using the formula, the writer
also used some calculation procedure such as below :
9. Determining mean of variable X2 (Post-test Experimental Class)
∑
10. Determining mean of variable Y2 (Post-test Control Class)
∑
11. Determining standard of deviation score of variable X2
√∑
√
√
√
12. Determining standard of deviation score of variable Y2
√∑
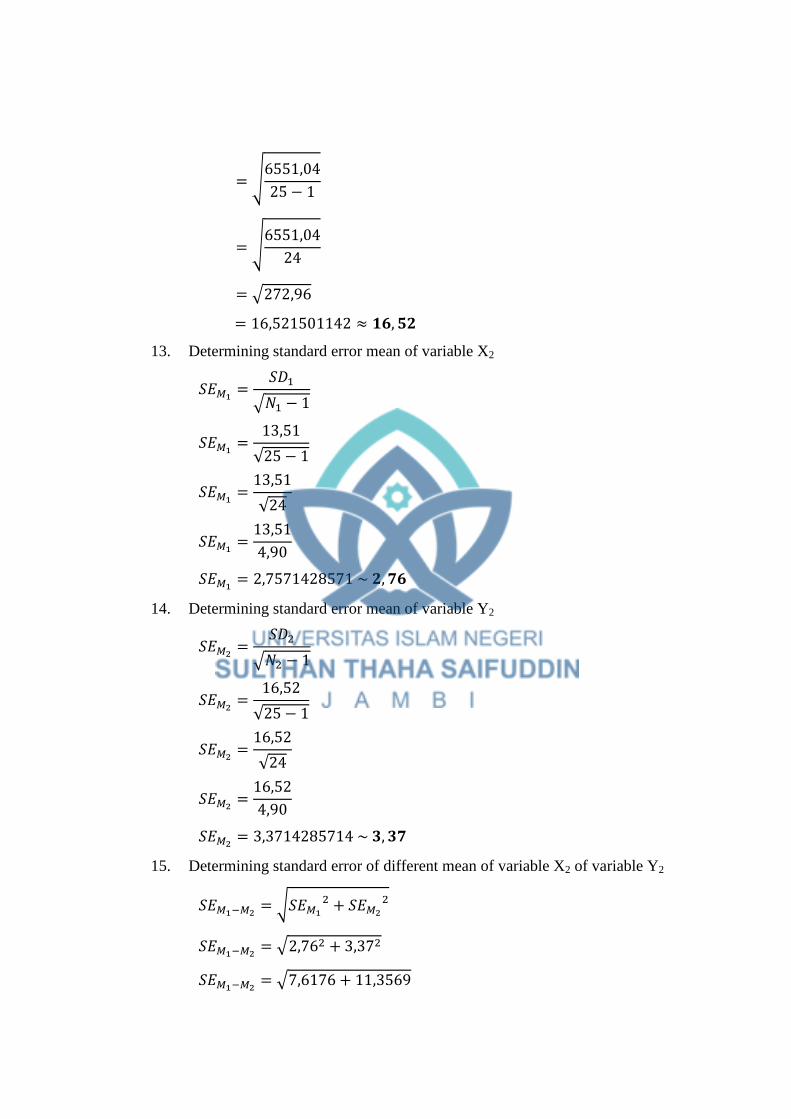
√
√
√
13. Determining standard error mean of variable X2
√
√
√
14. Determining standard error mean of variable Y2
√
√
√
15. Determining standard error of different mean of variable X2 of variable Y2
√
√
√

√
16. Determining t0 (t-test)
17. Determining degree of freedom
atau
Because = 48 is not in the table, whereas in the tables there is =
45 and 50, interpolation is done as follows ::
With significance ơ = 0,05
C = 2,01 – 0,006
,02
So, the value of df = 48 at the degree freedom of significance ơ = 0,05
( ) is ,02.
18. The testing of hypothesis
The statistical hypothesis of the research is :
H02: There is a significant difference on students‟ reading comprehension
between the students who taught by using cooperative integrated
reading and composition (CIRC) technique and those who were not.
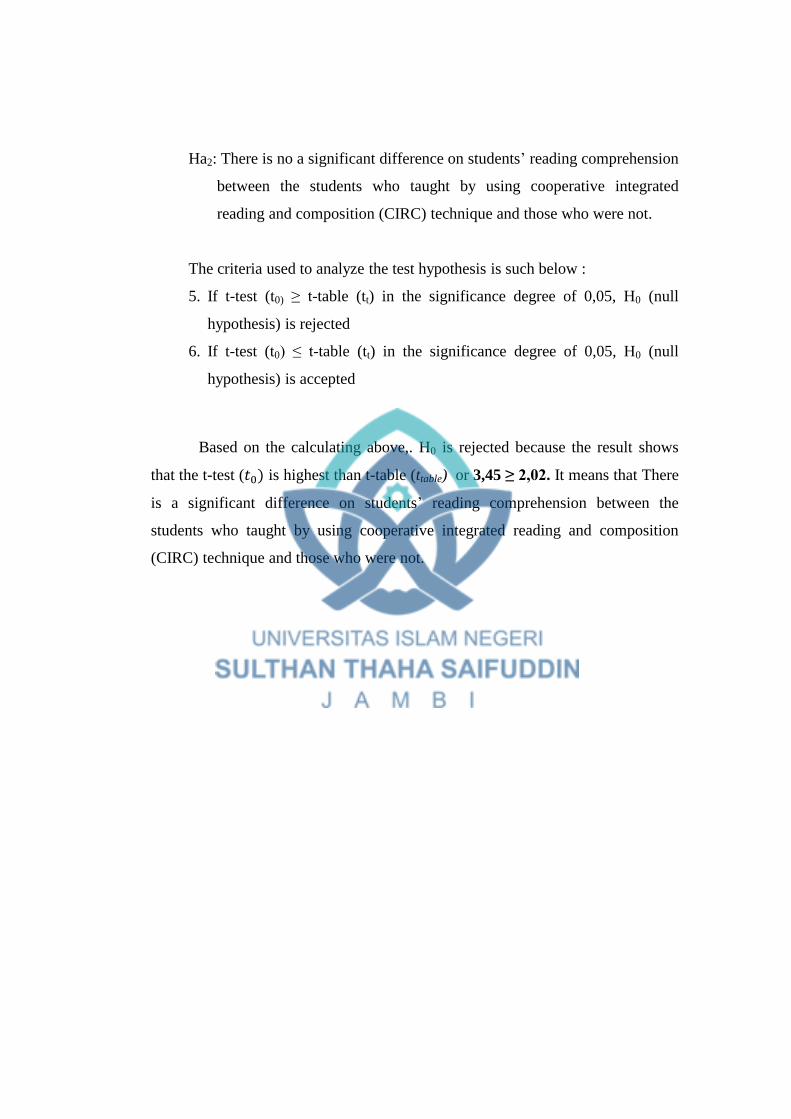
Ha2: There is no a significant difference on students‟ reading comprehension
between the students who taught by using cooperative integrated
reading and composition (CIRC) technique and those who were not.
The criteria used to analyze the test hypothesis is such below :
5. If t-test (t0) ≥ t-table (tt) in the significance degree of 0,05, H0 (null
hypothesis) is rejected
6. If t-test (t0) ≤ t-table (tt) in the significance degree of 0,05, H0 (null
hypothesis) is accepted
Based on the calculating above,. H0 is rejected because the result shows
that the t-test ( is highest than t-table (ttable) or 3,45 ≥ 2,02. It means that There
is a significant difference on students‟ reading comprehension between the
students who taught by using cooperative integrated reading and composition
(CIRC) technique and those who were not.
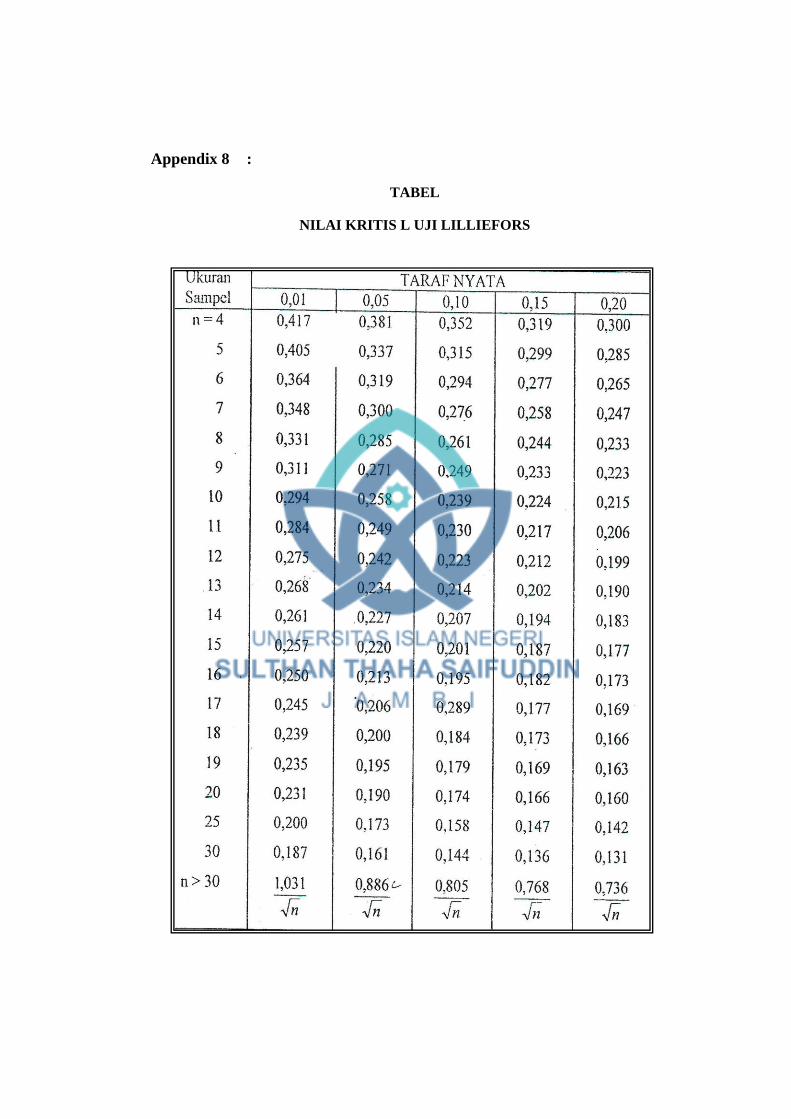
Appendix 8 :
TABEL
NILAI KRITIS L UJI LILLIEFORS

Appendix 9 :
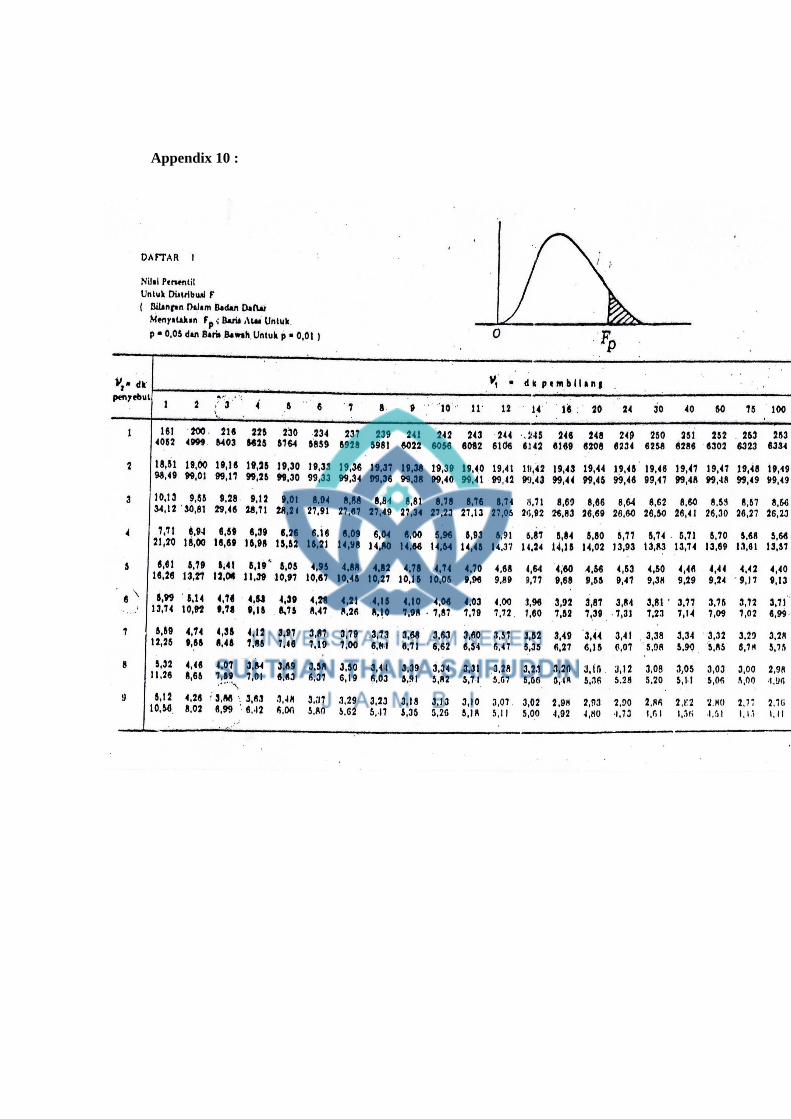
Appendix 10 :


Appendix 11 : Tabel Distribusi
untuk uji dua pihak (two tail test)
0,50 0,20 0,10 0,05 0,02 0,01
untuk uji satupihak (one tail test)
0,25 0,10 0,05 0,025 0,01 0,005
1
2
3
4
5
6
7
8
9
10
11
12
13
14
15
16
17
18
19
1,000
0,816
0,765
0,741
0,727
0,718
0,711
0,706
0,703
0,700
0,697
0,695
0,692
0,691
0,690
0,689
0,688
0,688
0,687
3,078
1,886
1,638
1,533
1,476
1,440
1,415
1,397
1,383
1,372
1,363
1,356
1,350
1,345
1,341
1,337
1,333
1,330
1,328
6,314
2,920
2,353
2,132
2,015
1,943
1,895
1,860
1,833
1,812
1,796
1,782
1,771
1,761
1,753
1,746
1,740
1,734
1,729
12,706
4,303
3,182
2,776
2,571
2,447
2,365
2,306
2,262
2,228
2,201
2,179
2,160
2,145
2,131
2,120
2,110
2,101
2,093
31,821
6,965
4,541
3,747
3,365
3,143
2,998
2,896
2,821
2,764
2,718
2,681
2,650
2,624
2,602
2,583
2,567
2,552
2,539
63,657
9,925
5,841
4,604
4,032
3,707
3,499
3,355
3,250
3,169
3,106
3,055
3,012
2,977
2,947
2,921
2,898
2,878
2,861

20
21
22
23
24
25
26
27
28
29
30
40
60
120
0,687
0,686
0,686
0,685
0,685
0,684
0,684
0,684
0,683
0,683
0,683
0,681
0,679
0,677
0,674
1,325
1,323
1,321
1,319
1,318
1,316
1,315
1,314
1,313
1,311
1,310
1,303
1,296
1,289
1,282
1,725
1,721
1,717
1,714
1,711
1,708
1,706
1,703
1,701
1,699
1,697
1,684
1,671
1,658
1,645
2,086
2,080
2,074
2,069
2,064
2,060
2,056
2,052
2,048
2,045
2,042
2,021
2,000
1,980
1,960
2,528
2,518
2,508
2,500
2,492
2,485
2,479
2,473
2,467
2,462
2,457
2,423
2,390
2,358
2,326
2,845
2,831
2,819
2,807
2,797
2,787
2,779
2,771
2,763
2,756
2,750
2,704
2,660
2,617
2,576

SILABUS BAHASA INGGRIS
Sekolah : SMPN 06 BATANGHARI
Kelas : VIII
Tahun : 2017 - 2018
Kompetensi Inti :
KI 1: Menghargai dan menghayati ajaran agama yang dianutnya.
KI 2: Menghargai dan menghayati perilaku jujur, disiplin, tanggungjawab, peduli (toleransi, gotong royong), santun, percaya diri, dalam berinteraksi
secara efektif dengan lingkungan sosial dan alam dalam jangkauan pergaulan dan keberadaannya
KI 3: Memahami dan menerapkan pengetahuan (faktual, konseptual, dan prosedural) berdasarkan rasa ingin tahunya tentang ilmu pengetahuan,
teknologi, seni, budaya terkait fenomena dan kejadian tampak mata.
KI 4: Mengolah, menyaji, dan menalar dalam ranah konkret (menggunakan, mengurai, merangkai, memodifikasi, dan membuat) dan ranah abstrak
(menulis, membaca, menghitung, menggambar, dan mengarang) sesuai dengan yang dipelajari di sekolah dan sumber lain yang sama dalam
sudut pandang/teori.
KOMPETENSI
DASAR
MATERI POKOK PEMBELAJARAN PENILAIAN ALOKASI
WAKTU
SUMBER
BELAJAR
3.10 Menerapkan
struktur teks
dan unsur
kebahasaan
untuk
melaksanaka
n fungsi sosial teks
Teks deskriptif lisan
dan tulis, pendek dan
sederhana, tentang
orang, binatang, dan
benda
Fungsi sosial
Mendeskripsikan
Mengamati
Siswa
mendengarkan/membaca/me
nonton beberapa contoh teks
deskriptif singkat dan
sederhana tentang orang,
KRITERIA PENILAIAN:
Tingkat ketercapaian
fungsi sosial teks
descriptive singkat dan
sederhana tentang
orang, benda dan
16 JP
Buku Teks
wajib
Keteladanan
ucapan dan
tindakan guru menggunaka

deskriptif
dengan
menyatakan
dan
menanyakan
tentang
deskripsi
orang,
binatang, dan
benda,
pendek dan
sederhana,
sesuai
dengan
konteks
penggunaan
nya .
4.11 Menangkap
makna dalam
teks
deskriptif
lisan dan
tulis, pendek
dan
sederhana.
4.12 Menyusun teks
deskriptif lisan
dan tulis,
pendek dan
sederhana,
tentang orang,
orang, binatang dan
benda untuk
kepentingan menjual,
membeli,
mengenalkan,
melaporkan
kehilangan.
Struktur teks
a. Penyebutan nama
orang, binatang,
benda dan nama
bagian-bagiannya
yang dipilih untuk
dideskripsikan
b. Penyebutan sifat
orang, binatang,
benda dan
bagiannya, dan
c. Penyebutan
tindakan dari atau
terkait dengan
orang, binatang,
benda
Panjang teks: kurang
lebih 6 (enam) kalimat.
I have a niece. Her name is Fanny. She is
five years old. She has chubby cheeks and flat
benda dan binatang.
Siswa mengikuti
mengucapkan teks deskriptif
singkat dan sederhana
tentang orang, benda dan
binatang
Siswa membaca untuk
memahami berbagai
informasi dan makna teks
deskriptif singkat dan
sederhana tentang orang,
benda dan binatang dengan
pengucapan dan intonasi
yang baik
Siswa berlatih menentukan
informasi rinci
Menanya
Dengan bimbingan dan arahan
guru, siswa menanya
perbedaan antar berbagai teks
descriptive singkat dan
sederhana tentang orang,
benda dan binatang, dalam
berbagai konteks
Mengeksplorasi
Siswa membaca contoh-
contoh teks descriptive
singkat dan sederhana
binatang,.
Tingkat kelengkapan
dan keruntutan struktur
teks teks descriptive
singkat dan sederhana
tentang orang, benda
dan binatang,
Tingkat ketepatan unsur
kebahasaan: tata
bahasa, kosa kata,
ucapan, tekanan kata,
intonasi
CARA PENILAIAN:
Tes Tulis
Pilihan Ganda
Jawaban singkat
Essay
Kinerja (praktik)
Bermain peran
mengenalkan sahabat
pena
Bermain peran
membeli/menjual suatu
barang
Bermain peran
melaporkan orang hilang
n setiap
tindakan
komunikasi
interpersonal
dengan benar
dan akurat
Contoh
peragaan
dalam bentuk
rekaman
CD/VCD/
DVD/kaset
Contoh
interaksi
tertulis
Contoh teks
tertulis
Sumber dari
internet:
www.dai
lyenglish
.com
http://am
ericanen
glish.stat
e.gov/file
s/ae/reso
urce_file

binatang, dan
benda, dengan
memperhatika
n fungsi sosial,
struktur teks,
dan unsur
kebahasaan
yang benar dan
sesuai konteks.
nose. Her eyes are
slanted. She looks funny when she smiles.
Unsur kebahasaan
(1) Pertanyaan dan
pernyataan tentang
deskripsi
How does your
brother look like?
He’s short and
wears glasses
(2) Penyebutan kata
benda singular
dengan a dan the,
dan plural (-s).
(3) Kata ganti it, they,
she, we, dst; our, my, your, their, dst.
(4) Kata sifat, tanpa
atau dengan
penambahan kata
quite, very, atau
kombinasi seperti
dark brown, nice
little cat, dan
semacamnya.
(5) Ejaan dan tulisan
tangan dan cetak
tentang orang, benda dan
binatang dari berbagai
sumber lain.
Siswa mendeskripsikan
dengan singkat dan
sederhana tentang orang,
benda dan binatang untuk
tujuan menjual, membeli,
mengenalkan, melaporkan
kehilangan menggunakan
Bahasa Inggris dalam
konteks simulasi, role-play,
dan kegiatan lain yang
terstruktur
Mengasosiasi
Dalam kerja kelompok
terbimbing siswa
menganalisis fungsi sosial,
struktur teks dan unsur
bahasa serta format
penulisan yang digunakan
untuk mendeskripsikan
orang, benda atau binatang
dengan tujuan menjual,
membeli, mengenalkan,
atau melaporkan
kehilangan, .
Siswa menanyakan balikan
(feedback) dari guru dan
teman tentang setiap yang
Ketepatan dan
kesesuaian
menggunakan struktur
teks dan unsur
kebahasaan dalam
menyusun teks
deskripsi
Observasi:
Penilaian untuk tujuan
memberi balikan. Sasaran
penilaian:
Upaya menggunakan
bahasa Inggris untuk
mendeskripsikan
dengan singkat dan
sederhana tentang
orang, benda dan
binatang ketika ada
kesempatan.
Kesungguhan siswa
dalam proses
pembelajaran di
setiap tahapan.
Menunjukkan
perilaku tanggung
jawab, peduli,
kerjasama, dan cinta
damai, dalam
melaksanakan
s
http://lea
rnenglish
.britishco
uncil.org
/en/

yang jelas dan rapi
(6) Ucapan, tekanan
kata, intonasi,
ketika
mempresentasikan
secara lisan.
Topik
Berbagai hal terkait
dengan orang, binatang dan benda
di sekitar rumah, sekolah dan
lingkungan.
dia sampaikan dalam kerja
kelompok.
Siswa menyimpulkan hasil
analisisnya terkait Fungsi
sosial, struktur teks dan
unsur kebahasaan dari teks
deskriptif tentang orang,
benda dan binatang dengan
tujuan menjual, membeli,
mengenalkan, melaporkan
kehilangan.
Mengomunikasikan
Siswa mendeskripsikan
orang benda dan binatang
untuk mengenalkan,
menjual atau melaporkan
kehilangan dengan bahasa
Inggris, di dalam dan di
luar kelas serta lingkungan
sekitar sesuai dengan
konteksnya
Siswa menulis jurnal untuk
mengungkapkan
pengalaman yang mereka
peroleh selama
pembelajaran, hal-hal yang
sulit dan mudah dipelajari
dan strategi yang sudah
atau akan dilakukan untuk
mengatasinya
komunikasi
Ketepatan dan
kesesuaian
menggunakan strategi
dalam membaca
Portofolio
Kumpulan catatan
kemajuan belajar yang
mendukung proses
pembelajaran
menyusun teks
deskriptif .
Kumpulan karya siswa
yang mencerminkan
hasil atau capaian
belajar menyusun teks
deskriptif tulis,
pendek dan sederhana,
berupa: draft, revisi,
editing sampai hasil
terbaik untuk
dipublikasi tentang
orang, binatang, dan
benda
Kumpulan hasil tes
dan latihan.
Penilaian Diri dan
Penilaian Sejawat
Jurnal belajar

3.12 Menerapkan
struktur teks
dan unsur
kebahasaan
untuk
melaksanakan
fungsi sosial
teks recount
dengan
menyatakan
dan
menanyakan
tentang
kegiatan,
kejadian, dan
peristiwa,
pendek dan
sederhana,
sesuai dengan
konteks
penggunaanny
a
4.14 Menangkap
makna teks
recount lisan
dan tulis,
pendek dan
sederhana,
tentang
kegiatan,
kejadian,
Teks lisan dan tulis
berbentuk recount
dengan menyatakan
dan menanyakan
tentang kejadian, dan
peristiwa, pendek dan
sederhana
Fungsi sosial
Menguraikan
pengalaman,
peristiwa, kejadian
untuk melaporkan,
meneladani,
membanggakan,
berbagi pengalaman,
dsb.
Struktur teks
a. Orientasi:
menyebutkan tujuan
dan
peristiwa/kejadian/
pengalaman secara
umum
b. Uraian
tindakan/kejadian
secara berurut dan
runtut
c. Penutup (seringkali
ada): komentar atau
Mengamati
Siswa mendengarkan/
menonton beberapa contoh
teks recount dengan
menyatakan dan
menanyakan tentang
kegiatan, kejadian, dan
peristiwa, berdasarkan
konteks yang sesuai
Siswa mengikuti
mengucapkan kalimat dalam
teks recount tentang
kegiatan, kejadian, dan
peristiwa,
Siswa membaca untuk
memahami makna dan
bentuk kalimat terdapat
dalam teks recount tentang
kegiatan, kejadian, dan
peristiwa,
Siswa berlatih menentukan
informasi rinci
Menanya
Dengan bimbingan dan
arahan guru, siswa
mempertanyakan perbedaan antar berbagai teks recount
KRITERIA PENILAIAN:
Tingkat ketercapaian
fungsi sosial teks
recount tentang
kegiatan, kejadian, dan
peristiwa
Tingkat kelengkapan
dan keruntutan struktur
teks dari teks recount tentang kegiatan,
kejadian, dan peristiwa
Tingkat ketepatan unsur
kebahasaan: tata
bahasa, kosa kata,
ucapan, tekanan kata,
intonasi
CARA PENILAIAN:
Tes Tulis
Menjawab berbagai
pertanyaan tentang
informasi yang terdapat
dalam teks yang di
didengar atau dibaca.
Menyusun kalimat acak
menjadi kalimat yang
padu
Melengkapi teks recount singkat dan
16 JP
Buku Teks
wajib
Keteladanan
ucapan dan
tindakan guru
menggunaka
n setiap
tindakan
komunikasi
interpersonal
dengan benar
dan akurat
Contoh
peragaan
dalam bentuk
rekaman
CD/VCD/
DVD/kaset
Contoh
interaksi
tertulis
Contoh teks
tertulis
Sumber dari
internet:
www.dai
lyenglish

peristiwa.
4.15 Menyusun
teks recount
lisan dan
tulis, pendek
dan
sederhana,
tentang
kegiatan,
kejadian,
peristiwa,
dengan
memperhatik
an fungsi
sosial,
struktur teks,
dan unsur
kebahasaan
yang benar
dan sesuai
konteks.
penilaian umum.
Unsur kebahasaan
(1) Uraian tindakan
dalam Past Tense:
Simple and
Continuous, woke,
took, went, got, did, had, was waiting,
were sleeping
(2) Adverbia
penghubung waktu:
first, then, after
that, before, at last, finally, dsb.
(3) Adverbia dan frasa
preposisional
penujuk waktu:
yesterday, last month, on Monday,
an hour ago,
immediately, dsb.
(4) Ejaan dan tulisan
tangan dan cetak
yang jelas dan rapi
(5) Ucapan, tekanan
kata, intonasi,
ketika
mempresentasikan
secara lisan.
Topik
tentang kegiatan, kejadian,
dan peristiwa, dalam
berbagai konteks
Mengeksplorasi
Siswa membaca contoh-
contoh teks recount tentang
kegiatan, kejadian, dan
peristiwa dari berbagai
sumber lain.
Siswa menceritakan
kegiatan, kejadian, dan
peristiwa yang terjadi
menggunakan Bahasa
Inggris
Siswa menuliskan pengalam
mereka yang menyenangkan.
Mengasosiasi
Dalam kerja kelompok
terbimbing siswa
menganalisis fungsi sosial,
struktur teks dan unsur
bahasa serta format
penulisan yang digunakan
dalam berbagai teks
recount tentang kegiatan,
kejadian, dan peristiwa, .
Siswa menanyakan balikan
(feedback) dari guru dan
sederhana berdasarkan
konteks
Menulis teks recount
sederhana berdasarkan
urutan gambar kejadian
Kinerja (praktik)
Melakukan monolog
tentang pengalaman
yang menyenangkan.
Ketepatan dan
kesesuaian
menggunakan struktur
teks dan unsur
kebahasaan dalam
monolog tentang
pengalaman yang
menyenangkan.
Observasi:
Penilaian untuk tujuan
memberi balikan. Sasaran
penilaian:
Upaya menggunakan
bahasa Inggris untuk
menyatakan,
menanyakan, dan
menceritakan
kejadian dan
peristiwa yang terjadi
.com
http://am
ericanen
glish.stat
e.gov/file
s/ae/reso
urce_file
s
http://lea
rnenglish
.britishco
uncil.org
/en/

Peristiwa, kejadian,
pengalaman yang
terjadi di sekolah,
rumah, dan
masyarakat sekitar
siswa, dengan
memberikan
keteladanan tentang
perilaku disiplin,
jujur, peduli, pola
hidup sehat, dan
ramah lingkungan.
Multimedia
Foto peristiwa, buku
harian, dekorasi,
yang membuat
tampilan teks lebih
menarik
teman tentang setiap yang
dia sampaikan dalam kerja
kelompok.
Siswa menyimpulkan hasil
analisinya terkait Fungsi
sosial, struktur teks dan
unsur kebahasaan dari teks
recount tentang kegiatan,
kejadian, dan peristiwa
yang terjadi.
, Mengomunikasikan
Siswa mempresentasikan
tulisan tentang pengalaman
yang menyenangkan
Siswa menulis jurnal untuk
mengungkapkan
pengalaman yang mereka
peroleh selama
pembelajaran, hal-hal yang
sulit dan mudah dipelajari
dan strategi yang sudah
atau akan dilakukan untuk
mengatasinya
di waktu lampau
Kesungguhan siswa
dalam proses
pembelajaran di
setiap tahapan.
Menunjukkan
perilaku tanggung
jawab, peduli,
kerjasama, dan cinta
damai, dalam
melaksanakan
komunikasi
Ketepatan dan
kesesuaian
menggunakan strategi
dalam membaca
Portofolio
Kumpulan catatan
kemajuan belajar yang
mendukung proses
pembelajaran
menyusun teks recount
Kumpulan karya
siswa yang
mencerminkan hasil
atau capaian belajar
menyusun teks
recount dengan
menyatakan dan

menanyakan tentang
kejadian, dan
peristiwa, pendek dan
sederhana
Kumpulan hasil tes
dan latihan.
Penilaian Diri dan
Penilaian Sejawat
Jurnal belajar

Appendix 15 :
Documentation
a. Experimental Class


b. Control Class


CURRICULUM VITAE
NAME : ANGGIA WAHYUNI
NIM : TE.140963
Date of Birth : Kampung Baru, March 21st, 1997
Gender : Female
Addres : Jl. Ampera No.12, RT.09 Kel. Kampung Baru,
Kec. Muara Tembesi, Kab. Batanghari
Motto : “Do your best at any moment that you have.”
Identity : College Student
Email : [email protected]
Contact Person : 0813-7340-0668
Educational Background
No Level of Education Adress Year
1. SDN 57/I Muara Tembesi Jl. Jambi-Tebo Km. 4 Kec. Muara
Tembesi, Kab. Batanghari
2003-2008
2. SMPN 06 Batanghari Jl. Sei. Abang Km. 5 Kec. Muara
Tembesi, Kab. Batanghari
2008-2011
3. SMAN 01 Batanghari Jl. Ahmad Yani No.1 Kec. Muara
Bulian, Kab. Batnghari
2011-2014
4. UIN STS JAMBI Sei. Duren, Kec.Jaluko, Kab. Muaro
Jambi
2014-2018
The Writer