Embed Size (px)
Citation preview

England & Wales
2 YEARS OF SEVERE INJURY IN CHILDREN
January 2013-December 2014

THE TRAUMA AUDIT AND RESEARCH NETWORK

1112 YEARS OF SEVERE INJURY IN CHILDREN
The TARNlet Committee Mr Ross FisherCo-chairman of TARNletConsultant in Paediatric SurgerySheffield Children’s NHS Foundation Trust
Dr Ian MaconochieCo-chairman of TARNletConsultant in Paediatric Emergency MedicineImperial College Healthcare NHS Trust
Professor Tim CoatsProfessor of Emergency MedicineUniversity of Leicester
Dr Naomi DavisConsultant in Paediatric Orthopaedic SurgeryRoyal Manchester Children’s Hospital
Dr Lorcan DuaneConsultant in Emergency MedicineRoyal Manchester Children’s Hospital
Antoinette EdwardsOperations Director, Deputy to the Executive DirectorThe Trauma Audit & Research Network
Dr Chris FitzsimmonsConsultant in Emergency MedicineSheffield Children’s NHS Foundation Trust
Nathan GriffithsPaediatric Nurse ConsultantSalford Royal NHS Foundation Trust
Professor Fiona LeckyProfessor of Emergency MedicineUniversity of Sheffield
Dr Ciara MartinConsultant in Emergency MedicineThe Adelaide and Meath Hospital, Incorporating The National Children’s Hospital, Tallaght, Dublin
Dr Samantha NegusRadiologistSt George’s University Hospitals NHS Foundation Trust
Mr Roberto RamirezConsultant in Paediatric NeurosurgeryRoyal Manchester Children’s Hospital
Maralyn WoodfordExecutive DirectorThe Trauma Audit & Research Network
Acknowledgements
We would like to thank the staff at each trauma receiving hospital and Mr Thomas Lawrence, Program Developer and Registry Manager at the Trauma Audit and Research Network.

THE TRAUMA AUDIT AND RESEARCH NETWORK2222
Contents
3 Introduction
4 Summary
6 Data completeness
7 Demographics
8 Injury mechanism
9 Patients injured in road traffic incident
10 Injury type
11 Time of arrival at hospital
12 Month of arrival at hospital
13 Mode of arrival at hospital
14 Type of first admitting hospital
15 Transfer between hospitals
16 ICU / HDU admissions
17 Definitive airway management & Length of stay in hospital
18 Mortality rates
19 Injuries associated with death
20 Interaction of AIS 3+ injuries & associated mortality
21 Grade of most senior clinician in the ED
22 Grade of most senior clinician involved in surgery
23 Time to first surgery from arrival
24 Glossary

33332 YEARS OF SEVERE INJURY IN CHILDREN
Introduction This is the second report produced by the TARNlet committee, providing data on children with severe injury from January 2013 to December 2014 in England & Wales, and comparing these data with that produced in the first report on data from 2012. The Trauma Audit and Research Network (TARN) registry contains information on over 5,402 children under the age of 16 injured from January 2013 to December 2014, as compared with data on 4,720 in 2012.
The TARNlet committee is comprised of clinicians, managers and academics who are involved in the management of children who have sustained injury and are keen that this resource should be used to improve the care of paediatric trauma cases; in this report data have been interpreted to suggest guidance towards prevention of injury, or that networks of care could be reviewed to see if further improvement for the delivery of services to children could be achieved.
Those that died at the incident scene and were not transported to hospital are not reported to TARN. Further information about the data methodology can be found at www.tarn.ac.uk.
Injury produces a significant health burden for children, being a leading cause of both death and disability, with the numbers of different severities being shown above. In 2012, there were 737 children with ISS > 15 within the TARN database, similar to the numbers per year in this report. Estimates of children attending with trauma to EDs vary between 30-60% of their total workloads, depending on the location of the ED, with rural EDs seeing more trauma than inner city ones.
The overall picture is that there are about 4 million attendances by children to EDs each year.
This report concentrates on the 1,511 ‘recorded’ children from January 2013 to December 2014 who sustained the most serious injuries - an injury severity score (ISS) greater than 15. The true figure may be higher than this but, as will be seen, the completeness of data transfer from hospitals reporting to TARN continues to improve.
All children attending ED following injury
All children in the TARN database
n = 5,402
ISS > 15n = 1,511
Figure 1 (January 2013-December 2014 data).
THE TRAUMA AUDIT AND RESEARCH NETWORK4444 THE TRAUMA AUDIT AND RESEARCH NETWORKTHE TRAUMA AUDIT AND RESEARCH NETWORKTHE TRAUMA AUDIT AND RESEARCH NETWORKTHE TRAUMA AUDIT AND RESEARCH NETWORKTHE TRAUMA AUDIT AND RESEARCH NETWORKTHE TRAUMA AUDIT AND RESEARCH NETWORKTHE TRAUMA AUDIT AND RESEARCH NETWORKTHE TRAUMA AUDIT AND RESEARCH NETWORKTHE TRAUMA AUDIT AND RESEARCH NETWORKTHE TRAUMA AUDIT AND RESEARCH NETWORKTHE TRAUMA AUDIT AND RESEARCH NETWORKTHE TRAUMA AUDIT AND RESEARCH NETWORKTHE TRAUMA AUDIT AND RESEARCH NETWORK
2 Years of Severe Injury in Children
Summary
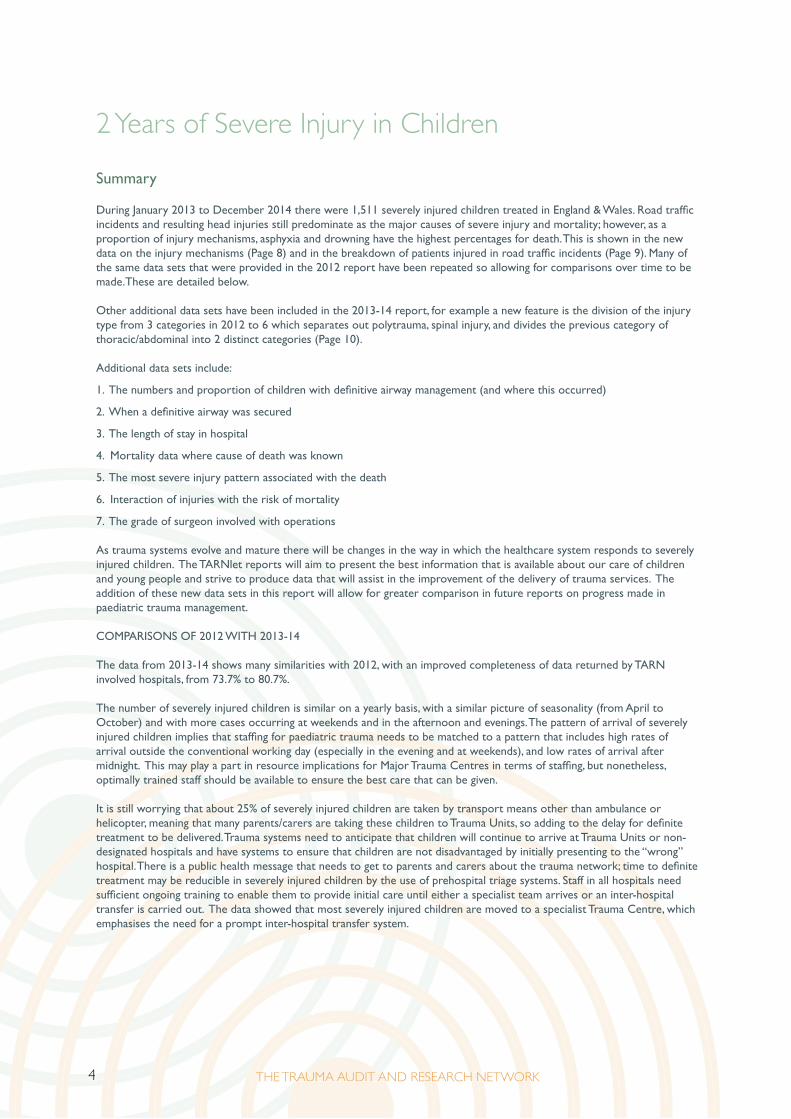
During January 2013 to December 2014 there were 1,511 severely injured children treated in England & Wales. Road traffic incidents and resulting head injuries still predominate as the major causes of severe injury and mortality; however, as a proportion of injury mechanisms, asphyxia and drowning have the highest percentages for death. This is shown in the new data on the injury mechanisms (Page 8) and in the breakdown of patients injured in road traffic incidents (Page 9). Many of the same data sets that were provided in the 2012 report have been repeated so allowing for comparisons over time to be made.These are detailed below.
Other additional data sets have been included in the 2013-14 report, for example a new feature is the division of the injury type from 3 categories in 2012 to 6 which separates out polytrauma, spinal injury, and divides the previous category of thoracic/abdominal into 2 distinct categories (Page 10).
Additional data sets include:
1. The numbers and proportion of children with definitive airway management (and where this occurred)
2. When a definitive airway was secured
3. The length of stay in hospital
4. Mortality data where cause of death was known
5. The most severe injury pattern associated with the death
6. Interaction of injuries with the risk of mortality
7. The grade of surgeon involved with operations
As trauma systems evolve and mature there will be changes in the way in which the healthcare system responds to severely injured children. The TARNlet reports will aim to present the best information that is available about our care of children and young people and strive to produce data that will assist in the improvement of the delivery of trauma services. The addition of these new data sets in this report will allow for greater comparison in future reports on progress made in paediatric trauma management.
COMPARISONS OF 2012 WITH 2013-14
The data from 2013-14 shows many similarities with 2012, with an improved completeness of data returned by TARN involved hospitals, from 73.7% to 80.7%.
The number of severely injured children is similar on a yearly basis, with a similar picture of seasonality (from April to October) and with more cases occurring at weekends and in the afternoon and evenings. The pattern of arrival of severely injured children implies that staffing for paediatric trauma needs to be matched to a pattern that includes high rates of arrival outside the conventional working day (especially in the evening and at weekends), and low rates of arrival after midnight. This may play a part in resource implications for Major Trauma Centres in terms of staffing, but nonetheless, optimally trained staff should be available to ensure the best care that can be given.
It is still worrying that about 25% of severely injured children are taken by transport means other than ambulance or helicopter, meaning that many parents/carers are taking these children to Trauma Units, so adding to the delay for definite treatment to be delivered. Trauma systems need to anticipate that children will continue to arrive at Trauma Units or non-designated hospitals and have systems to ensure that children are not disadvantaged by initially presenting to the “wrong” hospital. There is a public health message that needs to get to parents and carers about the trauma network; time to definite treatment may be reducible in severely injured children by the use of prehospital triage systems. Staff in all hospitals need sufficient ongoing training to enable them to provide initial care until either a specialist team arrives or an inter-hospital transfer is carried out. The data showed that most severely injured children are moved to a specialist Trauma Centre, which emphasises the need for a prompt inter-hospital transfer system.

55552 YEARS OF SEVERE INJURY IN CHILDREN
Severe traumatic brain injury is still the leading numeric cause associated with death, but new categories for the mechanism of trauma show that proportionately asphyxia and drowning have high relative risks for mortality. Again, a public health policy aimed at reducing these mechanisms could be conceived with any effects being monitored in future TARN publications.
Common themes in the first and this report on trauma are that more males are severely injured, non-accidental injury still makes up about 10% of the causes for severe injury (under the age of 2 years) – further work may be undertaken to drill down into this important and possibly reducible cause of morbidity1. The other peak for severe trauma lies between 6 to 13 years (Page 7), when looking at both reports.
Road traffic incidents are high on the list for causing severe injury too, accounting for about 40% consistently across the years. About half of the children are involved as pedestrians, and cyclists are recorded as being 20% of these road traffic incident figures.
Time to surgery is related to outcome therefore an efficient transport and transfer system that minimises delays is important for those children who have not been brought to a centre where the appropriate management can be conducted.
1 A profile of suspected child abuse as a subgroup of major trauma patientsFfion C Davies, Timothy J Coats, Ross Fisher, Thomas Lawrence, Fiona E LeckyEmerg Med J 2015;32:921-925 doi:10.1136/emermed-2015-205285

THE TRAUMA AUDIT AND RESEARCH NETWORK6
Trauma in children
Data Completeness
All Submissions Deaths
Trust n HESCompletion
%Deaths HES
Completion%
England & Wales 5,402 6,692 80.7 119 138 86.2
This is displayed as a percentage and represents the number of patients submitted to TARN compared to the number of patients expected based on the 2013 Hospital Episode Statistics (HES) dataset. The HES dataset is used as a general baseline.
These data refer to submissions to TARN, however the same patient may be submitted more than once if they undergo an inter-hospital transfer. Reducing the dataset to individual cases results in 4,802 children who met the TARN entry criteria admitted to hospitals in the area covered by this report.
1,511 children had severe injuries that were assigned an injury severity score (ISS) of more than 15 and 119 died of those injuries.

72 YEARS OF SEVERE INJURY IN CHILDREN
2 Years of Severe Injury in Children (ISS > 15)
Demographics of severely injured children 2013-14
Age (Years) Number of severely injured children (%)
Two thirds of injured children are male. There is a peak in the first year of life followed by another from 6 years old.
Total 1,511 (100%)
age < 1 307 (20.3%)
1 - 2 172 (11.4%)
3 - 5 202 (13.4%)
6 - 10 305 (20.2%)
11 - 13 269 (17.8%)
14 - 15 256 (16.9%)
Median Age (IQR) 6.5 (2.3 - 12.1)
Gender and Median ISS
Female (percentage) 31.4
Male (percentage) 68.6
Median ISS (Interquartile Range) 16 (16-25)
0
5
10
15
20
25
age <1 year age 1 - 2 years age 3 - 5 years age 6 - 10 years age 11 - 13 years age 14 - 15 years
Perc
enta
ge o
f pat
ient
s
2013 & 2014 2012

THE TRAUMA AUDIT AND RESEARCH NETWORK8
2 Years of Severe Injury in Children (ISS > 15)
Injury Mechanism
Mechanism Number of cases (%)
Analysis of injury mechanism data shows a preponderance of road traffic incidents and falls of less than 2 metres. 9.7% of patients were injured intentionally (Non-Accidental Injury) and were under 2 years of age.
Road Traffic Incident 628 (41.6%)
Fall < 2m 305 (20.2%)
Fall > 2m 175 (11.6%)
NAI under 2 years 147 (9.7%)
NAI over 2 years 31 (2.1%)
Blows 90 (6%)
Other (e.g. sport) 42 (2.8%)
Drowning 46 (3%)
Penetrating 12 (0.8%)
Asphyxia 35 (2.3%)
Total 1,511 (100%)
0
10
20
30
40
50
Road Traffic Fall < 2m Fall > 2m NAI Blows Drowning Asphyxia NAI Other Penetrating Incident under 2 years over 2 years (e.g. sport)
Perc
enta
ge o
f pat
ient
s
2013 & 2014 2012

92 YEARS OF SEVERE INJURY IN CHILDREN
2 Years of Severe Injury in Children (ISS > 15)
Breakdown of patients injured in road traffic incident
Road traffic incident Number of cases (%)
Pedestrian 312 (49.7%)
Cyclist 149 (23.7%)
Vehicle occupant 122 (19.4%)
Motorcyclist/Quad biker 38 (6.1%)
Not known 7 (1.1%)
Total 628 (100%)
0
10
20
30
40
50
Pedestrian Cyclist Vehicle Occupant Motorcyclist/ Not known Quad Biker
Perc
enta
ge o
f pat
ient
s
2013 & 2014 2012
THE TRAUMA AUDIT AND RESEARCH NETWORK10
2 Years of Severe Injury in Children (ISS > 15)
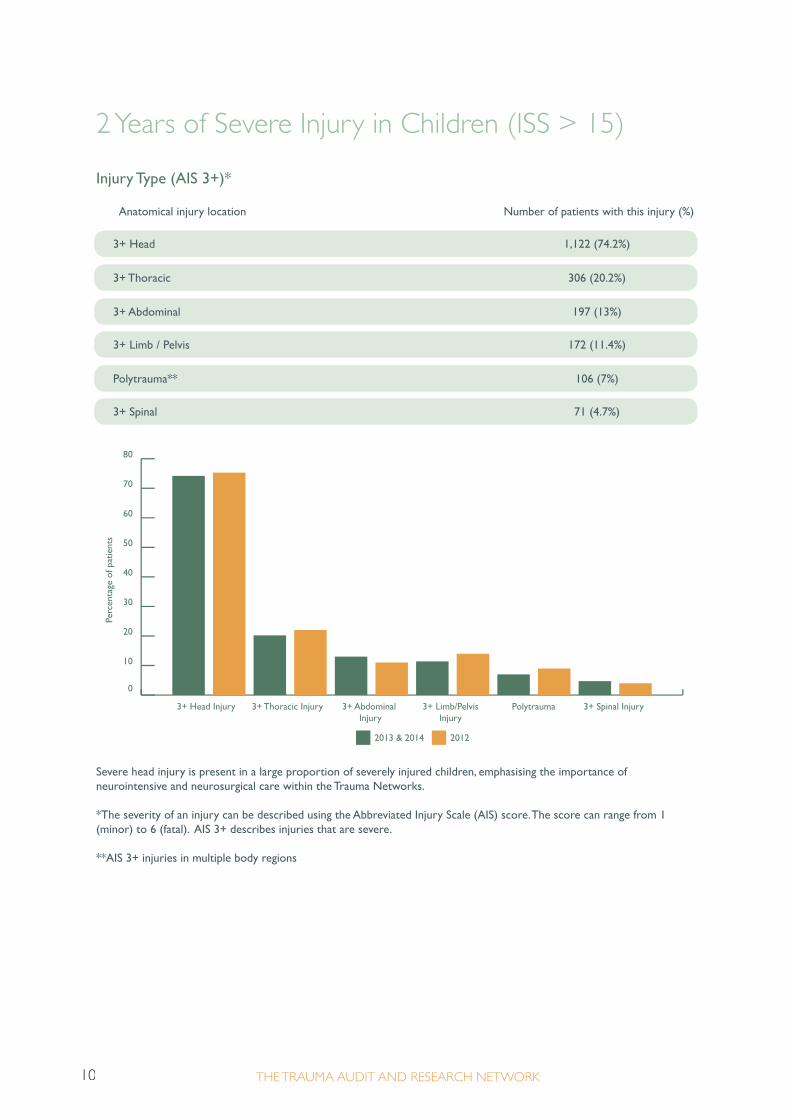
Injury Type (AIS 3+)*
Anatomical injury location Number of patients with this injury (%)
Severe head injury is present in a large proportion of severely injured children, emphasising the importance of neurointensive and neurosurgical care within the Trauma Networks.
*The severity of an injury can be described using the Abbreviated Injury Scale (AIS) score. The score can range from 1 (minor) to 6 (fatal). AIS 3+ describes injuries that are severe.
**AIS 3+ injuries in multiple body regions
3+ Head 1,122 (74.2%)
3+ Thoracic 306 (20.2%)
3+ Abdominal 197 (13%)
3+ Limb / Pelvis 172 (11.4%)
Polytrauma** 106 (7%)
3+ Spinal 71 (4.7%)
0
10
20
30
40
50
60
70
80
3+ Head Injury 3+ Thoracic Injury 3+ Abdominal 3+ Limb/Pelvis Polytrauma 3+ Spinal Injury Injury Injury
Perc
enta
ge o
f pat
ient
s
2013 & 2014 2012

112 YEARS OF SEVERE INJURY IN CHILDREN
2 Years of Severe Injury in Children (ISS > 15)
Arrival time at hospital 2013-2014
Hour Weekday Weekend Hour Weekday Weekend
0 2.3 1.8
1 2.0 2.0
2 2.4 2.3
3 1.1 2.3
4 1.4 2.7
5 1.0 1.7
6 1.3 1.0
7 1.2 2.5
8 2.5 2.0
9 4.3 2.3
10 4.3 5.0
11 2.8 4.5
13 4.4 6.3
14 5.2 9.3
15 4.5 8.5
16 9.7 12.5
17 10.2 12.0
18 9.5 11.0
19 9.8 8.8
20 5.7 8.5
21 5.4 6.8
22 4.2 3.8
23 4.0 5.5
Average number of severely injured children attending by hour and day of week during 2013-2014.
12 4.7 7.5
01
2
3
4
5
6
7
8
9
1011
1213
14
15
16
17
18
19
20
21
2223 8.0
7.0
6.0
5.0
4.0
3.0
2.0
2013/14 weekday 2013/14 weekend 2012 weekday 2012 weekend
1.0
0.0
Severely injured children attend hospital mainly during daytime hours, although a small percentage attends after midnight. Many injured children attend at the weekend and in the evenings. This pattern of attendance has an implication for the staffing of paediatric trauma services which need to be geared to receive severely injured children during the evening and at weekends. The relatively low number of severe injuries occurring at night raises a question about the cost effectiveness of on-site paediatric trauma expertise during the night.

THE TRAUMA AUDIT AND RESEARCH NETWORK12
2 Years of Severe Injury in Children (ISS > 15)
When children with severe injuries present by month
Month Number of severely injured children (%)
January 104 (6.9%)
February 80 (5.3%)
March 123 (8.1%)
April 137 (9.1%)
May 135 (8.9%)
June 170 (11.3%)
July 161 (10.7%)
August 167 (11.1%)
September 141 (9.3%)
October 104 (6.9%)
November 92 (6.1%)
December 97 (6.4%)
Total 1,511 (100%)
0
2
4
6
8
10
12
14
January February March April May June July August September October November December
Perc
enta
ge o
f pat
ient
s
2013 & 2014 2012

132 YEARS OF SEVERE INJURY IN CHILDREN
2 Years of Severe Injury in Children (ISS > 15)
Mode of arrival at hospital
Direct admissions only = 1,169
Mode of transport Number of severely injured children (%)
A large proportion of severely injured children are not brought to hospital by ambulance or helicopter. This has a continuing significant implication for the future configuration of paediatric trauma services, as the trauma system must anticipate that more than a quarter of patients will continue to arrive at the nearest hospital (which may or may not be part of the trauma system).
For some children there is no information recorded about their initial hospital stay, including their mode of arrival.
Ambulance 657 (56.2%)
Helicopter 200 (17.1%)
Arrived by other means (e.g. car) 312 (26.7%)
Total 1,169 (100%)
0
10
20
30
40
50
60
Arrived by ambulance Arrived by helicopter Arrived by other means (eg. car)
Perc
enta
ge o
f pat
ient
s
2013 & 2014 2012
THE TRAUMA AUDIT AND RESEARCH NETWORK14
2 Years of Severe Injury in Children (ISS > 15)
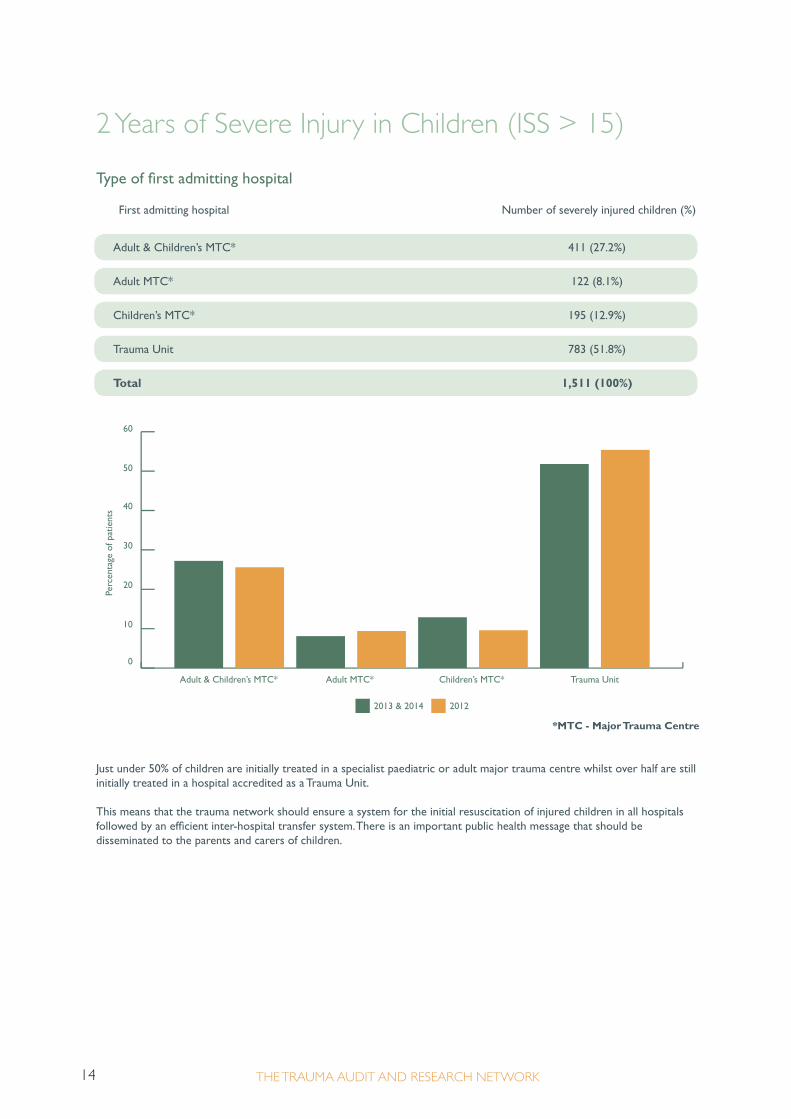
Type of first admitting hospital
First admitting hospital Number of severely injured children (%)
*MTC - Major Trauma Centre
Just under 50% of children are initially treated in a specialist paediatric or adult major trauma centre whilst over half are still initially treated in a hospital accredited as a Trauma Unit.
This means that the trauma network should ensure a system for the initial resuscitation of injured children in all hospitals followed by an efficient inter-hospital transfer system. There is an important public health message that should be disseminated to the parents and carers of children.
Adult & Children’s MTC* 411 (27.2%)
Adult MTC* 122 (8.1%)
Children’s MTC* 195 (12.9%)
Trauma Unit 783 (51.8%)
Total 1,511 (100%)
0
10
20
30
40
50
60
Adult & Children’s MTC* Adult MTC* Children’s MTC* Trauma Unit
Perc
enta
ge o
f pat
ient
s
2013 & 2014 2012

152 YEARS OF SEVERE INJURY IN CHILDREN
2 Years of Severe Injury in Children (ISS > 15)
Transfer between hospitals
Type of hospital where severely injured children were admitted Number of cases (%)
*MTC - Major Trauma Centre
Most children are eventually cared for in an appropriate hospital with few remaining outside of the Major Trauma Centres. This emphasises once more the importance of the transfer system and should promote an assessment by the network of the location of specialist paediatric services.
Multiple hospitals, not MTC* 62 (4.1%)
Multiple hospitals, adult MTC* 17 (1.1%)
Multiple hospitals, children’s MTC* 661 (43.8%)
Single hospital, not MTC* 151 (10%)
Single hospital, adult MTC* 48 (3.2%)
Single hospital, children’s MTC* 572 (37.8%)
Total 1,511 (100%)
0
10
20
30
40
50
60
Multiple hospitals, Multiple hospitals, Multiple hospitals, Single hospital, Single hospital, Single hospital, not MTC* adult MTC* children’s MTC* not MTC* adult MTC* children’s MTC*
Perc
enta
ge o
f pat
ient
s
2013 & 2014 2012
THE TRAUMA AUDIT AND RESEARCH NETWORK16
2 Years of Severe Injury in Children (ISS > 15)
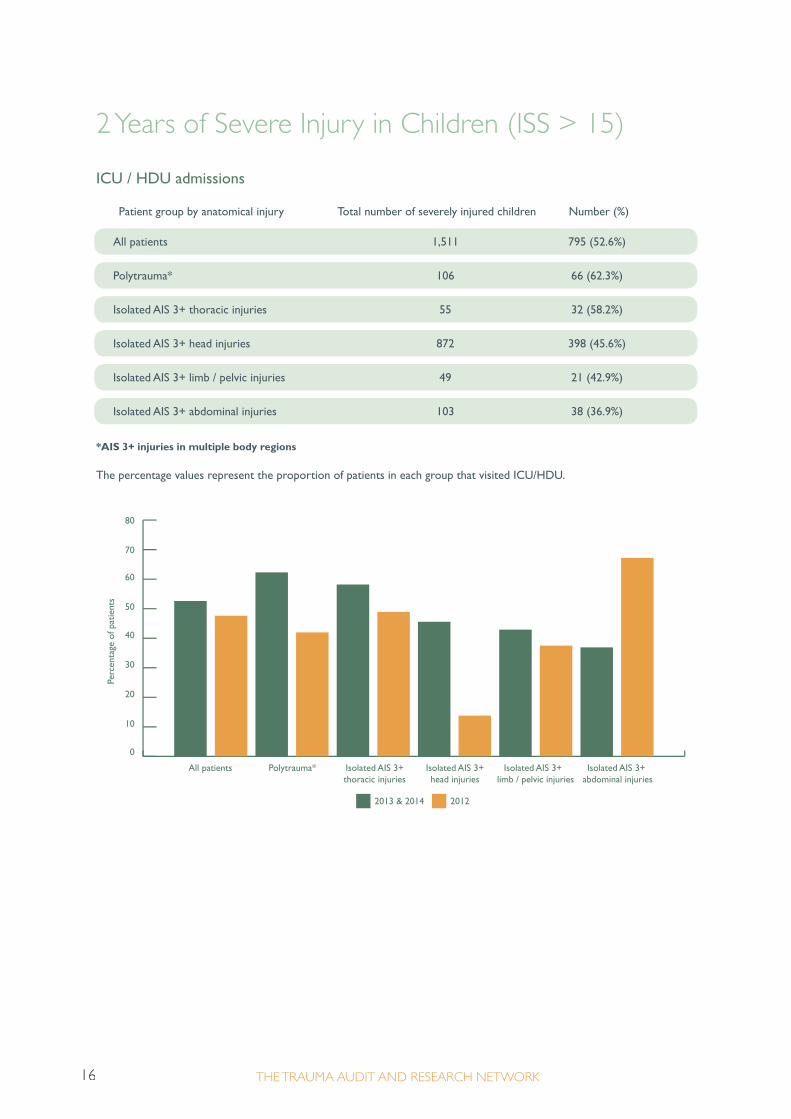
ICU / HDU admissions
Patient group by anatomical injury Total number of severely injured children Number (%)
*AIS 3+ injuries in multiple body regions
The percentage values represent the proportion of patients in each group that visited ICU/HDU.
All patients 1,511 795 (52.6%)
Polytrauma* 106 66 (62.3%)
Isolated AIS 3+ thoracic injuries 55 32 (58.2%)
Isolated AIS 3+ head injuries 872 398 (45.6%)
Isolated AIS 3+ limb / pelvic injuries 49 21 (42.9%)
Isolated AIS 3+ abdominal injuries 103 38 (36.9%)
0
10
20
30
40
50
60
70
80
All patients Polytrauma* Isolated AIS 3+ Isolated AIS 3+ Isolated AIS 3+ Isolated AIS 3+ thoracic injuries head injuries limb / pelvic injuries abdominal injuries
Perc
enta
ge o
f pat
ient
s
2013 & 2014 2012

172 YEARS OF SEVERE INJURY IN CHILDREN
2 Years of Severe Injury in Children (ISS > 15)
Definitive airway management 2013-2014
Direct admissions to hospital = 1,169 Number (%*)
*The percentage values shown here for patients with definitive airway management pre-hospital and in the ED use the total number of patients with definitive airway management as the denominator. Definitive airway management is defined as intubation, cricothyroidotomy or tracheostomy.
Length of stay in hospital n = 1,511 Length of stay Median days Interquartile range (days)
**Length of stay is calculated from the date of admission to hospital/ICU/HDU to the date of discharge from hospital/ICU/HDU.
There may be some underestimation as the complete length of stay for patients treated at more than one hospital may be unknown if one of those hospitals has not submitted data on the patient to TARN.
LOS** (IQR) 6 4.0 - 12.0
Number of children with definitive airway management 444 (38%)
LOS, patients transferred (IQR) 7 4.0 - 14.0
Pre-hospital 131 (8.7%)
LOS in ICU/HDU (IQR) 2 1.0 - 5.0
ED 313 (20.7%)
LOS, patients that went to ICU/HDU (IQR) 9 5.0 - 19.0
Median hours to definitive airway management from incident (Interquartile Range) 1.2 hours (0.8 - 1.6)

THE TRAUMA AUDIT AND RESEARCH NETWORK18
2 Years of Severe Injury in Children (ISS > 15)
Mortality Confirmed cases of death analysed in relation to injury type and mechanisms
Category Total number Number of Mortality* 95% confidence of cases of deaths due % interval severely injured to severe children injury Lower Upper
Injury Type
Injury Mechanism
*As a proportion of all severely injured children in that category
In absolute numbers, severe traumatic brain injury is the most common injury type to cause death, but as a proportion for the mechanism of mortality, asphyxia and drowning have the highest percentages. This information is important when considering public health measures. 130 children (8.6%) were transferred out where final outcome is unknown.
All admissions 1,381 119 8.6% 7.1 10.1
of which have a GCS < 15 597 107 18.0% 14.9 21
Asphyxia 32 25 78.1% 63.8 92.4
Blows 82 4 4.9% 0.2 9.5
Drowning 44 20 45.5% 30.7 60.2
Fall < 2m 282 1 0.4% 0.0 1.0
Fall > 2m 162 4 2.5% 0.1 4.9
AIS 3+ head injuries 1,018 65 6.4% 4.9 7.9
NAI over 2 years 29 8 27.6% 14.6 46.0
AIS 3+ limb / pelvis / spine injuries 215 22 10.2% 6.2 14.3
NAI under 2 years 128 10 7.8% 3.2 12.5
Other (e.g. sport) 34 5 14.7% 2.8 26.6
Penetrating 10 2 20.0% 4.9 52.2
Road Traffic Incident 578 40 6.9% 4.9 9.0
Total 1,381 119
AIS 3+ thoracic / abdominal injuries 395 39 9.9% 6.9 12.8
Polytrauma 98 6 6.1% 1.4 10.9
192 YEARS OF SEVERE INJURY IN CHILDREN
2 Years of Severe Injury in Children (ISS > 15)
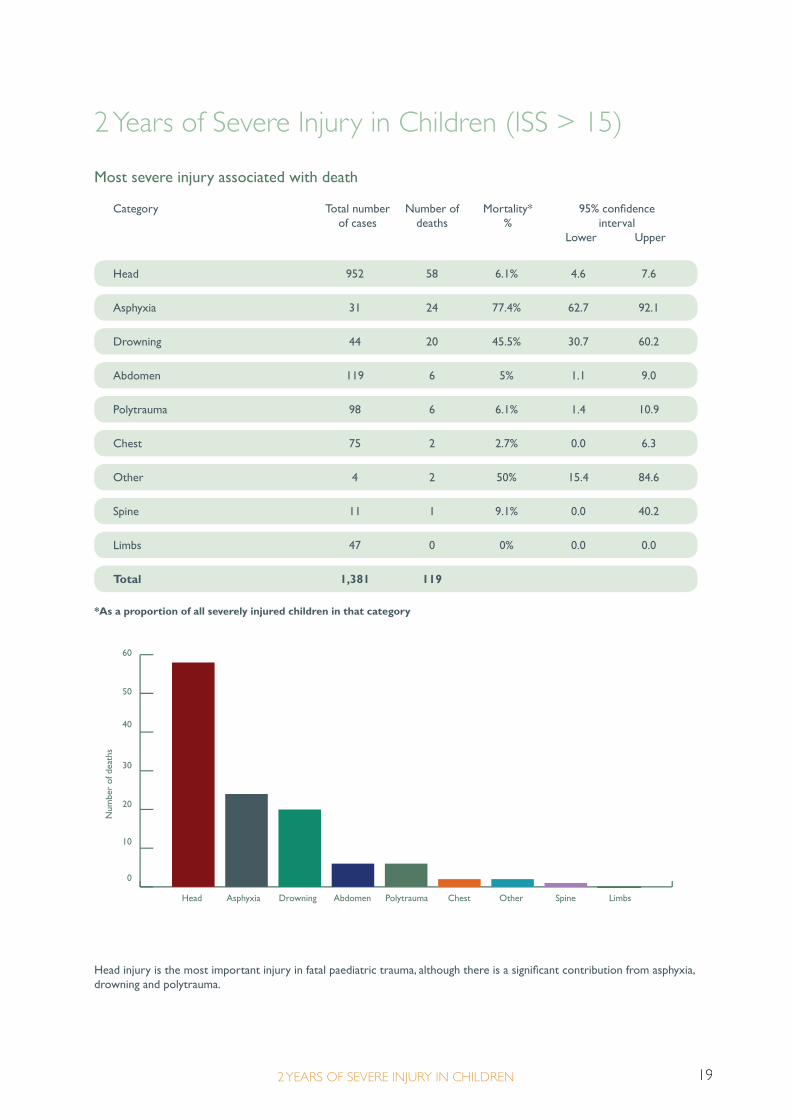
Most severe injury associated with death
Category Total number Number of Mortality* 95% confidence of cases deaths % interval Lower Upper
*As a proportion of all severely injured children in that category
Head injury is the most important injury in fatal paediatric trauma, although there is a significant contribution from asphyxia, drowning and polytrauma.
0
10
20
30
40
50
60
Head Asphyxia Drowning Abdomen Polytrauma Chest Other Spine Limbs
Num
ber
of d
eath
s
Head 952 58 6.1% 4.6 7.6
Asphyxia 31 24 77.4% 62.7 92.1
Drowning 44 20 45.5% 30.7 60.2
Abdomen 119 6 5% 1.1 9.0
Polytrauma 98 6 6.1% 1.4 10.9
Chest 75 2 2.7% 0.0 6.3
Other 4 2 50% 15.4 84.6
Spine 11 1 9.1% 0.0 40.2
Limbs 47 0 0% 0.0 0.0
Total 1,381 119

THE TRAUMA AUDIT AND RESEARCH NETWORK20
2 Years of Severe Injury in Children (ISS > 15)
Interaction of AIS 3+ injuries & associated mortality
Head Spine Chest Abdomen Limbs Pelvis
Head 11 (27.5%) 30 (19.9%) 10 (34.5%) 10 (12.2%) 2 (16.7%)
Spine 11 (27.5%) 6 (21.4%) 4 (50%) 2 (22.2%) 1 (25%)
Chest 30 (19.9%) 6 (21.4%) 12 (16.2%) 10 (17.9%) 2 (10.5%)
Abdomen 10 (34.5%) 4 (50%) 12 (16.2%) 1 (6.7%) 1 (11.1%)
Limbs 10 (12.2%) 2 (22.2%) 10 (17.9%) 1 (6.7%) 1 (6.3%)
Pelvis 2 (16.7%) 1 (25%) 2 (10.5%) 1 (11.1%) 1 (6.3%)
Values are in the format of; number of patients that died (mortality %) within each category i.e. 12 patients with AIS 3+ injuries to the chest and abdomen died representing a mortality rate of 16.2% for patients in this group. Please note patients may appear in multiple groups.

212 YEARS OF SEVERE INJURY IN CHILDREN
2 Years of Severe Injury in Children (ISS > 15)
Most senior clinician in the ED
Direct admissions to hospital = 1,169
Most senior in ED Number of cases (%) All Children’s MTC TU Adult MTC
All patients directly admitted visited the ED.
76.5% of severely injured children were resuscitated by consultants, 49% were seen by a paediatric specialist in the ED.
0
10
20
30
40
50
60
70
80
Consultant Associate Specialist ST FY/ST 1-2 Other/not recorded
Perc
enta
ge o
f pat
ient
s
2013 & 2014 2012
Consultant 894 (76.5%) 534 (90.1%) 269 (57.8%) 91 (82%)
Associate Specialist 34 (2.9%) 29 (6.2%) 5 (4.5%)
ST3 and above 103 (8.8%) 38 (6.4%) 58 (12.5%) 7 (6.3%)
FY / ST 1-2 76 (6.5%) 15 (2.5%) 58 (12.5%) 3 (2.7%)
Other / Not recorded 62 (5.3%) 6 (1%) 51 (11%) 5 (4.5%)
Total 1,169 (100%) 593 (100%) 465 (100%) 111 (100%)

THE TRAUMA AUDIT AND RESEARCH NETWORK22
2 Years of Severe Injury in Children (ISS > 15)
Grade of most senior clinician involved in patient’s first operation during the time in hospital
Direct admissions to hospital
All operations n = 305
Category Consultant Associate ST3 and FY / ST 1-2 Other / Not Specialist above recorded
*Paediatric surgeons are a subset of all surgeons with a paediatric speciality.
73.7% of all operations were carried out by consultants, 72.2% of those operations carried out by paediatric specialists were performed by consultants and 66.2% of severely injured children were anaesthetised for their operation by a consultant anaesthetist.
0
10
20
30
40
50
60
70
80
Consultant Associate Specialist ST3 and above FY / ST 1-2 Other / Not recorded
Perc
enta
ge o
f pat
ient
s
Grade of surgeon Grade of paediatric surgeon Grade of anaesthetist
Grade of surgeon 225 (73.7%) 2 (0.7%) 65 (21.3%) 9 (3.0%) 4 (1.3%)
Grade of paediatric surgeon* 39 (72.2%) 0 (0%) 12 (22.2%) 2 (3.7%) 1 (1.9%)
Grade of anaesthetist 202 (66.2%) 2 (0.7%) 56 (18.4%) 10 (3.3%) 35 (11.5%)

232 YEARS OF SEVERE INJURY IN CHILDREN
2 Years of Severe Injury in Children (ISS > 15)
Time to first surgery from arrival at hospital
Direct admissions to hospital
Category* Number of severely Median hours Interquartile injured children with to operation range (hours) operations recorded
*Patients can appear in multiple groupsOperations 24 hours after admission are excluded
The majority of surgical intervention takes place in a timely fashion although improvement may follow as trauma systems develop.
0
4
8
12
16
20
All surgery, ISS > 15 Neurosurgery Abdominal surgery Cardiothoracic surgery Orthopaedic surgery
Med
ian
Hou
rs T
o
2013 & 2014 2012
All surgery, ISS > 15 228 3.35 1.8 - 7.0
Abdominal surgery 22 2.5 1.7 - 4.1
Cardiothoracic surgery 11 2.1 1.4 - 2.8
Neurosurgery 123 2.7 1.5 - 4.8
Orthopaedic surgery 63 5.8 3.0 - 15.3

THE TRAUMA AUDIT AND RESEARCH NETWORK24
Glossary
AIS Abbreviated Injury Scale score. A value between 1 (minor) and 6 (fatal) is assigned to each injury.
AIS 3+ Injuries with an AIS severity score of 3 or more.
Child A patient under the age of 16 years
Definitive Airway Management
Intubation, cricothyroidotomy or tracheostomy.
Direct admissions Describes care in the first treating hospital.
GCS Glasgow Coma Scale. A measure of consciousness ranging from 3, indicating complete uncon-sciousness, to 15, indicating a state of normal alertness. GCS is composed of eye, verbal and motor scores.
HDU High Dependency Unit
HES Hospital Episode Statistics. Data collected in hospitals on all admissions. These data are used to produce an expected number of eligible patients that should be submitted to TARN.
ICU Intensive Care Unit
ISS Injury Severity Score. A score ranging from 1, (minor) to 75 (severe injuries that are likely to result in death). An ISS between 9 and 15 is considered moderate. An ISS of 16 or more is considered severe. ISS is calculated using the Abbreviated Injury Scale (AIS).
LOS Length of Stay. Calculated from the date of admission to hospital/ICU/HDU to the date of discharge from hospital/ICU/HDU.
MTC Major Trauma Centre
NAI Non-Accidental Injury
Polytrauma AIS 3+ injuries in more than one body region.
TARN The Trauma Audit & Research Network.
TARNlet The TARNlet committee, consisting of clinicians, managers and academics who focus on injured children, was established to address specific questions relating to paediatric trauma care.
TU Trauma Unit
Grades of Doctor
Consultant Consultant
Associate Specialist Associate Specialist
ST3 and above Specialist Registrar, Speciality Trainee, Clinical Fellow, Senior Registrar, Staff Grade
FY / ST 1-2 Foundation Year / Speciality Trainee 1-2 / Trust Grade
Other / Not recorded Not known / recorded, Nurse Consultant, Advanced Practitioner
2 YEARS OF SEVERE INJURY IN CHILDREN2 YEARS OF SEVERE INJURY IN CHILDREN2 YEARS OF SEVERE INJURY IN CHILDREN2 YEARS OF SEVERE INJURY IN CHILDREN2 YEARS OF SEVERE INJURY IN CHILDREN2 YEARS OF SEVERE INJURY IN CHILDREN2 YEARS OF SEVERE INJURY IN CHILDREN2 YEARS OF SEVERE INJURY IN CHILDREN2 YEARS OF SEVERE INJURY IN CHILDREN2 YEARS OF SEVERE INJURY IN CHILDREN2 YEARS OF SEVERE INJURY IN CHILDREN2 YEARS OF SEVERE INJURY IN CHILDREN2 YEARS OF SEVERE INJURY IN CHILDREN2 YEARS OF SEVERE INJURY IN CHILDREN2 YEARS OF SEVERE INJURY IN CHILDREN

The University of ManchesterManchester Academic Health Science Centre (MAHSC)
3rd Floor, The Mayo Building Salford Royal NHS Foundation TrustStott LaneSalford M6 8HD
Tel: 00 44 (0)161 206 4397Email: [email protected]: www.tarn.ac.ukTwitter: @TARNaudit
Crea
ted
by w
ww
.con
cept
4.co
m (r
ef J
1026
6-02
/201
6), a
n IS
O900
1 Qu
ality
and
ISO1
4001
Env
ironm
enta
l acc
redi
ted
com
pany
.