Embed Size (px)
Citation preview
Engineering Vacancies Report
2018 Trends
January 2019

Author: Mark Stewart
Engineers Australia
11 National Circuit, Barton ACT 2600
Tel: 02 6270 6569
Email: [email protected]
www.engineersaustralia.org.au
Engineers Australia
Engineering Vacancies Report 3
Contents
Engineering Vacancies Report ........................................................................................................................................1
Key points ....................................................................................................................................................................4
Introduction .................................................................................................................................................................5
Australia ......................................................................................................................................................................6
The major states ...........................................................................................................................................................9
Long term trends .....................................................................................................................................................9
Short term trends .................................................................................................................................................. 10
Tasmania and the territories ....................................................................................................................................... 12
Engineers Australia
Engineering Vacancies Report 4
Key points This report looks at 2018 trends and observations for engineering vacancies in Australia. The key points of this report are:
The steady growth in engineering vacancies observed in 2017 evaporated in 2018 as engineering vacancies in Australia fell 1.3% over the course of 2018. Most of this fall was in the first half of 2018, as there was slight growth of 0.1% recorded between July and December.
In 2018, overall Australian vacancies recorded growth of 0.7%, and growth in vacancies for professionals grew 6.2%. This indicates that in 2018 the labour market was tougher for engineers than it was for other similarly-qualified professionals.
Over the course of 2018 engineering vacancies fell noticeably in the majority of Australia’s states and territories, with falls in New South Wales (6.5%), Queensland (8.7%), South Australia (10.4%), the Northern Territory (22.2%), and the Australian Capital Territory (4.8%).
Over the course of 2018 engineering vacancies grew in the states of Western Australia (19.5%), Victoria (0.5%), and Tasmania (5.4%). Western Australia’s engineering labour market improved due to the large number of mining and civil engineering jobs available.
The falls in the larger states of New South Wales and Queensland are significant to Australia’s engineering labour market, due to the large numbers of engineering jobs in those states. The improvement seen in Western Australia and to a lesser extent, Victoria, has not been enough to offset the losses in the other states.
Engineers Australia
Engineering Vacancies Report 5
Introduction This policy report investigates the current state of engineering employment in Australia by analysing the direction of change in engineering vacancy numbers. The Australian Government Department of Jobs and Small Business has released its January 2019 Vacancies Report which covers trends in job vacancies to the end of December 2018, including revisions for previous months. The statistics presented are the Department’s revised and preferred trend series. All the vacancy numbers and graphs presented in this report are in trend terms.
Job vacancies can provide a valuable gauge of the state of the labour market as vacancies are a key indicator of unmet demand for labour in the economy1. When the demand for labour is strong, the levels of vacancies will also generally rise. Analysing movements in engineering vacancies can provide a broad indication of the direction of the engineering labour market. This report will present vacancy trends in Australia as well each state and territory as well as further analysis of engineering occupations trends. These are Australian and New Zealand Standard Classifications of Occupations (ANZSCO) four-digit unit group classifications.
This report will include trends in the following engineering occupations:
Engineering managers (unit group 1332). This includes engineering managers only.
Chemical and materials engineers (unit group 2331). This includes chemical engineers and materials engineers.
Civil engineering professionals (unit group 2332). This includes civil engineers, geotechnical engineers, quantity surveyors, structural engineers and transport engineers.
Electrical engineers (unit group 2333). This includes electrical engineers only.
Electronics engineers (unit group 2334). This includes electronics engineers only.
Industrial, mechanical and production engineers (unit group 2335). This includes industrial engineers, mechanical engineers and production or plant engineers.
Mining engineers (unit group 2336). This includes mining engineers and petroleum engineers.
Other engineering professionals (unit group 2339). This includes aeronautical engineers, agricultural engineers, biomedical engineers, engineering technologists, environmental engineers, naval architects and engineering professionals not elsewhere classified.
ICT support and test engineers (unit group 2632). This includes ICT quality assurance engineers, ICT support engineers and ICT systems test engineers. It must be noted that for this occupation it can be hard to gauge how many of these occupations are engineering specific, so some caution should be taken with numbers for this occupation.
Telecommunications engineers (unit group 2633). This includes telecommunications engineers and telecommunications network engineers.
1 Edwards. K, and Gustafsson. L, 2013. Reserve Bank of Australia, Bulletin, September Quarter, Indicators of Labour Demand. www.rba.gov.au

Engineers Australia
Engineering Vacancies Report 6
Australia Figure 1 shows the changes to the Australian labour force, the professional occupation labour force, and the engineering labour force over the last decade.
As demonstrated above, engineering vacancies have historically been considerably influenced by economic forces compared to the broader labour market, and the professional occupation labour market. In 2006 Australia’s engineering labour force grew significantly to meet the demand for engineers during the construction phase of the resources boom, peaking in 2008. The engineering labour force then weathered the GFC which soon followed, and a second period of strong job growth was seen in 2010 and 2011. At its peak in September 2008, there were 13,016 vacancies recorded for engineers.
This recovery was short-lived and the engineering labour market began to rapidly deteriorate from December 2012. Low numbers for engineering vacancies continued through to 2014, and at its lowest point in January 2015 there were only 2,274 vacancies recorded for engineers. A slow recovery began in mid-2016 and numbers began to climb throughout 2017. This recovery stalled throughout 2018 and engineering vacancies fell back slightly over the course of the year.
Engineering vacancies have been much more variable than general vacancies and professional vacancies over the past 12 years. Over the course of 2018 engineering vacancies fell 1.3%, compared to growth of 0.7% for total Australian vacancies over the same time frame, and growth of 6.2% for professional vacancies.
Engineers Australia
Engineering Vacancies Report 7
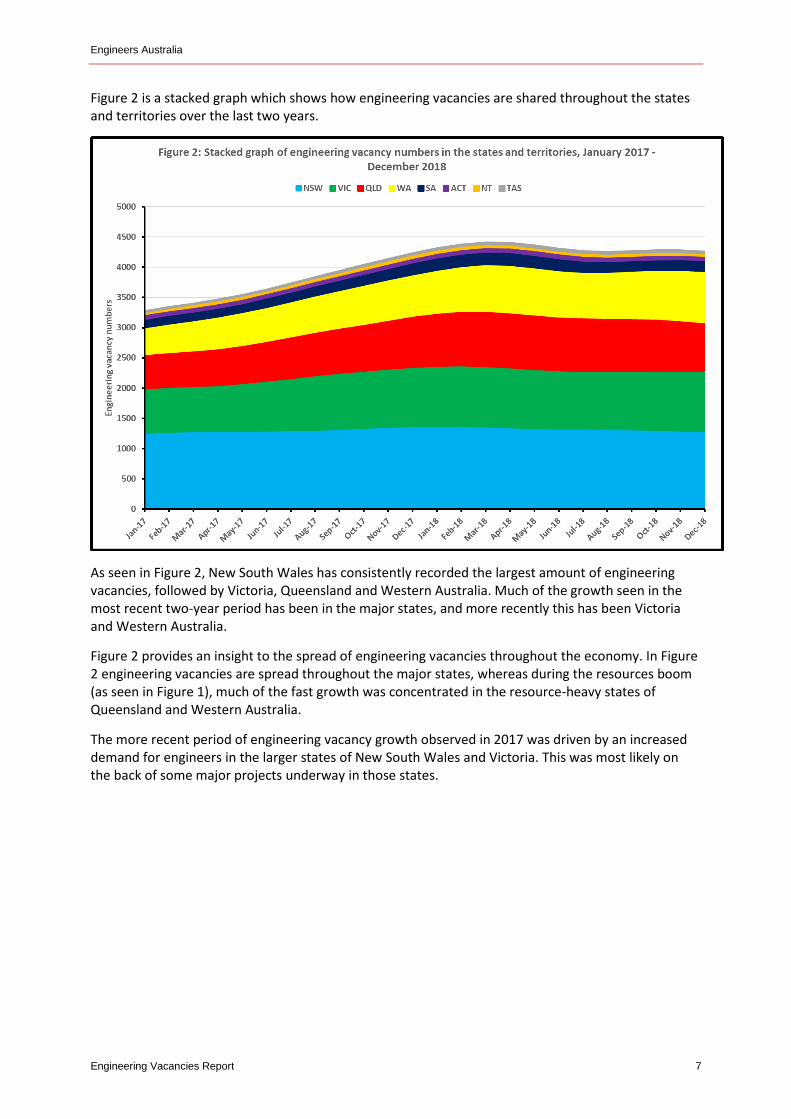
Figure 2 is a stacked graph which shows how engineering vacancies are shared throughout the states and territories over the last two years.
As seen in Figure 2, New South Wales has consistently recorded the largest amount of engineering vacancies, followed by Victoria, Queensland and Western Australia. Much of the growth seen in the most recent two-year period has been in the major states, and more recently this has been Victoria and Western Australia.
Figure 2 provides an insight to the spread of engineering vacancies throughout the economy. In Figure 2 engineering vacancies are spread throughout the major states, whereas during the resources boom (as seen in Figure 1), much of the fast growth was concentrated in the resource-heavy states of Queensland and Western Australia.
The more recent period of engineering vacancy growth observed in 2017 was driven by an increased demand for engineers in the larger states of New South Wales and Victoria. This was most likely on the back of some major projects underway in those states.
Engineers Australia
Engineering Vacancies Report 8
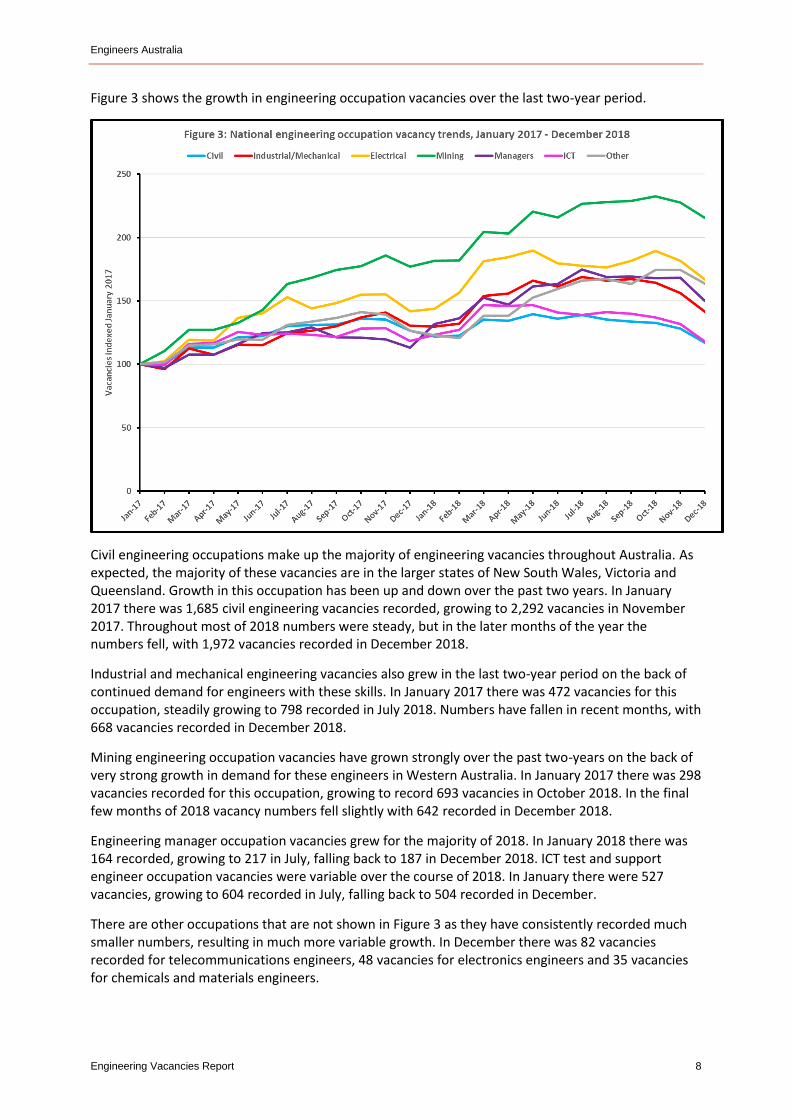
Figure 3 shows the growth in engineering occupation vacancies over the last two-year period.
Civil engineering occupations make up the majority of engineering vacancies throughout Australia. As expected, the majority of these vacancies are in the larger states of New South Wales, Victoria and Queensland. Growth in this occupation has been up and down over the past two years. In January 2017 there was 1,685 civil engineering vacancies recorded, growing to 2,292 vacancies in November 2017. Throughout most of 2018 numbers were steady, but in the later months of the year the numbers fell, with 1,972 vacancies recorded in December 2018.
Industrial and mechanical engineering vacancies also grew in the last two-year period on the back of continued demand for engineers with these skills. In January 2017 there was 472 vacancies for this occupation, steadily growing to 798 recorded in July 2018. Numbers have fallen in recent months, with 668 vacancies recorded in December 2018.
Mining engineering occupation vacancies have grown strongly over the past two-years on the back of very strong growth in demand for these engineers in Western Australia. In January 2017 there was 298 vacancies recorded for this occupation, growing to record 693 vacancies in October 2018. In the final few months of 2018 vacancy numbers fell slightly with 642 recorded in December 2018.
Engineering manager occupation vacancies grew for the majority of 2018. In January 2018 there was 164 recorded, growing to 217 in July, falling back to 187 in December 2018. ICT test and support engineer occupation vacancies were variable over the course of 2018. In January there were 527 vacancies, growing to 604 recorded in July, falling back to 504 recorded in December.
There are other occupations that are not shown in Figure 3 as they have consistently recorded much smaller numbers, resulting in much more variable growth. In December there was 82 vacancies recorded for telecommunications engineers, 48 vacancies for electronics engineers and 35 vacancies for chemicals and materials engineers.
Engineers Australia
Engineering Vacancies Report 9
The major states The vast majority of engineering vacancies are located in the most populated states of Australia. Over 90% of all engineering vacancies are located in New South Wales, Victoria, Queensland and Western Australia.
Long term trends
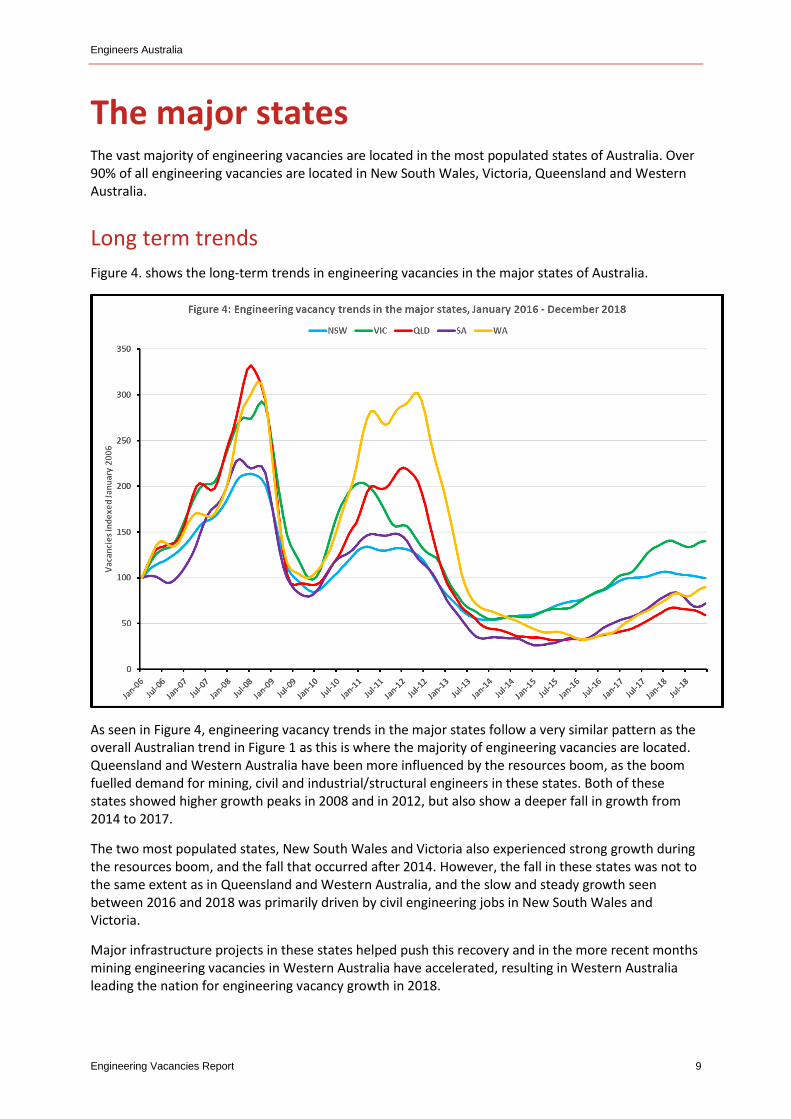
Figure 4. shows the long-term trends in engineering vacancies in the major states of Australia.
As seen in Figure 4, engineering vacancy trends in the major states follow a very similar pattern as the overall Australian trend in Figure 1 as this is where the majority of engineering vacancies are located. Queensland and Western Australia have been more influenced by the resources boom, as the boom fuelled demand for mining, civil and industrial/structural engineers in these states. Both of these states showed higher growth peaks in 2008 and in 2012, but also show a deeper fall in growth from 2014 to 2017.
The two most populated states, New South Wales and Victoria also experienced strong growth during the resources boom, and the fall that occurred after 2014. However, the fall in these states was not to the same extent as in Queensland and Western Australia, and the slow and steady growth seen between 2016 and 2018 was primarily driven by civil engineering jobs in New South Wales and Victoria.
Major infrastructure projects in these states helped push this recovery and in the more recent months mining engineering vacancies in Western Australia have accelerated, resulting in Western Australia leading the nation for engineering vacancy growth in 2018.
Engineers Australia
Engineering Vacancies Report 10
Short term trends
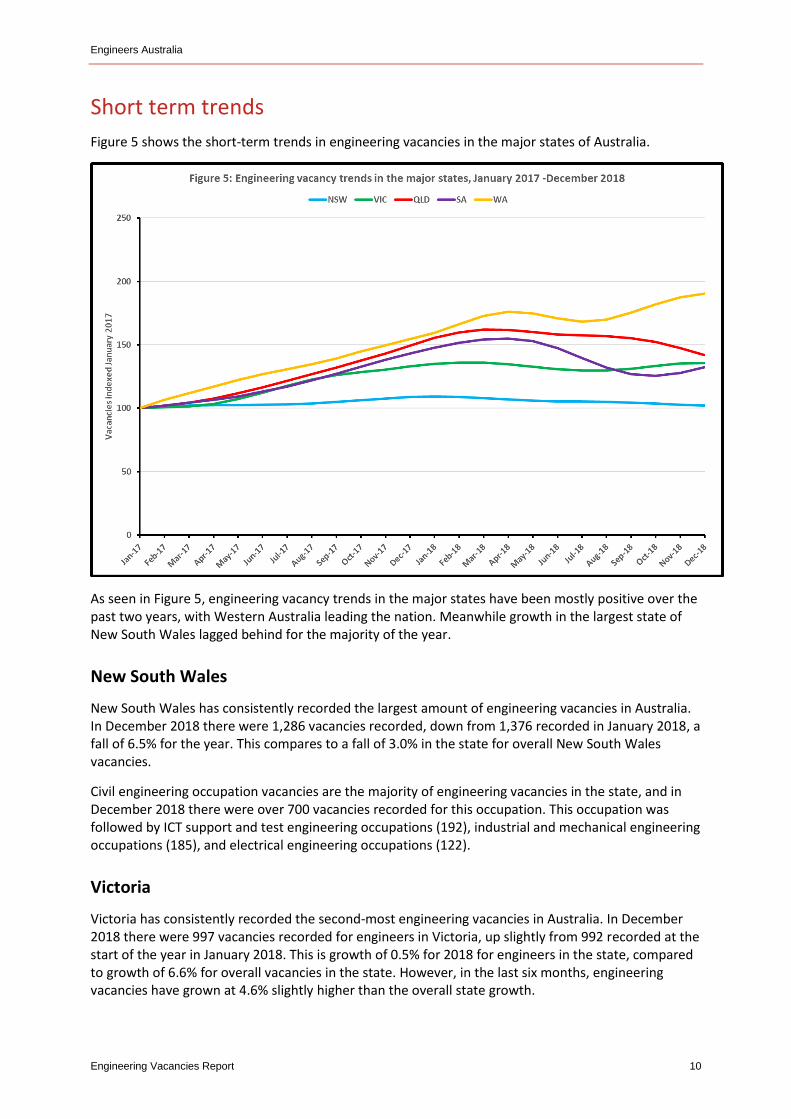
Figure 5 shows the short-term trends in engineering vacancies in the major states of Australia.
As seen in Figure 5, engineering vacancy trends in the major states have been mostly positive over the past two years, with Western Australia leading the nation. Meanwhile growth in the largest state of New South Wales lagged behind for the majority of the year.
New South Wales
New South Wales has consistently recorded the largest amount of engineering vacancies in Australia. In December 2018 there were 1,286 vacancies recorded, down from 1,376 recorded in January 2018, a fall of 6.5% for the year. This compares to a fall of 3.0% in the state for overall New South Wales vacancies.
Civil engineering occupation vacancies are the majority of engineering vacancies in the state, and in December 2018 there were over 700 vacancies recorded for this occupation. This occupation was followed by ICT support and test engineering occupations (192), industrial and mechanical engineering occupations (185), and electrical engineering occupations (122).
Victoria
Victoria has consistently recorded the second-most engineering vacancies in Australia. In December 2018 there were 997 vacancies recorded for engineers in Victoria, up slightly from 992 recorded at the start of the year in January 2018. This is growth of 0.5% for 2018 for engineers in the state, compared to growth of 6.6% for overall vacancies in the state. However, in the last six months, engineering vacancies have grown at 4.6% slightly higher than the overall state growth.
Engineers Australia
Engineering Vacancies Report 11
Civil engineering occupation vacancies are the majority of engineering vacancies in the state. In December 2018 there was 539 vacancies recorded for this occupation. This was followed by industrial and mechanical engineering occupations (176), ICT support and test engineering occupations (134), and electrical engineering occupations (90).
Queensland
Queensland engineering vacancies grew during 2017, but fell in 2018. In December 2018 there was 802 vacancies recorded for engineers in Queensland, down from 878 recorded in January 2018. This was a fall of 8.7% during the year, which was even more dramatic than the overall state vacancies which recorded a fall of 3.3% for the year.
Civil engineering occupation vacancies are the largest engineering vacancy in the state, and these numbers have fallen from 447 recorded in July 2018, to 348 recorded in December. The second largest engineering occupations was mining engineering (173), followed by industrial and mechanical engineering (123), and ICT support and test engineering (79).
South Australia
South Australian engineering vacancies grew in 2017, but fell in 2018. In December 2018 there was 179 vacancies recorded for engineers in South Australia, down from 200 recorded in January 2018, a fall of 10.4%. This compares to a fall of 1.5% for total South Australian vacancies.
Civil engineering occupation vacancies have consistently recorded the most vacancies of all the engineering occupations in the state, with 56 recorded in December 2018 (down from 93 recorded in May). Civil engineering was followed by industrial and mechanical engineering occupations (35), and mining engineering occupations (30).
Western Australia
Western Australia experienced the strongest growth in engineering vacancies in 2018. In December 2018 there was 849 engineering vacancies recoded in the state, up from 711 recorded in January 2018. This is growth of 19.5% for the year, performing much stronger than overall state vacancies which recorded growth of 3.1% over the same time.
Mining engineering occupations are strong in Western Australia, and there was over 300 vacancies for this occupation in the state in December 2018. There were also significant number of vacancies for civil engineering occupations (252), industrial and mechanical engineering occupations (128), and electrical engineering occupations (45).
Engineers Australia
Engineering Vacancies Report 12
Tasmania and the territories Tasmania, the Northern Territory and the Australian Capital Territory all record engineering vacancies at much lower levels than the major states, which can result in much more variable growth rates. However, the trends in these jurisdictions can provide an insight to local engineering labour market conditions.
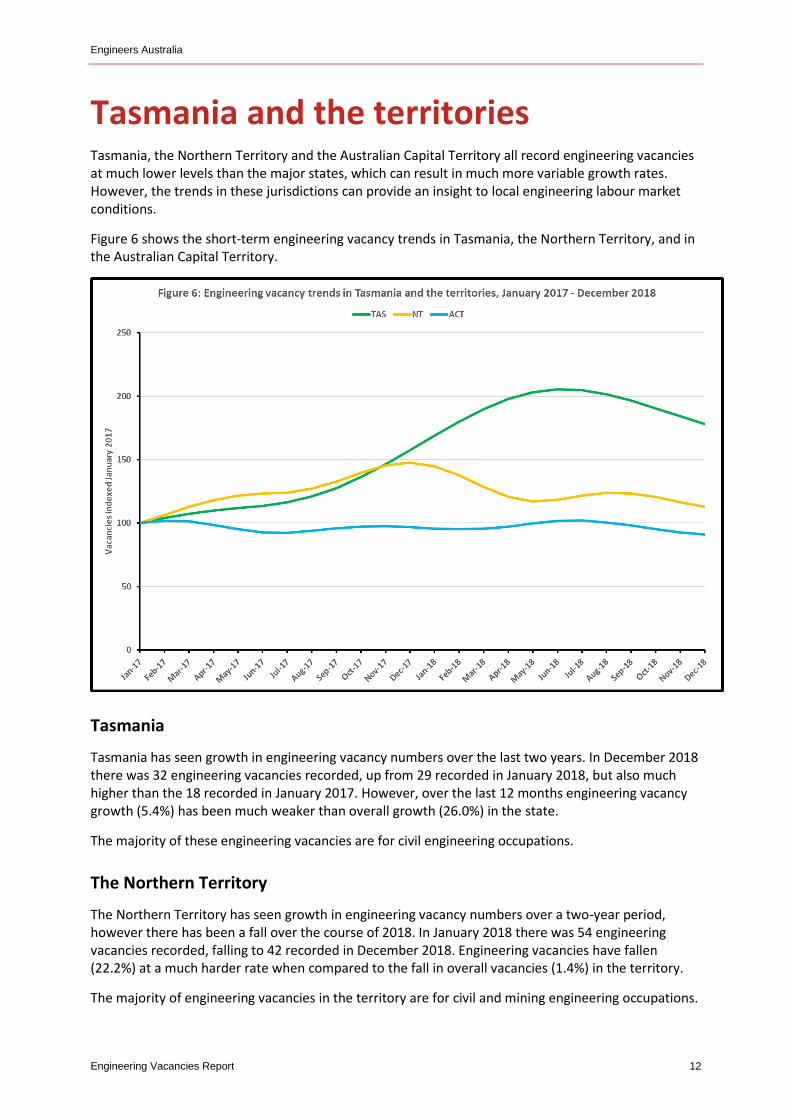
Figure 6 shows the short-term engineering vacancy trends in Tasmania, the Northern Territory, and in the Australian Capital Territory.
Tasmania
Tasmania has seen growth in engineering vacancy numbers over the last two years. In December 2018 there was 32 engineering vacancies recorded, up from 29 recorded in January 2018, but also much higher than the 18 recorded in January 2017. However, over the last 12 months engineering vacancy growth (5.4%) has been much weaker than overall growth (26.0%) in the state.
The majority of these engineering vacancies are for civil engineering occupations.
The Northern Territory
The Northern Territory has seen growth in engineering vacancy numbers over a two-year period, however there has been a fall over the course of 2018. In January 2018 there was 54 engineering vacancies recorded, falling to 42 recorded in December 2018. Engineering vacancies have fallen (22.2%) at a much harder rate when compared to the fall in overall vacancies (1.4%) in the territory.
The majority of engineering vacancies in the territory are for civil and mining engineering occupations.
Engineers Australia
Engineering Vacancies Report 13
The Australian Capital Territory
Engineering vacancies in the Australian Capital Territory fell over the course of 2018. In January 2018 there was 76 engineering vacancies recorded, falling to 72 vacancies recorded in December 2018. This was a fall of 4.8% for engineering vacancies, which compared to a fall of 1.9% for all vacancies in the territory over 2018.
The majority of engineering vacancies in the territory are for ICT support and test engineering, and civil engineering occupations.