Embed Size (px)
Citation preview

Corning IncorporatedOne Riverfront PlazaCorning, NY 14831-0001
U.S.A.
www.corning.com
02AR40013EN
© Corning Incorporated 2014. All Rights Reserved.
FPO
Engineering the Future
2013 Annual Report
261068_LRI_CVR_R3.indd 1 3/3/14 9:40 AM
Board Committees: (1) Audit; (2) Compensation; (3) Corporate Relations; (4) Finance; (5) Nominating & Corporate Governance; (6) Executive
© Corning Incorporated 2014. All Rights Reserved.
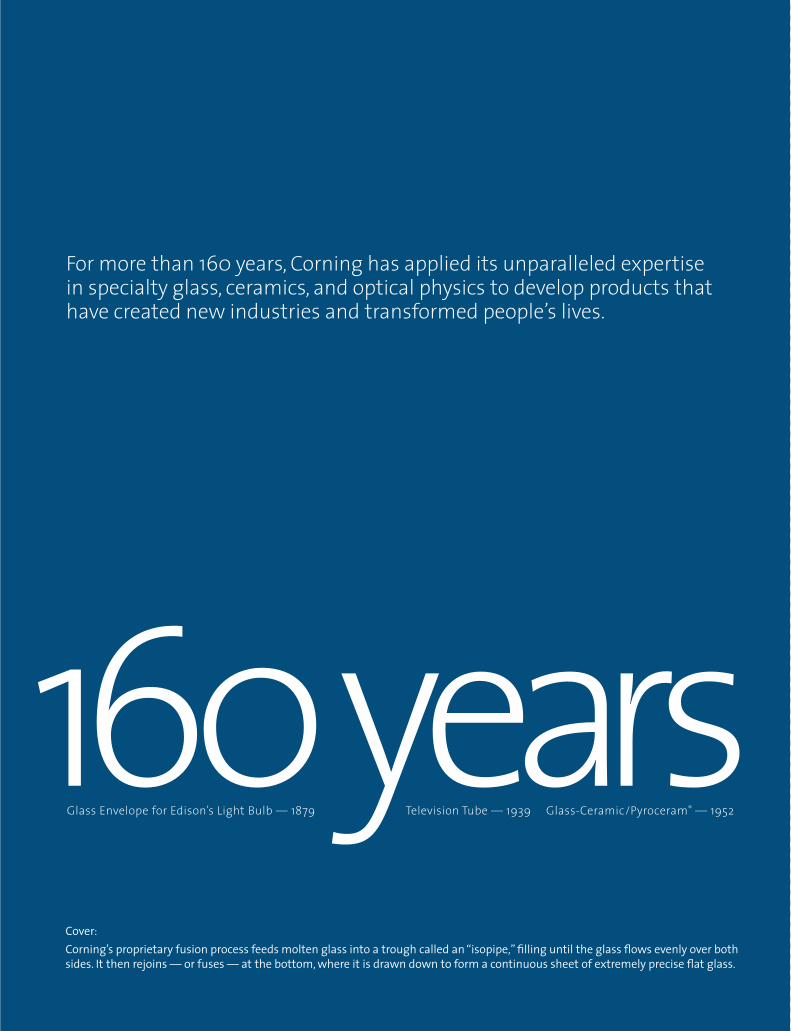
For more than 160 years, Corning has applied its unparalleled expertise in specialty glass, ceramics, and optical physics to develop products that have created new industries and transformed people’s lives.
Cover: Corning’s proprietary fusion process feeds molten glass into a trough called an “isopipe,” filling until the glass flows evenly over both sides. It then rejoins — or fuses — at the bottom, where it is drawn down to form a continuous sheet of extremely precise flat glass.
Glass Envelope for Edison’s Light Bulb — 1879 Television Tube — 1939 Glass-Ceramic/Pyroceram® — 1952 L
160 years261068_LRI_CVR_R3.indd 2 3/3/14 9:40 AM

Wendell P. WeeksChairman of the Board, Chief Executive Officer & President
ofTo our shareholders,In 2013, Corning had the kind of year that makes me exceptionally proud of our leadership team and our 31,000 dedicated employees worldwide. We delivered on our goal to improve profitability, we launched exciting new innovations, we enhanced Corning’s strategic and financial position through a series of agreements with Samsung, and we increased efficiencies across our businesses. We did all of this while remaining true to our corporate Values and honoring our commitment to reward shareholders.
I believe that we achieved these strong results despite a tough environ-ment because our people are motivated by the same objectives: the determination to preserve this great institution, a desire to pull our weight alongside colleagues who are working just as hard, and the drive to produce life-changing innovations.
Optical Fiber — 1970 Ceramic Substrates — 1972 LCD Glass — 1985 Corning® ClearCurve® Fiber— 2007 Corning® Gorilla® Glass — 2007
261068_LRI_NAR.indd 1 2/21/14 3:36 PM

Although we will always assess our success by our effectiveness at meeting each year’s priorities, it has also been extremely rewarding this year to see third parties recognize Corning’s strong performance. Forbes magazine touted Corning’s track record of innovation in a seven-page feature story; the U.S. Patent Board placed Corning at the top of its innovation scorecard in the industrial materials category for the seventh consecutive year; the stock market responded to the news of our Samsung transaction with one of the largest one-day increases since 2005 for a deal greater than $1 billion; and our stock significantly outper-formed the S&P 500.
We know that the stock market is volatile, praise can be fickle, and individual successes are often ephemeral. So perhaps the most significant vote of confidence is the $400 million direct investment in Corning by Samsung Display Company, Ltd., announced in October. This invest-ment by one of the world’s leading technology companies underscores their belief in Corning’s innovations, industry leadership, and opportunities for future revenue and profits.
Of course, Corning never rests on its laurels. We have set equally challenging priorities for 2014 and know that there is tough work ahead. But we are entering the year energized by our momentum, excited about Corning’s growth oppor-tunities, and confident in our ability to continue improving our performance.
So let’s look at some of Corning’s key achievements in 2013 before I turn to our expectations for this year.
Strong Financial and Operational Performance
Last year at this time, I declared that Corning had turned a corner in its drive to improve profitability and that we would begin “marching up” in 2013. I am pleased to report we made good on that promise. We delivered double-digit year-over-year earnings-per-share growth. We posted strong sales of nearly $8 billion. We protected our balance sheet, ending the year with more than $5 billion in cash and short-term investments. And we improved gross margin from 2012.
Here are some highlights from each of our major business segments.
In Display Technologies, LCD glass market growth led to improved volume in our wholly owned business. Price declines remained moderate throughout the year, and we renewed agreements with key customers. We also signed a new 10-year supply agreement with Samsung for LCD glass through 2023, which reduces our market risks by ensuring reliable demand for our product.
The Optical Communications (formerly known as Telecom-munications) segment had its third consecutive year of sales growth. Profits also increased dramatically in 2013 as a result of higher volume and greater manufacturing efficiencies. But fiber demand was lower than expected due to delays in Australia’s fiber-to-the-home build-out and softer sales in China, so we took actions late in the year to adjust our capacity for 2014.
Process Finesse
Throughout its rich history, Corning’s processes have been as innovative as its products. Today, Corning continues to increase the speed and efficiency of its manufacturing while also developing breakthrough techniques to bring new products and capabilities to life.
Here’s a look at some Corning processes that have transformed industries, and how the company continues to engineer the future.
261068_LRI_NAR.indd 2 2/21/14 3:36 PM

In Specialty Materials, Corning® Gorilla® Glass penetration exceeded two billion devices worldwide. Sales were down year-over-year as the industry worked through existing inventory. However, overall cover-glass demand was up nearly 30 percent for the year based on end-product retail sales, which indicates that robust growth will resume as inventory levels return to normal.
Environmental Technologies sales were down from 2012 due to softness in the European market and a later-than-expected recovery in the heavy-duty trucking industry, but profits were up due to increased manufacturing efficiencies. We began to see improved demand for heavy-duty products toward the end of the year as new emissions regulations went into effect in Europe and China, and we expect this trend to continue in 2014.
In Life Sciences, the integration of Discovery Labware has had an extremely positive impact on our performance. Synergies from the acquisition resulted in double-digit year-over-year sales growth and a significant increase in net income.
All of these businesses are tied to major growth trends, and their diversity helps reduce Corning’s vulnerability to geographic and economic fluctuations. Of course, more than 160 years of experience has taught us that markets are always evolving, so we continue to pursue new growth drivers as well.
New Revenue and Profit Drivers
The primary way Corning grows has always been through innovation. In 2013, we advanced several key initiatives.
n We expanded on the success of Gorilla Glass with new compositions, attributes, and applications. We launched Gorilla Glass 3, which offers superior scratch resistance to its predecessor; we began supplying customers with anti-reflective technology to increase the readability of mobile devices; we introduced Gorilla Glass NBT™ to bring exceptional scratch and impact resistance to touch-enabled notebook computers; and we extended Gorilla Glass into automotive applications, including an interior window for a high-performance sports car by a premium auto maker.
n We advanced our leadership in optical technology. We expanded our wireless distributed antenna systems (DAS) into more than 50 major sports venues and arenas across North America; we launched the Corning ONE™ Wireless Platform, the first solution that unifies cellular, Wi-Fi, and Ethernet backbones on an all-optical, converged infrastructure; and we introduced Optical Cables by Corning, which provide significantly longer and more robust connections between consumer devices than their copper counterparts.
n Corning’s antimicrobial glass became the first product of its kind to be registered with the Environmental Protection Agency. This glass, which significantly reduces microbes on surfaces, has potential applications ranging from hospital equipment to consumer electronics devices.
Meeting the 1970 Clean Air Act’s mandate seemed like an impossible task — until Corning scientists developed a cellular ceramic solution to convert smog-causing emissions into harm-less compounds. Corning’s extrusion process turns a ceramic paste into a robust honeycomb-like structure with thousands of parallel channels, which, when catalyzed, provides an effective surface area similar to a football field! This innovation has helped reduce auto emissions by 99% since 1970 and is enabling countries worldwide to provide cleaner, healthier air for millions of people.
Extrusion
261068_LRI_NAR.indd 3 2/21/14 3:36 PM

We are also growing the company through strategic merg-ers and acquisitions. In May, we completed the acquisition of Bargoa, a leading telecommunications provider in Brazil. And in the fourth quarter, we announced our plans to acquire full ownership of Samsung Corning Precision Materials (SCP). This transaction, which was completed in January 2014, gives us full access to Corning’s global fusion manufacturing assets, which improves our ability to serve our customers worldwide. We will be able to supply any customer in any geography with any fusion-glass product (LCD glass, Gorilla Glass, and Willow® Glass). The acquisi-tion also delivers significant financial benefits, including immediate increases to Corning’s revenue, net income, and cash balances, plus a new source of long-term cash flow. Most importantly, we structured this transaction in a way that protects Corning’s financial health and preserves our independence.
Let’s now take a closer look at how Corning is delivering value to investors.
Value for Shareholders
Corning’s strong 2013 results were reflected in our stock performance. Corning’s stock price was up 41 percent for the year, higher than the Dow, NASDAQ, and S&P averages.
As Corning’s performance improves, we are honoring our commitment to return cash to shareholders. In April 2013, we increased the quarterly dividend from nine cents to 10 cents per share, which was our third dividend increase in 18 months. Simultaneously, we announced a $2 bil-lion share repurchase program. Then in October, we took advantage of the cash flow generated by the SCP acquisition to announce another incremental $2 billion share buyback, effective upon the successful closing of the transaction in January 2014. These actions follow the $1.5 billion share repurchase that Corning completed in December 2012. Together, they underscore our Board of Directors’ confidence in Corning’s financial health and in our ability to continue generating strong operating cash flow.
Looking Ahead
Corning will continue its march up in 2014. Now that we have effectively stabilized the company, our current focus is on growth. Although there is tough work ahead, we are confident that our strategy is working and we are succeed-ing at building a bigger, stronger, and more agile company.
As General George S. Patton famously declared, “Success is how high you bounce when you hit bottom.” In Corning’s case, our goal is not to simply march up from a recent upset, but to scale new heights in terms of performance, innovation, and impact.
Corning transforms a glass blank into a hair-like strand of optical fiber through one of the most tightly controlled manu-facturing processes in the world. Corning’s fiber production is so precise, it’s comparable to painting a 10-centimeter stripe around the earth and controlling its width to 1 millimeter! This process has led to the deployment of more than 2 billion kilo-meters of fiber worldwide and is enabling Corning to develop innovative optical solutions for wireless networks, data centers, and personal devices — supported by a robust fiber backbone.
Fiber Draw
261068_LRI_NAR.indd 4 2/21/14 3:36 PM

Our first priority this year will be the successful integration of the former SCP, now named Corning Precision Materials. As a result of this acquisition, we expect Corning’s annual sales to approach $10 billion. Combined with the share repurchases, we also expect the transaction to add 20 percent to earnings per share. Greater flexibility in asset use and improved operational efficiencies will help ensure Corning’s continued leadership in display technology as the LCD industry matures. And access to our global fusion assets uniquely positions Corning to capture new market opportunities for specialty glass by reducing the capital investments required.
Advancing our new-business portfolio is another key focus area. Although the timing and ultimate revenues from innovation are always difficult to predict, we have a rich and diverse set of opportunities and believe that several of our new products have the potential for explosive growth.
We are also extremely excited about our customer collabo-rations. We continue to innovate with industry leaders in all of our major businesses. And every week, dozens of customers and potential customers visit our laboratoriesin Corning, N.Y., and our applications technology center in Taiwan to explore how we can help solve their toughest technology problems.
In fact, as Corning continues to extend the capabilities of glass, more and more people are discovering one of the world’s oldest and most versatile materials. You could say that the world is coming our way.
Closing Thoughts
I’ll close by finishing a thought from the beginning of my letter. At Corning, we are driven by the desire to produce life-changing innovations. We sincerely want to change the world through our unique capabilities, and everyone in the company plays a role. That includes the scientists who invent new technologies, the engineers who determine how to manufacture them consistently and economically, the commercial teams that take our inventions to customers, the staffs who build and maintain the infrastructure that supports our efforts, the legal professionals who protect our assets, and more.
This passion for life-changing innovation is palpable when you walk the halls at Corning. It gives us the focus and intensity to persevere through challenging times. It’s the reason I’m so excited to come to work every day. It’s why I am so confident in Corning’s future. And it’s why we believe your investment in Corning is well placed.
Sincerely,
Wendell P. WeeksChairman of the Board, Chief Executive Officer & President
Corning’s proprietary fusion process produces glass that is exceptionally thin and flat, with outstanding surface quality, temperature tolerance, and dimensional stability. If Corning’s glass were as thick as the Pacific Ocean at its deepest point, the company would never deliver a sheet with waves taller than 2 inches! This remarkable process helped enable the LCD industry, made Gorilla® Glass possible, led to the development of flexible Willow® Glass, and continues to unleash new capa-bilities for industries as diverse as automotive and architecture.
Fusion
261068_LRI_NAR.indd 5 2/21/14 3:36 PM

Financial Highlights:In millions, except per share amounts
2013 2012 2011 2010 2009
NetSales $ 7,819 $8,012 $7,890 $6,632 $5,395
NetincomeattributabletoCorningIncorporated 1,961 1,636 2,817 3,574 1,984
DilutedearningspercommonshareattributabletoCorningIncorporated $ 1.34 $1.09 $1.78 $2.26 $1.27
261068_LRI_NAR.indd 6 2/21/14 3:36 PM

Corning Incorporated 2013 Annual Report
Index
Business Description ......................................................................................................................................................... 1
Risk Factors.........................................................................................................................................................................7Legal Proceedings............................................................................................................................................................12
Market for Registrant’s Common Equity, Related Stockholder Matters and Issuer Purchases of Equity Securities ................................................................................................................... 15
Selected Financial Data (Unaudited) ........................................................................................................................... 17
Management’s Discussion and Analysis of Financial Condition and Results of Operations ..............................18
Quantitative and Qualitative Disclosures About Market Risks .............................................................................. 45
Management’s Annual Report on Internal Control Over Financial Reporting .....................................................46
Report of Independent Registered Public Accounting Firm .................................................................................... 47
Consolidated Statements of Income ..........................................................................................................................48
Consolidated Statements of Comprehensive Income ..............................................................................................49
Consolidated Balance Sheets ....................................................................................................................................... 50
Consolidated Statements of Cash Flows ..................................................................................................................... 51
Consolidated Statements of Changes in Shareholders’ Equity ...............................................................................52
Notes to Consolidated Financial Statements1. Summary of Significant Accounting Policies ................................................................................................................................................ 53
2. Restructuring, Impairment and Other Charges ........................................................................................................................................... 61
3. Available-for-Sale Investments .......................................................................................................................................................................62
4. Significant Customers ......................................................................................................................................................................................63
5. Inventories..........................................................................................................................................................................................................63
6. Income Taxes .....................................................................................................................................................................................................64
7. Investments ...................................................................................................................................................................................................... 66
8. Acquisition...........................................................................................................................................................................................................71
9. Property, Net of Accumulated Depreciation ................................................................................................................................................. 72
10. Goodwill and Other Intangible Assets ........................................................................................................................................................... 72
11. Other Liabilities ................................................................................................................................................................................................. 73
12. Debt ..................................................................................................................................................................................................................... 74
13. Employee Retirement Plans ............................................................................................................................................................................. 75
14. Commitments, Contingencies, and Guarantees ......................................................................................................................................... 80
15. Hedging Activities ............................................................................................................................................................................................. 81
16. Fair Value Measurements ................................................................................................................................................................................83
17. Shareholders’ Equity .........................................................................................................................................................................................84
18. Earnings Per Common Share ...........................................................................................................................................................................86
19. Share-based Compensation ............................................................................................................................................................................ 87
20. Reportable Segments .......................................................................................................................................................................................88
21. Subsequent Events ............................................................................................................................................................................................92
Valuation Accounts and Reserves ............................................................................................................................... 93
Quarterly Operating Results ........................................................................................................................................94

This page intentionally left blank.

CORNING INCORPORATED - 2013 Annual Report 1
Corning Incorporated and its consolidated subsidiaries are hereinafter sometimes referred to as the “Company,” the “Registrant,” “Corning,” or “we.”
This report contains forward-looking statements that involve a number of risks and uncertainties. These statements relate to our future plans, objectives, expectations and estimates and may contain words such as “believes,” “expects,” “anticipates,” “estimates,” “forecasts,” or similar expressions. Our actual results could differ materially from what is expressed or forecasted in our forward-looking statements. Some of the factors that could contribute to these differences include those discussed under “Forward-Looking Statements,” “Risk Factors,” “Management’s Discussion and Analysis of Financial Condition and Results of Operations,” and elsewhere in this report.
Business Description
General
Corning traces its origins to a glass business established in 1851. The present corporation was incorporated in the State of New York in December 1936. The Company’s name was changed from Corning Glass Works to Corning Incorporated on April 28, 1989.
Corning Incorporated is a world leader in the manufacture of specialty glass and ceramics. Drawing on more than 160 years of materials science and process engineering knowledge, Corning creates and makes keystone components that enable high-technology systems for consumer electronics, mobile emissions control, telecommunications and life sciences. Corning operates in five reportable segments: Display Technologies, Optical Communications, Environmental Technologies, Specialty Materials and Life Sciences. Corning manufactures and processes products at approximately 70 plants in 15 countries.
Display Technologies SegmentCorning’s Display Technologies segment manufactures glass substrates for active matrix liquid crystal displays (LCDs) that are used primarily in notebook computers, flat panel desktop monitors, and LCD televisions. This segment develops, manufactures and supplies high quality glass substrates using technology expertise and a proprietary fusion manufacturing process, which Corning invented and is the cornerstone of the Company’s technology leadership in the LCD industry. The automated process yields high quality glass substrates with excellent dimensional stability and uniformity – essential attributes for the production of large, high performance active matrix LCDs. Corning’s fusion process is scalable and is thought to be the most effective process in producing large size substrates. We are recognized for providing product innovations that help our customers produce larger, lighter, thinner and higher-resolution displays more affordably. In 2006, Corning launched EAGLE XG®, the industry’s first LCD glass substrate that is free of heavy metals. In 2010, leveraging the EAGLE XG® composition, Corning introduced EAGLE XG® Slim glass, a line of slim glass substrates which enables lighter-weight portable devices and thinner televisions and monitors. In 2011, Corning launched Corning Lotus™ Glass, a high-performance display glass developed to enable cutting-edge technologies, including organic light-emitting diode (OLED) displays and next generation LCDs. Corning Lotus Glass helps support the demanding manufacturing processes of both OLED and liquid crystal displays for high performance, portable devices such as smart phones, tablets, and notebook computers. In 2012, Corning introduced Corning® Willow™ Glass, our ultra-slim flexible glass for use in next-generation consumer electronic technologies. Not only does this technology support thinner backplanes for both OLED and LCD displays, it also allows for curved displays for immersive viewing or mounting on non-flat surfaces. And in 2013, Corning announced the commercial launch of Corning Lotus™ XT Glass, a second-generation glass substrate specially formulated for high-performance displays. The Corning Lotus
Glass platform offers an energy-efficient, immersive display device that features high resolution, fast response times, and bright picture quality.
Our Display Technologies segment has two equity affiliates: 1) Samsung Corning Precision Materials Co., Ltd. (Samsung Corning Precision Materials), of which Corning owns 57% and Samsung Display Co., Ltd. (Samsung Display) owns 43%; and 2) Samsung Corning Advanced Glass, LLC, owned equally by Corning and Samsung Mobile Display Co., Ltd. Samsung Corning Precision Materials is a leading supplier of LCD glass substrates to display manufacturers in Korea. Samsung Corning Advanced Glass, LLC manufactures specialty glass substrates for the rapidly expanding organic light emitting diode (OLED) device market. The business combines Corning’s Lotus™ Glass substrate technology and Samsung Display’s OLED display expertise, to provide outstanding product solutions for current and future OLED technologies. Samsung Corning Precision Materials’ financial statements are attached in Item 15, Exhibits and Financial Statement Schedules.
To extend Corning’s leadership in specialty glass and drive earnings growth, Corning announced in October 2013 that it is entering into a series of strategic and financial agreements with Samsung Display intended to strengthen product and technology collaborations between the two companies. Corning and Samsung Display completed this transaction on January 15, 2014.
The following is a summary of the series of transactions, and the impacts to the Display Technologies segment:
• Corning obtained full ownership of Samsung Corning Precision Materials. This organization and its assets will be integrated into Corning’s Display Technologies segment.
• Corning and Samsung Display extended their long-term LCD display glass supply agreement through 2023.
• The two companies’ strengthened their technology collaborations on strategic product development and commercialization initiatives.
In connection with these agreements, in the fourth quarter of 2013, Corning acquired the minority interests of three shareholders in Samsung Corning Precision Materials for $506 million, which included payment for the transfer of non-operating assets and the pro-rata portion of cash on Samsung Corning Precision Materials’ balance sheet at September 30,2013. The resulting transfer of shares to Corning increased Corning’s ownership percentage of Samsung Corning Precision Materials from 50% to 57%. Because this transaction did not result in a change in control based on the governing articles of this entity, Corning did not consolidate this entity as of December 31, 2013. The remaining transactions were completed on January 15, 2014, which increased Corning’s ownership to 100% and will result in consolidation of the entity beginning in the first quarter of 2014. Refer to Note 21 (Subsequent Events) to the Consolidated Financial Statements for additional information.

CORNING INCORPORATED - 2013 Annual Report2
Business Description
LCD glass manufacturing is a highly capital intensive business. Important attributes for success include efficient manufacturing, access to capital, technology know-how, and patents. As a result of these transactions, Corning expects to realize increased flexibility in glass-melting capabilities, which will allow the company to re-evaluate the need for major capital expenditures for additional fusion glass manufacturing assets.
Corning has LCD glass manufacturing operations in the United States, Japan, Taiwan and China. Samsung Corning Precision Materials has LCD glass manufacturing facilities in Korea. Following completion of the transaction, Corning will be able to service all specialty glass customers in all regions directly, utilizing its manufacturing facilities throughout Asia.
Patent protection and proprietary trade secrets are important to this segment’s operations. Corning has a growing portfolio of patents relating to its products, technologies and manufacturing processes. Corning licenses certain of its patents to Samsung Corning Precision Materials and other third parties and generates royalty income from these licenses. Refer to the material under the heading “Patents and Trademarks” for information relating to patents and trademarks.
The Display Technologies segment represented 32% of Corning’s sales in 2013.
Optical Communications SegmentCorning invented the world’s first low-loss optical fiber in 1970. Since that milestone, we have continued to pioneer optical fiber, cable and connectivity solutions. As global bandwidth demand driven by video usage grows exponentially, networks continue to migrate from copper to optical-based systems that can deliver the required cost-effective bandwidth-carrying capacity. Our unrivaled experience puts us in a unique position to design and deliver optical solutions that reach every edge of the communications network.
Because our Optical Communications segment has recently evolved from being a manufacturer of optical fiber and cable, and hardware and equipment to being a comprehensive provider of industry-leading optical solutions across the broader communications industry, we are updating the name of the segment to Corning Optical Communications. This segment will be classified into two main product groupings – carrier network and enterprise network. The carrier network product group consists primarily of products and solutions for optical-based communications infrastructure for services such as video, data and voice communications. The enterprise network product group consists primarily of optical-based communication networks of products and solutions sold to businesses, governments and individuals for their own use.
Our carrier network product portfolio begins with optical fiber products, including Vascade® submarine optical fibers for use in submarine networks; LEAF® optical fiber for long-haul, regional and metropolitan networks; SMF-28® ULL fiber for more scalable long-haul and regional networks; SMF-28e+™ single-mode optical fiber that provides additional transmission wavelengths in metropolitan and access networks; and ClearCurve® ultra-bendable single-mode fiber for use in multiple-dwelling units and fiber-to-the-home applications. In 2013, Corning announced its latest single-mode optical fiber innovation, SMF-28® Ultra fiber. Designed for high performance across the range of long-haul, metro, access, and fiber-to-the-home network applications, it is the first to combine the benefits of industry-leading attenuation and improved macrobend performance in one fiber. Our optical fiber is sold directly to end users or third-party cablers around the world. Corning’s remaining fiber production is cabled internally and sold to end users as either bulk cable or as part of an integrated optical solution. Corning’s cable products support various outdoor, indoor/outdoor and indoor applications and include a broad range of loose tube, ribbon and drop cable designs with flame-retardant versions available for indoor and indoor/outdoor use.
In addition to optical fiber and cable, our carrier network product portfolio also includes hardware and equipment products, including cable assemblies,
fiber optic hardware, fiber optic connectors, optical components and couplers, closures, network interface devices, and other accessories. These products may be sold as individual components or as part of integrated optical connectivity solutions designed for various carrier network applications. Examples of these solutions include our FlexNAPTM terminal distribution system, which provides pre-connectorized distribution and drop cable assemblies for cost-effectively deploying Fiber-to-the-Home (FTTH) networks; and the recently launched CentrixTM platform, which provides a high-density fiber management system with industry-leading density and innovative jumper routing that can be deployed in a wide variety of carrier switching centers.
To keep pace with surging demand for mobile bandwidth, the Corning Optical Network Evolution (ONE) wireless platform was launched in 2013. In addition to our full complement of operator-grade distributed antenna systems (DAS), ONE™ is the first all-optical converged cellular and Wi-Fi® solution built on an all-optical backbone with modular service support. The ONE wireless platform provides virtually unlimited bandwidth, and meets all of the wireless service needs of large-scale enterprises at a lower cost than the typical DAS solution.
In addition to our optical-based portfolio, Corning’s carrier network portfolio also contains select copper-based products including subscriber demarcation, connection and protection devices, xDSL (different variations of digital subscriber lines) passive solutions and outside plant enclosures. In addition, Corning offers coaxial RF interconnects for the cable television industry as well as for microwave applications for GPS, radars, satellites, manned and unmanned military vehicles, and wireless and telecommunications systems.
Our enterprise network product portfolio also includes optical fiber products, including ClearCurve® ultra-bendable multimode fiber for data centers and other enterprise network applications; InfiniCor® fibers for local area networks; and more recently ClearCurve® VSDN® ultra-bendable optical fiber designed to support emerging high-speed interconnects between computers and other consumer electronics devices. The remainder of Corning’s fiber production is cabled internally and sold to end users as either bulk cable or as part of an integrated optical solution. Corning’s cable products include a broad range of tight-buffered, loose tube and ribbon cable designs with flame-retardant versions available for indoor and indoor/outdoor applications that meet local building code requirements.
Corning’s hardware and equipment products for enterprise network applications include cable assemblies, fiber optic hardware, fiber optic connectors, optical components and couplers, closures and other accessories. These products may be sold as individual components or as part of integrated optical connectivity solutions designed for various network applications. Examples of enterprise network solutions include the Pretium EDGE® platform, which provides high-density pre-connectorized solutions for data center applications, and continues to evolve with recent updates for upgrading to 40/100G applications and port tap modules for network monitoring; the previously mentioned ONE Wireless platform, which spans both carrier and enterprise network applications; and our recently introduced optical connectivity solutions to support customer initiatives.
The Optical Communications segment also launched Thunderbolt™ Optical Cables in 2013, the first all-optical fiber cables designed for consumer applications. These cables allow users to effortlessly manage the demands of today’s high-bandwidth applications at up to 20 Gb/sec over longer distances. The electrically isolated, noise-reducing cables are up to 50 percent thinner and 80 percent lighter than comparable copper cables with substantially increased strength and flexibility.
Corning operates manufacturing facilities worldwide. Our optical fiber manufacturing facilities are located in North Carolina, China and India. Cabling operations include facilities in North Carolina, Germany, Poland, China and smaller regional locations and equity affiliates. Our manufacturing operations for hardware and equipment products are located in North Carolina, Texas, Arizona, Mexico, Brazil, Denmark, Germany, Poland, Israel, Australia and China.

CORNING INCORPORATED - 2013 Annual Report 3
Business Description
Patent protection is important to the segment’s operations. The segment has an extensive portfolio of patents relating to its products, technologies and manufacturing processes. The segment licenses certain of its patents to third parties and generates revenue from these licenses, although the royalty income is not currently material to this segment’s operating results. Corning is licensed to use certain patents owned by others, which are considered important to the segment’s operations. Refer to the material under the heading “Patents and Trademarks” for information relating to the Company’s patents and trademarks.
The Optical Communications segment represented 30% of Corning’s sales for 2013.
Environmental Technologies SegmentCorning’s Environmental Technologies segment manufactures ceramic substrates and filter products for emissions control in mobile and stationary applications around the world. In the early 1970s, Corning developed an economical, high-performance cellular ceramic substrate that is now the standard for catalytic converters in vehicles worldwide. As global emissions control regulations tighten, Corning has continued to develop more effective and durable ceramic substrate and filter products for gasoline and diesel applications. Corning manufactures substrate and filter products in New York, Virginia, China, Germany and South Africa. Corning sells its ceramic substrate and filter products worldwide to catalyzers and manufacturers of emission control systems who then sell to automotive and diesel vehicle or engine manufacturers. Although most sales are made to the emission control systems manufacturers, the use of Corning substrates and filters is generally required by the specifications of the automotive and diesel vehicle or engine manufacturers.
Patent protection is important to the segment’s operations. The segment has an extensive portfolio of patents relating to its products, technologies and manufacturing processes. Corning is licensed to use certain patents owned by others, which are also considered important to the segment’s operations. Refer to the material under the heading “Patents and Trademarks” for information relating to the Company’s patents and trademarks.
The Environmental Technologies segment represented 12% of Corning’s sales for 2013.
Specialty Materials SegmentThe Specialty Materials segment manufactures products that provide more than 150 material formulations for glass, glass ceramics and fluoride crystals to meet demand for unique customer needs. Consequently, this segment operates in a wide variety of commercial and industrial markets that include display optics and components, semiconductor optics components, aerospace and defense, astronomy, ophthalmic products, telecommunications components and cover glass that is optimized for portable display devices and televisions.
Our cover glass, known as Corning® Gorilla® Glass, is a thin sheet glass designed specifically to function as a cover glass for display devices such as tablets, notebook PCs, televisions and mobile phones. Elegant and lightweight, Corning Gorilla Glass is durable enough to resist many real-world events that commonly cause glass failure, enabling exciting new applications in technology and design. Early in 2012, Corning launched Corning® Gorilla® Glass 2, the next generation in our Corning Gorilla Glass suite of products. Corning Gorilla Glass 2 enables up to a 20% reduction in glass thickness, while maintaining the industry-leading damage resistance, toughness and scratch-resistance. And in 2013, we introduced Corning® Gorilla® Glass 3 with Native Damage Resistance, our latest version of our damage-resistant cover glass for consumer electronic devices, and Corning® Gorilla® Glass NBT™, designed to help protect touch notebook displays from scratches and other forms of damage that come from everyday handling and use. Corning Gorilla Glass is manufactured in Kentucky, Japan and Taiwan.
Semiconductor optics manufactured by Corning includes high-performance optical material products, optical-based metrology instruments, and optical assemblies for applications in the global semiconductor industry. Corning’s semiconductor optics products are manufactured in New York.
Other specialty glass products include glass lens and window components and assemblies and are made in New York, New Hampshire, Kentucky and France or sourced from China.
Patent protection is important to the segment’s operations. The segment has a growing portfolio of patents relating to its products, technologies and manufacturing processes. Brand recognition and loyalty, through well-known trademarks, are important to the segment. Refer to the material under the heading “Patents and Trademarks” for information relating to the Company’s patents and trademarks.
The Specialty Materials segment represented approximately 15% of Corning’s sales for 2013.
Life Sciences SegmentAs a leading developer, manufacturer and global supplier of scientific laboratory products for more than 95 years, Corning’s Life Sciences segment collaborates with researchers seeking new approaches to increase efficiencies, reduce costs and compress timelines in the drug discovery process. Using unique expertise in the fields of materials science, surface science, optics, biochemistry and biology, the segment provides innovative solutions that improve productivity and enable breakthrough discoveries.
Life Sciences laboratory products include general labware and equipment, as well as specialty surfaces, media and reagents, that are used for cell culture research, bioprocessing, genomics, drug discovery, microbiology and chemistry. Corning sells life science products under these primary brands: Corning, Falcon, PYREX, Axygen, and Gosselin. The products are marketed worldwide, primarily through distributors to pharmaceutical and biotechnology companies, academic institutions, hospitals, government entities, and other research facilities. Corning manufactures these products in the United States in Maine, New York, New Jersey, California, Utah, Virginia, Massachusetts and North Carolina, and outside of the U.S. in Mexico, France, Poland, and China.
In addition to being a global leader in consumable glass and plastic laboratory tools for life science research, Corning continues to develop and produce unique technologies aimed at simplifying customer lab processes, or “workflows”, through three key categories:
• Vessels – Corning® HYPER platform of vessels for increased cell yields; Corning® Microcarriers for cell scale-up, therapy and vaccine applications;
• Surfaces – Corning® CellBIND® Surface; Corning®Matrigel®; Corning®BioCoatTM; Corning Synthemax® II Surface;
• Media – Corning® stemgro®In addition, Corning continues to advance its Corning® Epic® Technology for high-throughput screening with the Corning®Epic®BT, bench top instrument.
Patent protection is important to the segment’s operations. The segment has a growing portfolio of patents relating to its products, technologies and manufacturing processes. Brand recognition and loyalty, through well-known trademarks, are important to the segment. Refer to the material under the heading “Patents and Trademarks” for information relating to the Company’s patents and trademarks.
The Life Sciences segment represented approximately 11% of Corning’s sales for 2013.

CORNING INCORPORATED - 2013 Annual Report4
Business Description
All OtherAll Other primarily includes development projects and new product lines, certain corporate investments, Samsung Corning Precision Materials’ non-LCD business, Corning’s Eurokera and Keraglass equity affiliates with Saint Gobain Vitrage S.A. of France, which manufacture smooth cooktop glass/ceramic products, and Corsam, an equity affiliate established between Corning and Samsung Corning Precision Materials to provide glass technology research. Development projects and new product lines involve the use of various technologies for new products such as advanced
flow reactors, thin-film photovoltaics and adjacency businesses in pursuit of thin, strong glass applications.
The Other segment represented less than 1% of Corning’s sales for 2013.
Additional explanation regarding Corning and its five reportable segments is presented in Management’s Discussion and Analysis of Financial Condition and Results of Operations and Note 20 (Reportable Segments) to the Consolidated Financial Statements.
Corporate Investments
Corning and The Dow Chemical Company (Dow Chemical) each own half of Dow Corning Corporation (Dow Corning), an equity company headquartered in Michigan that manufactures silicone products worldwide. Dow Corning is a leader in silicon-based technology and innovation, offering more than 7,000 products and services. Dow Corning is the majority-owner of Hemlock Semiconductor Group (Hemlock), a market leader in the production of high purity polycrystalline silicon for the semiconductor and solar energy industries. Dow Corning’s sales were $5.7 billion in 2013. Additional discussion about Dow Corning appears in the Legal Proceedings section. Dow Corning’s financial statements are attached in Item 15, Exhibits and Financial Statement Schedules.
Corning and PPG Industries, Inc. each own half of Pittsburgh Corning Corporation (PCC), an equity company in Pennsylvania that manufactures glass products for architectural and industrial uses. PCC filed for Chapter 11 bankruptcy reorganization in April 2000. Corning also owns half of Pittsburgh Corning Europe N.V. (PCE), a Belgian corporation that manufactures glass products for industrial uses primarily in Europe. Additional discussion about PCC and PCE appears in the Legal Proceedings section.
Additional information about corporate investments is presented in Note 7 (Investments) to the Consolidated Financial Statements.
Competition
Corning competes across all of its product lines with many large and varied manufacturers, both domestic and foreign. Some of these competitors are larger than Corning, and some have broader product lines. Corning strives to sustain and improve its market position through technology and product innovation. For the future, Corning believes its competitive advantage lies in its commitment to research and development, and its commitment to quality. There is no assurance that Corning will be able to maintain or improve its market position or competitive advantage.
Display Technologies SegmentWe believe Corning, including Samsung Corning Precision Materials, is the largest worldwide producer of glass substrates for active matrix LCD displays. The environment for LCD glass substrate products is very competitive and Corning believes it has sustained its competitive advantages by investing in new products, providing a consistent and reliable supply, and using its proprietary fusion manufacturing process. This process allows us to deliver glass that is larger, thinner and lighter, with exceptional surface quality and without heavy metals. Asahi Glass, Nippon Electric Glass and Avan Strate, Inc. are Corning’s principal competitors in display glass substrates.
Optical Communications SegmentCompetition within the communications equipment industry is intense among several significant companies. Corning is a leading competitor in the segment’s principal product groups, which include carrier network and enterprise network. The competitive landscape includes industry consolidation, price pressure and competition for the innovation of new products. These competitive conditions are likely to persist. Corning believes its large scale manufacturing experience, fiber process, technology leadership and intellectual property yield cost advantages relative to several of its competitors.
The primary competing producers of carrier network products are TE Connectivity, Prysmian Group, OFS (a Furukawa Company), Fujikura Ltd., Sumitomo Electric, YOFC, Futong Group and 3M Company.
For enterprise network products, significant competitors are CommScope, TE Connectivity, Panduit Corporation and a number of other smaller competitors.
Environmental Technologies SegmentFor worldwide automotive ceramic substrate products, Corning has a major market position that has remained relatively stable over the past year. Corning has also established a strong presence in the heavy duty and light duty diesel vehicle market and believes its competitive advantage in automotive ceramic substrate products for catalytic converters and diesel filter products for exhaust systems is based upon global presence, customer service, engineering design services and product innovation. Corning’s Environmental Technologies products face principal competition from NGK, Denso, and Ibiden.
Specialty Materials SegmentCorning is one of very few manufacturers with deep capabilities in materials science, optical design, shaping, coating, finishing, metrology, and system assembly. Additionally, we are addressing emerging needs of the consumer electronics industry with the development of chemically strengthened glass. Corning Gorilla Glass is a thin-sheet glass that is better able to survive events that most commonly cause glass failure. Its advanced composition allows a deeper layer of chemical strengthening than is possible with most other chemically strengthened glasses, making it both durable and damage resistant. Our products and capabilities in this segment position the Company to meet the needs of a broad array of markets including display, semiconductor, aerospace/defense, astronomy, vision care, industrial/commercial, and telecommunications. For this segment, Schott, Shin-Etsu Quartz Products, Asahi Glass, Carl Zeiss, Nikon, Nippon Electric Glass, Transitions Optical, Oerlikon, Hoya and Heraeus are the main competitors.

CORNING INCORPORATED - 2013 Annual Report 5
Business Description
Life Sciences SegmentCorning seeks to maintain a competitive advantage by emphasizing product quality, product availability, supply chain efficiency, a wide product line and superior product attributes. Our principle worldwide competitors
include Greiner, Nunc, Kimble-Chase, Gibco and Duran. Corning also faces increasing competition from two large distributors that have pursued backward integration or introduced private label products.
Raw Materials
Corning’s production of specialty glasses, ceramics, and related materials requires significant quantities of energy, uninterrupted power sources, certain precious metals, and various batch materials.
Although energy shortages have not been a problem recently, the cost of energy remains volatile. Corning has achieved flexibility through engineering changes to take advantage of low-cost energy sources in most significant processes. Specifically, many of Corning’s principal manufacturing processes can be operated with natural gas, propane, oil or electricity, or a combination of these energy sources.
Availability of resources (ores, minerals, polymers, helium and processed chemicals) required in manufacturing operations, appears to be adequate.
Corning’s suppliers, from time to time, may experience capacity limitations in their own operations, or may eliminate certain product lines. Corning believes it has adequate programs to ensure a reliable supply of batch materials and precious metals. For many products, Corning has alternate glass compositions that would allow operations to continue without interruption in the event of specific materials shortages.
Certain key materials and proprietary equipment used in the manufacturing of products are currently sole-sourced or available only from a limited number of suppliers. Any future difficulty in obtaining sufficient and timely delivery of components could result in lost sales due to delays or reductions in product shipments, or reductions in Corning’s gross margins.
Patents and Trademarks
Inventions by members of Corning’s research and engineering staff have been, and continue to be, important to the Company’s growth. Patents have been granted on many of these inventions in the United States and other countries. Some of these patents have been licensed to other manufacturers, including companies in which Corning has equity investments. Many of our earlier patents have now expired, but Corning continues to seek and obtain patents protecting its innovations. In 2013, Corning was granted over 350 patents in the U.S. and over 700 patents in countries outside the U.S.
Each business segment possesses a patent portfolio that provides certain competitive advantages in protecting Corning’s innovations. Corning has historically enforced, and will continue to enforce, its intellectual property rights. At the end of 2013, Corning and its wholly-owned subsidiaries owned over 6,900 unexpired patents in various countries of which about 3,100 were U.S. patents. Between 2014 and 2015, approximately 4% of these patents will expire, while at the same time Corning intends to seek patents protecting its newer innovations. Worldwide, Corning has over 8,000 patent applications in process, with about 2,000 in process in the U.S. Corning believes that its patent portfolio will continue to provide a competitive advantage in protecting Corning’s innovation, although Corning’s competitors in each of its businesses are actively seeking patent protection as well.
The Display Technologies segment has over 900 patents in various countries, of which over 250 are U.S. patents. No one patent is considered material to this business segment. Some of the important U.S.-issued patents in this segment include patents relating to glass compositions and methods for the use and manufacture of glass substrates for display applications. There is no group of important Display Technologies segment patents set to expire between 2014 and 2016.
The Optical Communications segment has over 2,400 patents in various countries, of which over 1,100 are U.S. patents. No one patent is considered material to this business segment. Some of the important U.S.-issued patents in this segment include: (i) patents relating to optical fiber products including low loss optical fiber, high data rate optical fiber, and dispersion compensating fiber, and processes and equipment for manufacturing optical fiber, including methods for making optical fiber preforms and methods for drawing, cooling and winding optical fiber; (ii) patents relating to optical fiber ribbons and methods for making such ribbon, fiber optic cable designs and methods for installing optical fiber cable; (iii) patents relating to optical fiber connectors, termination and storage and associated methods of manufacture; and (iv) patents related to
distributed communication systems. There is no group of important Optical Communications segment patents set to expire between 2014 and 2016.
The Environmental Technologies segment has over 500 patents in various countries, of which over 250 are U.S. patents. No one patent is considered material to this business segment. Some of the important U.S.-issued patents in this segment include patents relating to cellular ceramic honeycomb products, together with ceramic batch and binder system compositions, honeycomb extrusion and firing processes, and honeycomb extrusion dies and equipment for the high-volume, low-cost manufacture of such products. There is no group of important Environmental Technologies segment patents set to expire between 2014 and 2016.
The Specialty Materials segment has about 600 patents in various countries, of which over 350 are U.S. patents. No one patent is considered material to this business segment. Some of the important U.S.-issued patents in this segment include patents relating to protective cover glass, ophthalmic glasses and polarizing dies, and semiconductor/microlithography optics and blanks, metrology instrumentation and laser/precision optics, glass polarizers, specialty fiber, and refractories. There is no group of important Specialty Materials segment patents set to expire between 2014 and 2016.
The Life Sciences segment has over 800 patents in various countries, of which over 250 are U.S. patents. No one patent is considered material to this business segment. Some of the important U.S.-issued patents in this segment include patents relating to methods and apparatus for the manufacture and use of scientific laboratory equipment including multiwell plates and cell culture products, as well as equipment and processes for label independent drug discovery. There is no group of important Life Sciences segment patents set to expire between 2014 and 2016.
Products reported in All Other include development projects, new product lines, and other businesses or investments that do not meet the threshold for separate reporting.
Many of the Company’s patents are used in operations or are licensed for use by others, and Corning is licensed to use patents owned by others. Corning has entered into cross licensing arrangements with some major competitors, but the scope of such licenses has been limited to specific product areas or technologies.
Corning’s principal trademarks include the following: Axygen, Corning, Celcor, ClearCurve, DuraTrap, Eagle XG, Epic, Evolant, Gosselin, Gorilla, HPFS, Lanscape, Pretium, Pyrex, Steuben, Falcon, SMF-28e, and Willow.

CORNING INCORPORATED - 2013 Annual Report6
Business Description
Protection of the Environment
Corning has a program to ensure that its facilities are in compliance with state, federal and foreign pollution-control regulations. This program has resulted in capital and operating expenditures each year. In order to maintain compliance with such regulations, capital expenditures for pollution control in continuing operations were approximately $5 million in 2013 and are estimated to be $6 million in 2014.
Corning’s 2013 consolidated operating results were charged with approximately $39 million for depreciation, maintenance, waste disposal and other operating expenses associated with pollution control. Corning believes that its compliance program will not place it at a competitive disadvantage.
Employees
At December 31, 2013, Corning had approximately 30,400 full-time employees, including approximately 11,400 employees in the United States. From time to time, Corning also retains consultants, independent contractors, temporary and part-time workers. Unions are certified as bargaining agents for approximately 23.8% of Corning’s United States employees.
Executive Officers
Wendell P. Weeks Chairman, Chief Executive Officer and President
Mr. Weeks joined Corning in 1983. He was named vice president and general manager of the Optical Fiber business in 1996, senior vice president in 1997, senior vice president of Opto-Electronics in 1998, executive vice president in 1999, and president, Corning Optical Communications in 2001. Mr. Weeks was named president and chief operating officer of Corning in 2002, president and chief executive officer in 2005 and chairman and chief executive officer on April 26, 2007. He added the title of president in December 2010. Mr. Weeks is a director of Merck & Co. Inc. Mr. Weeks has been a member of Corning’s Board of Directors since 2000. Age 54.
James B. Flaws Vice Chairman and Chief Financial Officer
Mr. Flaws joined Corning in 1973 and served in a variety of controller and business management positions. Mr. Flaws was elected assistant treasurer of Corning in 1993, vice president and controller in 1997, vice president of finance and treasurer in May 1997, senior vice president and chief financial officer in December 1997, executive vice president and chief financial officer in 1999 and to his current position in 2002. Mr. Flaws is a director of Dow Corning Corporation. Mr. Flaws has been a member of Corning’s Board of Directors since 2000. Age 65.
Kirk P. Gregg Executive Vice President and Chief Administrative Officer
Mr. Gregg joined Corning in 1993 as director of Executive Compensation. He was named vice president of Executive Resources and Employee Benefits in 1994, senior vice president, Administration in December 1997and to his current position in 2002. He is responsible for Human Resources, Information Technology, Procurement and Transportation, Aviation, Community Affairs, Government Affairs, Business Services and Corporate Security. Prior to joining Corning, Mr. Gregg was with General Dynamics Corporation as corporate director, Key Management Programs, and was responsible for executive compensation and benefits, executive development and recruiting. Age 54.
Lawrence D. McRae Executive Vice President, Strategy and Corporate Development
Mr. McRae joined Corning in 1985 and served in various financial, sales and marketing positions. He was elected vice president Corporate Development in 2000, senior vice president Corporate Development in 2003, and senior vice president Strategy and Corporate Development in October 2005. He was elected to his present position in October 2010. Mr. McRae is on the board of directors of Dow Corning Corporation, and Samsung Corning Precision Materials Co., Ltd. Age 55.
David L. Morse Executive Vice President and Chief Technology Officer
Dr. Morse joined Corning in 1976 in glass research, and worked as a composition scientist in developing and patenting several major products. He served in a variety of product and materials research and technology director roles, and was appointed division vice president and technology director for photonic technology groups beginning in March 1999, and became director of corporate research, science and technology in December 2001.He was elected vice president in January 2003, becoming senior vice president and director of corporate research in 2006. Dr. Morse was elected to his current position in May 2012. He is on the board of Dow Corning Corporation and a member of the National Academy of Engineering and the National Chemistry Board. Age 61.
Jeffrey W. Evenson Senior Vice President and Operations Chief of Staff
Dr. Evenson joined Corning in June 2011 and was elected to his current position at that time. He serves on the Management Committee and oversees a variety of strategic programs and growth initiatives. Prior to joining Corning, Dr. Evenson was a senior vice president with Sanford C. Bernstein, where he served as a senior analyst since 2004. Before that, Dr. Evenson was a partner at McKinsey & Company, where he led technology and market assessment for early-stage technologies. Age 48.
R. Tony Tripeny Senior Vice President, Corporate Controller and Principal Accounting Officer
Mr. Tripeny joined Corning in 1985 as the corporate accounting manager of Corning Cable Systems, and became the Keller facility’s plant controller in 1989. In 1993, he was appointed equipment division controller of Corning Cable Systems and, in 1996 corporate controller. Mr. Tripeny was appointed chief financial officer of Corning Cable Systems in July 2000. In 2003, he took on the additional role of Telecommunications group controller. He was appointed division vice president, operations controller in August 2004, and vice president, corporate controller in October 2005. Mr. Tripeny was elected to his current position in April 2009. He is on the board of directors of Hardinge Inc. Age 54.
Lewis A. Steverson Senior Vice President and General Counsel
Mr. Steverson joined Corning in June 2013 as Senior Vice President and General Counsel. Prior to joining Corning, Mr. Steverson served as senior vice president, general counsel, and secretary of Motorola Solutions, Inc. During his 18 years with Motorola, he held a variety of legal leadership roles across the company’s numerous business units. Prior to Motorola, Mr. Steverson was in private practice at the law firm of Arnold & Porter. Age 50.

CORNING INCORPORATED - 2013 Annual Report 7
Risk Factors
Document Availability
A copy of Corning’s 2013 Annual Report on Form 10-K filed with the Securities and Exchange Commission is available upon written request to Ms. Linda E. Jolly,Corporate Secretary, Corning Incorporated, HQ-E2-10, Corning, NY 14831. The Annual Report on Form 10-K, quarterly reports on Form 10-Q, current reports on Form 8-K, and amendments pursuant to Section 13(a) or 15(d) of the Exchange Act of 1934 and other filings are available as soon as reasonably
practicable after such material is electronically filed or furnished to the SEC, and can be accessed electronically free of charge, through the Investor Relations line on Corning’s web site at www.corning.com. The information contained on the Company’s website is not included in, or incorporated by reference into, this Annual Report on Form 10-K.
Risk FactorsWe operate in rapidly changing economic and technological environments that present numerous risks, many of which are driven by factors that we cannot control or predict. Our operations and financial results are subject to various risks and uncertainties, including those described below, that could adversely affect our business, financial condition, results of operations, cash flows, and the trading price of our common stock. The following discussion of “risk factors” identifies the most significant factors that may adversely affect our business, operations, financial position or future financial performance. This information should be read in conjunction with MD&A and the consolidated financial statements and related notes incorporated by reference into this report. The following discussion of risks is not all inclusive but is designed to highlight what we believe are important factors to consider, as these factors could cause our future results to differ from those in the forward-looking statements and from historical trends.
As a multinational company, we face many risks which could adversely impact our ongoing operations and reported financial results
We operate in over 100 countries and derive a substantial portion of our revenues from, and have significant operations, outside of the United States. Our international operations include manufacturing, assembly, sales, customer support, and shared administrative service centers.
Compliance with laws and regulations increases our cost of doing business. These laws and regulations include U.S. laws and local laws which include data privacy requirements, employment and labor laws, tax laws, anti-competition regulations, prohibitions on payments to governmental officials, import and trade restrictions and export requirements. Non-compliance and violations could result in fines, criminal sanctions against us, our officers or our employees, and prohibitions on the conduct of our business. Any such violations could result in prohibitions on our ability to offer our products and services in one or more countries and could also materially damage our reputation, our brand, our international expansion efforts, our ability to attract and retain employees, our business and our operating results. Our success depends, in part, on our ability to anticipate these risks and manage these difficulties.
We are also subject to a variety of other risks in managing a multinational global organization, including those related to:
• General economic conditions in each country or region; • Many complex regulatory requirements affecting international trade and investment, including anti-dumping laws, export controls, the Foreign Corrupt Practices Act and local laws prohibiting improper payments. Our operations may be adversely affected by changes in the substance or enforcement of these regulatory requirements, and by actual or alleged violations of them;
• Fluctuations in currency exchange rates, convertibility of currencies and restrictions involving the movement of funds between jurisdictions and countries;
• Sovereign risks may adversely affect Corning’s profitability and assets; • Geographical concentration of our factories and operations and regional shifts in our customer base;
• Periodic health epidemic concerns; • Political unrest, confiscation or expropriation of our assets by foreign governments, terrorism and the potential for other hostilities;
• Difficulty in protecting intellectual property or sensitive commercial and operations data or information technology systems generally;
• Differing legal systems, including protection and treatment of intellectual property and patents;
• Complex tax regimes, tariffs, trade duties and other trade barriers including anti-dumping duties;
• Difficulty in collecting obligations owed to us such as accounts receivable; • Natural disasters such as floods, earthquakes and windstorms; and • Potential power loss or disruption affecting manufacturing.
Our sales could be negatively impacted by the actions or circumstances of one or more key customers leading to the substantial reduction in orders for our products
In 2013, Corning’s ten largest customers accounted for 50% of our sales.
In addition, a relatively small number of customers accounted for a high percentage of net sales in our reportable segments. For 2013, four customers of the Display Technologies segment accounted for 94% of total segment net sales when combined. In the Optical Communications segment, one customer accounted for 10% of segment net sales. In the Environmental Technologies segment, three customers accounted for 87% of total segment sales in aggregate. In the Specialty Materials segment, three customers accounted for 47% of segment sales in 2013. In the Life Sciences segment, two customers accounted for 44% of segment sales in 2013. As a result of mergers and consolidations between customers, Corning’s customer base could become more concentrated.
Samsung Corning Precision Materials’ sales were also concentrated in 2013, with sales to two LCD panel makers located in South Korea accounting for approximately 92% of total Samsung Corning Precision Materials sales.
Our Optical Communications segment customers’ purchases of our products are affected by their capital expansion plans, general market and economic uncertainty and regulatory changes, including broadband policy. Sales in the Optical Communications segment are expected to be impacted by the pace of fiber-to-the-premises deployments. Our sales will be dependent on planned targets for homes passed and connected. Changes in our customers’ deployment plans could adversely affect future sales.

CORNING INCORPORATED - 2013 Annual Report8
Risk Factors
In the Environmental Technologies segment, sales of our ceramic substrate and filter products for automotive and diesel emissions tend to fluctuate with vehicle production. Changes in laws and regulations for air quality and emission controls may also influence future sales. Sales in our Environmental Technologies segment are mainly to three catalyzers and emission system control manufacturers. Our customers sell these systems to automobile and diesel engine original equipment manufacturers. Sales in this segment may be affected by adverse developments in the global vehicle or freight hauling industries or by such factors as higher fuel prices that may affect vehicle sales or downturns in freight traffic.
Certain sales in our Specialty Materials segment track worldwide economic cycles and our customers’ responses to those cycles. In addition, any positive trends in prior years in the sales of strengthened glass may not continue. We may experience losses relating to our inability to supply contracted quantities of this glass and processes planned to produce new versions of this glass may not be successful.
Sales in our Life Sciences segment are concentrated with two large distributors who are also competitors, and the balance is to a variety of pharmaceutical and biotechnology companies, hospitals, universities, and other research facilities. In 2013, our two largest distributors accounted for 44% of Life Sciences’ segment sales. Changes in our distribution arrangements in this segment may adversely affect this segment’s financial results.
Our operations and financial performance could be negatively impacted, if the markets for our products do not develop and expand as we anticipate
The markets for our products are characterized by rapidly changing technologies, evolving industry or regulatory standards and new product introductions. Our success is dependent on the successful introduction of new products, or upgrades of current products, and our ability to compete with new technologies. The following factors related to our products and markets, if they do not continue as in the recent past, could have an adverse impact on our operations:
• our ability to introduce advantaged products such as glass substrates for liquid crystal displays, optical fiber and cable and hardware and equipment, and environmental substrate and filter products at competitive prices;
• our ability to manufacture glass substrates and strengthened glass, to satisfy our customers technical requirements and our contractual obligations; and
• our ability to develop new products in response to government regulations and laws.
We face pricing pressures in each of our businesses that could adversely affect our financial performance
We face pricing pressure in each of our businesses as a result of intense competition, emerging technologies, or over-capacity. While we work consistently toward reducing our costs to offset pricing pressures, we may not be able to achieve proportionate reductions in costs or sustain our current rate of cost reduction. We anticipate pricing pressures will continue in the future in all our businesses.
Any of these items could cause our sales, profitability and cash flows to be significantly reduced.
We face risks due to foreign currency fluctuations
Because we have significant customers and operations outside the U.S., fluctuations in foreign currencies, especially the Japanese yen, New Taiwan dollar, Korean won, and Euro, affect our sales, profit and cash flows. Foreign exchange rates may make our products less competitive in countries where local currencies decline in value relative to the U.S. dollar and Japanese yen.Sales in our Display Technologies segment, representing 32% of Corning’s sales in 2013, are denominated in Japanese yen. If sales grow in our Display Technologies segment, our exposure to currency fluctuations will increase. Corning hedges significant transaction and balance sheet
currency exposures and uses derivative instruments to limit exposure to foreign currency fluctuations associated with certain monetary assets and liabilities as well as operating results. Although we selectively hedge these items, changes in exchange rates (especially the Japanese yen to U.S. dollar) will significantly impact our reported revenues and profits.
A large portion of our consolidated operations are international and we expect that we will continue to realize gains or losses with respect to our foreign currency exposures, net of gains or losses from our hedging programs. For example, we will experience foreign currency gains and losses in certain instances if it is not possible or cost effective to hedge our foreign currency exposures or should we elect not to hedge certain of our foreign currency exposures. We have a program which primarily utilizes foreign currency forward contracts to offset the risks associated with foreign currency exposures. As a part of this program, we enter into foreign currency forward contracts so that increases or decreases in the value of our foreign currency exposures are at least partially offset by gains or losses on the foreign currency forward contracts in order to mitigate the volatility associated with our foreign currency transactions. We are exposed to potential losses in the event of non-performance by our counterparties to these derivative contracts. However, we minimize this risk by limiting the counterparties to a diverse group of highly-rated major international financial institutions with which we have other financial relationships. We do not expect to record any losses as a result of such counterparty default. Neither we nor our counterparties are required to post collateral for these financial instruments. Our ultimate realized loss or gain with respect to currency fluctuations will generally depend on the size and type of cross-currency exposures that we enter into, the currency exchange rates associated with these exposures and changes in those rates, whether we have entered into foreign currency forward contracts to offset these exposures and other factors. All of these factors could materially impact our results of operations, anticipated future results, financial position and cash flows, the timing of which is variable and generally outside of our control.
If the financial condition of our customers declines, our credit risks could increase
Although we have a rigorous process to administer credit and believe our bad debt reserve is adequate, we have experienced, and in the future may experience, losses as a result of our inability to collect our accounts receivable. If our customers or our indirect customers fail to meet their payment obligations for our products, we could experience reduced cash flows and losses in excess of amounts reserved. Many customers of our Display Technologies and Specialty Materials segments are thinly capitalized and/or unprofitable. In our Environmental Technologies segment, the U.S. auto makers and certain of their suppliers have encountered credit downgrades or have filed for bankruptcy protection. In our Optical Communications segment, certain large infrastructure projects are subject to governmental funding, which, if terminated, could adversely impact the financial strength of our customers. These factors may result in an inability to collect receivables or a possible loss in business.
The success of our business depends on our ability to develop and produce advantaged products that meet our customers’ needs
Our business relies on continued global demand for our brands and products. To achieve business goals, we must develop and sell products that appeal to our customers, OEMs and distributors. This is dependent on a number of factors, including our ability to manage and maintain key customer relationships, our ability to produce products that meet the quality, performance and price expectations of our customers. The manufacturing of our products involves complex and precise processes. In some cases, existing manufacturing may be insufficient to achieve the requirements of our customers. We will need to develop new manufacturing processes and techniques to maintain profitable operations. While we continue to fund projects to improve our manufacturing techniques and processes and lower our costs, we may not achieve satisfactory manufacturing costs that will fully enable us to meet our profitability targets.

CORNING INCORPORATED - 2013 Annual Report 9
Risk Factors
In addition, our continued success in selling products that appeal to our customers is dependent on our ability to innovate, with respect to both products and operations, and on the availability and effectiveness of legal protection for our innovations. Failure to continue to deliver quality and competitive products to the marketplace, to adequately protect our intellectual property rights, to supply products that meet applicable regulatory requirements or to predict market demands for, or gain market acceptance of, our products, could have a negative impact on our business, results of operations and financial condition.
Our future financial performance depends on our ability to purchase a sufficient amount of materials, precious metals, parts, and manufacturing equipment to meet the demands of our customers
Our ability to meet customer demand depends, in part, on our ability to obtain timely and adequate delivery of materials, precious metals, parts and components from our suppliers. We may experience shortages that could adversely affect our operations. Although we work closely with our suppliers to avoid shortages, there can be no assurances that we will not encounter problems in the future. Furthermore, certain manufacturing equipment, raw materials or components are available only from a single source or limited sources. We may not be able to find alternate sources in a timely manner. A reduction, interruption or delay of supply, or a significant increase in the price for supplies, such as manufacturing equipment, precious metals, raw materials or energy, could have a material adverse effect on our businesses.
We have incurred, and may in the future incur, goodwill and other intangible asset impairment charges
At December 31, 2013, Corning had goodwill and other intangible assets of $1,542 million. While we believe the estimates and judgments about future cash flows used in the goodwill impairment tests are reasonable, we cannot provide assurance that future impairment charges will not be required if the expected cash flow estimates as projected by management do not occur, especially if an economic recession occurs and continues for a lengthy period or becomes severe, or if acquisitions and investments made by the Company fail to achieve expected returns.
If our products, including materials purchased from our suppliers, experience performance issues, our business will suffer
Our business depends on the production of products of consistently high quality. Our products, components and materials purchased from our suppliers, are typically tested for quality. These testing procedures are limited to evaluating our products under likely and foreseeable failure scenarios. For various reasons, our products, including materials purchased from our suppliers, may fail to perform as a customer expected. In some cases, product redesigns or additional expense may be required to address such issues. A significant or systemic quality issue could result in customer relations problems, lost sales, reduced volumes, product recalls and financial damages and penalties.
We operate in a highly competitive environment
We operate in a highly competitive environment, and our outlook depends on the company’s share of industry sales based on our ability to compete with others in the marketplace. The Company competes on the basis of product attributes, customer service, quality and price. There can be no assurance that our products will be able to compete successfully with other companies’ products. Our share of industry sales could be reduced due to aggressive pricing or product strategies pursued by competitors, unanticipated product or manufacturing difficulties, our failure to price our products competitively, our failure to produce our products at a competitive cost or unexpected, emerging technologies or products. We expect that we will face continuous competition from existing competitors, low cost manufacturers and new entrants. We believe we must invest in research and development, engineering, manufacturing and marketing capabilities, and continue to improve customer service in order to remain competitive. We cannot provide assurance that we will be able to maintain or improve our competitive position.
We may need to change our pricing models to compete successfully
We face intense competition in all of our businesses, particularly LCD glass, and general economic and business conditions can put pressure on us to change our prices. If our competitors offer significant discounts on certain products or develop products that the marketplace considers more valuable, we may need to lower prices or offer other favorable terms in order to retain our customers and market positions. Any such changes may reduce our profitability and cash flow. Any broad-based change to our prices and pricing policies could cause our revenues to decline or be delayed as we implement and our customers adjust to the new pricing policies. If we do not adapt our pricing models to reflect changes in customer use of our products or changes in customer demand, our revenues could decrease.
LCD glass generates a significant amount of the Company’s profits and cash flow, and any events that adversely affect the market for LCD glass substrates could have a material and negative impact on our financial results
Corning’s ability to generate profits and operating cash flow depends largely upon the level of profitability of our LCD glass business. As a result, any event that adversely affects our Display business could have a significant impact on our consolidated financial results. These events could include loss of patent protection, increased costs associated with manufacturing, and increased competition from the introduction of new, and more desirable products. If any of these events had a material adverse effect on the sales of our LCD glass, such an event could result in material charges and a significant reduction in profitability.
Additionally, emerging material technologies could replace our glass substrates for certain applications, including display glass, cover glass and others, resulting in a decline in demand for our products. Existing or new production capacity for glass substrates may exceed the demand for them. Technologies for displays, cover glass and other applications in competition with our glass may reduce or eliminate the need for our glass substrates. New process technologies developed by our competitors may also place us at a cost or quality disadvantage. Our own process technologies may be acquired or used unlawfully by others, enabling them to compete with us. Our inability to manufacture glass substrates to the specifications required by our customers may result in loss of revenue, margins and profits or liabilities for failure to supply. A scarcity of resources, limitations on technology, personnel or other factors resulting in a failure to produce commercial quantities of glass substrates could have adverse financial consequences to us.
Changes in our effective tax rate or tax liability may have an adverse effect on our results of operations
Our effective tax rate could be adversely impacted by several factors, including:
• changes in the relative amounts of income before taxes in the various jurisdictions in which we operate that have differing statutory tax rates;
• changes in tax treaties and regulations or the interpretation of them; • changes to our assessments about the realizability of our deferred tax assets that are based on estimates of our future results, the prudence and feasibility of possible tax planning strategies, and the economic environments in which we do business;
• the outcome of current and future tax audits, examinations, or administrative appeals;
• changes in generally accepted accounting principles that affect the accounting for taxes; and
• limitations or adverse findings regarding our ability to do business in some jurisdictions.
In the ordinary course of our business, there are many transactions and calculations where the ultimate tax determination is uncertain. Significant judgment is required in determining our worldwide provision for income taxes. Although we believe our tax estimates are reasonable, the final determination could be materially different from our historical tax provisions and accruals.

CORNING INCORPORATED - 2013 Annual Report10
Risk Factors
We may have additional tax liabilities
We are subject to income taxes in the U.S. and many foreign jurisdictions and are commonly audited by various tax authorities. Although we believe our tax estimates are reasonable, the final determination of tax audits and any related litigation could be materially different from our historical income tax provisions and accruals. The results of an audit or litigation could have a material effect on our financial statements in the period or periods for which that determination is made.
A significant amount of our net profits and cash flows are generated from outside the U.S., and certain repatriation of funds currently held in foreign jurisdictions may result in higher effective tax rates for the company. In addition, there have been proposals to change U.S. tax laws that could significantly impact how U.S. multinational corporations are taxed on foreign earnings. Although we cannot predict whether or in what form proposed legislation may pass, if enacted certain anti-deferral proposals could have a material adverse impact on our tax expense and cash flow.
Our business depends on our ability to attract and retain talented employees
The loss of the services of any of our key research and development, engineering or operational personnel or senior management without adequate replacement, or the inability to attract new qualified personnel, could have a material adverse effect on our operations and financial performance.
We are subject to strict environmental regulations and regulatory changes that could result in fines or restrictions that interrupt our operations
Various stages in some of our manufacturing processes generate chemical waste, waste water, other industrial waste or greenhouse gases, and we are subject to numerous laws and regulations relating to the use, storage, discharge and disposal of such substances. We have installed anti-pollution equipment for the treatment of chemical waste and waste water at our facilities. We have taken steps to control the amount of greenhouse gases created by our manufacturing operations. However, we cannot provide assurance that environmental claims will not be brought against us or that government regulators will not take steps toward adopting more stringent environment standards.
Any failure on our part to comply with any present or future environmental regulations could result in the assessment of damages or imposition of fines against us, or the suspension/cessation of production or operations. In addition, environmental regulations could require us to acquire costly equipment, incur other significant compliance expenses or limit or restrict production or operations and thus materially and negatively affect our financial condition and results of operations.
Changes in regulations and the regulatory environment in the U.S. and other countries, such as those resulting from the regulation and impact of global warming and CO2 abatement, may affect our businesses and their results in adverse ways by, among other things, substantially increasing manufacturing costs, limiting availability of scarce resources, especially energy, or requiring limitations on production and sale of our products or those of our customers.
We may experience difficulties in enforcing our intellectual property rights and we may be subject to claims of infringement of the intellectual property rights of others
We rely on patent and trade secret laws, copyright, trademark, confidentiality procedures, controls and contractual commitments to protect our intellectual property rights. Despite our efforts, these protections may be limited and we may encounter difficulties in protecting our intellectual property rights or obtaining rights to additional intellectual property necessary to permit us to continue or expand our businesses. We cannot provide assurance that the patents that we hold or may obtain will provide meaningful protection against our competitors. Changes in or enforcement of laws concerning intellectual property, worldwide, may affect our ability to prevent or address the misappropriation of, or the unauthorized use of, our intellectual property. Litigation may be necessary to enforce our intellectual property rights. Litigation is inherently uncertain and
the outcome is often unpredictable. Other companies hold patents on technologies used in our industries and are aggressively seeking to expand, enforce and license their patent portfolios. If we cannot protect our intellectual property rights against unauthorized copying or use, or other misappropriation, we may not remain competitive.
The intellectual property rights of others could inhibit our ability to introduce new products. We periodically receive notices from, or have lawsuits filed against us by third parties claiming infringement, misappropriation or other misuse of their intellectual property rights and/or breach of our agreements with them. These third parties often include entities that do not have the capabilities to design, manufacture, or distribute products or that acquire intellectual property like patents for the sole purpose of monetizing their acquired intellectual property through asserting claims of infringement and misuse. Such claims of infringement or misappropriation may result in loss of revenue, substantial costs, or lead to monetary damages or injunctive relief against us. We cannot provide assurance as to the outcome of any such claims.
Current or future litigation may harm our financial condition or results of operations
As described in Legal Proceedings in this Form 10-K, we are engaged in litigation and regulatory matters. Litigation and regulatory proceedings may be uncertain, and adverse rulings could occur, resulting in significant liabilities, penalties or damages. Such current or future substantial legal liabilities or regulatory actions could have a material adverse effect on our business, financial condition, cash flows and reputation.
We may not capture significant revenues from our current research and development efforts for several years, if at all
Developing our products through research and development is expensive and the investment often involves a long return on investment cycle. We have made and expect to continue to make significant investments in research and development and related product opportunities. Accelerated product introductions and short product life cycles require high levels of expenditures for research and development that could adversely affect our operating results if not offset by increases in our gross margin. We believe that we must continue to dedicate a significant amount of resources to our research and development efforts to maintain our competitive position.
Business disruptions could affect our operating results
A significant portion of our manufacturing, research and development activities and certain other critical business operations are concentrated in a few geographic areas. A major earthquake, fire or other catastrophic event that results in the destruction or disruption of any of our critical facilities could severely affect our ability to conduct normal business operations and, as a result, our future financial results could be materially and adversely affected.
Additionally, a significant amount of the specialized manufacturing capacity for our Display Technologies segment is concentrated in three overseas countries and it is reasonably possible that the operations of one or more such facilities could be disrupted. Due to the specialized nature of the assets and the customers’ locations, it may not be possible to find replacement capacity quickly or substitute production from facilities in other countries. Accordingly, loss of these facilities could produce a near-term severe impact on our Display business and the Company as a whole.
We face risks through equity affiliates that we do not control
Corning’s net income includes equity earnings from affiliated companies. For the year ended December 31, 2013, we recognized $547 million of equity earnings, of which approximately 94% came from our two largest investments: Dow Corning (which makes silicone and high purity polycrystalline products) and Samsung Corning Precision Materials (which primarily makes LCD glass). In January 2014, Corning completed a series of transactions which resulted in the Company obtaining 100% ownership of Samsung Corning Precision Materials, which will result in control of the entity beginning in the first quarter of 2014.

CORNING INCORPORATED - 2013 Annual Report 11
Risk Factors
Our equity investments may not continue to perform at the same levels as in recent years. Dow Corning emerged from Chapter 11 bankruptcy in 2004 and has certain obligations under its Plan of Reorganization to resolve and fund claims of its creditors and personal injury claimants. Dow Corning may incur further bankruptcy charges in the future, which may adversely affect its operations or assets. Dow Corning also could be adversely impacted by a continuation of significant price declines at their consolidated subsidiary, Hemlock Semiconductor Group. In addition, we rely on the internal controls and financial reporting controls of these entities and their failure to maintain effectiveness or comply with applicable standards may adversely affect us.
We may not have adequate insurance coverage for claims against us
We face the risk of loss resulting from product liability, asbestos, securities, fiduciary liability, intellectual property, antitrust, contractual, warranty, environmental, fraud and other lawsuits, whether or not such claims are valid. In addition, our product liability, fiduciary, directors and officers, property policies including business interruption, natural catastrophe and comprehensive general liability insurance may not be adequate to cover such claims or may not be available to the extent we expect in the future. A successful claim that exceeds or is not covered by our policies could require us to make substantial unplanned payments. Some of the carriers in our historical primary and excess insurance programs are in liquidation and may not be able to respond if we should have claims reaching their policies. The financial health of other insurers may deteriorate. Several of our insurance carriers are litigating with us the extent, if any, of their obligation to provide insurance coverage for asbestos liabilities asserted against us. The results of that litigation may adversely affect our insurance coverage for those risks. In addition, we may not be able to obtain adequate insurance coverage for certain types of risk such as political risks, terrorism or war.
Our global operations are subject to extensive trade and anti-corruption laws and regulations
Due to the international scope of our operations, we are subject to a complex system of import- and export-related laws and regulations, including U.S. regulations issued by Customs and Border Protection, the Bureau of Industry and Security, the Office of Antiboycott Compliance, the Directorate of Defense Trade Controls and the Office of Foreign Assets Control, as well as the counterparts of these agencies in other countries. Any alleged or actual violations may subject us to government scrutiny, investigation and civil and criminal penalties, and may limit our ability to import or export our products or to provide services outside the United States. We cannot predict the nature, scope or effect of future regulatory requirements to which our operations might be subject or the manner in which existing laws might be administered or interpreted.
In addition, the U.S. Foreign Corrupt Practices Act and similar foreign anti-corruption laws generally prohibit companies and their intermediaries from making improper payments or providing anything of value to improperly influence foreign government officials for the purpose of obtaining or retaining business, or obtaining an unfair advantage. Recent years have seen a substantial increase in the global enforcement of anti-corruption laws. Our continued operation and expansion outside the United States, including in developing countries, could increase the risk of such violations. Violations of these laws may result in severe criminal or civil sanctions, could disrupt our business, and result in an adverse effect on our reputation, business and results of operations or financial condition.
Moreover, several of our equity affiliates and related partners are domiciled in areas of the world with laws, rules and business practices that differ from those in the United States. Although we strive to select equity partners and affiliates who share our values and understand our reporting requirements as a U.S.-domiciled company and to ensure that an appropriate business culture exists within these ventures to minimize
and mitigate our risk, we nonetheless face the reputational and legal risk that our equity partners and affiliates may violate applicable laws, rules and business practices.
Acquisitions, joint ventures and strategic alliances may have an adverse effect on our business
We expect to continue making acquisitions and entering into joint ventures and strategic alliances as part of our business strategy. These transactions involve significant challenges and risks including that the transaction does not advance our business strategy, that we do not realize a satisfactory return on our investment, or that we experience difficulty integrating new employees, business systems, and technology, or diversion of management’s attention from our other businesses. It may take longer than expected to realize the full benefits, such as increased revenue and cash flow, enhanced efficiencies, or market share, or those benefits may ultimately be smaller than anticipated, or may not be realized. These events could harm our operating results or financial condition.
Improper disclosure of personal data could result in liability and harm our reputation
We store and process personally-identifiable information of our employees and, in some case, our customers. At the same time, the continued occurrence of high-profile data breaches provides evidence of the increasingly hostile information security environment. This environment demands that we continuously improve our design and coordination of security controls across our business groups and geographies. Despite these efforts, it is possible our security controls over personal data, our training of employees and vendors on data security, and other practices we follow may not prevent the improper disclosure of personally identifiable information. Improper disclosure of this information could harm our reputation or subject us to liability under laws that protect personal data, resulting in increased costs or loss of revenue.
Significant macroeconomic events, changes in regulations, or a crisis in the financial markets could limit our access to capital
We utilize credit in both the capital markets and from banks to facilitate company borrowings, hedging transactions, leases and other financial transactions. We maintain a $1 billion revolving credit agreement to fund potential liquidity needs and to backstop certain transactions. An adverse macroeconomic event or changes in bank regulations could limit our ability to gain access to credit or to renew the revolving credit agreement upon expiration. Additionally, a financial markets crisis may limit our ability to access liquidity.
Adverse economic conditions may adversely affect our cash investments
We maintain an investment portfolio of various types of securities with varying maturities and credit quality. These investments are subject to general credit, liquidity, market, and interest rate risks, which may be exacerbated by unusual events that have affected global financial markets. We also make significant investments in U.S. government securities, either directly, or through investment in money market funds. If global credit and equity markets experience prolonged periods of decline, or if the U.S. defaults on its debt obligations or its debt is downgraded, our investment portfolio may be adversely impacted and we could determine that more of our investments have experienced an other-than-temporary decline in fair value, requiring impairment charges that could adversely impact our financial results.
Information technology dependency and security vulnerabilities could lead to reduced revenue, liability claims, or competitive harm
The Company is increasingly dependent on sophisticated information technology and infrastructure. Any significant breakdown, intrusion, interruption or corruption of these systems or data breaches could have a material adverse effect on our business.

CORNING INCORPORATED - 2013 Annual Report12
Legal Proceedings
We use electronic information technology (IT) in our manufacturing processes and operations and other aspects of our business. Despite our implementation of security measures, our IT systems are vulnerable to disruptions from computer viruses, natural disasters, unauthorized access, cyber attack and other similar disruptions. A material breach in the security of our IT systems could include the theft of our intellectual property or trade secrets. Such disruptions or security breaches could result in the theft, unauthorized use or publication of our intellectual property and/or confidential business information, harm our competitive position, reduce the value of our investment in research and development and other strategic initiatives, or otherwise adversely affect our business. Like other global companies, we have, from time to time, experienced incidents related to our IT systems, and expect that such incidents will continue, including malware and computer virus attacks, unauthorized access, systems failures and disruptions. We have measures and defenses in place against unauthorized access, but we may not be able to prevent, immediately detect, or remediate such events.
Additionally, utilities and other operators of critical energy infrastructure that serve our facilities face heightened security risks, including cyber attacks. In the event of such an attack, disruption in service from our utility providers could disrupt our manufacturing operations which rely on a continuous source of power (electrical, gas, etc.).
International trade policies may impact demand for our products and our competitive position
Government policies on international trade and investment such as import quotas, capital controls or tariffs, whether adopted by individual governments or addressed by regional trade blocs, can affect the demand for our products and services, impact the competitive position of our products or prevent us (including our equity affiliates/joint ventures) from being able to sell products in certain countries. The implementation of more restrictive trade policies, such as higher tariffs or new barriers to entry, in countries in which we sell large quantities of products and services could negatively impact our business, results of operations and financial condition. For example, a government’s adoption of “buy national” policies or retaliation by another government against such policies could have a negative impact on our results of operations. These policies also affect our equity companies.
Legal ProceedingsDow Corning Corporation. Corning and The Dow Chemical Company (“Dow”) each own 50% of the common stock of Dow Corning Corporation (“Dow Corning”).
Dow Corning Breast Implant LitigationIn May 1995, Dow Corning filed for bankruptcy protection to address pending and claimed liabilities arising from many thousands of breast implant product lawsuits. On June 1, 2004, Dow Corning emerged from Chapter 11 with a Plan of Reorganization (the “Plan”) which provided for the settlement or other resolution of implant claims. The Plan also includes releases for Corning and Dow as shareholders in exchange for contributions to the Plan.
Under the terms of the Plan, Dow Corning has established and is funding a Settlement Trust and a Litigation Facility to provide a means for tort claimants to settle or litigate their claims. Inclusive of insurance, Dow Corning has paid approximately $1.8 billion to the Settlement Trust. As of December 31, 2013, Dow Corning had recorded a reserve for breast implant litigation of $1.6 billion.
Other Dow Corning Claims Arising From Bankruptcy ProceedingsAs a separate matter arising from the bankruptcy proceedings, Dow Corning is defending claims asserted by a number of commercial creditors who claim additional interest at default rates and enforcement costs, during the period from May 1995 through June 2004. As of December 31, 2013, Dow Corning has estimated the liability to commercial creditors to be within the range of $94 million to $309 million. As Dow Corning management believes no single amount within the range appears to be a better estimate than any other amount within the range, Dow Corning has recorded the minimum liability within the range. Should Dow Corning not prevail in this matter, Corning’s equity earnings would be reduced by its 50% share of the amount in excess of $94 million, net of applicable tax benefits. There are a number of other claims in the bankruptcy proceedings against Dow
Corning awaiting resolution by the U.S. District Court, and it is reasonably possible that Dow Corning may record bankruptcy-related charges in the future. The remaining tort claims against Dow Corning are expected to be channeled by the Plan into facilities established by the Plan or otherwise defended by the Litigation Facility.
Dow Corning Chinese Anti-Dumping CaseOn July 20, 2012, the Chinese Ministry of Commerce (“MOFCOM”) initiated anti-dumping and countervailing duty investigations of imports of solar-grade polycrystalline silicon products from the U.S. and Korea, based on a petition filed by Chinese solar-grade polycrystalline silicon producers. The petition alleged that producers within these countries, including a consolidated subsidiary of Dow Corning, exported solar-grade polycrystalline silicon to China at less than normal value, and that production of solar-grade polycrystalline silicon in the U.S. has been subsidized by the U.S. government. On July 18, 2013, MOFCOM announced its preliminary determination that China’s solar-grade polycrystalline silicon industry suffered material damage because of dumping by producers in the U.S. and Korea. The Chinese authorities imposed provisional antidumping duties on producers in the U.S. and Korea ranging from 2.4% to 57.0%, including duties of 53.3% on future imports of solar-grade polycrystalline silicon product from the Dow Corning subsidiary into China. On September 16, 2013, the Chinese authorities imposed provisional countervailing duties of 6.5%. On January 20, 2014, MOFCOM issued a final determination. The final determination resulted in no change to the antidumping duties; however, the countervailing duties were reduced to 2.1%. The requirement for customers to pay provisional duties on imports from solar-grade polycrystalline silicon producers became effective on July 24, 2013 for the antidumping duties and on September 20, 2013 for the countervailing duties, adjusted for the final determination. Dow Corning will not be subject to duties for previous sales, and is evaluating possible actions in response to the final determination.

CORNING INCORPORATED - 2013 Annual Report 13
Legal Proceedings
Pittsburgh Corning Corporation and Asbestos Litigation. Corning and PPG Industries, Inc. (PPG) each own 50% of the capital stock of Pittsburgh Corning Corporation (PCC). Over a period of more than two decades, PCC and several other defendants have been named in numerous lawsuits involving claims alleging personal injury from exposure to asbestos. On April 16, 2000, PCC filed for Chapter 11 reorganization in the U.S. Bankruptcy Court for the Western District of Pennsylvania. At the time PCC filed for bankruptcy protection, there were approximately 11,800 claims pending against Corning in state court lawsuits alleging various theories of liability based on exposure to PCC’s asbestos products and typically requesting monetary damages in excess of one million dollars per claim. Corning has defended those claims on the basis of the separate corporate status of PCC and the absence of any facts supporting claims of direct liability arising from PCC’s asbestos products.
PCC Plan of Reorganization
Corning, with other relevant parties, has been involved in ongoing efforts to develop a Plan of Reorganization that would resolve the concerns and objections of the relevant courts and parties. On November 12, 2013, the Bankruptcy Court issued a decision finally confirming an Amended PCC Plan of Reorganization (the “Amended PCC Plan” or the “Plan”).
Under this Plan, Corning is required to contribute its equity interests in PCC and Pittsburgh Corning Europe N.V. (PCE), a Belgian corporation, and to contribute $290 million in a fixed series of payments, recorded at present value. Corning has the option to use its shares rather than cash to make these payments, but the liability is fixed by dollar value and not the number of shares. The Plan requires Corning to make: (1) one payment of $70 million one year from the date the Plan becomes effective and certain conditions are met; and (2) five additional payments of $35 million, $50 million, $35 million, $50 million, and $50 million, respectively, on each of the five subsequent anniversaries of the first payment, the final payment of which is subject to reduction based on the application of credits under certain circumstances.
The Bankruptcy Court’s confirmation of the Plan must be affirmed by the District Court, and two objectors to the Plan have appealed the Bankruptcy Court’s confirmation of the Plan to the District Court. Assuming the District Court affirms the confirmation, that decision may be appealed. If that occurs, it could take many months for the confirmation of the Plan to be finally affirmed.
Non-PCC Asbestos Litigation In addition to the claims against Corning related to its ownership interest in PCC, Corning is also the defendant in approximately 9,700 other cases (approximately 37,400 claims) alleging injuries from asbestos related to its Corhart business and similar amounts of monetary damages per case. When PCC filed for bankruptcy protection, the Court granted a preliminary injunction to suspend all asbestos cases against PCC, PPG and Corning – including these non-PCC asbestos cases (the “stay”). The stay remains in place as of the date of this filing. Under the Bankruptcy Court’s order confirming the Amended PCC Plan, the stay will remain in place until the Amended PCC Plan is finally affirmed. These non-PCC asbestos cases have been covered by insurance without material impact to Corning to date. As of December 31,2013, Corning had received for these cases approximately $19 million in insurance payments related to those claims. If and when the Bankruptcy Court’s confirmation of the Amended PCC Plan is affirmed, these non-PCC asbestos claims would be allowed to proceed against Corning. Corning has recorded in its estimated asbestos litigation liability an additional $150 million for these and any future non-PCC asbestos cases.
Total Estimated Liability for the Amended PCC Plan and the Non-PCC Asbestos ClaimsThe liability for the Amended PCC Plan and the non-PCC asbestos claims was estimated to be $690 million at December 31, 2013, compared with an estimate of liability of $671 million at December 31, 2012. For the years ended December 31, 2013 and 2012, Corning recorded asbestos litigation expense of $19 million and $14 million, respectively. The entire obligation is classified as a non-current liability as installment payments for the cash portion of the obligation are not planned to commence until more than 12 months after the Amended PCC Plan becomes effective and the PCE portion of the obligation will be fulfilled through the direct contribution of Corning’s investment in PCE (currently recorded as a non-current other equity method investment).
Non-PCC Asbestos Cases Insurance Litigation
Several of Corning’s insurers have commenced litigation in state courts for a declaration of the rights and obligations of the parties under insurance policies, including rights that may be affected by the potential resolutions described above. Corning is vigorously contesting these cases, and management is unable to predict the outcome of the litigation.Environmental Litigation. Corning has been named by the United States Environmental Protection Agency (the “EPA”) under the Superfund Act or by state governments under similar state laws, as a potentially responsible party for 15 active hazardous waste sites. Under the Superfund Act, all parties who may have contributed any waste to a hazardous waste site, identified by the EPA, are jointly and severally liable for the cost of cleanup unless the EPA agrees otherwise. It is Corning’s policy to accrue for its estimated liability related to Superfund sites and other environmental liabilities related to property owned by Corning based on expert analysis and continual monitoring by both internal and external consultants. At December 31, 2013 and 2012, Corning had accrued approximately $15 million (undiscounted) and $21 million (undiscounted), respectively, for the estimated liability for environmental cleanup and related litigation. Based upon the information developed to date, management believes that the accrued reserve is a reasonable estimate of the Company’s liability and that the risk of an additional loss in an amount materially higher than that accrued is remote.Chinese Anti-dumping Investigation Involving Single-Mode Optical Fiber Produced in India. In August 2013, China’s MOFCOM initiated an anti-dumping proceeding involving single-mode optical fiber produced in India and exported to China. Corning recently constructed an optical fiber draw facility in India which commenced operations in November 2012 and only reached full-scale production capability in June 2013. The period of investigation is April 1, 2012 through March 31, 2013, a period during which Corning’s export volumes to China from India were small. Although an anti-dumping action is a trade action between the two countries involved, dumping margins – if assessed – are assessed individually against producers based on information provided in detailed questionnaires and verification audits. Corning has responded to the petition and completed the questionnaires. While we do not believe our sales into China from India violated applicable trade laws, the anti-dumping laws provide great discretion to the investigating authorities, particularly where a start-up operation is involved. A final determination is expected in the period August 2014 - February 2015. A negative determination would result in the imposition of an anti-dumping margin on single-mode optical fiber exported from India to China for a period of at least 5 years.

CORNING INCORPORATED - 2013 Annual Report14
Legal Proceedings
Seoul Guarantee Insurance Co. and other creditors against Samsung Group and affiliates. Prior to their merger, Samsung Corning Precision Materials Co., Ltd. (Samsung Corning Precision Materials) and Samsung Corning Co. Ltd. (Samsung Corning) were two of approximately thirty co-defendants in a lawsuit filed by Seoul Guarantee Insurance Co. and thirteen other creditors (SGI and Creditors) for alleged breach of an agreement that approximately twenty-eight affiliates of the Samsung group (Samsung Affiliates) entered into with SGI and Creditors on August 24, 1999 (the Agreement). The lawsuit is pending in the courts of South Korea. Under the Agreement, it is alleged that the Samsung Affiliates agreed to sell certain shares of Samsung Life Insurance Co., Ltd. (SLI), which had been transferred to SGI and Creditors in connection with the petition for court receivership of Samsung Motors Inc. In the lawsuit, SGI and Creditors allege a breach of the Agreement by the Samsung Affiliates and are seeking the loss of principal (approximately $1.95 billion) for loans extended to Samsung Motors Inc., default interest and a separate amount for breach. On January 31, 2008, the Seoul District Court ordered the Samsung Affiliates: to pay approximately $1.3 billion by disposing of 2,334,045 shares of SLI less 1,165,955 shares of SLI previously sold by SGI and Creditors and paying the proceeds to SGI and Creditors; to satisfy any shortfall by participating in the purchase of equity or subordinate debentures issued by them; and pay default interest of 6% per annum. The ruling was appealed. On November 10, 2009, the Appellate Court directed the parties to attempt to resolve this matter through mediation. On January 11, 2011, the Appellate Court ordered the Samsung Affiliates to pay 600 billion won in principal and 20 billion won in delayed interest to SGI and Creditors. Samsung promptly paid those amounts, which approximated $550 million when translated to United States dollars, from a portion of an escrow account established upon completion of SLI’s initial public offering (IPO) on May 7, 2010. On February 7, 2011, the Samsung Affiliates appealed the Appellate Court’s ruling to the Supreme Court of Korea and the appeal is currently in progress. Samsung Corning Precision Materials has not contributed to any payment related to these disputes, and has concluded that no provision for loss should be reflected in its financial statements. Other than as described above, no claim in these matters has been asserted against Corning or any of its affiliates.Demodulation, Inc. Trade Secret Litigation. On January 18, 2011, Demodulation, Inc. (Demodulation) filed suit in the U.S. District Court for the District of New Jersey against Applied DNA Sciences, Inc., Corning Incorporated, Alfred University, Alfred Technology Resources, Inc., and John and Jane Does 1-10. Demodulation filed an amended complaint on August 3, 2011, alleging a conspiracy by the defendants to steal Demodulation’s alleged trade secrets and other intellectual property related to glass covered amorphous metal
microwires and seeks damages under various theories, including breach of contract, defamation, conspiracy, antitrust, unfair competition, interference with prospective business relations and misappropriation of trade secrets. Corning moved to dismiss the amended complaint which was granted in part for certain claims, but denied as to other claims, e.g. breach of contract, unfair competition, misappropriation of trade secrets, and tortious interference with business relations. Plaintiff was granted leave to file a second amended complaint. Corning does not believe Demodulation’s allegations against Corning have merit and intends to defend the case vigorously. Recognizing that the outcome of litigation is uncertain, management believes that the likelihood of a materially adverse impact to Corning’s financial statements is remote.Trade Secret Misappropriation Suits Concerning LCD Glass Technology. On July 18, 2011, in China, Corning Incorporated filed suit in the Beijing Second Intermediate People’s Court against Hebei Dongxu Investment Group Co., Ltd., which changed its name to Dongxu Group Co., Ltd. (Dongxu) for misappropriation of certain trade secrets related to the fusion draw process for manufacturing glass substrates used in active matrix liquid crystal displays (LCDs). On July 18, 2011, in Korea, Corning Incorporated and Samsung Corning Precision Materials filed suits in the Daejeon District Court against Dongxu, one of its officers, and two other named individuals, for related trade secret misappropriation. On November 15, 2013, these cases were settled with Dongxu taking a license to the misappropriated technology for a royalty, broken up into two payments. Dongxu made the first payment in December 2013, and will make the second payment in 2014. Department of Justice Grand Jury Subpoena. In March 2012, Corning received a grand jury subpoena issued in the United States District Court for the Eastern District of Michigan from the U.S. Department of Justice in connection with an investigation into conduct relating to possible antitrust law violations involving certain automotive products, including catalytic converters, diesel particulate filters, substrates and monoliths. The subpoena required Corning to produce to the Department of Justice certain documents from the period January 1999 to March 2012. In November 2012, Corning received another subpoena from the Department of Justice, with the same scope, but extending the time frame for the documents to be produced back to January 1, 1988. Corning’s policy is to comply with all laws and regulations, including all antitrust and competition laws. Antitrust investigations can result in substantial liability for the Company. Currently, Corning cannot estimate the ultimate financial impact, if any, resulting from the investigation. Such potential impact, if an antitrust violation by Corning is found, could however, be material to the results of operations of Corning in a particular period.

CORNING INCORPORATED - 2013 Annual Report 15
Market for Registrant’s Common Equity, Related Stockholder Matters and Issuer Purchases of Equity Securities(a) Corning Incorporated common stock is listed on the New York Stock Exchange. In addition, it is traded on the Boston, Midwest, Pacific and
Philadelphia stock exchanges. Common stock options are traded on the Chicago Board Options Exchange. The ticker symbol for Corning Incorporated is “GLW.”
The following table sets forth the high and low sales price of Corning’s common stock as reported on the Composite Tape.
First quarter Second quarter Third quarter Fourth quarter2013
Price range
High $ 13.35 $ 16.43 $ 15.51 $ 18.07
Low $ 11.75 $ 12.64 $ 13.84 $ 13.82
2012 Price range
High $ 14.62 $ 14.58 $ 13.40 $ 13.96
Low $ 12.52 $ 12.17 $ 10.62 $ 10.71
As of December 31, 2013, there were approximately 18,771 record holders of common stock and approximately 565,877 beneficial shareholders.
Between the third quarter of 2007 and the third quarter of 2011, Corning paid a quarterly cash dividend of $0.05 per share on the Company’s common stock. On October 5, 2011, Corning’s Board of Directors declared a 50% increase in the Company’s quarterly common stock dividend, increasing Corning’s quarterly dividend from $0.05 per share to $0.075 per share of common stock. On October 3, 2012, Corning’s Board of Directors declared a 20% increase in the Company’s quarterly common stock dividend. Corning’s quarterly dividend increased to $0.09 per share of common stock. On April 24, 2013, Corning’s Board of Directors declared an 11% increase in the Company’s quarterly common stock dividend, increasing Corning’s quarterly dividend from $0.09 per share to $0.10 per share of common stock.
Equity Compensation Plan Information
The following table shows the total number of outstanding options and shares available for other future issuances of options under our existing equity compensation plans as of December 31, 2013, including the 2010 Equity Plan for Non-Employee Directors and 2012 Long-Term Incentive Plan:
Plan category
A B C
Number of securities to be issued upon exercise of outstanding options, warrants and rights
Weighted-average exercise price of outstanding options, warrants
and rights
Number of securities remaining available for future
issuance under equity compensation plans (excluding securities reflected
in column A)Equity compensation plans approved by security holders(1)
57,139,000 $ 17.83 78,339,329
Equity compensation plans not approved by security holders 0 0 0
Total 57,139,000 $ 17.83 78,339,329(1) Shares indicated are total grants under the most recent shareholder approved plans as well as any shares remaining outstanding from any prior
shareholder approved plans.

CORNING INCORPORATED - 2013 Annual Report16
Market for Registrant’s Common Equity, Related Stockholder Matters and Issuer Purchases of Equity Securities
Performance Graph
The following graph illustrates the cumulative total shareholder return over the last five years of Corning’s common stock, the S&P 500 and the S&P Communications Equipment Companies (in which Corning is currently included). The graph includes the capital weighted performance results of those companies in the communications equipment company classification that are also included in the S&P 500.
S&P 500Corning incorporated S&P Communications Equipment
COMPARISON OF FIVE-YEAR CUMULATIVE TOTAL RETURN AMONG CORNING INCORPORATED, S&P 500 AND S&P COMMUNICATIONS EQUIPMENT
(Fiscal Years Ended December 31)Indexed to 100
2011201020092008 2012 2013
$0
$50
$100
$150
$200
$250
(b) Not applicable.(c) The following table provides information about our purchases of our common stock during the fiscal fourth quarter of 2013:
ISSUER PURCHASES OF EQUITY SECURITIES
PeriodNumber of shares
purchased(1)Average price paid
per share(1)
Number of shares purchased aspart of publicly announced
plans or programs(2)
Approximate dollar value of shares thatmay yet be purchased under the plans
or programs(2)
October 1-31, 2013 51,310,363 $ 16.79 51,288,807 $ 683,751,648
November 1-30, 2013 242 $ 17.26 $ 683,751,648
December 1-31, 2013 23,811 $ 16.88 $ 683,751,648
Total at December 31, 2013 51,334,416 $ 16.79 51,288,807 $ 683,751,648(1) This column reflects the following transactions during the fiscal fourth quarter of 2013: (i) the deemed surrender to us of 1,655 shares of common
stock to pay the exercise price and to satisfy tax withholding obligations in connection with the exercise of employee stock options, and (ii) the surrender to us of 43,954 shares of common stock to satisfy tax withholding obligations in connection with the vesting of restricted stock issued to employees, and (iii) the purchase of 51,288,807 shares of common stock in conjunction with the repurchase program announced in the second quarter of 2013.
(2) On April 24, 2013, we publicly announced authorization to repurchase up to $2 billion of our common stock by December 31, 2014.

CORNING INCORPORATED - 2013 Annual Report 17
Selected Financial Data (Unaudited)(In millions, except per share amounts and number of employees)
Years ended December 31,2013 2012 2011 2010 2009
Results of operations Net sales $ 7,819 $ 8,012 $ 7,890 $ 6,632 $ 5,395
Research, development and engineering expenses* $ 710 $ 769 $ 668 $ 599 $ 568
Equity in earnings of affiliated companies $ 547 $ 810 $ 1,471 $ 1,958 $ 1,435
Net income attributable to Corning Incorporated* $ 1,961 $ 1,636 $ 2,817 $ 3,574 $ 1,984
Earnings per common share attributable to Corning Incorporated:
Basic* $ 1.35 $ 1.10 $ 1.80 $ 2.29 $ 1.28
Diluted* $ 1.34 $ 1.09 $ 1.78 $ 2.26 $ 1.27
Cash dividends declared per common share $ 0.39 $ 0.32 $ 0.23 $ 0.20 $ 0.20
Shares used in computing per share amounts: Basic earnings per common share 1,452 1,494 1,562 1,558 1,550
Diluted earnings per common share 1,462 1,506 1,583 1,581 1,568
Financial position Working capital $ 7,145 $ 7,739 $ 6,580 $ 6,873 $ 3,982
Total assets $ 28,478 $ 29,375 $ 27,848 $ 25,833 $ 21,295
Long-term debt $ 3,272 $ 3,382 $ 2,364 $ 2,262 $ 1,930
Total Corning Incorporated shareholders’ equity $ 21,162 $ 21,486 $ 21,078 $ 19,375 $ 15,543
Selected data Capital expenditures $ 1,019 $ 1,801 $ 2,432 $ 1,007 $ 890
Depreciation and amortization $ 1,002 $ 997 $ 957 $ 854 $ 792
Number of employees 30,400 28,700 28,800 26,200 23,500
* Includes impact of defined benefit pension plan methodology change implemented in the first quarter of 2013 and retrospectively applied to prior periods.
Reference should be made to the Notes to the Consolidated Financial Statements and Management’s Discussion and Analysis of Financial Condition and Results of Operations.

CORNING INCORPORATED - 2013 Annual Report18
Management’s Discussion and Analysis of Financial Condition and Results of OperationsOrganization of InformationManagement’s Discussion and Analysis provides a historical and prospective narrative on the Company’s financial condition and results of operations. This discussion includes the following sections:
• Overview • Results of Operations • Reportable Segments • Liquidity and Capital Resources
• Environment • Critical Accounting Estimates • New Accounting Standards
Overview
Although Corning’s net sales remained relatively consistent in 2013 when compared to 2012, net income improved by 20%, driven by the impact of the net gain on our yen-denominated hedging program, an increase in equity earnings from Dow Corning and higher net income in our Optical Communications, Specialty Materials, Life Sciences and Environmental Technologies segments.
Net sales in the year ended December 31, 2013 were $7,819 million, compared to $8,012 million in the year ended December 31, 2012. When compared to 2012, the change in net sales was driven by the following items:
• Higher net sales in the Optical Communications segment in the amount of $196 million, driven by an increase in sales of carrier products in the amount of $163 million, largely due to growth in North America, China and Europe, and the ramp-up of the fiber-to-the-premises initiative in Australia, partially offset by lower optical fiber sales;
• An increase in net sales in the amount of $194 million in the Life Sciences segment due to the impact of the acquisition of the majority of the Discovery Labware business in the fourth quarter of 2012;
• Lower sales in the Display Technologies segment in the amount of $364 million, primarily due to the depreciation of the Japanese yen versus the U.S. dollar and price declines in the mid-teens in percentage terms, offset somewhat by an increase in volume in the mid-twenties;
• A sales decrease of $176 million in the Specialty Materials segment, driven by a 17% decrease in sales of Corning Gorilla Glass; and
• A decline in sales of $45 million in the Environmental Technologies segment, due to reductions in demand for our light duty and heavy duty diesel products.
For the year ended December 31, 2013, we generated net income of $2.0 billion or $1.34 per share compared to net income of $1.6 billion or $1.09 per share for 2012. When compared to last year, the increase in net income was due largely to the following items (all amounts presented after tax):
• Net gain recorded on our purchase collars and average rate forwards related to translated earnings contracts in the amount of $287 million;
• An increase of $99 million in equity earnings from Dow Corning; • A decrease of $45 million in restructuring, impairment and other charges;
• An increase in net income in our Optical Communications, Specialty Materials, Environmental Technologies and Life Sciences segments in the amounts of $53 million, $50 million, $20 million and $43 million, respectively; and
• A tax benefit in the amount of $91 million related to two components of the American Taxpayer Relief Act enacted on January 3, 2013 and made retroactive to 2012, consisting of a $17 million research and development tax credit and the reversal of a $37 million charge taken in 2012 related to U.S. tax on foreign earnings.
Partially offsetting the increase in net income in the year ended December 31, 2013 were the negative impacts of the depreciation of the Japanese yen versus the U.S. dollar, price declines in the mid-teens in the Display Technologies segment and an increase in the effective tax rate, largely driven by higher income in the U.S., tax law changes and the recording of valuation allowances due to changes in the realization of certain foreign and state deferred tax assets.
Corning remains committed to a strategy of growing through global innovation. This strategy has served us well. Our key priorities for 2013 were similar to those in prior years: protect our financial health and invest in the future. During 2013, we made the following progress on these priorities:
Financial HealthOur financial position remained sound and we delivered strong cash flows from operating activities. Significant items in 2013 included the following:
• We ended the year with $5.2 billion of cash, cash equivalents and short-term investments, a decrease from the December 31, 2012 balance of $6.1 billion, but well above our debt balance at December 31, 2013 of $3.3 billion. The decrease in cash was largely driven by the repayment of the Chinese credit facility in the amount of approximately $500 million, the purchase of the minority interests of three shareholders of Samsung Corning Precision Materials in the amount of $506 million, and the $1.5 billion of share repurchases.
• Our debt to capital ratio at December 31, 2013 was 13%, slightly lower than our debt to capital ratio of 14% at December 31, 2012.
• Operating cash flow for the year was $2.8 billion. • Corning’s Board of Directors declared an 11% increase in the Company’s quarterly common stock dividend.

CORNING INCORPORATED - 2013 Annual Report 19
Management’s Discussion and Analysis of Financial Condition and Results of Operations
Investing in our futureWe continue to focus on the future and on what we do best – creating keystone components that enable high-technology systems. We remain committed to investing in research, development and engineering to drive innovation. During 2014, we will maintain our balanced innovation strategy of: growing our existing businesses; developing opportunities adjacent or closely related to our existing technical and manufacturing capabilities; and investing in long-range opportunities in each of our market segments. Our spending levels for research, development, and engineering declined slightly in 2013 when compared to 2012, and were approximately 9% of sales.
We continue to work on new products, including glass substrates for high performance displays and LCD applications, diesel filters and substrates for emission control systems, glass and plastic labware, and the optical fiber, cable and hardware and equipment that enable fiber-to-the-premises, and next generation data centers. In addition, we are focusing on wireless solutions for diverse venue applications, such as distributed antenna systems, fiber to the cell site and fiber to the antenna. We have focused our research, development and engineering spending to support the advancement of new product attributes for our Corning Gorilla Glass suite of products. We will continue to focus on adjacent glass and ceramic opportunities which leverage existing materials or manufacturing processes, including Corning Willow Glass, our ultra-slim flexible glass substrate for use in next-generation consumer electronic technologies.
Capital spending was $1,019 million in 2013, a decrease of $782 million when compared to 2012. In 2011, Corning announced several multi-year investment plans to increase manufacturing capacity in several of our reportable segments. Specifically, the projects focused on an LCD glass
substrate facility in China for our Display Technologies segment and a capacity expansion project for Specialty Materials’ Corning Gorilla Glass in Japan. Although spending for these projects continued into 2013, the majority of the construction costs were incurred in 2012 and 2011, resulting in a significant decrease in capital spending in those segments in 2013. We expect our 2014 capital expenditures to be approximately $1.5 billion. Approximately $600 million will be allocated to our Display Technologies segment.
Corporate Outlook Our recent acquisition of the remaining interest in our equity affiliate Samsung Corning Precision Materials will drive growth in 2014. We also expect sales to grow in our Optical Communications, Life Sciences, Specialty Materials and Environmental Technologies segments, and for our market share to stabilize and price declines to be moderate in our Display Technologies segment. We anticipate a rise in global demand for Corning’s carrier network products, combined with growth of enterprise network products, will increase sales in our Optical Communications segment. We believe the overall LCD glass retail market in 2014 will increase in the mid-to-high single digits, driven by the combination of an increase in retail sales of LCD televisions and the demand for larger television screen sizes. Net income may be negatively impacted by lower equity earnings from our equity affiliate Dow Corning and the impact of movements in foreign exchange rates. We may take advantage of acquisition opportunities that support the long-term strategies of our businesses. We remain confident that our strategy to grow through global innovation, while preserving our financial stability, will enable our continued long-term success.
Results of Operations
Selected highlights from our continuing operations follow (dollars in millions)*:
2013 2012 2011 % change
13 vs. 12 12 vs. 11 Net sales $ 7,819 $ 8,012 $ 7,890 (2) 2
Gross margin $ 3,324 $ 3,319 $ 3,576 0 (7)
(gross margin %) 43% 41% 45%
Selling, general and administrative expense $ 1,126 $ 1,205 $ 1,028 (7) 17
(as a % of net sales) 14% 15% 13%
Research, development and engineering expenses $ 710 $ 769 $ 668 (8) 15
(as a % of net sales) 9% 10% 8%
Restructuring, impairment and other charges $ 67 $ 133 $ 129 (50) 3
(as a % of net sales) 1% 2% 2%
Equity in earnings of affiliated companies $ 547 $ 810 $ 1,471 (32) (45)
(as a % of net sales) 7% 10% 19%
Other income, net $ 667 $ 83 $ 118 704 (30)
(as a % of net sales) 9% 1% 1%
Income before income taxes $ 2,473 $ 1,975 $ 3,231 25 (39)
(as a % of net sales) 32% 25% 41%
Provision for income taxes $ (512) $ (339) $ (414) 51 (18)
(as a % of net sales) (7)% (4)% (5)%
Net income attributable to Corning Incorporated $ 1,961 $ 1,636 $ 2,817 20 (42)
(as a % of net sales) 25% 20% 36% * Includes impact of defined benefit pension plan methodology change implemented in the first quarter of 2013 and retrospectively applied to
prior periods.

CORNING INCORPORATED - 2013 Annual Report20
Management’s Discussion and Analysis of Financial Condition and Results of Operations
Net SalesFor the year ended December 31, 2013, net sales remained relatively consistent when compared to the same period in 2012. Higher sales in the Optical Communications and Life Sciences segments were offset by declines in the Display Technologies, Environmental Technologies and Specialty Materials segments. Optical Communications sales increased by $196 million, driven by an increase in sales of our carrier products in the amount of $163 million, largely due to the ramp-up of the fiber-to-the-premises initiative in Australia, which increased by $28 million, an increase of $23 million in sales of wireless products and higher sales of fiber and cable products in North America, China and Europe, up $52 million, $33 million and $26 million, respectively. Also included in the increase in sales of carrier products is the impact of a small acquisition completed in the second quarter of 2013 and the consolidation of an investment due to a change in control, which added approximately $53 million in 2013. Net sales increased in the Life Sciences segment by $194 million, driven by the impact of the acquisition of the Discovery Labware business in the fourth quarter of 2012. In the Display Technologies segment, volume increases in the mid-twenties in percentage terms were more than offset by price declines in the mid-teens and the impact of the depreciation of the Japanese yen versus the U.S. dollar. In the Environmental Technologies segment, while automotive product sales remained relatively consistent with the prior year, sales of our diesel products declined by 9%. Net sales declined by $176 million in the Specialty Materials segment, driven by a decline in sales of Corning Gorilla Glass of 17%.
Net sales in 2012 increased slightly when compared to the prior year, due to sales growth in the Specialty Materials, Optical Communications and Life Sciences segments, offset almost entirely by a decrease in sales in our Display Technologies segment. Sales in the Specialty Materials segment increased by 25% due to the strong demand for Corning Gorilla Glass that is used as cover glass in portable handheld display devices, tablets and notebook computers. Optical Communications segment sales increased primarily due to sales growth in wireless and fiber-to-the-premises products. The increase in sales in our Life Sciences segment was driven by the acquisition of the Discovery Labware business in the fourth quarter of 2012, and by the small acquisition we completed in the fourth quarter of 2011 which produces high-quality cell culture media. Additionally, net sales were positively impacted by movements in foreign exchange rates.
In 2013, 2012 and 2011, sales into international markets accounted for 74%, 77% and 79%, respectively, of total net sales.
Cost of SalesThe types of expenses included in the cost of sales line item are: raw materials consumption, including direct and indirect materials; salaries, wages and benefits; depreciation and amortization; production utilities; production-related purchasing; warehousing (including receiving and inspection); repairs and maintenance; inter-location inventory transfer costs; production and warehousing facility property insurance; rent for production facilities; and other production overhead.
Gross MarginFor 2013, gross margin dollars and as a percentage of sales increased when compared to 2012, led by an increase of 6% in the Specialty Materials segment, resulting from improvements in manufacturing efficiency and cost reduction programs. The depreciation of the Japanese yen versus the U.S. dollar and price declines in the Display Technologies segment partially offset the increase.
For 2012, gross margin in dollars and as a percentage of sales decreased when compared to 2011, due to the impact of significant price declines in our Display Technologies segment. Partially offsetting this decline was improvement in our Specialty Materials segment, where significantly higher sales, increased manufacturing efficiency, and the absence of large cover glass start-up and tank conversion costs incurred in 2011, led to an 11% increase in gross margin.
Selling, General, and Administrative ExpensesSelling, general, and administrative expenses for 2013 decreased by $79 million when compared to 2012. This decrease was largely driven by cost control measures implemented in our segments and a decline in variable compensation in the amount of $27 million. As a percentage of net sales, these expenses decreased when compared to the same period last year.
Selling, general, and administrative expenses for 2012 increased when compared to 2011, due primarily to an increase in performance-based compensation costs, expenses associated with the acquisition of the BD Discovery Labware business, and the absence of a credit in the amount of $27 million resulting from a reduction in a contingent liability associated with an acquisition recorded in 2011. As a percentage of net sales, selling, general, and administrative expenses in 2012 increased when compared to 2011, due to the increase in spending described above and relatively consistent net sales year over year.
The types of expenses included in the selling, general and administrative expenses line item are: salaries, wages and benefits; travel; sales commissions; professional fees; and depreciation and amortization, utilities, and rent for administrative facilities.
Research, Development and Engineering ExpensesFor the year ended December 31, 2013, research, development, and engineering expenses decreased by $59 million when compared to the same period last year, driven by declines in our Display Technologies and Environmental Technologies segments of $19 million and $11 million, respectively. In addition, the allocation of the gain on the true-up of our 2012 pension plan valuation to research, development and engineering expense partially drove the decline. We continue to focus on new product development in areas such as wireless solutions and fiber to the cell site in our Optical Communications segment, glass substrates for high performance displays in our Display Technologies segment and diesel filters and substrates in the Environmental Technologies segment. As a percentage of net sales, research, development and engineering expenses declined slightly in the year ended December 31, 2013, when compared to the same period in 2012.
Research, development and engineering expenses increased by 15% in 2012 when compared to 2011, and increased 2% as a percentage of net sales. During 2012, Corning’s research, development and engineering focused on new product development, as well as adjacent glass opportunities which leverage existing materials or manufacturing processes. We believe our spending levels are adequate to support our technology and innovation strategies.
Restructuring, Impairment, and Other Charges and CreditsCorning recorded restructuring, impairment, and other charges and credits in 2013, 2012 and 2011, which affect the comparability of our results for the periods presented. Additional information on restructuring and asset impairment is found in Note 2 (Restructuring, Impairment and Other Charges), Note 9 (Property, Net of Accumulated Depreciation) and Note 16 (Fair Value Measurements) to the Consolidated Financial Statements. A description of those charges and credits follows:
2013 ActivityTo better align our 2014 cost position in several of our businesses, Corning implemented a global restructuring plan within several of our segments in the fourth quarter of 2013, consisting of workforce reductions, asset disposals and write-offs, and exit costs. We recorded charges of $67 million, before tax, associated with these actions, with total cash expenditures expected to be approximately $40 million. Annualized savings from these actions are estimated to be approximately $40 million and will be reflected largely in selling, general, and administrative expenses.

CORNING INCORPORATED - 2013 Annual Report 21
Management’s Discussion and Analysis of Financial Condition and Results of Operations
2012 ActivityIn response to uncertain global economic conditions, and the potential for slower growth in many of our businesses in 2013, Corning implemented a corporate-wide restructuring plan in the fourth quarter of 2012. We recorded charges of $89 million, before tax, which included costs for workforce reductions, asset write-offs and exit costs. Total cash expenditures associated with these actions were approximately $49 million, and spending for employee-related costs was completed in 2013. Annualized savings from these actions are estimated to be approximately $71 million and will be reflected largely in selling, general, and administrative expenses.
The Specialty Materials segment recorded an impairment charge in the fourth quarter of 2011 in the amount of $130 million, before tax, related to certain assets used in the production of large cover glass due to sales that were significantly below our expectations. In the fourth quarter of 2012, after reassessing the large cover glass business, Corning concluded that the large cover glass market was developing differently in 2012 than our expectations, demand for larger-sized cover glass was declining, and the market for this type of glass was instead targeting smaller gen size products. Additionally, in the fourth quarter of 2012, our primary customer of large cover glass notified Corning of its decision to exit from this display market. Based on these events, we recorded an additional impairment charge in the fourth quarter of 2012 in the amount of $44 million, before tax. This impairment charge represents a write-down of assets specific to the glass-strengthening process for large size cover glass to their fair market values, and includes machinery and equipment used in the ion exchange process.
2011 ActivityIn the fourth quarter of 2011, the Specialty Materials segment recorded an impairment charge in the amount of $130 million related to certain assets located in Japan used in the ion exchange process for the production of large cover glass. Large cover glass is primarily used as a cover sheet of strengthened glass for frameless (bezel-less) LCD displays. The large cover glass impairment charge represents a write-down of assets specific to the glass-strengthening process for large size cover glass to their relative fair market values as of the date of impairment. This asset group includes machinery and equipment used in the ion exchange process and facilities dedicated to the ion exchange process.
Asbestos LitigationIn 2013, we recorded an increase to our asbestos litigation liability of $19 million compared to an increase of $14 million in 2012 and $24 million in 2011.
Our asbestos litigation liability was estimated to be $690 million at December 31, 2013, compared with an estimate of $671 million at December 31,2012. The entire obligation is classified as a non-current liability as installment payments for the cash portion of the obligation are not planned to commence until more than 12 months after the proposed Amended PCC Plan is ultimately effective, and a portion of the obligation will be fulfilled through the direct contribution of Corning’s investment in PCE (currently recorded as a non-current other equity method investment).
See Legal Proceedings for additional information about this matter.
Equity in Earnings of Affiliated CompaniesThe following provides a summary of equity earnings of affiliated companies (in millions):
Years ended December 31,
2013 2012 2011Samsung Corning Precision Materials $ 320 $ 699 $ 1,031
Dow Corning 196 90 404
All other 31 21 36
Total equity earnings $ 547 $ 810 $ 1,471
Equity earnings of affiliated companies decreased in the year ended December 31, 2013, when compared to the same period last year, driven by significantly lower earnings at Samsung Corning Precision Materials, offset somewhat by higher equity earnings from Dow Corning. The decline in equity earnings of Samsung Corning Precision Materials was driven by the following items:
• The significant depreciation of the Japanese yen versus the U.S. dollar;
• Price declines in the mid-teens in percentage terms; and • Asset write-offs and disposals in the amount of $28 million.
The change in equity earnings from Samsung Corning Precision Materials is also included in the discussion of Core Performance Measures, the performance of the Display Technologies segment and in All Other.
The following table provides a summary of equity earnings from Dow Corning, by component (in millions):
Year ended December 31,
2013 2012 2011Silicones $ 166 $ 122 $ 222
Polysilicon (Hemlock Semiconductor Group) 30 (32) 182
Total Dow Corning $ 196 $ 90 $ 404
Beginning in the latter half of 2011, and continuing into 2012, Dow Corning began experiencing unfavorable industry conditions at its consolidated subsidiary Hemlock, a producer of high purity polycrystalline silicon for the semiconductor and solar industries, driven by over-capacity at all levels of the solar industry supply chain. This over-capacity led to significant declines in polycrystalline spot prices in the fourth quarter of 2011, and prices remained depressed throughout 2012. In 2013, markets stabilized, but prices remain significantly below historical levels.
Due to the conditions and uncertainties during 2012 described above, sales volume declined and production levels of certain operating assets were reduced. As a result, in the fourth quarter of 2012, Dow Corning determined
that a polycrystalline silicon plant expansion previously delayed since the fourth quarter of 2011 would no longer be economically viable and made the decision to abandon this expansion activity. The abandonment resulted in an impairment charge of $57 million, before tax, for Corning’s share of the write down in the value of these construction-in-progress assets. Further, the startup of another polycrystalline silicon plant expansion that was expected to begin production in 2013 was delayed and the assets remain idled. Production will only commence when sales volumes increase to levels necessary to support the plant’s capacity. The timing for startup of this expansion is uncertain and future adverse conditions may cause Dow Corning to re-evaluate the long-term viability of the idled assets.

CORNING INCORPORATED - 2013 Annual Report22
Management’s Discussion and Analysis of Financial Condition and Results of Operations
Additionally, during the fourth quarter of 2012, the negative events and circumstances at Dow Corning indicated that assets of Dow Corning’s polycrystalline silicon business might be impaired. In accordance with accounting guidance for impairment of long-lived assets, Dow Corning compared estimated undiscounted cash flows to the assets’ carrying value and determined that the asset group was recoverable as of December 31, 2012. Upon receiving the preliminary determination notices from the Chinese Ministry of Commerce (“MOFCOM”) in the third quarter of 2013, Dow Corning again evaluated whether the polycrystalline silicon assets might be impaired. The estimate of future undiscounted cash flows continued to indicate the assets were expected to be recovered. However, it is reasonably possible that the estimate of undiscounted cash flows may change in the near term resulting in the need to write down those assets to fair value. Dow Corning’s estimate of cash flows might change as a result of continued pricing deterioration, ongoing oversupply in the market, or other adverse market conditions that result in non-performance by customers under long-term contracts. Corning’s share of the carrying value of this asset group is approximately $1.0 billion.
In July 2012, the MOFCOM initiated antidumping and countervailing duty investigations of imports of solar-grade polycrystalline silicon products from the U.S. and Korea based on a petition filed by Chinese solar-grade polycrystalline silicon producers. The petition alleges that producers within these countries exported solar-grade polycrystalline silicon to China at less than fair value and that production of solar-grade polycrystalline silicon in the U.S. has been subsidized by the U.S. government. On July 18, 2013, MOFCOM announced its preliminary determination that China’s solar-grade polycrystalline silicon industry suffered material damage because of dumping by producers in the U.S. and Korea. The Chinese authorities imposed provisional antidumping duties on producers in the U.S. and Korea ranging from 2.4% to 57.0%, including duties of 53.3% on future imports of solar-grade polycrystalline silicon product from the Dow Corning subsidiary into China. On September 16, 2013, the Chinese authorities imposed provisional countervailing duties of 6.5%. On January 20, 2014 MOFCOM issued a final determination. The final determination resulted in no change to the antidumping duties, and the countervailing duties were reduced to 2.1%. The requirement for customers to pay provisional duties on imports from solar-grade polycrystalline silicon producers became effective on July 24, 2013 for the antidumping duties and on September 20, 2013 for the countervailing duties, adjusted for the final determination. Dow Corning will not be subject to duties for previous sales, and is evaluating possible actions in response to the final determination.
Equity earnings from Dow Corning increased by 118% in the twelve months ended December 31, 2013 when compared to the same period in 2012, due to the following items:
• In the polysilicon segment, the absence of the impairment charge of $57 million recorded in 2012 related to the abandonment of a polycrystalline silicon plant expansion, offset by Corning’s share of restructuring charges at Hemlock in the amount of $11 million and the absence of the gain of $10 million associated with the resolution of a contract dispute; and
• In the silicones segment, a gain of $20 million associated with the termination of a long-term sales agreement, the positive impact of the recognition of a derivative instrument in the amount of $16 million, theabsence of the 2012 restructuring charge of $30 million, coupled with cost reduction resulting from these actions, and lower variable compensation costs. The increase in earnings was partially offset by the negative impact of price declines and weaker demand in Asia and the Americas.
Equity earnings from Dow Corning were negatively impacted by the following items in the twelve months ended December 31, 2012 when compared to the same period in 2011:
• Significant declines in polycrystalline silicon prices and the impairment charge described above in the amount of $57 million associated with the abandonment of a polycrystalline silicon plant expansion;
• Corning’s share of the restructuring actions taken in the silicone products segment associated with workforce reductions and the impairment of assets in the amount of $30 million;
• Higher operating expenses due to an increase in pension expense, severance expense and compensation accruals;
• Price declines for silicone products; and • The unfavorable impact from movements in foreign exchange rates.
The decrease in equity earnings from Dow Corning in 2012 was offset somewhat by the following items:
• A gain in the amount of $10 million associated with the resolution of a contract dispute by Hemlock against one of its customers relating to enforcement of long-term supply agreements;
• An increase in volume for silicone products; and • Lower interest expense.
Other Income, Net“Other income, net” in Corning’s consolidated statements of income includes the following (in millions):
Years ended December 31,
2013 2012 2011 Royalty income from Samsung Corning Precision Materials $ 56 $ 83 $ 219
Foreign currency transaction and hedge gains (losses), net 500 8 (43)
Loss on retirement of debt (26) Foreign government subsidy 55
Other, net 56 18 (58)
Total $ 667 $ 83 $ 118
Royalty income from Samsung Corning Precision Materials decreased in 2013, when compared to 2012, reflecting the decline in their sales volume. In 2012, royalty income was significantly lower when compared to 2011, due to the reduction of the applicable royalty rate by approximately 50% beginning in December 2011.
Included in the line item Foreign currency transaction and hedge gains (losses), net, for the year ended December 31, 2013, is the impact of the purchased collars and average rate forward contracts, which were entered into in 2013 to hedge our exposure to movements in the Japanese yen and its impact on our net earnings. We recorded a net gain relating to the changes in the fair value of these contracts, offset slightly by the premium expense, in the amount of $435 million in the year ended December 31, 2013.

CORNING INCORPORATED - 2013 Annual Report 23
Management’s Discussion and Analysis of Financial Condition and Results of Operations
Income Before Income TaxesThe impact of foreign exchange rate movements on Income Before Income Taxes in the year ended December 31, 2013 was not significant.
Provision for Income TaxesOur provision for income taxes and the related effective income tax rates were as follows (dollars in millions)*:
Years ended December 31,
2013 2012 2011
Provision for income taxes $ 512 $ 339 $ 414
Effective tax rate 20.7% 17.2% 12.8%
* Includes impact of defined benefit pension plan methodology change implemented in the first quarter of 2013 and retrospectively applied to prior periods.
The effective income tax rate for 2013 differed from the U.S. statutory rate of 35% primarily due to the following items:
• Rate differences on income (loss) of consolidated foreign companies; • The impact of equity in earnings of nonconsolidated affiliates reported in the financials, net of tax;
• The benefit of tax incentives in foreign jurisdictions, primarily Taiwan; and • Tax benefit of $54 million for the impact of the American Taxpayer Relieve Act enacted on January 3, 2013 and made retroactive to 2012.
Partially offsetting the benefits above is a $48 million charge attributable to a change in the judgment regarding the realizability of certain foreign and state deferred tax assets.
The effective income tax rate for 2012 differed from the U.S. statutory rate of 35% primarily due to the following items:
• Rate differences on income (loss) of consolidated foreign companies, partially offset by U.S. tax of $37 million on deemed repatriated earnings (Subpart F);
• The impact of equity in earnings of nonconsolidated affiliates reported in the financials net of tax; and
• The benefit of tax incentives in foreign jurisdictions, primarily Taiwan. Corning has valuation allowances on certain shorter-lived deferred tax assets such as those represented by capital loss carry forwards and state tax net operating loss carry forwards, as well as other foreign net operating loss carry forwards and federal and state tax credits, because we cannot conclude that it is more likely than not that we will earn income of the character required to utilize these assets before they expire. The amount of U.S. and foreign deferred tax assets that had valuation allowances at December 31, 2013 and 2012 was $286 million and $210 million, respectively.
Corning continues to indefinitely reinvest substantially all of its foreign earnings, with the exception in 2013 of approximately $12 million of earnings that had very low or no tax cost associated with their repatriation. Our current analysis indicates that we have sufficient U.S. liquidity, including borrowing capacity, to fund foreseeable U.S. cash needs without requiring the repatriation of foreign cash. One time or unusual items that may impact our ability or intent to keep our foreign earnings and cash indefinitely reinvested include significant U.S. acquisitions, stock repurchases, shareholder dividends, changes in tax laws or the development of tax planning ideas that allow us to repatriate earnings at little or no tax cost, and/or a change in our circumstances or economic conditions that negatively impact our ability to borrow or otherwise fund U.S. needs from existing U.S. sources. As of December 31, 2013, taxes have not been provided on approximately $12.4 billion of accumulated foreign unremitted earnings that are expected to remain invested indefinitely. While it remains impracticable to calculate the tax cost of repatriating our total unremitted foreign earnings, such cost could be material to the results of operations of Corning in a particular period.
Our foreign subsidiary in Taiwan operates under various tax holiday arrangements. The nature and extent of such arrangements vary, and the benefits of such arrangements phase out through 2018. The impact of the tax holidays on our effective rate is a reduction in the rate of 1.2, 1.7 and 2.0 percentage points for 2013, 2012 and 2011, respectively.
While we expect the amount of unrecognized tax benefits to change in the next 12 months, we do not expect the change to have a significant impact on the results of operations or our financial position.
Refer to Note 6 (Income Taxes) to the Consolidated Financial Statements for further details regarding income tax matters.
Net Income Attributable to Corning IncorporatedAs a result of the items discussed above, net income and per share data was as follows (in millions, except per share amounts):
Years ended December 31,
2013 2012 2011Net income attributable to Corning Incorporated $ 1,961 $ 1,636 $ 2,817
Basic earnings per common share $ 1.35 $ 1.10 $ 1.80
Diluted earnings per common share $ 1.34 $ 1.09 $ 1.78
Shares used in computing per share amounts Basic earnings per common share 1,452 1,494 1,562
Diluted earnings per common share 1,462 1,506 1,583

CORNING INCORPORATED - 2013 Annual Report24
Management’s Discussion and Analysis of Financial Condition and Results of Operations
Core Performance Measures
In managing the Company and assessing our financial performance, we supplement certain measures provided by our consolidated financial statements with measures adjusted to exclude certain items, to arrive at Core Performance measures. We believe reporting Core Performance measures provides investors greater transparency to the information used by our management team to make financial and operational decisions. Net sales, equity in earnings of affiliated companies, and net income are adjusted to exclude the impacts of changes in the Japanese yen, the impact of the purchased collars, average forward contracts and other yen-related transactions, acquisition-related costs, the results of the polysilicon business of our equity affiliate Dow Corning, discrete tax items, restructuring and restructuring-related charges, certain litigation-related expenses, pension mark-to-market adjustments,
and other items which do not reflect on-going operating results of the Company or our equity affiliates. Management discussion and analysis on our reportable segments has also been adjusted for these items, as appropriate. These measures are not prepared in accordance with U.S. Generally Accepted Accounting Principles (GAAP). We believe investors should consider these non-GAAP measures in evaluating our results as they are more indicative of our core operating performance and how management evaluates our operational results and trends. These measures are not, and should not be viewed as a substitute for U.S. GAAP reporting measures. For a reconciliation of non-GAAP performance measures and a further discussion of the measures, please see “Reconciliation of Non-GAAP Measures” below.
Results of Operations – Core Performance Measures
Selected highlights from our continuing operations follow (dollars in millions):
2013 2012 2011
% change
13 vs. 12 12 vs. 11
Core net sales $ 7,948 $ 7,605 $ 7,441 5 2
Core equity in earnings of affiliated companies $ 595 $ 713 $ 1,089 (17) (35)Core earnings attributable to Corning Incorporated $ 1,797 $ 1,595 $ 2,352 13 (32)
Core Net SalesFor the year ended December 31, 2013, core net sales increased by 5% when compared to the same period in 2012. Higher sales in the Display Technologies, Optical Communications and Life Sciences segments were offset slightly by declines in the Environmental Technologies and Specialty Materials segments. In the Display Technologies segment, volume increases in the mid-twenties in percentage terms more than offset price declines in the mid-teens, which drove an increase in sales of $173 million, or 7%. Optical Communications sales increased by $196 million, driven by an increase in sales of our carrier products in the amount of $163 million, largely due to the ramp-up of the fiber-to-the-premises initiative in Australia, which increased by $28 million, an increase of $23 million in sales of wireless products and higher sales of cable products in North America, China and Europe, up $52 million, $33 million and $26 million, respectively. Net sales increased in the Life Sciences segment by $194 million, driven by the impact of the acquisition of the Discovery Labware business in the fourth quarter of 2012. In the Environmental Technologies segment, while automotive product sales remained relatively consistent with the prior year, sales
of our diesel products declined by 9%. Net sales declined by $176 million in the Specialty Materials segment, due to a 17% decline in Corning Gorilla Glass sales.
Core net sales in 2012 increased slightly when compared to the prior year, due to sales growth in the Specialty Materials, Optical Communications and Life Sciences segments, offset almost entirely by a decrease in sales in our Display Technologies segment due to price declines in the mid-twenties in percentage terms. Sales in the Specialty Materials segment increased by 25% due to a $315 million increase in sales of Corning Gorilla Glass that is used as cover glass in portable handheld display devices, tablets and notebook computers. Optical Communications segment sales increased primarily due to sales growth in wireless and fiber-to-the-premises products. The increase in sales in our Life Sciences segment was driven by the acquisition of the Discovery Labware business in the fourth quarter of 2012, and by the small acquisition we completed in the fourth quarter of 2011 which produces high-quality cell culture media.
Core Equity in Earnings of Affiliated CompaniesThe following provides a summary of equity in earnings of associated companies, excluding the impact of changes in the Japanese yen and the results of Dow Corning’s consolidated subsidiary, Hemlock Semiconductor (dollars in millions):
2012 2011
% change
2013 13 vs. 12 12 vs. 11
Samsung Corning Precision Materials $ 419 $ 549 $ 831 (24) (34)
Dow Corning $ 145 $ 143 $ 222 1 (36)
All other $ 31 $ 21 $ 36 48 (42)
Total equity earnings $ 595 $ 713 $ 1,089 (17) (35)

CORNING INCORPORATED - 2013 Annual Report 25
Management’s Discussion and Analysis of Financial Condition and Results of Operations
Core equity earnings of affiliated companies declined by 17% in the year ended December 31, 2013, when compared to the same period in 2012. Equity earnings from Samsung Corning Precision Materials decreased by $130 million, or 24%, driven primarily by price declines in the mid-teens in percentage terms and higher taxes due to the expiration of tax holidays in the amount of $54 million. Slightly offsetting the decline were manufacturing improvements in the amount of $28 million. Core equity earnings from Dow Corning were relatively consistent in the twelve months ended December 31, 2013, when compared to the same period in 2012, with lower prices and weaker demand for silicone products in Europe and China and higher interest expense offset by a reduction in costs as a result of restructuring actions implemented in the fourth quarter of 2012.
Core equity earnings of affiliated companies declined by 35% in the year ended December 31, 2012, when compared to the same period in 2011. At Samsung Corning Precision Materials, the decrease in core equity earnings reflected substantial price declines in the mid-twenties in percentage terms, relatively consistent volume and share loss at a key customer. At Dow Corning, core equity earnings also declined, driven by significant declines in silicone and polycrystalline silicon prices, higher operating expenses due to an increase in pension expense, severance expense and compensation accruals, and the unfavorable impact from movements in foreign exchange rates, offset slightly by an increase in volume for silicone products and lower interest expense.
Core EarningsWhen compared to the same period last year, core earnings increased in the twelve months ended December 31, 2013 by $202 million, or 13%, driven by the following items:
• Higher core earnings in the Optical Communications, Life Sciences, Environmental Technologies and Display Technologies segments in the amounts of $59 million, $44 million, $11 million and $7 million, respectively; and
• Lower operating expenses in the amount of $49 million, driven by a decrease in variable compensation and cost control measures implemented by our segments.
When compared to the same period in 2011, core earnings decreased in the twelve months ended December 31, 2012 by $757 million, or 32%, driven by the following items:
• Lower core earnings in the Display Technologies segment due to significant price declines at both our wholly-owned business and the segment’s equity affiliates;
• Lower royalty income from our equity affiliate Samsung Corning Precision Materials due to the combination of lower sales and the reduction in the royalty rate which took effect in December 2011; and
• An increase in our effective tax rate due to the following: – Temporary expiration of favorable U.S. tax provisions; – The partial expiration of tax holidays in Taiwan; and – Change in our mix of earnings.
Reconciliation of Non-GAAP MeasuresWe utilize certain financial measures and key performance indicators that are not calculated in accordance with GAAP to assess our financial and operating performance. A non-GAAP financial measure is defined as a numerical measure of a company’s financial performance that (i) excludes amounts, or is subject to adjustments that have the effect of excluding amounts, that are included in the comparable measure calculated and presented in accordance with GAAP in the statement of income or statement of cash flows, or (ii) includes amounts, or is subject to adjustments that have the effect of including amounts, that are excluded from the comparable measure as calculated and presented.
Core net sales, core equity earnings of affiliated companies and core earnings are non-GAAP financial measures utilized by our management to analyze financial performance without the impact of items that are driven by general economic conditions and events that do not reflect the underlying fundamentals and trends in the Company’s operations.
The following tables reconcile our non-GAAP financial measures to their most directly comparable GAAP financial measure.
(dollars in millions)
Year ended December 31, 2013
Net salesEquity
earningsIncome before income taxes
Netincome
Effective tax rate Per share
As reported $ 7,819 $ 547 $ 2,473 $ 1,961 20.7% $ 1.34
Constant-yen(1)129 36 122 96 0.07
Purchased collars and average rate forwards(2)
(435) (287) (0.20)
Other yen-related transactions(2)(99) (69) (0.05)
Hemlock Semiconductor operating results(3)
(31) (31) (30) (0.02)
Hemlock Semiconductor non-operating results(3)
1 1 1
Acquisition-related costs(4)54 40 0.03
Provision for income taxes(5)9 0.01
Asbestos settlement(6)19 13 0.01
Restructuring, impairment and other charges(7)
67 46 0.03
Pension mark-to-market adjustment(8)(30) (17) (0.01)
Gain on change in control of equity investment(9)
(17) (12) (0.01)
Equity in earnings of affiliated companies(10)
42 42 44 0.02
Other 4 2
Core performance measures $ 7,948 $ 595 $ 2,170 $ 1,797 17.2% $ 1.23

CORNING INCORPORATED - 2013 Annual Report26
Management’s Discussion and Analysis of Financial Condition and Results of Operations
(dollars in millions)
Year ended December 31, 2012
Net salesEquity
earningsIncome before income taxes
Netincome
Effectivetax rate Per share
As reported* $ 8,012 $ 810 $ 1,975 $ 1,636 17.2% $ 1.09
Constant-yen(1)(407) (167) (434) (353) (0.23)
Other yen-related transactions(2)(22) (16) (0.01)
Hemlock Semiconductor operating results(3)
(25) (25) (23) (0.02)
Hemlock Semiconductor non-operating results(3)
77 77 72 0.05
Acquisition-related costs(4)24 16 0.01
Provision for income taxes(5)41 0.03
Asbestos settlement(6)14 9 0.01
Restructuring, impairment and other charges(7)
133 91 0.06
Pension mark-to-market adjustment(8)217 140 0.09
Equity in earnings of affiliated companies(10)
18 18 17 0.01
Loss on repurchase of debt(11)26 17 0.01
Accumulated other comprehensive income(12)
(52) (52) (0.03)
Core performance measures* $ 7,605 $ 713 $ 1,951 $ 1,595 18.2% $ 1.06
* Includes impact of defined benefit pension plan methodology change implemented in the first quarter of 2013 and retrospectively applied to prior periods.
(dollars in millions)
Year ended December 31, 2011
Net salesEquity
earningsIncome before income taxes
Netincome
Effectivetax rate Per share
As reported* $ 7,890 $ 1,471 $ 3,231 $ 2,817 12.8% $ 1.78
Constant-yen(1)(449) (200) (526) (428) (0.27)
Other yen-related transactions(2)45 33 0.02
Hemlock Semiconductor operating results(3)
(102) (102) (94) (0.06)
Hemlock Semiconductor non-operating results(3)
(80) (80) (74) (0.05)
Provision for income taxes(5)(13) (0.01)
Asbestos settlement(6)24 14 0.01
Restructuring, impairment, and other charges(7)
130 83 0.05
Pension mark-to-market adjustment(8)64 41 0.03
Contingent liability adjustment(13)(27) (27) (0.02)
Core performance measures* $ 7,441 $ 1,089 $ 2,759 $ 2,352 14.8% $ 1.49
* Includes impact of defined benefit pension plan methodology change implemented in the first quarter of 2013 and retrospectively applied to prior periods.

CORNING INCORPORATED - 2013 Annual Report 27
Management’s Discussion and Analysis of Financial Condition and Results of Operations
Items which we exclude from GAAP measures to arrive at Core Performance measures are as follows:
(1) Constant-yen: Because a significant portion of Corning’s LCD glass business revenues and manufacturing costs are denominated in Japanese yen, management believes it is important to understand the impact on core earnings from translating yen into dollars. Presenting results on a constant-yen basis eliminates the translation impact of the Japanese yen, and allows management to evaluate performance period over period, analyze underlying trends in our businesses, and to establish operational goals and forecasts. We use an internally derived management rate of ¥93, which is closely aligned to our yen portfolio of purchased collars, and have restated all years presented based on this rate in order to effectively remove the impact of changes in the Japanese yen.
(2) Purchased collars, average forward contracts and other yen-related transactions: We have excluded the impact of our purchased collars, average forward contracts, and other yen-related transactions for each period presented. By aligning an internally derived rate with our portfolio of purchased collars and average forward contracts, and excluding other yen-related transactions and the constant-yen adjustments, we have effectively eliminated the impact of changes in the Japanese yen on our results.
(3) Results of Dow Corning’s consolidated subsidiary, Hemlock Semiconductor: We are excluding the results of Dow Corning’s consolidated subsidiary, Hemlock Semiconductor, a producer of polycrystalline silicon, to remove the operating and non-operating items and events which have caused severe unpredictability and instability in earnings over the past eighteen months, and are expected to continue in the future. These events are being primarily driven by the macro-economic environment. Specifically, the negative impact of the determination by MOFCOM, which imposes provisional anti-dumping duties on solar-grade polysilicon imports from the United States, and the impact of asset write-offs, offset by the benefit of large payments required under Hemlock customers’ “take-or-pay” contracts, are events that are unrelated to Dow Corning’s core operations, and that have, or could have, significant impacts to this business.
(4) Acquisition-related costs: These expenses include intangible amortization, inventory valuation adjustments and external acquisition-related deal costs.(5) Provision for income taxes: This represents the removal of discrete adjustments attributable to changes in tax law and changes in judgment
about the realizability of certain deferred tax assets. This item also includes the income tax effects of adjusting from a GAAP tax rate to a core earnings tax rate.
(6) Certain litigation-related charges: These adjustments relate to the Pittsburgh Corning Corporation (PCC) asbestos litigation.(7) Restructuring, impairments, and other charges.(8) Pension mark-to-market adjustment: Mark-to-market pension gains and losses, which arise from changes in actuarial assumptions and the difference
between actual and expected returns on plan assets and discount rates. In accordance with GAAP, Corning recognizes pension actuarial gains and losses outside of the corridor, where the corridor is equal to 10% of the greater of the benefit obligation or the market-related value of plan assets at the beginning of the year, for our defined benefit pension plans annually in the fourth quarter of each year and whenever a plan is remeasured or valuation estimates are finalized. Actuarial gains and losses occur when actual experience differs from the estimates used to allocate the change in value of pension plans to expense throughout the year or when assumptions change, as they may each year. Significant factors that can contribute to the recognition of actuarial gains and losses include changes in discount rates, differences between actual and expected returns on plan assets, and other changes in actuarial assumptions such as life expectancy of plan participants. Management believes that pension actuarial gains and losses are primarily financing activities that are more reflective of changes in current conditions in global financial markets, and are not directly related to the underlying performance of our businesses. For further information on the actuarial assumptions and plan assets referenced above, see Management’s Discussion and Analysis of Financial Condition and Results of Operations, under Critical Accounting Estimates – Employee Retirement Plans, and Note 13, Employee Retirement Plans, of Notes to the Consolidated Financial Statements.
(9) Gain on change in control of equity investment: Adjustment of the gain as a result of certain changes to the shareholder agreement of an equity company occurring in the second quarter of 2013, resulting in Corning having a controlling interest that requires consolidation of this investment.
(10) Equity in earnings of affiliated companies: These adjustments relate to items which do not reflect expected on-going operating results of our affiliated companies, such as restructuring, impairment and other charges and settlements under “take-or-pay” contracts.
(11) Loss on repurchase of debt: In 2012, Corning recorded a loss on the repurchase of $13 million of our 8.875% senior unsecured notes due 2021, $11 million of our 8.875% senior unsecured notes due 2016, and $51 million of our 6.75% senior unsecured notes due 2013.
(12) Accumulated other comprehensive income: In 2012, Corning recorded a translation capital gain on the liquidation of a foreign subsidiary.(13) Contingent liability adjustment: In 2011, Corning recognized a credit resulting from a reduction to a contingent liability associated with an
acquisition recorded in the first quarter of 2011.

CORNING INCORPORATED - 2013 Annual Report28
Management’s Discussion and Analysis of Financial Condition and Results of Operations
Reportable Segments
Our reportable segments are as follows:
• Display Technologies – manufactures glass substrates for flat panel liquid crystal displays.
• Optical Communications – manufactures carrier network and enterprise network components for the telecommunications industry.
• Environmental Technologies – manufactures ceramic substrates and filters for automotive and diesel applications.
• Specialty Materials – manufactures products that provide more than 150 material formulations for glass, glass ceramics and fluoride crystals to meet demand for unique customer needs.
• Life Sciences – manufactures glass and plastic labware, equipment, media and reagents to provide workflow solutions for scientific applications.
All other reportable segments that do not meet the quantitative threshold for separate reporting have been grouped as “All Other”. This group is primarily comprised of development projects and results for new product lines.
We prepared the financial results for our segments on a basis that is consistent with the manner in which we internally disaggregate financial information to assist in making internal operating decisions. We included the earnings of equity affiliates that are closely associated with our reportable segments in the respective segment’s net income. We have allocated certain common expenses among our reportable segments differently than we would for stand-alone financial information. Segment net income may not be consistent with measures used by other companies. The accounting policies of our reportable segments are the same as those applied in the consolidated financial statements.
Display Technologies
As Reported* (dollars in millions) 2013 2012 2011% change
13 vs. 12 12 vs. 11 Net sales $ 2,545 $ 2,909 $ 3,145 (13) (8)
Equity earnings of affiliated companies $ 357 $ 692 $ 1,027 (48) (33)
Net income $ 1,267 $ 1,589 $ 2,346 (20) (32)
Core Performance* (dollars in millions) 2013 2012 2011% change
13 vs. 12 12 vs. 11 Net sales $ 2,674 $ 2,501 $ 2,695 7 (7)
Equity earnings of affiliated companies $ 420 $ 544 $ 825 (23) (34)
Net income $ 1,253 $ 1,246 $ 1,935 1 (36)
* Includes impact of defined benefit pension plan methodology change implemented in the first quarter of 2013 and retrospectively applied to prior periods.
The following table reconciles the non-GAAP financial measures for the Display Technologies segment with our financial statements presented in accordance with GAAP (in millions). See Item 7. Management’s Discussion and Analysis of Financial Condition and Results of Operations, Results of Operations – Core Performance Measures, “Items which we exclude from GAAP measures to arrive at Core Performance measures” for an explanation of the reconciling items.
Year ended December 31, 2013 Year ended December 31, 2012 Year ended December 31, 2011
(in millions) SalesEquity
earningsNet
income SalesEquity
earningsNet
income SalesEquity
earningsNet
income
As reported $ 2,545 $ 357 $ 1,267 $ 2,909 $ 692 $ 1,589 $ 3,145 $ 1,027 $ 2,346
Constant-yen(1)129 35 99 (408) (166) (380) (450) (202) (454)
Purchased collars(2)(90)
Other yen-related transactions(2)
(67) (15) 33
Acquisition-related costs(4)
8
Provision for income taxes(5)
10 7
Restructuring, impairment, and other charges(7)
6 17
Pension mark-to-market(8)
(8) 17 3
Equity in earnings of affiliated companies(10)
28 28 18 18
Core performance $ 2,674 $ 420 $ 1,253 $ 2,501 $ 544 $ 1,246 $ 2,695 $ 825 $ 1,935

CORNING INCORPORATED - 2013 Annual Report 29
Management’s Discussion and Analysis of Financial Condition and Results of Operations
2013 vs. 2012In 2013, our Display Technologies segment regained positive momentum, as demonstrated by the increase in core net sales of 7%, when compared to core net sales in 2012, which declined by 7% when compared to 2011. During 2013, volume improvements in the mid-twenties in percentage terms more than outpaced price declines in the mid-teens. The increase in volume was driven by higher sales of larger-sized LCD televisions, defined as greater than 40 inches, which increased by nearly 100% in 2013, and higher sales in mobile computing products, including tablets and smart phones. Additionally, during the fourth quarter of 2013, we renewed the agreements with key customers that we had announced in the fourth quarter of 2012, which stabilize Corning’s share at each of the customers and maintain a fixed relationship between Corning’s pricing and competitive pricing at that customer.
When compared to 2012, the decrease in core equity earnings from Samsung Corning Precision Materials in 2013 reflected relatively consistent volume and price declines in the mid-teens in percentage terms. Manufacturing improvements in the amount of $28 million were more than offset by higher taxes in the amount of $54 million, driven by the partial expiration of a Korean tax holiday.
When compared to 2012, the increase in core net income in the Display Technologies segment in 2013 reflects an increase in volume in the mid-twenties in percentage terms and the impact of cost reduction programs, partially offset by price declines in the mid-teens in percentage terms and the impact of lower equity earnings.
2012 vs. 2011The decrease in core net sales in 2012, when compared to 2011, reflects price declines in the mid-twenties in percentage terms which occurred in the fourth quarter of 2011 and the first quarter of 2012 for the six month period, driven by customer and competitive pressures associated with share shifts at several major customers in a period of excess glass supply. Sequential price declines became much more moderate in the second and third quarters of 2012, reflecting a better matching of supply and demand for glass, and more stable levels of inventory in the LCD supply chain. In the third and fourth quarter of 2012, Corning entered into new supply agreements with key customers. These agreements were intended to stabilize Corning’s share at each of the customers and maintain a fixed relationship between Corning’s pricing and competitive pricing for such customer. Fourth quarter sequential prices declined in the mid-single digit percentage, slightly higher than the prior two quarters, due to some initial adjustments to line up Corning’s prior pricing with the requirements of these new agreements. Retail demand for larger-sized LCD televisions drove an increase in volume in the low-twenties in percentage terms in our wholly-owned business in 2012, when compared to the prior year, and slightly offset the price declines described above. Movements in foreign exchange rates did not significantly impact net sales of this segment.
The decrease in core equity earnings from our Display Technologies equity affiliates in 2012, when compared to 2011, reflected substantial price declines in the mid-twenties in percentage terms, driven by the circumstances described above, relatively consistent volume and share loss at a key customer.
When compared to 2011, the decrease in core net income in 2012 reflects the impact of price declines described above at both our wholly-owned business and the segment’s equity affiliates and a reduction in royalty income, partially offset by an increase in volume in the low-twenties in percentage terms at our wholly-owned business.
A number of Corning’s patents and know-how are licensed to Samsung Corning Precision Materials, as well as to third parties, which generates royalty income. Royalty income from Samsung Corning Precision Materials decreased significantly in 2012, when compared to 2011, reflecting a decrease in the applicable royalty rate, coupled with a decline in sales volume at Samsung Corning Precision Materials. In December 2011, the applicable royalty rate was reduced for a five-year period by approximately 50% compared to the prior five years. Refer to Note 7 (Investments) to the Consolidated Financial Statements for more information about related party transactions.
Other InformationThe Display Technologies segment has a concentrated customer base comprised of LCD panel and color filter makers primarily located in Japan, China and Taiwan. In 2013, four customers of the Display Technologies segment, which individually accounted for more than 10% of segment net sales, accounted for a combined 94% of total segment sales. In 2012, three customers of the Display Technologies segment, which individually accounted for more than 10% of segment net sales, accounted for a combined 63% of total segment sales. For 2011, four customers of the Display Technologies segment, which individually accounted for more than 10% of segment net sales, accounted for 77% of total segment sales. Our customers face the same global economic dynamics as we do in this market. Our near-term sales and profitability would be impacted if any of these significant customers were unable to continue to purchase our products.
In addition, Samsung Corning Precision Materials’ sales are concentrated across a small number of its customers. In 2013, 2012 and 2011, sales to two LCD panel makers located in Korea accounted for approximately 93% of Samsung Corning Precision Materials sales in each of those three years.
Corning has invested heavily to expand capacity to meet the projected demand for LCD glass substrates. In 2013, 2012 and 2011, capital spending in this segment was approximately $350 million, $850 million and $1.3 billion, respectively. We expect capital spending for 2014 to be approximately $600 million.
Outlook:Corning anticipates another year of growth in the LCD glass market in 2014, with retail demand up mid-to-high single digits in percentage terms, as measured in square feet. We believe that supply chain inventory levels remain healthy and industry glass supply appears aligned with overall demand.
In the first quarter of 2014, Corning anticipates that glass volume in its Display Technologies segment will be down slightly sequentially, in line with normal seasonality. The company expects LCD glass price declines to be higher than previous quarters. The price declines are not related to the SCP acquisition or a result of recent supply contract renewals. The company expects that price declines will return to moderate levels after the first quarter.
The end market demand for LCD televisions, monitors and notebooks is dependent on consumer retail spending, among other things. We are cautious about the potential negative impacts that economic conditions, particularly a global economic recession, excess market capacity and world political tensions could have on consumer demand. While the industry has grown rapidly in recent years, economic volatility along with consumer preferences for panels of differing sizes, prices, or other factors may lead to pauses in market growth. Therefore, it is possible that glass manufacturing capacity may exceed demand from time to time. We may incur further charges in this segment to reduce our workforce and consolidate capacity.

CORNING INCORPORATED - 2013 Annual Report30
Management’s Discussion and Analysis of Financial Condition and Results of Operations
Optical Communications
As Reported* (dollars in millions) 2013 2012 2011% change
13 vs. 12 12 vs. 11 Net sales:
Carrier network $ 1,782 $ 1,619 $ 1,556 10 4
Enterprise network 544 511 516 6 (1)
Total net sales $ 2,326 $ 2,130 $ 2,072 9 3
Net income $ 199 $ 146 $ 194 36 (25)
Core Performance* (dollars in millions) 2013 2012 2011% change
13 vs. 12 12 vs. 11 Net sales:
Carrier network $ 1,782 $ 1,619 $ 1,556 10 4
Enterprise network 544 511 516 6 (1)
Total net sales $ 2,326 $ 2,130 $ 2,072 9 3
Net income $ 196 $ 137 $ 168 43 (18)
* Includes impact of defined benefit pension plan methodology change implemented in the first quarter of 2013 and retrospectively applied to prior periods.
The following table reconciles the non-GAAP financial measures for the Optical Communications segment with our financial statements presented in accordance with GAAP (in millions). See Item 7. Management’s Discussion and Analysis of Financial Condition and Results of Operations, Results of Operations – Core Performance Measures, “Items which we exclude from GAAP measures to arrive at Core Performance measures” for an explanation of the reconciling items.
Year ended December 31, 2013
Year ended December 31, 2012
Year ended December 31, 2011
(in millions) SalesNet
income SalesNet
income SalesNet
incomeAs reported $ 2,326 $ 199 $ 2,130 $ 146 $ 2,072 $ 194
Acquisition-related costs(4)
9 1
Restructuring, impairment, and other charges(7)
8 31
Pension mark-to-market(8)
(9) 11 1
Gain on change in control(9)(11)
Accumulated other comprehensive income(12)
(52)
Contingent liability adjustment(13)
(27)
Core performance $ 2,326 $ 196 $ 2,130 $ 137 $ 2,072 $ 168
2013 vs. 2012In 2013, core net sales of the Optical Communications segment increased when compared to 2012, driven by an increase of $163 million in the carrier network market. Driving the growth in carrier network products are the following items:
• The ramp-up of the fiber-to-the-premises initiative in Australia, which increased sales by $28 million;
• An increase of $23 million in sales of wireless products; • Higher sales of cable products in North America, China and Europe, up $52 million, $33 million and $26 million, respectively;
• The impact of a small acquisition and the consolidation of an investment due to a change in control, which added approximately $53 million in 2013; and
• Offsetting the increase in sales of carrier network products in 2013 was a decline in sales of optical fiber, driven by lower demand for single-mode fiber in China, Europe and North America.
Sales in the enterprise network market increased by $33 million in the
year ended 2013, when compared to 2012, driven by higher sales of data center products in North America.
The increase in core net income in 2013 when compared to 2012 reflects an increase in volume in carrier and enterprise network products, improved manufacturing performance and the implementation of strong spending controls and cost reduction initiatives, offset by lower volume in optical fiber, lower price and a less favorable mix of products sales in 2013. Movements in foreign exchange rates did not significantly impact the results of this segment.
The Optical Communications segment has a concentrated customer base. In the years ended December 31, 2013, 2012 and 2011, one customer, which individually accounted for more than 10% of segment net sales, accounted for 10%, 12% and 12%, respectively, of total segment net sales.

CORNING INCORPORATED - 2013 Annual Report 31
Management’s Discussion and Analysis of Financial Condition and Results of Operations
2012 vs. 2011Core net sales for the segment were up slightly when compared to 2011, due to increased demand for our carrier network products, driven by an increase in optical fiber and cable in China in the amount of $82 million, an increase of $42 million for fiber-to-the-premises products in Australia, and an increase in wireless products of $26 million. This growth was offset somewhat by a decline in sales of $28 million for legacy copper products. The impact of foreign exchange rate movements on net sales of this segment was not significant (approximately 1%).
The decrease in core net income in 2012 reflects the impact of lower sales of premium fiber products, an increase in research and development expenses and an increase in project spending. Somewhat offsetting the decrease in core net income was the partial reversal of a warranty reserve
related to our fiber-to-the-premises and fiber optic cable products in the pre-tax amount of $10 million, recorded in the third quarter of 2012. Movements in foreign exchange rates did not significantly impact core net income of this segment.
Outlook: We anticipate sales growth to be in the mid-teens in percentage terms in the Optical Communications segment in the first quarter of 2014, when compared to the same period last year.
Changes in our customers’ expected deployment plans, or additional reductions in their inventory levels of fiber-to-the-premises products, could also affect sales levels. Should these plans not occur at the pace anticipated, our sales and earnings would be adversely affected.
Environmental Technologies
As Reported* (dollars in millions) 2013 2012 2011% change
13 vs. 12 12 vs. 11Net sales:
Automotive $ 485 $ 486 $ 476 2
Diesel 434 478 522 (9) (8)
Total net sales $ 919 $ 964 $ 998 (5) (3)
Net income $ 132 $ 112 $ 119 18 (6)
Core Performance* (dollars in millions) 2013 2012 2011% change
13 vs. 12 12 vs. 11Net sales:
Automotive $ 485 $ 486 $ 476 2
Diesel 434 478 522 (9) (8)
Total net sales $ 919 $ 964 $ 998 (5) (3)
Net income $ 130 $ 119 $ 121 9 (2)
* Includes impact of defined benefit pension plan methodology change implemented in the first quarter of 2013 and retrospectively applied to prior periods.
The following table reconciles the non-GAAP financial measures for the Environmental Technologies segment with our financial statements presented in accordance with GAAP (in millions). See Item 7. Management’s Discussion and Analysis of Financial Condition and Results of Operations, Results of Operations – Core Performance Measures, “Items which we exclude from GAAP measures to arrive at Core Performance measures” for an explanation of the reconciling items.
Year ended December 31, 2013
Year ended December 31, 2012
Year ended December 31, 2011
(in millions) SalesNet
income SalesNet
income SalesNet
incomeAs reported $ 919 $ 132 $ 964 $ 112 $ 998 $ 119
Restructuring, impairment, and other charges(7)1 2
Pension mark-to-market(8)(3) 5 2
Core performance $ 919 $ 130 $ 964 $ 119 $ 998 $ 121

CORNING INCORPORATED - 2013 Annual Report32
Management’s Discussion and Analysis of Financial Condition and Results of Operations
2013 vs. 2012When compared to 2012, core net sales in the Environmental Technologies segment decreased in 2013, due to lower sales of light duty diesel filters and heavy duty diesel products. Demand for light duty diesel vehicles which use our filters declined due to weak economic conditions in Europe. Heavy duty diesel product sales were lower due to the decline in the production of Class 8 vehicles in North America. Net sales of this segment in 2013 were not materially impacted by movements in foreign exchange rates when compared to 2012.
Although core net sales declined in 2013 when compared to 2012, core net income increased by 9%, driven by significantly improved manufacturing performance for our automotive and heavy duty diesel products, and lower operating expenses. Movements in foreign exchange rates did not significantly impact the results of this segment in the year ended December 31, 2013.
The Environmental Technologies segment sells to a concentrated customer base of catalyzer and emission control systems manufacturers, who then sell to automotive and diesel engine manufacturers. Although our sales are to the emission control systems manufacturers, the use of our substrates and filters is generally required by the specifications of the automotive and diesel vehicle or engine manufacturers. For 2013, 2012, and 2011, net sales to three customers, which individually accounted for more than 10% of segment sales, accounted for 87%, 86% and 85%, respectively, of total segment sales. While we are not aware of any significant customer credit issues with our direct customers, our near-term sales and profitability would be impacted if any individual customers were unable to continue to purchase our products.
2012 vs. 2011Core net sales of this segment decreased in 2012 when compared to 2011, due to a decline in net sales of our diesel products. The impact of movements in foreign exchange rates on net sales of this segment was not significant (approximately 3%). Although sales of light duty diesel products decreased due to a decline in demand for vehicles in Europe requiring light duty diesel filters, sales of our heavy duty diesel products increased 8% in 2012, partially offsetting the decrease in light duty diesel sales. During the latter half of 2012, however, the rate of growth of heavy duty products declined, driven by a slowing of Class 8 truck orders in North America. Sales of our automotive products increased in 2012, when compared to 2011, on continued growth in worldwide automotive production, led by growth in North America.
Core net income in 2012 decreased slightly, driven by a decrease in sales of light duty diesel products, offset somewhat by an increase in heavy duty diesel volume, improved manufacturing performance and a decrease in air freight costs, when compared to the same period last year. Movements in foreign exchange rates did not have a significant impact on the comparability of core net income for the periods presented.
Outlook: We anticipate that sales in the first quarter of 2014 will increase by mid-single digits in percentage terms when compared to the first quarter of 2013, driven by improvements in heavy-duty diesel products in China and Europe.
Specialty Materials
As Reported* (dollars in millions) 2013 2012 2011% change
13 vs. 12 12 vs. 11Net sales $ 1,170 $ 1,346 $ 1,074 (13) 25
Net income (loss) $ 187 $ 137 $ (36) 36 **
Core Performance* (dollars in millions) 2013 2012 2011% change
13 vs. 12 12 vs. 11Net sales $ 1,170 $ 1,346 $ 1,074 (13) 25
Net income $ 196 $ 201 $ 74 (2) 172
* Includes impact of defined benefit pension plan methodology change implemented in the first quarter of 2013 and retrospectively applied to prior periods.
** The percentage change calculation is not meaningful.
The following table reconciles the non-GAAP financial measures for the Specialty Materials segment with our financial statements presented in accordance with GAAP (in millions). See Item 7. Management’s Discussion and Analysis of Financial Condition and Results of Operations, Results of Operations – Core Performance Measures, “Items which we exclude from GAAP measures to arrive at Core Performance measures” for an explanation of the reconciling items.
Year ended December 31, 2013
Year ended December 31, 2012
Year ended December 31, 2011
(in millions) SalesNet
income SalesNet
income SalesNet
income
As reported $ 1,170 $ 187 $ 1,346 $ 137 $ 1,074 $ (36)
Constant-yen(1)(2) 25 26
Acquisition-related costs(4)1
Restructuring, impairment, and other charges(7)12 33 83
Pension mark-to-market(8)(2) 6 1
Core performance $ 1,170 $ 196 $ 1,346 $ 201 $ 1,074 $ 74

CORNING INCORPORATED - 2013 Annual Report 33
Management’s Discussion and Analysis of Financial Condition and Results of Operations
2013 vs. 2012The Specialty Materials segment manufactures products that provide more than 150 material formulations for glass, glass ceramics and fluoride crystals to meet demand for unique customer needs. Consequently, this segment operates in a wide variety of commercial and industrial markets that include display optics and components, semiconductor optics components, aerospace and defense, astronomy, ophthalmic products, telecommunications components and a protective cover glass that is optimized for portable display devices and televisions.
Core net sales for the year ended December 31, 2013 decreased in the Specialty Materials segment when compared to 2012, due to a 17% decline in sales of Corning Gorilla Glass. Although retail demand for products using our Corning Gorilla Glass has increased in 2013, supply chain variability, during which we experienced robust sales of this glass in the latter half of 2012, resulted in a supply chain contraction throughout 2013. Advanced optics products sales increased slightly in the year ended December 31, 2013, driven by the beginning of a business recovery. Movements in foreign exchange rates did not significantly impact core net sales of this reportable segment in the twelve months ended December 31, 2013.
Although core net sales declined by 13% in the year ended December 31, 2013, core net income decreased by only 2%, when compared to 2012, due to strong cost controls, manufacturing cost reduction initiatives and the beginning of the advanced optics products business recovery, which partially offset the lower sales of Corning Gorilla Glass. Core net income for the twelve months ended December 31, 2013 was not significantly impacted from movements in foreign exchange rates when compared to the same period in 2012.
For 2013, three customers of the Specialty Materials segment, which individually accounted for more than 10% of segment sales, accounted for 47% of total segment sales. For 2012, two customers of the Specialty
Materials segment, which individually accounted for more than 10% of segment sales, accounted for 54% of total segment sales. For 2011, two customers of the Specialty Materials segment, which individually accounted for more than 10% of segment sales, accounted for 42% of total segment sales.
2012 vs. 2011Core net sales in 2012 increased in the Specialty Materials segment when compared to the same period in 2011, driven by a significant increase in sales volume of Corning Gorilla Glass. Sales of Corning Gorilla Glass have continued to increase due to a combination of strong retail demand for handheld display devices, tablets and notebook computers, and an increase in usage of our glass on these devices. Moderate price declines for Corning Gorilla Glass and lower sales of our advanced optics products partially offset the increase in net sales. Movements in foreign exchange rates did not significantly impact net sales of this reportable segment in 2012.
When compared to the same period last year, the increase in core net income in 2012 was driven by the increase in sales of Corning Gorilla Glass, combined with increased manufacturing efficiency and the absence of large cover glass start-up and tank conversion costs incurred in 2011. Net income was not significantly impacted from movements in foreign exchange rates when compared to the same period in 2011.
Outlook:In the first quarter of 2014, we expect sales to decline in the mid-single digits in percentage terms, when compared to the same period last year. In 2014, the Company expects its Gorilla Glass volume to increase when compared to 2013, and to be more in line with overall industry consumption of glass for devices.
Life Sciences
As Reported* (dollars in millions) 2013 2012 2011% change
13 vs. 12 12 vs. 11Net sales $ 851 $ 657 $ 595 30 10
Net income $ 71 $ 28 $ 60 154 (53)
Core Performance* (dollars in millions) 2013 2012 2011% change
13 vs. 12 12 vs. 11Net sales $ 851 $ 657 $ 595 30 10
Net income $ 92 $ 48 $ 61 92 (21)
* Includes impact of defined benefit pension plan methodology change implemented in the first quarter of 2013 and retrospectively applied to prior periods.
The following table reconciles the non-GAAP financial measures for the Life Sciences segment with our financial statements presented in accordance with GAAP (in millions). See Item 7. Management’s Discussion and Analysis of Financial Condition and Results of Operations, Results of Operations – Core Performance Measures, “Items which we exclude from GAAP measures to arrive at Core Performance measures” for an explanation of the reconciling items.
Year ended December 31, 2013
Year ended December 31, 2012
Year ended December 31, 2011
(in millions) SalesNet
income SalesNet
income SalesNet
income
As reported $ 851 $ 71 $ 657 $ 28 $ 595 $ 60
Acquisition-related costs(4)21 15
Restructuring, impairment, and other charges(7)3 1
Pension mark-to-market(8)(3) 4 1
Core performance $ 851 $ 92 $ 657 $ 48 $ 595 $ 61

CORNING INCORPORATED - 2013 Annual Report34
Management’s Discussion and Analysis of Financial Condition and Results of Operations
2013 vs. 2012Core net sales for the year ended December 31, 2013 increased when compared to the same period last year, due to the impact of the acquisition of the Discovery Labware business completed in the fourth quarter of 2012, which increased net sales by $192 million. Net sales of the segment’s existing lines remained relatively consistent. Net sales in the year ended December 31, 2013 were not significantly impacted by movements in foreign exchange rates when compared to the same periods last year.
When compared to the same period in 2012, core net income in the year ended December 31, 2013 increased substantially, driven by the impact of the Discovery Labware acquisition in the amount of $38 million. Movements in foreign exchange rates did not significantly impact the results of this segment in the year ended December 31, 2013.
For 2013, 2012 and 2011, two customers in the Life Sciences segment, which individually accounted for more than 10% of total segment net sales, collectively accounted for 44%, 38% and 39% respectively, of total segment sales.
2012 vs. 2011Core net sales in 2012 increased due to the impact of the acquisition of the majority of the Discovery Labware business, which was completed
in the fourth quarter of 2012, and a small acquisition completed in the fourth quarter of 2011, as well as a slight increase in the segment’s existing product lines. The acquisitions support the Company’s strategy to expand Corning’s portfolio of life sciences products and enhance global customer access in this business, and accounted for $65 million of the increase in sales in 2012 when compared to 2011. The negative impact of foreign exchange rate movements partially offset the increase in sales.
The decrease in core net income in 2012 reflects the impact of higher raw materials costs and operating expenses in the amount of $22 million related to the acquisition of a majority of the Discovery Labware business, which more than offset the favorable impact of the increase in net sales. Core net income in 2012 was not significantly impacted by movements in foreign exchange rates when compared to the same period in 2011.
Outlook:Sales in the Life Sciences segment are expected to remain relatively consistent in the first quarter of 2014, when compared to the same period in 2013.
All Other
As Reported* (dollars in millions) 2013 2012 2011% change
13 vs. 12 12 vs. 11Net sales $ 8 $ 6 $ 6 33
Research, development and engineering expenses $ 116 $ 123 $ 97 (6) 27
Equity earnings of affiliated companies $ (24) $ 17 $ 15 ** 13
Net loss $ (163) $ (98) $ (78) 66 26
Core Performance* (dollars in millions) 2013 2012 2011% change
13 vs. 12 12 vs. 11Net sales $ 8 $ 6 $ 6 33
Research, development and engineering expenses $ 116 $ 123 $ 97 (6) 27
Equity earnings of affiliated companies $ 12 $ 17 $ 15 (29) 13
Net loss $ (122) $ (98) $ (78) 24 26
* Includes impact of defined benefit pension plan methodology change implemented in the first quarter of 2013 and retrospectively applied to prior periods.
** The percentage change calculation is not meaningful.
The following table reconciles the non-GAAP financial measures for the All Other segment with our financial statements presented in accordance with GAAP (in millions). See Item 7. Management’s Discussion and Analysis of Financial Condition and Results of Operations, Results of Operations – Core Performance Measures, “Items which we exclude from GAAP measures to arrive at Core Performance measures” for an explanation of the reconciling items.
Year ended December 31, 2013
(in millions) SalesEquity
earningsNet
incomeAs reported $ 8 $ (24) $ (163)
Restructuring, impairment, and other charges(7)36 41
Core performance $ 8 $ 12 $ (122)
All Other includes all other segments that do not meet the quantitative threshold for separate reporting. This group is primarily comprised of development projects that involve the use of various technologies for new products such as advanced flow reactors, thin-film photovoltaics and adjacency businesses in pursuit of thin, strong glass. This segment also includes results for certain corporate investments such as Samsung Corning Precision Materials’ non-LCD glass businesses, Eurokera and
Keraglass equity affiliates, which manufacture smooth cooktop glass/ceramic products, and Corsam Technologies LLC (Corsam), an equity affiliate established between Corning and Samsung Corning Precision Materials to provide glass technology research. Refer to Note 7 (Investments) to the Consolidated Financial Statements for additional information about Samsung Corning Precision Materials and related party transactions.

CORNING INCORPORATED - 2013 Annual Report 35
Management’s Discussion and Analysis of Financial Condition and Results of Operations
2013 vs. 2012The increase in segment net loss in 2013 when compared to 2012 was driven by the write-down of assets to their fair value in the amount of $36 million in Samsung Corning Precision Materials’ non-LCD glass business, the absence of the 2012 gain on the sale of assets in Samsung Corning Precision Materials’ non-LCD glass business, and restructuring costs of $5 million associated with our global restructuring program implemented in the fourth quarter of 2013, partially offset by lower research, development and engineering expenses on development projects. The increase in core net loss in 2013 reflects the absence of the 2012 gain on the sale of
assets in Samsung Corning Precision Materials’ non-LCD glass business and a decline in research, development and engineering expenses for development projects.
2012 vs. 2011The results of this segment for the year ended 2012, when compared to the same period last year, reflect an increase in research, development and engineering expenses for development projects, offset by a gain on the sale of assets in Samsung Corning Precision Materials’ non-LCD glass business.
Liquidity and Capital Resources
Financing and Capital StructureThe following items impacted Corning’s financing and capital structure during 2013 and 2012:
2013 • In the first quarter of 2013, we amended and restated our existing revolving credit facility. The amended facility provides a $1.0 billion unsecured multi-currency line of credit that expires in March 2018. The facility includes a leverage test (debt to capital ratio) financial covenant. At December 31, 2013, our leverage using this measure was 13.4%, and we are in compliance with the financial covenant. The proceeds of this credit facility may be used for general corporate purposes, including support for our commercial paper program.
• In the first quarter of 2013, Corning repaid the aggregate principal amount and accrued interest outstanding on the credit facility entered into in the second quarter of 2011 that allowed Corning to borrow up to Chinese Renminbi (RMB) 4.0 billion. The total amount repaid was approximately $500 million. Upon repayment, this facility was terminated.
• In the second quarter of 2013, the Company established a commercial paper program on a private placement basis, pursuant to which we may issue short-term, unsecured commercial paper notes up to a maximum aggregate principal amount outstanding at any time of $1 billion. Under this program, the Company may issue the notes from time to time and will use the proceeds for general corporate purposes. The maturities of the notes will vary, but may not exceed 390 days from the date of issue. The interest rates will vary based on market conditions and the ratings assigned to the notes by credit rating agencies at the time of issuance. The Company’s $1 billion revolving credit facility is available to support obligations under the commercial paper program, if needed. At December 31, 2013, we did not have any outstanding commercial paper.
• In the fourth quarter of 2013, we issued $250 million of 3.70% senior unsecured notes that mature on November 15, 2023. The net proceeds of approximately $248 million were used for general corporate purposes.
• In the fourth quarter of 2013, we recorded a financing obligation in the approximate amount of $230 million for a new LCD glass substrate facility in China.
2012 • In the first quarter of 2012, we issued $500 million of 4.75% senior unsecured notes that mature on March 15, 2042 and $250 million of 4.70% senior unsecured notes that mature on March 15, 2037. The net proceeds of $742 million were used for general corporate purposes.
• In the fourth quarter of 2012, we completed the following debt-related transactions: – We issued $250 million of 1.45% senior unsecured notes that mature
on November 15, 2017. The net proceeds of $248 million from the offering were used for general corporate purposes.
– We repurchased $13 million of our 8.875% senior unsecured notes due 2021, $11 million of our 8.875% senior unsecured notes due 2016, and $51 million of our 6.75% senior unsecured notes due 2013. Additionally, we redeemed $100 million of our 5.90% senior unsecured notes due 2014 and $74 million of our 6.20% senior unsecured notes due 2016. We recognized a pre-tax loss of $26 million upon the early redemption of these notes.
On April 24, 2013, Corning’s Board of Directors declared an 11% increase in the Company’s quarterly common stock dividend. Corning’s quarterly dividend increased from $0.09 per share to $0.10 per share of common stock. The board also authorized a stock repurchase program for purchasing up to $2 billion of the Company’s common stock. This program is incremental to repurchases totaling $1.5 billion completed in December 2012. The stock repurchase authorization expires on December 31, 2014.
On October 22, 2013, Corning’s Board of Directors authorized, in conjunction with a series of strategic and financial agreements with Samsung Display, an additional $2 billion share repurchase program through December 31,2015, effective upon the closing of the transaction. The transaction closed on January 15, 2014.
Capital SpendingCapital spending was $1,019 million in 2013, a decrease of $782 million when compared to 2012. In 2011, Corning announced several multi-year investment plans to increase manufacturing capacity in several of our reportable segments. Specifically, the projects focused on an LCD glass substrate facility in China for our Display Technologies segment and a capacity expansion project for Specialty Materials’ Corning Gorilla Glass in Japan. Although spending for these projects continued into 2013, the majority of the construction costs were incurred in 2012 and 2011, resulting in a significant decrease in capital spending in those segments in 2013. We expect our 2014 capital expenditures to be approximately $1.5 billion. Approximately $600 million will be allocated to our Display Technologies segment.

CORNING INCORPORATED - 2013 Annual Report36
Management’s Discussion and Analysis of Financial Condition and Results of Operations
Cash FlowsSummary of cash flow data (in millions):
Years ended December 31,2013 2012 2011
Net cash provided by operating activities $ 2,787 $ 3,206 $ 3,189
Net cash used in investing activities $ (1,004) $ (2,628) $ (2,056)
Net cash used in financing activities $ (2,063) $ (115) $ (980)
2013 vs. 2012Net cash provided by operating activities decreased in the year ended December 31, 2013, when compared to the same period last year, largely due to a decrease in dividends received from affiliated companies and the unfavorable impact of changes in working capital, driven by higher incentive compensation payments, an increase in foreign tax payments, and an increase in fiber inventory in the Optical Communications segment.
Net cash used in investing activities declined in 2013, when compared to 2012, due to a decrease in capital spending, lower business acquisition spending and the liquidation of short-term investments, offset by the premium related to our purchased collars.
Net cash used in financing activities increased in 2013 when compared to the same period last year, driven primarily by the absence of the issuance of long-term debt in the first quarter of 2012, higher share repurchases, the retirement of long-term debt in the first quarter of 2013, and higher dividend payments.
2012 vs. 2011Although 2012 net income declined when compared to 2011, operating cash flow remained relatively consistent. The decrease in net income resulted primarily from the non-cash impacts of significantly lower equity earnings and the absence of the positive impact of movements in foreign exchange rates experienced in 2011. The cash impact of higher dividends and a net positive change in working capital also effected operating cash flow.
Net cash used in investing activities increased in 2012 when compared to 2011, due to the acquisition of the majority of the Discovery Labware business from Becton, Dickinson and Company, an investment in an affiliated company, and lower cash received from short-term investment liquidations, offset slightly by a decrease in capital spending.
Net cash used in financing activities decreased in 2012 when compared to 2011, primarily due to the proceeds received from the issuance of long-term debt, coupled with a decline in cash used for stock repurchases in 2012. Somewhat offsetting the decrease in net cash used were the impacts of retiring long-term debt and a decline in proceeds received from the exercise of stock options.
Defined Benefit Pension PlansWe have defined benefit pension plans covering certain domestic and international employees. Our largest single pension plan is Corning’s U.S. qualified plan. At December 31, 2013, this plan accounted for 78% of our consolidated defined benefit pension plans’ projected benefit obligation and 90% of the related plans’ assets.
We have historically contributed to the U.S. qualified pension plan on an annual basis in excess of the IRS minimum requirements. In 2013, we did not contribute to our domestic defined benefit pension plan and contributed $5 million to our international pension plans. In 2012, we made voluntary cash contributions of $75 million to our domestic defined benefit pension plan and $30 million to our international pension plans. Although we will not be subject to any mandatory contributions
in 2014, we anticipate making voluntary cash contributions of up to $85 million to our U.S. pension plan and up to $8 million to our international pension plans in 2014.
In the first quarter of 2013, we elected to change our method of recognizing actuarial gains and losses for our defined benefit pension plans. Previously, we recognized the actuarial gains and losses as a component of Stockholders’ Equity on our consolidated balance sheets on an annual basis. These amounts were amortized into our operating results over the average remaining service period of employees expected to receive benefits under the plan, to the extent such gains and losses were outside of the corridor, where the corridor is equal to 10% of the greater of the benefit obligation or the market-related value of plan assets at the beginning of the year. In addition, we used a calculated market-related value of plan assets for purposes of calculating the expected return on plan assets that spread asset gains and losses over a 3-year period. We have elected to recognize the change in the fair value of plan assets in full for purposes of calculating the expected return on plan assets and net actuarial gains and losses outside of the corridor in pension costs annually in the fourth quarter of each year and whenever the plan is remeasured or valuation estimates are finalized. The remaining components of pension expense are recorded on a quarterly basis. While the historical policy of recognizing pension expense was considered acceptable, we believe that the new policy is preferable as it recognizes the change in the fair value of plan assets in full for purposes of calculating the expected return on plan assets and eliminates the delay in recognition of net actuarial gains and losses outside of the corridor. We have applied these changes retrospectively, adjusting all prior periods, as if the new accounting methodology was in effect during those periods.
Refer to Note 13 (Employee Retirement Plans) to the Consolidated Financial Statements for additional information.
RestructuringTo better align our 2014 cost position in several of our businesses, Corning implemented a global restructuring plan within several of our segments in the fourth quarter of 2013, consisting of workforce reductions, asset disposals and write-offs, and exit costs. We recorded charges of $67 million associated with these actions, with total cash expenditures expected to be approximately $40 million. Annualized savings from these actions are estimated to be approximately $40 million and will be reflected largely in selling, general, and administrative expenses.
In 2012, we recorded a charge of $89 million associated with a corporate-wide restructuring plan to reduce our global workforce in response to anticipated lower sales in 2013. The charge included costs for workforce reductions, asset disposals and write-offs, and exit costs. Total cash expenditures associated with these actions are expected to be approximately $49 million primarily related to termination benefits, and were largely finalized in 2013.
During 2013, 2012 and 2011, we made payments of $35 million, $15 million and $16 million, respectively, related to employee severance and other exit costs resulting from restructuring actions. Refer to Note 2 (Restructuring, Impairment and Other Charges) to the Consolidated Financial Statements for additional information.

CORNING INCORPORATED - 2013 Annual Report 37
Management’s Discussion and Analysis of Financial Condition and Results of Operations
Key Balance Sheet DataBalance sheet and working capital measures are provided in the following table (dollars in millions):
December 31,
2013 2012
Working capital $ 7,145 $ 7,739 Current ratio 5.1:1 5.0:1 Trade accounts receivable, net of allowances $ 1,253 $ 1,302 Days sales outstanding 58 55 Inventories $ 1,270 $ 1,051 Inventory turns 3.6 4.7 Days payable outstanding(1)
47 41 Long-term debt $ 3,272 $ 3,382 Total debt to total capital 13% 14%(1) Includes trade payables only.
Credit RatingsAs of February 13, 2014, our credit ratings were as follows:
Rating Agency Rating long-term debt Outlook last updateFitch A- Stable May 17, 2011
Standard & Poor’s A- Stable December 16, 2013Moody’s A3 Stable September 12, 2011
Management Assessment of LiquidityWe ended the fourth quarter of 2013 with over $5.2 billion of cash, cash equivalents and short-term investments. The Company has adequate sources of liquidity and we are confident in our ability to generate cash to meet existing or reasonably likely future cash requirements. Our cash, cash equivalents, and short-term investments are held in various locations throughout the world and are generally unrestricted. At December 31, 2013, although approximately 69% of the consolidated amount was held outside of the U.S., we have sufficient U.S. liquidity, including borrowing capacity, to fund foreseeable U.S. cash needs without requiring the repatriation of foreign cash. We utilize a variety of tax effective financing strategies to ensure that our worldwide cash is available in the locations in which it is needed.
From time to time, we may issue debt, the proceeds of which may be used for general corporate purposes or to refinance certain debt maturities. Additionally, to manage interest rate exposure, the Company, from time to time, enters into interest rate swap agreements. In May 2013, in anticipation of issuing $750 million of new long-term fixed rate debt, the Company entered into two interest rate swap agreements to hedge against the variability in cash flows due to changes in the benchmark interest rate. The instruments were designated as cash flow hedges. During the fourth quarter, the interest rate swaps expired prior to the issuance of the anticipated debt, the issuance of which had become “not reasonably possible” rather than “probable”. In November 2013, Corning issued a $250 million note with a maturity of 10 years, as opposed to the contemplated issuance of $750 million of new long-term fixed rate debt. As the planned issuance did not occur as anticipated, we recorded a small gain in the fourth quarter of 2013. A portion of this gain is deferred in accumulated other comprehensive (loss) income on the consolidated balance sheet until such time as the hedged item impacts earnings.
On June 24, 2013, the Company established a commercial paper program on a private placement basis, pursuant to which we may issue short-term, unsecured commercial paper notes up to a maximum aggregate principal amount outstanding at any time of $1 billion. Under this program, the Company may issue the notes from time to time and will use the proceeds for general corporate purposes. The maturities of the notes will vary, but may not exceed 390 days from the date of issue. The interest rates will vary based on market conditions and the ratings assigned to the notes by credit rating agencies at the time of issuance. The Company’s $1 billion revolving credit facility is available to support obligations under the commercial paper program, if needed. At December 31, 2013, we did not have any outstanding commercial paper.
On October 31, 2013, as part of the previously authorized share repurchase program announced on April 24, 2013, Corning entered into an accelerated share repurchase (“ASR”) agreement with JP Morgan Chase Bank, National Association, London Branch (“JPMC”). Under the ASR, Corning agreed to purchase $1 billion of its common stock, in total, with an initial delivery by JPMC of 47.1 million shares based on the current market price, and payment of $1 billion made by Corning to JPMC. The payment to JPMC was recorded as a reduction to shareholders’ equity, consisting of an $800 million increase in treasury stock, which reflects the value of the initial 47.1 million shares received upon execution, and a $200 million decrease in other-paid-in capital, which reflects the value of the stock held back by JPMC pending final settlement. On January 28, 2014, the ASR was completed. Corning received an additional 10.5 million shares on January 31,2014 to settle the ASR. In total, Corning purchased 57.6 million shares based on the average daily volume weighted-average price of Corning’s common stock during the term of the ASR, less a discount.

CORNING INCORPORATED - 2013 Annual Report38
Management’s Discussion and Analysis of Financial Condition and Results of Operations
In addition to the ARS, during 2013 we repurchased 35 million shares of common stock on the open market for approximately $500 million as part of the share repurchase program announced on April 24, 2013. During 2012 and 2011, we repurchased 56 million and 55 million shares of common stock on the open market for approximately $720 million and $780 million, respectively, as part of the share repurchase program announced on October 5, 2011.
We complete comprehensive reviews of our significant customers and their creditworthiness by analyzing their financial strength at least annually or more frequently for customers where we have identified a measure of increased risk. We closely monitor payments and developments which may signal possible customer credit issues. We currently have not identified any potential material impact on our liquidity resulting from customer credit issues.
Our major funding sources for 2013 and beyond will be our operating cash flow and our existing balances of cash, cash equivalents, short-term investments, proceeds from our commercial paper program, financing transactions and any issuances of debt. We believe we have sufficient liquidity for the next several years to fund operations, share repurchase programs, acquisitions, the asbestos litigation, research and development, capital expenditures, scheduled debt repayments, and dividend payments.
Corning also has access to a $1.0 billion unsecured committed revolving credit facility, the proceeds of which may be used for general corporate purposes, including support for our commercial paper program. This credit facility includes a leverage ratio financial covenant. The required leverage ratio, which measures debt to total capital, is a maximum of 50%. At December 31, 2013, our leverage using this measure was 13.4%, and we are in compliance with the financial covenant.
In the first quarter of 2013, Corning repaid the aggregate principal amount and accrued interest outstanding on the credit facility entered into in the second quarter of 2011 that allowed Corning to borrow up to Chinese Renminbi (RMB) 4.0 billion. The total amount repaid was approximately $500 million. Upon repayment, this facility was terminated.
Our debt instruments contain customary event of default provisions, which allow the lenders the option of accelerating all obligations upon the occurrence of certain events. In addition, the majority of our debt instruments contain a cross default provision, whereby a default on one debt obligation of the Company in excess of a specified amount, would be considered a default under the terms of another debt instrument. As of December 31, 2013, we were in compliance with all such provisions.
Management is not aware of any known trends, demands, commitments, events or uncertainties that will result in or that are reasonably likely to result in a material increase or decrease in our liquidity. In addition, other than items discussed, there are no known material trends, favorable or unfavorable, in our capital resources and no expected material changes in the mix and relative cost of such resources.
Purchased Collars and Average Rate Forwards In the first quarter of 2013, Corning executed a series of purchased collars that expire quarterly across a two-year period to hedge its translation exposure resulting from movements in the Japanese yen against the U.S. dollar. These derivatives are not designated as accounting hedges and changes in fair value are recorded in other income immediately. The fair value of these derivative contracts are recorded as either assets (gain position) or liabilities (loss position) on the Consolidated Balance Sheet.
In the second quarter of 2013, Corning entered into a series of average rate forwards with no associated premium, which partially hedge the impact of Japanese yen on Corning’s projected 2015 net income. Like the purchased collars, these contracts settle quarterly, and are not designated as accounting hedges.
In the year ended December 31, 2013, we recorded a net gain of $435 million, before tax, related to changes in the fair value of the purchased collars and average rate forward contracts, offset slightly by premium expense. This gain is recorded in earnings in the Other income, net line of the Consolidated Statements of Income.
Off Balance Sheet ArrangementsOff balance sheet arrangements are transactions, agreements, or other contractual arrangements with an unconsolidated entity for which Corning has an obligation to the entity that is not recorded in our consolidated financial statements.
Corning’s off balance sheet arrangements include the following:
• Guarantee contracts; and • Variable interests held in certain unconsolidated entities.
At the time a guarantee is issued, the Company is required to recognize a liability for the fair value or market value of the obligation it assumes. In the normal course of our business, we do not routinely provide significant third-party guarantees. Generally, third-party guarantees provided by Corning are limited to certain financial guarantees, including stand-by letters of credit and performance bonds, and the incurrence of contingent liabilities in the form of purchase price adjustments related to attainment of milestones. These guarantees have various terms, and none of these guarantees are individually significant.
Refer to Note 14 (Commitments, Contingencies, and Guarantees) to the Consolidated Financial Statements for additional information.
For variable interest entities, we assess the terms of our interest in each entity to determine if we are the primary beneficiary. The primary beneficiary of a variable interest entity is the party that absorbs a majority of the entity’s expected losses, receives a majority of its expected residual returns, or both, as a result of holding variable interests, which are the ownership, contractual, or other pecuniary interests in an entity that change with changes in the fair value of the entity’s net assets excluding variable interests.
Corning has identified one entity that qualifies as a variable interest entity. This entity is not considered to be significant to Corning’s consolidated statements of position.
Corning does not have retained interests in assets transferred to an unconsolidated entity that serve as credit, liquidity or market risk support to that entity.

CORNING INCORPORATED - 2013 Annual Report 39
Management’s Discussion and Analysis of Financial Condition and Results of Operations
Contractual ObligationsThe amounts of our obligations follow (in millions):
Total
Amount of commitment and contingency expiration per period
Less than 1 year 1 to 3 years 3 to 5 years5 years and thereafter
Performance bonds and guarantees $ 51 $ 24 $ 5 $ 1 $ 21
Credit facilities for equity companies 25 25
Stand-by letters of credit(1)61 54 3 1 3
Loan guarantees 14 14
Subtotal of commitment expirations per period $ 151 $ 103 $ 8 $ 2 $ 38
Purchase obligations(6) $ 126 $ 67 $ 39 $ 13 $ 7
Capital expenditure obligations(2)185 185
Total debt(3)2,890 14 66 249 2,561
Interest on long-term debt(4)2,602 151 299 286 1,866
Capital leases and financing obligations(3)412 7 15 11 379
Imputed interest on capital leases and financing obligations 295 20 39 38 198
Minimum rental commitments 277 54 80 53 90
Uncertain tax positions(5)3 1 2
Subtotal of contractual obligation payments due by period 6,790 499 540 650 5,101
Total commitments and contingencies $ 6,941 $ 602 $ 548 $ 652 $ 5,139(1) At December 31, 2013, $41 million of the $61 million was included in other accrued liabilities on our consolidated balance sheets.(2) Capital expenditure obligations primarily reflect amounts associated with our capital expansion activities.(3) Total debt above is stated at maturity value, and excludes interest rate swap gains and bond discounts.(4) The estimate of interest payments assumes interest is paid through the date of maturity or expiration of the related debt, based upon stated
rates in the respective debt instruments.(5) At December 31, 2013, $5 million was included on our balance sheet related to uncertain tax positions. Of this amount, we are unable to estimate
when $2 million of that amount will become payable.(6) Purchase obligations are enforceable and legally binding obligations which primarily consist of raw material and energy-related take-or-pay
contracts.
We are required, at the time a guarantee is issued, to recognize a liability for the fair value or market value of the obligation it assumes. In the normal course of our business, we do not routinely provide significant third-party guarantees. Generally, third-party guarantees provided by Corning are limited to certain financial guarantees, including stand-by letters of credit and performance bonds, and the incurrence of contingent liabilities in the form of purchase price adjustments related to attainment of milestones. These guarantees have various terms, and none of these guarantees are individually significant.
In the fourth quarter of 2013, we recorded a financing obligation in the approximate amount of $230 million for a new LCD glass substrate facility in China.
We have agreed to provide up to a $25 million credit facility to Dow Corning. The funding of the Dow Corning credit facility will be required only if Dow Corning is not otherwise able to meet its scheduled funding obligations in its confirmed Bankruptcy Plan.
We believe a significant majority of these guarantees and contingent liabilities will expire without being funded.
Environment
Corning has been named by the Environmental Protection Agency (the Agency) under the Superfund Act, or by state governments under similar state laws, as a potentially responsible party for 15 active hazardous waste sites. Under the Superfund Act, all parties who may have contributed any waste to a hazardous waste site, identified by the Agency, are jointly and severally liable for the cost of cleanup unless the Agency agrees otherwise. It is Corning’s policy to accrue for its estimated liability related to Superfund sites and other environmental liabilities related to property
owned by Corning based on expert analysis and continual monitoring by both internal and external consultants. At December 31, 2013 and 2012, Corning had accrued approximately $15 million (undiscounted) and $21 million (undiscounted), respectively, for its estimated liability for environmental cleanup and related litigation. Based upon the information developed to date, management believes that the accrued reserve is a reasonable estimate of the Company’s liability and that the risk of an additional loss in an amount materially higher than that accrued is remote.

CORNING INCORPORATED - 2013 Annual Report40
Management’s Discussion and Analysis of Financial Condition and Results of Operations
Critical Accounting Estimates
The preparation of financial statements requires us to make estimates and assumptions that affect amounts reported therein. The estimates that required us to make difficult, subjective or complex judgments, including future projections of performance and relevant discount rates, follow.
Impairment of assets held for useWe are required to assess the recoverability of the carrying value of long-lived assets when an indicator of impairment has been identified. We review our long-lived assets in each quarter to assess whether impairment indicators are present. We must exercise judgment in assessing whether an event of impairment has occurred.
Manufacturing equipment includes certain components of production equipment that are constructed of precious metals, primarily platinum and rhodium. These metals are not depreciated because they have very low physical losses and are repeatedly reclaimed and reused in our manufacturing process over a very long useful life. Precious metals are reviewed for impairment as part of our assessment of long-lived assets. This review considers all of the Company’s precious metals that are either in place in the production process; in reclamation, fabrication, or refinement in anticipation of re-use; or awaiting use to support increased capacity. Precious metals are only acquired to support our operations and are not held for trading or other non-manufacturing related purposes.
Examples of events or circumstances that may be indicative of impairments include:
• A significant decrease in the market price of an asset; • A significant change in the extent or manner in which a long-lived asset is being used or in its physical condition;
• A significant adverse change in legal factors or in the business climate that could affect the value of the asset, including an adverse action or assessment by a regulator;
• An accumulation of costs significantly in excess of the amount originally expected for the acquisition or construction of an asset;
• A current-period operating or cash flow loss combined with a history of operating or cash flow losses or a projection or forecast that demonstrates continuing losses associated with the use of an asset; and
• A current expectation that, more likely than not, an asset will be sold or otherwise disposed of significantly before the end of its previously estimated useful life.
For purposes of recognition and measurement of an impairment loss, a long-lived asset or assets is grouped with other assets and liabilities at the lowest level for which identifiable cash flows are largely independent of the cash flows of other assets and liabilities. We must exercise judgment in assessing the lowest level for which identifiable cash flows are largely independent of the cash flows of other assets and liabilities. For the majority of our reportable segments, we concluded that locations or businesses which share production along the supply chain must be combined in order to appropriately identify cash flows that are largely independent of the cash flows of other assets and liabilities.
For long-lived assets, when impairment indicators are present, we compare estimated undiscounted future cash flows, including the eventual disposition of the asset group at market value, to the assets’ carrying value to determine if the asset group is recoverable. This assessment requires the exercise of judgment in assessing the future use of and projected value to be derived from the assets to be held and used. Assessments also consider changes in asset utilization, including the temporary idling of capacity and the expected timing for placing this capacity back into production. If there is an impairment, a loss is recorded to reflect the difference between the assets’ fair value and carrying value. This may require judgment in estimating future cash flows and relevant discount
rates and residual values in estimating the current fair value of the impaired assets to be held and used.
For an asset group that fails the test of recoverability described above, the estimated fair value of long-lived assets is determined using an “income approach”, “market approach”, “cost approach”, or a combination of one or more of these approaches as appropriate for the particular asset group being reviewed. All of these approaches start with the forecast of expected future net cash flows including the eventual disposition at market value of long-lived assets, and also considers the fair market value of all precious metals if appropriate for the asset group being reviewed. Some of the more significant estimates and assumptions in our analysis include: market size and growth, market share, projected selling prices, manufacturing cost and discount rate. Our estimates are based upon our historical experience, our commercial relationships, and available external information about future trends. We believe fair value assessments are most sensitive to market growth and the corresponding impact on volume and selling prices and that these are also more subjective than manufacturing cost and other assumptions. The Company believes its current assumptions and estimates are reasonable and appropriate.
In the event the current net book value of an asset group is found to be greater than the net present value of the cash flows derived from the asset group, we determine the actual fair market value of long-lived assets with the assistance from valuation appraisals conducted by third parties. The results of these valuations generally represent the fair market value of the asset group that will remain after any necessary impairment adjustments have been recorded. The impairment charge will be allocated to assets within the asset group on a relative fair value basis.
At December 31, 2013, the carrying value of precious metals was higher than the fair market value by $164 million. At December 31, 2012, the carrying value of precious metals was higher than the fair value by $28 million. These precious metals are utilized by the Display and Specialty Materials segments. Corning believes these precious metal assets to be recoverable due to the significant positive cash flow in both segments. The potential for impairment exists in the future if negative events significantly decrease the cash flow of these segments. Such events include, but are not limited to, a significant decrease in demand for products or a significant decrease in profitability in our Display Technologies or Specialty Materials segments.
In the fourth quarter of 2011, the Specialty Materials segment recorded an impairment charge in the amount of $130 million related to certain assets used in the production of large cover glass due to sales that were significantly below our expectations. In the fourth quarter of 2012, after reassessing the large cover glass business, Corning concluded that the large cover glass market was developing differently in 2012 than our expectations, and demand for larger-sized cover glass was declining, and the market for this type of glass was instead targeting smaller gen size products. Additionally, in the fourth quarter of 2012, our primary customer of large cover glass notified Corning of its decision to exit from this display market. Based on these events, we recorded an additional impairment charge in the fourth quarter of 2012 in the amount of $44 million, before tax. This impairment charge represents a write-down of assets specific to the glass-strengthening process for large size cover glass to their fair market values, and includes machinery and equipment used in the ion exchange process. Additional information on the asset impairment is found in Note 2 (Restructuring, Impairment and Other Charges), Note 9(Property, Net of Accumulated Depreciation) and Note 16 (Fair Value Measurements) to the Consolidated Financial Statements.
Impairment of GoodwillWe are required to make certain subjective and complex judgments in assessing whether an event of impairment of goodwill has occurred, including assumptions and estimates used to determine the fair value of our reporting units.

CORNING INCORPORATED - 2013 Annual Report 41
Management’s Discussion and Analysis of Financial Condition and Results of Operations
Corning’s goodwill relates primarily to the Optical Communications, Specialty Materials and Life Sciences operating segments. On a quarterly basis, management performs a qualitative assessment of factors in each reporting unit to determine whether there have been any triggering events. The two-step impairment test is required only if we conclude that it is more likely than not that a reporting unit’s fair value is less than its carrying amount. We perform a detailed, two-step process every three years if no indicators suggest a test should be performed in the interim. We use this calculation as quantitative validation of the step-zero qualitative process that is performed during the intervening periods and does not represent an election to perform the two-step process in place of the step-zero review.
The following summarizes our qualitative process to assess our goodwill balances for impairment:
• We assess qualitative factors in each of our reporting units which carry goodwill to determine whether it is necessary to perform the first step of the two-step quantitative goodwill impairment test.
• The following events and circumstances are considered when evaluating whether it is more likely than not that the fair value of a reporting unit is less than its carrying amount: – Macroeconomic conditions, such as a deterioration in general economic
conditions, fluctuations in foreign exchange rates and/or other developments in equity and credit markets;
– Market capital in relation to book value; – Industry and market considerations, such as a deterioration in the
environment in which an entity operates, material loss in market share and significant declines in product pricing;
– Cost factors, such as an increase in raw materials, labor or other costs; – Overall financial performance, such as negative or declining cash
flows or a decline in actual or forecasted revenue; – Other relevant entity-specific events, such as material changes in
management or key personnel; and – Events affecting a reporting unit, such as a change in the composition
or carrying amount of its net assets including acquisitions and dispositions.
The examples noted above are not all-inclusive, and the Company shall consider other relevant events and circumstances that affect the fair value of a reporting unit in determining whether to perform the first step of the goodwill impairment test.
Our two step goodwill recoverability assessment is based on our annual strategic planning process. This process includes an extensive review of expectations for the long-term growth of our businesses and forecasted future cash flows. Our valuation method is an “income approach” using a discounted cash flow model in which cash flows anticipated over several periods, plus a terminal value at the end of that time horizon, are discounted to their present value using an appropriate rate of return. Our estimates are based upon our historical experience, our current knowledge from our commercial relationships, and available external information about future trends.
Optical CommunicationsGoodwill for the Optical Communications segment is tested at the reporting unit level which is also the operating segment level. On a quarterly basis in 2013, management performed a qualitative assessment of factors and determined there had not been any triggering events which would indicate that the Optical Communications reporting unit’s fair value is less than its carrying amount.
In addition to assessing qualitative factors each quarter, we performed a quantitative goodwill recoverability test in 2012 for this reporting unit. The results of our impairment test indicated that the fair value of the reporting unit exceeded its book value by a significant amount. A discount rate of 9% was used in 2012. We determined a range of discount rates between 7% and 11% would not have affected our conclusion.
Specialty MaterialsGoodwill for the Specialty Materials segment is tested at the reporting unit level, which is one level below an operating segment, as goodwill is the result of transactions associated with certain businesses within this operating segment. There is only one reporting unit with goodwill within this operating segment. On a quarterly basis in 2013, management performed a qualitative assessment of factors and determined there had not been any triggering events which would indicate that the Specialty Materials reporting unit’s fair value is less than its carrying amount.
In addition to assessing qualitative factors each quarter, we performed a quantitative goodwill recoverability test in 2012 for this reporting unit. The results of our impairment test indicated that the fair value of the reporting unit exceeded its book value by a significant amount. A discount rate of 8% was used in 2012. We determined a range of discount rates between 6% and 10% would not have affected our conclusion. Additionally, the asset impairment which occurred in the fourth quarter of 2012 did not cause a triggering event for goodwill impairment in this reporting unit because the cash flow related to this lower level asset group is not material to this reporting unit.
Life SciencesGoodwill for the Life Sciences segment is tested at the reporting unit level which is also the operating segment level. On a quarterly basis in 2013, management performed a qualitative assessment of factors and determined there had not been any triggering events which would indicate that the Life Sciences reporting unit’s fair value is less than its carrying amount.
In addition to assessing qualitative factors each quarter, we performed a quantitative goodwill recoverability test in 2012 for this reporting unit. The results of our impairment test indicated that the fair value of the reporting unit exceeded its book value by a significant amount. A discount rate of 7% was used in 2012. We determined a range of discount rates between 5% and 9% would not have affected our conclusion.
Restructuring charges and impairments resulting from restructuring actionsWe are required to assess whether and when a restructuring event has occurred and in which periods charges related to such events should be recognized. We must estimate costs of plans to restructure including, for example, employee termination costs. Restructuring charges require us to exercise judgment about the expected future of our businesses, of portions thereof, their profitability, cash flows and in certain instances eventual outcome. The judgment involved can be difficult, subjective and complex in a number of areas, including assumptions and estimates used in estimating the future profitability and cash flows of our businesses.
Restructuring events often give rise to decisions to dispose of or abandon certain assets or asset groups which, as a result, require impairment. We are required to carry assets to be sold or abandoned at the lower of cost or fair value. We must exercise judgment in assessing the fair value of the assets to be sold or abandoned.

CORNING INCORPORATED - 2013 Annual Report42
Management’s Discussion and Analysis of Financial Condition and Results of Operations
Income taxesWe are required to exercise judgment about our future results in assessing the realizability of our deferred tax assets. Inherent in this estimation process is the requirement for us to estimate future book and taxable income and possible tax planning strategies. These estimates require us to exercise judgment about our future results, the prudence and feasibility of possible tax planning strategies, and the economic environments in which we do business. It is possible that actual results will differ from assumptions and require adjustments to allowances.
Corning accounts for uncertain tax positions in accordance with FASB ASC Topic 740, Income Taxes. As required under FASB ASC Topic 740, we record tax benefits only for technical positions that we believe have a greater than 50% likelihood of being sustained on their technical merits and then only to the extent of the amount of tax benefit that is greater than 50% likely of being realized upon settlement. In estimating these amounts, we must exercise judgment around factors such as the weighting of the tax law in our favor, the willingness of a tax authority to aggressively pursue a particular position, or alternatively, consider a negotiated compromise, and our willingness to dispute a tax authorities assertion to the level of appeal we believe is required to sustain our position. As a result, it is possible that our estimate of the benefits we will realize for uncertain tax positions may change when we become aware of new information affecting these judgments and estimates.
Equity method investmentsAt December 31, 2013 and 2012, the carrying value of our equity method investments was $5.5 billion and $4.9 billion, respectively, with our two largest equity method investments, Samsung Corning Precision Materials and Dow Corning, comprising approximately 93% of the balance. We review our equity method investments for indicators of impairment on a periodic basis or if an event or circumstances change to indicate the carrying amount may be other-than-temporarily impaired. When such indicators are present, we then perform an in-depth review for impairment. An impairment assessment requires the exercise of judgment related to key assumptions such as forecasted revenue and profitability, forecasted tax rates, foreign currency exchange rate movements, terminal value assumptions, historical experience, our current knowledge from our commercial relationships, and available external information about future trends. As of December 31, 2013 and 2012, we have not identified any instances where the carrying values of our equity method investments were not recoverable.
To extend Corning’s leadership in specialty glass and drive earnings growth, Corning announced in October 2013 that it is entering into a series of strategic and financial agreements with Samsung Display which will result in Corning obtaining full ownership of Samsung Corning Precision Materials. As part of this agreement, in the fourth quarter of 2013, Corning acquired the minority interests of three shareholders in Samsung Corning Precision Materials for $506 million, which includes payment for the transfer of non-operating assets and the pro-rata portion of cash on Samsung Corning Precision Materials balance sheet at September 30, 2013. The resulting transfer of shares to Corning increased Corning’s ownership percentage of Samsung Corning Precision Materials from 50% to 57%. Because this transaction did not result in a change in control based on the governing articles of this entity, Corning did not consolidate this entity as of December 31, 2013. The remaining transactions were completed on January 15, 2014, which increased Corning’s ownership to 100% and will result in consolidation of the entity beginning in the first quarter of 2014. This organization will be integrated into Corning’s Display Technologies segment. Refer to Note 21 (Subsequent Events) to the Consolidated Financial Statements for additional information.
Fair value measuresAs required, Corning uses two kinds of inputs to determine the fair value of assets and liabilities: observable and unobservable. Observable inputs are based on market data or independent sources, while unobservable inputs are based on the Company’s own market assumptions. Once inputs have been characterized, we prioritize the inputs used to measure fair value into one of three broad levels. Characterization of fair value inputs is required for those accounting pronouncements that prescribe or permit fair value measurement. In addition, observable market data must be used when available and the highest-and-best-use measure should be applied to non-financial assets. Corning’s major categories of financial assets and liabilities required to be measured at fair value are short-term and long-term investments, certain pension asset investments and derivatives. These categories use observable inputs only and are measured using a market approach based on quoted prices in markets considered active or in markets in which there are few transactions.
Derivative assets and liabilities may include interest rate swaps and forward exchange contracts that are measured using observable quoted prices for similar assets and liabilities. In arriving at the fair value of Corning’s derivative assets and liabilities, we have considered the appropriate valuation and risk criteria, including such factors as credit risk of the relevant party to the transaction. Amounts related to credit risk are not material.
The Level 3 assets measured with unobservable inputs relate to certain pension asset investments and all long-lived assets fair valued on a nonrecurring basis related to the ion exchange process for the production of large cover glass. In 2012, we recorded an impairment charge in the amount of $44 million related to these ion exchange assets used in the production of large cover glass. Refer to Note 16 (Fair Value Measurements) of the Consolidated Financial Statements for further detail.
Probability of litigation outcomesWe are required to make judgments about future events that are inherently uncertain. In making determinations of likely outcomes of litigation matters, we consider the evaluation of legal counsel knowledgeable about each matter, case law, and other case-specific issues. See Part II – Item 3.Legal Proceedings for a discussion of the material litigation matters we face. The most significant matter involving judgment is the liability for asbestos litigation. There are a number of factors bearing upon our potential liability, including the inherent complexity of a Chapter 11 filing, our history of success in defending asbestos claims, our assessment of the strength of our corporate veil defenses, and our continuing dialogue with our insurance carriers and the claimants’ representatives. The proposed asbestos resolution (Amended PCC Plan) is subject to a number of contingencies. The approval of the Amended PCC Plan by the Bankruptcy Court is not certain and faces objections by some parties. Any approval of the Amended PCC Plan by the Bankruptcy Court is subject to appeal. For these and other reasons, Corning’s liability for these asbestos matters may be subject to changes in subsequent quarters. The estimate of the cost of resolving the non-PCC asbestos claims may also be subject to change as developments occur. Management continues to believe that the likelihood of the uncertainties surrounding these proceedings causing a material adverse impact to Corning’s financial statements is remote.
Other possible liabilitiesWe are required to make judgments about future events that are inherently uncertain. In making determinations of likely outcomes of certain matters, including certain tax planning and environmental matters, these judgments require us to consider events and actions that are outside our control in determining whether probable or possible liabilities require accrual or disclosure. It is possible that actual results will differ from assumptions and require adjustments to accruals.

CORNING INCORPORATED - 2013 Annual Report 43
Management’s Discussion and Analysis of Financial Condition and Results of Operations
Pension and other postretirement employee benefits (OPEB)Pension and OPEB costs and obligations are dependent on assumptions used in calculating such amounts. These assumptions include discount rates, health care cost trend rates, benefits earned, interest cost, expected return on plan assets, mortality rates, and other factors. In the first quarter of 2013, we elected to change our method of recognizing actuarial gains and losses for our defined benefit pension plans. Previously, we recognized the actuarial gains and losses as a component of Stockholders’ Equity on our consolidated balance sheets on an annual basis. These amounts were amortized into our operating results over the average remaining service period of employees expected to receive benefits under the plan, to the extent such gains and losses were outside of the corridor, where the corridor is equal to 10% of the greater of the benefit obligation or the market-related value of plan assets at the beginning of the year. In addition, we used a calculated market-related value of plan assets for purposes of
calculating the expected return on plan assets that spread asset gains and losses over a 3-year period. We have elected to recognize the change in the fair value of plan assets in full for purposes of calculating the expected return on plan assets and net actuarial gains and losses outside of the corridor in pension costs annually in the fourth quarter of each year and whenever the plan is remeasured or valuation estimates are finalized. The remaining components of pension expense are recorded on a quarterly basis. For our OPEB plans, actual results that differ from the assumptions are accumulated and amortized over future periods and, therefore, generally affect recognized expense and the recorded obligation in future periods. While management believes that the assumptions used are appropriate, differences in actual experience or changes in assumptions may affect Corning’s employee pension and other postretirement obligations, and current and future expense.
The following table presents our actual and expected return on assets, as well as the corresponding percentage, for the years ended 2013, 2012 and 2011:
(In millions)December 31,
2013 2012 2011Actual return on plan assets – Domestic plans $ 65 $ 299 $ 216
Expected return on plan assets – Domestic plans 158 150 155
Actual return on plan assets – International plans 6 10 16
Expected return on plan assets – International plans 11 10 11
December 31,
2013 2012 2011
Weighted-average actual and expected return on assets:
Actual return on plan assets – Domestic plans 2.67% 12.06% 9.24%
Expected return on plan assets – Domestic plans 6.00% 6.00% 6.50%
Actual return on plan assets – International plans 2.73% 6.01% 8.40%
Expected return on plan assets – International plans 3.73% 6.01% 5.59%
As of December 31, 2013, the Projected Benefit Obligation (PBO) for U.S. pension plans was $2,844 million.
The following information illustrates the sensitivity to a change in certain assumptions for U.S. pension plans:
Change in assumptionEffect on 2014
pre-tax pension expenseEffect on
December 31, 2013 PBO25 basis point decrease in discount rate - 1 million + 81 million25 basis point increase in discount rate + 1 million - 78 million25 basis point decrease in expected return on assets + 6 million 25 basis point increase in expected return on assets - 6 million
The above sensitivities reflect the impact of changing one assumption at a time. Note that economic factors and conditions often affect multiple assumptions simultaneously and the effects of changes in key assumptions are not necessarily linear. These changes in assumptions would have no effect on Corning’s funding requirements.
In addition, at December 31, 2013, a 25 basis point decrease in the discount rate would decrease stockholders’ equity by $107 million before tax, and a 25 basis point increase in the discount rate would increase stockholders’ equity by $103 million. In addition, the impact of greater than a 25 basis point decrease in discount rate would not be proportional to the first 25 basis point decrease in the discount rate.

CORNING INCORPORATED - 2013 Annual Report44
Management’s Discussion and Analysis of Financial Condition and Results of Operations
The following table illustrates the sensitivity to a change in the discount rate assumption related to Corning’s U.S. OPEB plans:
Change in assumptionEffect on 2014
pre-tax OPEB expenseEffect on
December 31, 2013 APBO*25 basis point decrease in discount rate + 2 million + 26 million25 basis point increase in discount rate - 2 million - 25 million* Accumulated Postretirement Benefit Obligation (APBO).
The above sensitivities reflect the impact of changing one assumption at a time. Note that economic factors and conditions often affect multiple assumptions simultaneously and the effects of changes in key assumptions are not necessarily linear.
Revenue recognitionThe Company recognizes revenue when it is realized or realizable and earned. In certain instances, revenue recognition is based on estimates of fair value of deliverables as well as estimates of product returns, allowances, discounts, and other factors. These estimates are supported by historical data. While management believes that the estimates used are appropriate, differences in actual experience or changes in estimates may affect Corning’s future results.
Share-Based CompensationShare-based compensation cost is measured at the grant date based on the fair value of the award and is recognized as expense over the requisite service period. Determining the fair value of stock-based awards at the grant date requires judgment, including estimating expected dividends. In addition, judgment is also required in estimating the amount of share-based awards that are expected to be forfeited. If actual results differ significantly from these estimates, share-based compensation expense and our results of operations could be impacted.
New Accounting Standards
Refer to Note 1 (Summary of Significant Accounting Policies) to the Consolidated Financial Statements.

CORNING INCORPORATED - 2013 Annual Report 45
Quantitative and Qualitative Disclosures About Market RisksWe operate and conduct business in many foreign countries and as a result are exposed to movements in foreign currency exchange rates. Our exposure to exchange rates has the following effects:
• Exchange rate movements on financial instruments and transactions denominated in foreign currencies that impact earnings; and
• Exchange rate movements upon conversion of net assets and net income of foreign subsidiaries for which the functional currency is not the U.S. dollar, which impact our net equity.
Our most significant foreign currency exposures relate to the Japanese yen, South Korean won, New Taiwan dollar, Chinese Renminbi, and the Euro. We seek to mitigate the impact of exchange rate movements in our income statement by using over-the-counter (OTC) derivative instruments including foreign exchange forward and option contracts typically with durations of 36 months or less. In general, these hedges expire coincident with the timing of the underlying foreign currency commitments and transactions.
We are exposed to potential losses in the event of non-performance by our counterparties to these derivative contracts. However, we minimize this risk by limiting the counterparties to a diverse group of highly-rated major international financial institutions with which we have other financial relationships. We do not expect to record any losses as a result of such counterparty default. Neither we nor our counterparties are required to post collateral for these financial instruments.
Our cash flow hedging activities utilize OTC foreign exchange forward contracts to reduce the risk that movements in exchange rates will adversely affect the net cash flows resulting from the sale of products to foreign customers and purchases from foreign suppliers. We also use OTC foreign exchange forward and option contracts that are not designated as hedging instruments for accounting purposes. The undesignated hedges limit exposures to foreign functional currency fluctuations related to certain subsidiaries’ monetary assets, monetary liabilities and net earnings in foreign currencies. A significant portion of the Company’s non-U.S. revenues are denominated in Japanese yen. When these revenues are translated back to U.S. dollars, the Company is exposed to foreign exchange rate movements in the Japanese yen. To protect translated earnings against movements in the Japanese yen, the Company has entered into a series of purchased collars and average rate forwards. With a purchased collar structure, the Company writes a local currency call option and purchases a local currency put option. The purchased collars offset the impact of translated earnings above the put price and below the call strike price and that offset is reported in other income, net.
Equity in earnings of affiliated companies has historically contributed a significant amount to our income from continuing operations. Equity in earnings of affiliated companies, net of impairments, were $547 million and $810 million in 2013 and 2012, respectively, with foreign-based affiliates comprising over 63% of this amount in 2013. Equity earnings from Samsung Corning Precision Materials totaled $320 million for 2013 and $699 million for 2012. Exchange rate fluctuations and actions taken by management of these entities can affect the earnings of these companies.
We use a sensitivity analysis to assess the market risk associated with our foreign currency exchange risk. Market risk is defined as the potential change in fair value of assets and liabilities resulting from an adverse
movement in foreign currency exchange rates. At December 31, 2013, with respect to open foreign exchange forward and option contracts, and foreign denominated debt with values exposed to exchange rate movements, a 10% adverse movement in quoted foreign currency exchange rates could result in a loss in fair value of these instruments of $479 million compared to $236 million at December 31, 2012. Specific to the Japanese yen, a 10% adverse movement in quoted yen exchange rates could result in a loss in fair value of these instruments of $398 million compared to $196 million at December 31, 2012. Specific to the Euro, a 10% adverse movement in quoted euro exchange rates could result in a loss in fair value of these instruments of $31 million compared to $25 million at December 31, 2012.
As we derive approximately 69% of our net sales from outside the U.S., our sales and net income could be affected if the U.S. dollar significantly strengthens or weakens against foreign currencies, most notably the Japanese yen and Euro. Our forecasts generally assume exchange rates during 2014 remain constant at January 2014 levels. As an example of the impact that changes in foreign currency exchange rates could have on our financial results, we compare 2013 actual sales in yen and Euro transaction currencies at an average currency exchange rate during the year to a 10% change in the currency exchange rate. A plus or minus 10% movement in the U.S. dollar – Japanese yen exchange rate would result in a change to 2013 net sales of approximately $265 million. A plus or minus 10% movement in the U.S. dollar – euro exchange rate would result in a change to 2013 net sales of approximately $103 million. Using 2013 net income attributable to Corning Incorporated as a percentage of net sales of 25%, we can estimate that a plus or minus 10% movement in the U.S. dollar – Japanese yen exchange rate would result in a change to 2013 net income attributable to Corning Incorporated of approximately $220 million. A plus or minus 10% movement in the U.S. dollar – euro exchange rate would result in a change to 2013 net income attributable to Corning Incorporated of approximately $14 million.
Interest Rate Risk ManagementIt is our policy to conservatively manage our exposure to changes in interest rates. We are party to two interest rate swaps that are designated as fair value hedges and economically exchange a notional amount of $550 million of previously issued fixed rate long-term debt to floating rate debt. Under the terms of the swap agreements, we pay the counterparty a floating rate that is indexed to the one-month LIBOR rate.
In May 2013, in anticipation of issuing $750 million of new long-term fixed rate debt, the Company entered into two interest rate swap agreements to hedge against the variability in cash flows due to changes in the benchmark interest rate. The instruments were designated as cash flow hedges. During the fourth quarter, the interest rate swaps expired prior to the issuance of the anticipated debt, the issuance of which had become “not reasonably possible” rather than “probable”. In November 2013, Corning issued a $250 million note with a maturity of 10 years, as opposed to the contemplated issuance of $750 million of new long-term fixed rate debt. As the planned issuance did not occur as anticipated, we recorded a small gain in the fourth quarter of 2013. A portion of this gain is deferred in accumulated other comprehensive (loss) income on the consolidated balance sheet until such time as the hedged item impacts earnings.
.

CORNING INCORPORATED - 2013 Annual Report46
Management’s Annual Report on Internal Control Over Financial ReportingManagement is responsible for establishing and maintaining adequate disclosure controls and procedures and adequate internal control over financial reporting for Corning. Management is also responsible for the assessment of the effectiveness of disclosure controls and procedures and the effectiveness of internal control over financial reporting.
Disclosure controls and procedures mean controls and other procedures of an issuer that are designed to ensure that information required to be disclosed by the issuer in the reports that it files or submits under the Exchange Act is recorded, processed, summarized, and reported, within the time periods specified in the SEC’s rules and forms. Corning’s disclosure controls and procedures include, without limitation, controls and procedures designed to ensure that information required to be disclosed by Corning in the reports that it files or submits under the Exchange Act is accumulated and communicated to Corning’s management, including Corning’s principal executive and principal financial officers, or other persons performing similar functions, as appropriate to allow timely decisions regarding required disclosure.
Corning’s internal control over financial reporting is a process designed to provide reasonable assurance regarding the reliability of financial reporting and the preparation of financial statements for external purposes in accordance with accounting principles generally accepted in the United States of America. Corning’s internal control over financial reporting includes those policies and procedures that (i) pertain to the maintenance of records that, in reasonable detail, accurately and fairly reflect the transactions and dispositions of Corning’s assets; (ii) provide reasonable assurance that transactions are recorded as necessary to permit preparation of financial statements in accordance with accounting principles generally accepted in the United States of America, and that Corning’s receipts and expenditures are being made only in accordance with authorizations of Corning’s management and directors; and (iii) provide reasonable assurance regarding prevention or timely detection of unauthorized acquisition, use, or disposition of Corning’s assets that could have a material effect on the financial statements. Because of its inherent limitations, internal control over financial reporting may not prevent or detect misstatements. Also, projections of any evaluation of effectiveness to future periods are subject to the risk that controls may become inadequate because of changes in conditions, or that the degree of compliance with the policies and procedures may deteriorate.
Management conducted an evaluation of the effectiveness of the system of internal control over financial reporting based on the framework in Internal Control – Integrated Framework (1992) issued by the Committee of Sponsoring Organizations of the Treadway Commission. Management’s assessment of internal control over financial reporting includes controls over recognition of equity earnings and equity investments by Corning. Internal control over financial reporting for Samsung Corning Precision Materials and Dow Corning is the responsibility of Samsung Corning Precision Materials and Dow Corning management. Based on this evaluation, management concluded that Corning’s internal control over financial reporting was effective as of December 31, 2013. The effectiveness of Corning’s internal control over financial reporting as of December 31, 2013, has been audited by PricewaterhouseCoopers LLP, an independent registered public accounting firm, as stated in their report which is included herein.
Wendell P. Weeks James B. FlawsChairman, Chief Executive Officer and President Vice Chairman and Chief Financial Officer

CORNING INCORPORATED - 2013 Annual Report 47
Report of Independent Registered Public Accounting FirmPricewaterhouseCoopers LLPTo the Board of Directors and Shareholders of Corning Incorporated:
In our opinion, the consolidated financial statements listed in the accompanying index present fairly, in all material respects, the financial position of Corning Incorporated and its subsidiaries at December 31, 2013 and 2012, and the results of its operations and its cash flows for each of the three years in the period ended December 31, 2013 in conformity with accounting principles generally accepted in the United States of America. In addition, in our opinion, the financial statement schedule listed in the accompanying index presents fairly, in all material respects, the information set forth therein when read in conjunction with the related consolidated financial statements. Also in our opinion, the Company maintained, in all material respects, effective internal control over financial reporting as of December 31, 2013, based on criteria established in Internal Control - Integrated Framework (1992) issued by the Committee of Sponsoring Organizations of the Treadway Commission (COSO). The Company’s management is responsible for these financial statements and financial statement schedule, for maintaining effective internal control over financial reporting and for its assessment of the effectiveness of internal control over financial reporting, included in “Management’s Annual Report on Internal Control Over Financial Reporting,” appearing under Item 9A. Our responsibility is to express opinions on these financial statements, on the financial statement schedule and on the Company’s internal control over financial reporting based on our integrated audits. We conducted our audits in accordance with the standards of the Public Company Accounting Oversight Board (United States). Those standards require that we plan and perform the audits to obtain reasonable assurance about whether the financial statements are free of material misstatement and whether effective internal control over financial reporting was maintained in all material respects. Our audits of the financial statements included examining, on a test basis, evidence supporting the amounts and disclosures in the financial statements, assessing the accounting principles used and significant estimates made by management, and evaluating the overall financial statement presentation. Our audit of internal control over financial reporting included obtaining an understanding of internal control over financial reporting, assessing the risk that a material weakness exists, and testing and evaluating the design and operating effectiveness of internal control based on the assessed risk. Our audits also included performing such other procedures as we considered necessary in the circumstances. We believe that our audits provide a reasonable basis for our opinions.
As discussed in Note 1 to the consolidated financial statements, the Company changed the manner in which it accounts for defined benefit pension plans in 2013.
A company’s internal control over financial reporting is a process designed to provide reasonable assurance regarding the reliability of financial reporting and the preparation of financial statements for external purposes in accordance with generally accepted accounting principles. A company’s internal control over financial reporting includes those policies and procedures that (i) pertain to the maintenance of records that, in reasonable detail, accurately and fairly reflect the transactions and dispositions of the assets of the company; (ii) provide reasonable assurance that transactions are recorded as necessary to permit preparation of financial statements in accordance with generally accepted accounting principles, and that receipts and expenditures of the company are being made only in accordance with authorizations of management and directors of the company; and (iii) provide reasonable assurance regarding prevention or timely detection of unauthorized acquisition, use, or disposition of the company’s assets that could have a material effect on the financial statements.
Because of its inherent limitations, internal control over financial reporting may not prevent or detect misstatements. Also, projections of any evaluation of effectiveness to future periods are subject to the risk that controls may become inadequate because of changes in conditions, or that the degree of compliance with the policies or procedures may deteriorate.
New York, New YorkFebruary 10, 2014

CORNING INCORPORATED - 2013 Annual Report48
Consolidated Statements of IncomeCorning Incorporated and Subsidiary Companies
(In millions, except per share amounts)Years ended December 31,
2013 2012 2011 Net sales $ 7,819 $ 8,012 $ 7,890
Cost of sales 4,495 4,693 4,314
Gross margin 3,324 3,319 3,576
Operating expenses:
Selling, general and administrative expenses 1,126 1,205 1,028
Research, development and engineering expenses 710 769 668
Amortization of purchased intangibles 31 19 15
Restructuring, impairment and other charges (Note 2) 67 133 129
Asbestos litigation charge (Note 7) 19 14 24
Operating income 1,371 1,179 1,712
Equity in earnings of affiliated companies (Note 7) 547 810 1,471
Interest income 8 14 19
Interest expense (120) (111) (89)
Other income, net 667 83 118
Income before income taxes 2,473 1,975 3,231
Provision for income taxes (Note 6) (512) (339) (414)
Net income attributable to Corning Incorporated $ 1,961 $ 1,636 $ 2,817
Earnings per common share attributable to Corning Incorporated:
Basic (Note 18) $ 1.35 $ 1.10 $ 1.80
Diluted (Note 18) $ 1.34 $ 1.09 $ 1.78
Dividends declared per common share $ 0.39 $ 0.32 $ 0.23
The accompanying notes are an integral part of these consolidated financial statements.

CORNING INCORPORATED - 2013 Annual Report 49
Consolidated Statements of Comprehensive IncomeCorning Incorporated and Subsidiary Companies
(In millions)Years ended December 31,
2013 2012 2011Net income attributable to Corning Incorporated $ 1,961 $ 1,636 $ 2,817
Other comprehensive (loss) income, net of tax:
Foreign currency translation adjustments and other (682) (179) (21)
Net unrealized gains on investments 2 13 4
Unamortized gains (losses) and prior service costs for postretirement benefit plans 392 (1) (121)
Net unrealized (losses) gains on designated hedges (24) 47 (6)
(312) (120) (144)
Comprehensive income attributable to Corning Incorporated $ 1,649 $ 1,516 $ 2,673
The accompanying notes are an integral part of these consolidated financial statements.

CORNING INCORPORATED - 2013 Annual Report50
Consolidated Balance SheetsCorning Incorporated and Subsidiary Companies
(In millions, except share and per share amounts)December 31,
2013 2012Assets
Current assets:
Cash and cash equivalents $ 4,704 $ 4,988
Short-term investments, at fair value (Note 3) 531 1,156
Total cash, cash equivalents and short-term investments 5,235 6,144
Trade accounts receivable, net of doubtful accounts and allowances - $28 and $26 1,253 1,302
Inventories (Note 5) 1,270 1,051
Deferred income taxes (Note 6) 278 579
Other current assets 855 619
Total current assets 8,891 9,695
Investments (Note 7) 5,537 4,915
Property, net of accumulated depreciation - $7,865 and $7,652 (Note 9) 9,801 10,625
Goodwill and other intangible assets, net (Note 10) 1,542 1,496
Deferred income taxes (Note 6) 2,234 2,343
Other assets 473 301
Total Assets $ 28,478 $ 29,375 Liabilities and Equity
Current liabilities:
Current portion of long-term debt (Note 12) $ 21 $ 76
Accounts payable 771 779
Other accrued liabilities (Note 11 and 14) 954 1,101
Total current liabilities 1,746 1,956
Long-term debt (Note 12) 3,272 3,382
Postretirement benefits other than pensions (Note 13) 766 930
Other liabilities (Note 11 and 14) 1,483 1,574
Total liabilities 7,267 7,842
Commitments and contingencies (Note 14)
Shareholders’ equity (Note 17):
Common stock – Par value $0.50 per share; shares authorized: 3.8 billionShares issued: 1,661 million and 1,649 million 831 825
Additional paid-in capital 13,066 13,146
Retained earnings 11,320 9,932
Treasury stock, at cost; shares held: 262 million and 179 million (4,099) (2,773)
Accumulated other comprehensive income 44 356
Total Corning Incorporated shareholders’ equity 21,162 21,486
Noncontrolling interests 49 47
Total equity 21,211 21,533
Total Liabilities and Equity $ 28,478 $ 29,375
The accompanying notes are an integral part of these consolidated financial statements.

CORNING INCORPORATED - 2013 Annual Report 51
Consolidated Statements of Cash FlowsCorning Incorporated and Subsidiary Companies
(In millions)Years ended December 31,
2013 2012 2011
Cash Flows from Operating Activities:
Net income $ 1,961 $ 1,636 $ 2,817
Adjustments to reconcile net income to net cash provided by operating activities:
Depreciation 971 978 942
Amortization of purchased intangibles 31 19 15
Restructuring, impairment and other charges 67 133 129
Loss on retirement of debt 26
Stock compensation charges 54 70 86
Undistributed earnings of affiliated companies less than (in excess of) dividends received 83 280 (651)
Deferred tax provision 189 18 121
Restructuring payments (35) (15) (16)
Cash received from settlement of insurance claims 66
Employee benefit payments less than expense 52 178 114
Unrealized gains on translated earnings contracts (367)
Changes in certain working capital items:
Trade accounts receivable (29) (272) (84)
Inventories (247) (23) (201)
Other current assets 34 (81) (20)
Accounts payable and other current liabilities (23) 189 (27)
Other, net 46 70 (102)
Net cash provided by operating activities 2,787 3,206 3,189
Cash Flows from Investing Activities:
Capital expenditures (1,019) (1,801) (2,432)
Acquisitions of businesses, net of cash received (68) (723) (215)
Net proceeds from sale or disposal of assets 2
Investment in unconsolidated entities (526) (111)
Short-term investments – acquisitions (1,406) (2,270) (2,582)
Short-term investments – liquidations 2,026 2,269 3,171
Premium on purchased collars (107)
Realized gains on translated earnings contracts 87
Other, net 9 8
Net cash used in investing activities (1,004) (2,628) (2,056)
Cash Flows from Financing Activities:
Net repayments of short-term borrowings and current portion of long-term debt (71) (26) (24)
Proceeds from issuance of long-term debt, net 248 1,362 120
Proceeds (payments) from the settlement of interest rate swap agreements 33 (18)
Proceeds received for asset financing and related incentives, net 276
Retirements of long-term debt, net (498) (280)
Principal payments under capital lease obligations (7) (1) (32)
Payments to acquire noncontrolling interest (47)
Proceeds from the exercise of stock options 85 38 90
Repurchases of common stock for treasury (1,516) (720) (780)
Dividends paid (566) (472) (354)
Other, net 2
Net cash used in financing activities (2,063) (115) (980)
Effect of exchange rates on cash (4) (136) (90)
Net (decrease) increase in cash and cash equivalents (284) 327 63
Cash and cash equivalents at beginning of year 4,988 4,661 4,598
Cash and cash equivalents at end of year $ 4,704 $ 4,988 $ 4,661
The accompanying notes are an integral part of these consolidated financial statements.

CORNING INCORPORATED - 2013 Annual Report52
Consolidated Statements of Changes in Shareholders’ EquityCorning Incorporated and Subsidiary Companies
(In millions)Common
stock
Additional paid-in capital
Retained earnings
Treasury stock
Accumulated other
comprehensive income (loss)
Total Corning Incorporated shareholders’
equity
Non-controlling
interests Total Balance, December 31, 2010 $ 813 $ 12,865 $ 6,304 $ (1,227) $ 620 $ 19,375 $ 51 $ 19,426
Net income 2,817 2,817 (3) 2,814
Other comprehensive income (144) (144) 3 (141)
Purchase of common stock for treasury (779 ) (779) (779)
Shares issued to benefit plans and for option exercises 5 176 (7 ) 174 174
Dividends on shares (354) (354) (354)
Other, net (11) (11) (11)
Balance, December 31, 2011 $ 818 $ 13,041 $ 8,767 $ (2,024) $ 476 $ 21,078 $ 51 $ 21,129
Net income 1,636 1,636 (5) 1,631
Other comprehensive income (120) (120) 1 (119)
Purchase of common stock for treasury (719 ) (719) (719)
Shares issued to benefit plans and for option exercises 7 105 (1 ) 111 111
Dividends on shares (472) (472) (472)
Other, net 1 (29) (28) (28)
Balance, December 31, 2012 $ 825 $ 13,146 $ 9, 932* $ (2,773 ) $ 356 $ 21,486 $ 47 $ 21,533
Net income 1,961 1,961 1,961
Other comprehensive income (312) (312) (312)
Purchase of common stock for treasury (200) (1,316 ) (1,516) (1,516)
Shares issued to benefit plans and for option exercises 6 139 (1 ) 144 144
Dividends on shares (566) (566) (566)
Other, net (19) (7) (9) (35) 2 (33)
Balance, December 31, 2013 $ 831 $ 13,066 $ 11,320 $ (4,099) $ 44 $ 21,162 $ 49 $ 21,211
* Due to a typographical error, this number was incorrectly reported as $9,332 in our filed 2013 Form 10-K. The correct amount, which includes the impact of the defined benefit pension plan methodology change implemented in the first quarter of 2013 and retrospectively applied to prior periods, is $9,932. The amount in our 2012 Form 10-K was correctly stated as $10,588, but was prior to the retrospective application of this methodology change. Please refer to our Form 8-K filed on April 5, 2013 for additional information regarding the pension accounting methodology change.
The accompanying notes are an integral part of these consolidated financial statements.

CORNING INCORPORATED - 2013 Annual Report 53
Notes to Consolidated Financial StatementsCorning Incorporated and Subsidiary Companies
1. Summary of Significant Accounting Policies
OrganizationCorning Incorporated is a provider of high-performance glass for notebook computers, flat panel desktop monitors, LCD televisions, and other information display applications; carrier network and enterprise network products for the telecommunications industry; ceramic substrates for gasoline and diesel engines in automotive and heavy duty vehicle markets; laboratory products for the scientific community and specialized polymer products for biotechnology applications; advanced optical materials for the semiconductor industry and the scientific community; and other technologies. In these notes, the terms “Corning,” “Company,” “we,” “us,” or “our” mean Corning Incorporated and subsidiary companies.
Basis of Presentation and Principles of ConsolidationOur consolidated financial statements were prepared in conformity with generally accepted accounting principles in the U.S. and include the assets, liabilities, revenues and expenses of all majority-owned subsidiaries over which Corning exercises control.
The equity method of accounting is used for investments in affiliated companies that are not controlled by Corning and in which our interest is generally between 20% and 50% and we have significant influence over the entity. Our share of earnings or losses of affiliated companies, in which at least 20% of the voting securities is owned and we have significant influence but not control over the entity, is included in consolidated operating results. In the fourth quarter of 2013, Corning acquired the minority interests of three shareholders in one of our affiliated companies, Samsung Corning Precision Materials, which increased Corning’s ownership percentage from 50% to 57%. Because this transaction did not result in a change in control based on the governing articles of this entity, Corning did not consolidate this entity as of December 31, 2013.
We use the cost method to account for our investments in companies that we do not control and for which we do not have the ability to exercise significant influence over operating and financial policies. In accordance
with the cost method, these investments are recorded at cost or fair value, as appropriate.
All material intercompany accounts, transactions and profits are eliminated in consolidation.
Certain prior year amounts have been reclassified to conform to the current-year presentation. These reclassifications had no impact on our results of operations, financial position, or changes in shareholders’ equity.
Employee Retirement PlansIn the first quarter of 2013, we elected to change our method of recognizing actuarial gains and losses for our defined benefit pension plans. Previously, we recognized the actuarial gains and losses as a component of Stockholders’ Equity on our consolidated balance sheets on an annual basis. These amounts were amortized into our operating results over the average remaining service period of employees expected to receive benefits under the plan, to the extent such gains and losses were outside of the corridor, where the corridor is equal to 10% of the greater of the benefit obligation or the market-related value of plan assets at the beginning of the year. In addition, we used a calculated market-related value of plan assets for purposes of calculating the expected return on plan assets that spread asset gains and losses over a 3-year period. We have elected to recognize the change in the fair value of plan assets in full for purposes of calculating the expected return on plan assets and net actuarial gains and losses outside of the corridor in pension costs annually in the fourth quarter of each year and whenever the plan is remeasured or valuation estimates are finalized. The remaining components of pension expense are recorded on a quarterly basis. While the historical policy of recognizing pension expense was considered acceptable, we believe that the new policy is preferable as it recognizes the change in the fair value of plan assets in full for purposes of calculating the expected return on plan assets and eliminates the delay in recognition of net actuarial gains and losses outside of the corridor. We have applied these changes retrospectively, adjusting all prior periods, as if the new accounting methodology was in effect during those periods.
Following are the changes to financial statement line items as a result of the accounting methodology change for the periods presented in the accompanying consolidated financial statements:
Consolidated Statements of Income
(in millions, except share and per share amounts)
Year ended December 31, 2013Previous
accountingmethod Reported
Effect ofaccounting
changeCost of sales $ 4,564 $ 4,495 $ (69)
Gross margin 3,255 3,324 69
Selling, general and administrative expenses 1,161 1,126 (35)
Research, development and engineering expenses 731 710 (21)
Operating income 1,246 1,371 125
Income before income taxes 2,348 2,473 125
Provision for income taxes (466) (512) (46)
Net income attributable to Corning Incorporated $ 1,882 $ 1,961 $ 79
Earnings per common share attributable to Corning Incorporated – Basic $ 1.30 $ 1.35 $ 0.05
Earnings per common share attributable to Corning Incorporated – Diluted $ 1.29 $ 1.34 $ 0.05

CORNING INCORPORATED - 2013 Annual Report54
Notes to Consolidated Financial Statements
(in millions, except share and per share amounts)
Three months ended December 31, 2013 (unaudited)Previous
accountingmethod Reported
Effect ofaccounting
changeCost of sales $ 1,215 $ 1,186 $ (29)
Gross margin 741 770 29
Selling, general and administrative expenses 351 332 (19)
Research, development and engineering expenses 178 169 (9)
Operating income 131 184 53
Income before income taxes 514 567 53
Provision for income taxes (126) (146) (20)
Net income attributable to Corning Incorporated $ 388 $ 421 $ 33
Earnings per common share attributable to Corning Incorporated – Basic $ 0.27 $ 0.30 $ 0.03
Earnings per common share attributable to Corning Incorporated – Diluted $ 0.27 $ 0.30 $ 0.03
(in millions, except share and per share amounts)
Year ended December 31, 2012Previously reported (before
accounting change)
Revised (after
accounting change)
Effect of accounting
changeCost of sales $ 4,615 $ 4,693 $ 78
Gross margin 3,397 3,319 (78)
Selling, general and administrative expenses 1,165 1,205 40
Research, development and engineering expenses 745 769 24
Operating income 1,321 1,179 (142)
Income before income taxes 2,117 1,975 (142)
Provision for income taxes (389) (339) 50
Net income attributable to Corning Incorporated $ 1,728 $ 1,636 $ (92)
Earnings per common share attributable to Corning Incorporated – Basic $ 1.16 $ 1.10 $ (0.06)
Earnings per common share attributable to Corning Incorporated – Diluted $ 1.15 $ 1.09 $ (0.06)
(in millions, except share and per share amounts)
Three months ended December 31, 2012 (unaudited)Previouslyreported(before
accountingchange)
Revised(after
accountingchange)
Effect ofaccounting
changeCost of sales $ 1,239 $ 1,348 $ 109
Gross margin 907 798 (109)
Selling, general and administrative expenses 301 356 55
Research, development and engineering expenses 185 219 34
Operating income 277 79 (198)
Income before income taxes 381 183 (198)
Provision for income taxes (98) (28) 70
Net income attributable to Corning Incorporated $ 283 $ 155 $ (128)
Earnings per common share attributable to Corning Incorporated – Basic $ 0.19 $ 0.11 $ (0.08)
Earnings per common share attributable to Corning Incorporated – Diluted $ 0.19 $ 0.10 $ (0.09)

CORNING INCORPORATED - 2013 Annual Report 55
Notes to Consolidated Financial Statements
(in millions, except share and per share amounts)
Year ended December 31, 2011Previouslyreported(before
accountingchange)
Revised(after
accountingchange)
Effect ofaccounting
changeCost of sales $ 4,324 $ 4,314 $ (10)
Gross margin 3,566 3,576 10
Selling, general and administrative expenses 1,033 1,028 (5)
Research, development and engineering expenses 671 668 (3)
Operating income 1,694 1,712 18
Income before income taxes 3,213 3,231 18
Provision for income taxes (408) (414) (6)
Net income attributable to Corning Incorporated $ 2,805 $ 2,817 $ 12
Earnings per common share attributable to Corning Incorporated – Basic $ 1.80 $ 1.80
Earnings per common share attributable to Corning Incorporated – Diluted $ 1.77 $ 1.78 $ 0.01
Consolidated Statements of Comprehensive Income
(in millions)
Year ended December 31, 2013Previous
accountingmethod Reported
Effect ofaccounting
changeNet income attributable to Corning Incorporated $ 1,882 $ 1,961 $ 79
Other comprehensive loss, net of tax (240) (312) (72)
Comprehensive income attributable to Corning Incorporated $ 1,642 $ 1,649 $ 7
(in millions)
Year ended December 31, 2012Previouslyreported(before
accountingchange)
Revised(after
accountingchange)
Effect ofaccounting
changeNet income attributable to Corning Incorporated $ 1,728 $ 1,636 $ (92)
Other comprehensive loss, net of tax (211) (120) 91
Comprehensive income attributable to Corning Incorporated $ 1,517 $ 1,516 $ (1)
(in millions)
Year ended December 31, 2011Previouslyreported(before
accountingchange)
Revised(after
accountingchange)
Effect ofaccounting
changeNet income attributable to Corning Incorporated $ 2,805 $ 2,817 $ 12
Other comprehensive loss, net of tax (132) (144) (12)
Comprehensive income attributable to Corning Incorporated $ 2,673 $ 2,673 $ 0

CORNING INCORPORATED - 2013 Annual Report56
Notes to Consolidated Financial Statements
Consolidated Balance Sheets
(in millions)
December 31, 2013Previous
accountingmethod Reported
Effect ofaccounting
changeRetained earnings $ 11,904 $ 11,320 $ (584)
Accumulated other comprehensive (loss) income $ (540) $ 44 $ 584
(in millions)
December 31, 2012Previouslyreported(before
accountingchange)
Revised(after
accountingchange)
Effect ofaccounting
changeRetained earnings $ 10,588 $ 9,932 $ (656)
Accumulated other comprehensive (loss) income $ (300) $ 356 $ 656
(in millions)
December 31, 2011Previouslyreported(before
accountingchange)
Revised(after
accountingchange)
Effect ofaccounting
changeRetained earnings $ 9,332 $ 8,767 $ (565)
Accumulated other comprehensive (loss) income $ (89) $ 476 $ 565
(in millions)
December 31, 2010Previouslyreported(before
accountingchange)
Revised(after
accountingchange)
Effect ofaccounting
changeRetained earnings $ 6,881 $ 6,304 $ (577)Accumulated other comprehensive income $ 43 $ 620 $ 577
Consolidated Statements of Cash Flows
(in millions)
Year ended December 31, 2013Previous
accountingmethod Reported
Effect ofaccounting
changeCash flows from operating activities:
Net income $ 1,882 $ 1,961 $ 79
Deferred tax provision $ 143 $ 189 $ 46
Employee benefit payments less than expense $ 177 $ 52 $ (125)
(in millions)
Year ended December 31, 2012Previouslyreported(before
accountingchange)
Revised(after
accountingchange)
Effect ofaccounting
changeCash flows from operating activities:
Net income $ 1,728 $ 1,636 $ (92)Deferred tax provision $ 68 $ 18 $ (50)Employee benefit payments less than expense $ 36 $ 178 $ 142

CORNING INCORPORATED - 2013 Annual Report 57
Notes to Consolidated Financial Statements
(in millions)
Year ended December 31, 2011Previouslyreported(before
accountingchange)
Revised(after
accountingchange)
Effect ofaccounting
changeCash flows from operating activities:
Net income $ 2,805 $ 2,817 $ 12
Deferred tax provision $ 115 $ 121 $ 6
Employee benefit payments less than expense $ 132 $ 114 $ (18)
Use of EstimatesThe preparation of financial statements requires management to make estimates and assumptions that affect amounts reported in the consolidated financial statements and related notes. Significant estimates and assumptions in these consolidated financial statements include estimates of fair value associated with revenue recognition, restructuring charges, goodwill and long-lived asset impairment tests, estimates of fair value of investments, equity interests, environmental and legal liabilities, income taxes and deferred tax valuation allowances, assumptions used in calculating pension and other postretirement employee benefit expenses and the fair value of stock based compensation. Due to the inherent uncertainty involved in making estimates, actual results reported in future periods may be different from these estimates.
Revenue RecognitionRevenue for sales of goods is recognized when a firm sales agreement is in place, delivery has occurred and sales price is fixed or determinable and collection is reasonably assured. If customer acceptance of products is not reasonably assured, sales are recorded only upon formal customer acceptance. Sales of goods typically do not include multiple product and/or service elements.
At the time revenue is recognized, allowances are recorded, with the related reduction to revenue, for estimated product returns, allowances and price discounts based upon historical experience and related terms of customer arrangements. Where we have offered product warranties, we also establish liabilities for estimated warranty costs based upon historical experience and specific warranty provisions. Warranty liabilities are adjusted when experience indicates the expected outcome will differ from initial estimates of the liability.
Other Income, Net“Other income, net” in Corning’s consolidated statements of income includes the following (in millions):
Years ended December 31,
2013 2012 2011Royalty income from Samsung Corning Precision Materials $ 56 $ 83 $ 219
Foreign currency transaction and hedge gains (losses), net 500 8 (43)
Loss on retirement of debt (26)Foreign government subsidy 55
Other, net 56 18 (58)
Total $ 667 $ 83 $ 118
Royalty income from Samsung Corning Precision Materials decreased in 2013, when compared to 2012, reflecting the decline in sales volume at Samsung Corning Precision Materials. In 2012, royalty income was significantly lower when compared to 2011, due to the reduction of the applicable royalty rate by approximately 50% beginning in December 2011.
Included in the line item Foreign currency transaction and hedge gains (losses), net, for the year ended December 31, 2013, is the impact of the purchased collars and average rate forward contracts, which hedge our exposure to movements in the Japanese yen and its impact on our net earnings. We recorded a net gain relating to the changes in the fair value
of these contracts, offset slightly by the premium expense, in the amount of $435 million in the year ended December 31, 2013.
Research and Development CostsResearch and development costs are charged to expense as incurred. Research and development costs totaled $613 million in 2013, $651 million in 2012 and $561 million in 2011.

CORNING INCORPORATED - 2013 Annual Report58
Notes to Consolidated Financial Statements
Foreign Currency Translation and TransactionsThe determination of the functional currency for Corning’s foreign subsidiaries is made based on the appropriate economic factors. For most foreign operations, the local currencies are generally considered to be the functional currencies. Corning’s most significant exception is our Taiwanese subsidiary, which uses the Japanese yen as its functional currency. For all transactions denominated in a currency other than a subsidiary’s functional currency, exchange rate gains and losses are included in income for the period in which the exchange rates changed.
Foreign subsidiary functional currency balance sheet accounts are translated at current exchange rates, and statement of operations accounts are translated at average exchange rates for the year. Translation gains and losses are recorded as a separate component of accumulated other comprehensive income in shareholders’ equity. The effects of remeasuring non-functional currency assets and liabilities into the functional currency are included in current earnings, except for those related to intra-entity foreign currency transactions of a long-term investment nature, which are recorded together with translation gains and losses in other comprehensive income in shareholders’ equity. Upon sale or substantially complete liquidation of an investment in a foreign entity, the amount of net translation gains or losses that have been accumulated in other comprehensive income attributable to that investment are reported as a gain or loss for the period in which the sale or liquidation occurs.
Stock-Based CompensationCorning’s stock-based compensation programs include employee stock option grants, time-based restricted stock awards, time-based restricted stock units, performance based restricted stock awards and performance-based restricted stock units, as more fully described in Note 19 (Share-based Compensation) to the Consolidated Financial Statements.
The cost of stock-based compensation awards is equal to the fair value of the award at the date of grant and compensation expense is recognized for those awards earned over the vesting period. Corning estimates the fair value of stock based awards using a multiple-point Black-Scholes option valuation model, which incorporates assumptions including expected volatility, dividend yield, risk-free rate, expected term and departure rates.
Cash and Cash EquivalentsCash equivalents consist of highly liquid investments that are readily convertible into cash. We consider securities with contractual maturities of three months or less, when purchased, to be cash equivalents. The carrying amount of these securities approximates fair value because of the short-term maturity of these instruments.
Supplemental disclosure of cash flow information follows (in millions):
Years ended December 31,
2013 2012 2011Non-cash transactions:
Issued credit memoranda for settlement of customer receivables(1) $ 28
Accruals for capital expenditures $ 185 $ 240 $ 472
Cash paid for interest and income taxes:
Interest(2) $ 182 $ 178 $ 140
Income taxes, net of refunds received $ 469 $ 355 $ 215
(1) Amounts represent credits applied to customer receivable balances for customers that made advance cash deposits under long-term purchase and supply agreements.
(2) Included in this amount are approximately $35 million, $74 million and $46 million of interest costs that were capitalized as part of property, net in 2013, 2012 and 2011, respectively.
Short-Term InvestmentsOur short-term investments consist of available-for-sale securities that are stated at fair value. Consistent with Corning’s cash investment policy, our short-term investments consist primarily of fixed-income securities. Preservation of principal is the primary principle of our cash investment policy that is carried out by limiting interest rate, reinvestment, security, quality and event risk. Our investments are generally liquid and all are investment grade quality. The portfolio is invested predominantly in U.S. Treasury securities and high quality short term government security money market funds. Unrealized gains and losses, net of tax, are computed on a specific identification basis and are reported as a separate component of accumulated other comprehensive loss in shareholders’ equity until realized. Realized gains and losses are recorded in other income (expense), net.
Allowance for Doubtful AccountsThe Company’s allowance for doubtful accounts is determined based on a variety of factors that affect the potential collectability of the related receivables, including length of time receivables are past due, customer credit ratings, financial stability of customers, specific one-time events and past customer history. In addition, in circumstances where the Company is made aware of a specific customer’s inability to meet its financial
obligations, a specific allowance is established. The majority of accounts are individually evaluated on a regular basis and appropriate reserves are established as deemed appropriate based on the above criteria.
Environmental LiabilitiesThe Company accrues for its environmental investigation, remediation, operating, and maintenance costs when it is probable that a liability has been incurred and the amount can be reasonably estimated. For environmental matters, the most likely cost to be incurred is accrued based on an evaluation of currently available facts with respect to each individual site, current laws and regulations and prior remediation experience. For sites with multiple potential responsible parties, the Company considers its likely proportionate share of the anticipated remediation costs and the ability of the other parties to fulfill their obligations in establishing a provision for those costs. Where no amount within a range of estimates is more likely to occur than another, the minimum amount is accrued. When future liabilities are determined to be reimbursable by insurance coverage, an accrual is recorded for the potential liability and a receivable is recorded related to the insurance reimbursement when reimbursement is virtually certain.

CORNING INCORPORATED - 2013 Annual Report 59
Notes to Consolidated Financial Statements
The uncertain nature inherent in such remediation and the possibility that initial estimates may not reflect the final outcome could result in additional costs being recognized by the Company in future periods.
InventoriesInventories are stated at the lower of cost (first-in, first-out basis) or market.
Property, Net of Accumulated DepreciationLand, buildings, and equipment, including precious metals, are recorded at cost. Depreciation is based on estimated useful lives of properties using the straight-line method. Except as described in Note 2 (Restructuring, Impairment and Other Charges) to the Consolidated Financial Statements related to accelerated depreciation arising from restructuring programs and Note 9 (Property, Net of Accumulated Depreciation) of the Consolidated Financial Statements related to the depletion of precious metals, the estimated useful lives range from 10 to 40 years for buildings and 2 to 20 years for equipment.
Included in the subcategory of equipment are the following types of assets (excluding precious metals):
Asset type Range of useful lifeComputer hardware and software 3 to 7 yearsManufacturing equipment 2 to 15 yearsFurniture and fixtures 5 to 10 yearsTransportation equipment 3 to 20 years
Manufacturing equipment includes certain components of production equipment that are constructed of precious metals. These assets are not depreciated because they have very low physical losses and are repeatedly reclaimed and reused in our manufacturing process over a very long useful life. We treat the physical loss of precious metals in the manufacturing and reclamation process as depletion and account for these losses as a period expense based on actual units lost. Precious metals are integral to many of our glass production processes. They are only acquired to support our operations and are not held for trading or other purposes.
Goodwill and Other Intangible AssetsGoodwill is the excess of cost of an acquired entity over the amounts assigned to assets acquired and liabilities assumed in a business combination. Goodwill relates to and is assigned directly to a specific reporting unit. Reporting units are either operating segments or one level below the operating segment. Impairment testing for goodwill is done at a reporting unit level. Goodwill is reviewed for indicators of impairment quarterly or if an event occurs or circumstances change that indicate the carrying amount may be impaired. Corning also performs a detailed, two-step process every three years if no indicators suggest a test should be performed in the interim. We use this calculation as quantitative validation of the step-zero qualitative process; this process does not represent an election to perform the two-step process in place of the step-zero review.
The qualitative process includes an extensive review of expectations for the long-term growth of our businesses and forecasting future cash flows. If we are required to perform the two-step impairment analysis, our valuation method is an “income approach” using a discounted cash flow model in which cash flows anticipated over several periods, plus a terminal value at the end of that time horizon, are discounted to their present value using an appropriate rate of return. Our estimates are based upon our historical experience, our current knowledge from our commercial relationships, and available external information about future trends. If the fair value is less than the carrying value, a loss is recorded to reflect the difference between the fair value and carrying value.
Other intangible assets include patents, trademarks, and other intangible assets acquired from an independent party. Such intangible assets have a definite life and are amortized on a straight-line basis over estimated useful lives ranging from 4 to 50 years.
Impairment of Long-Lived AssetsWe review the recoverability of our long-lived assets, such as plant and equipment and intangible assets, when events or changes in circumstances occur that indicate the carrying value of the asset or asset group may not be recoverable. When impairment indicators are present, we compare estimated undiscounted future cash flows, including the eventual disposition of the asset group at market value, to the assets’ carrying value to determine if the asset group is recoverable. For an asset group that fails the test of recoverability, the estimated fair value of long-lived assets is determined using an “income approach” that starts with the forecast of all the expected future net cash flows including the eventual disposition at market value of long-lived assets, and also considers the fair market value of all precious metals. We assess the recoverability of the carrying value of long-lived assets at the lowest level for which identifiable cash flows are largely independent of the cash flows of other assets and liabilities. If there is an impairment, a loss is recorded to reflect the difference between the assets’ fair value and carrying value. Refer to Note 2 (Restructuring, Impairment and Other Charges) to the Consolidated Financial Statements for more detail.
Treasury StockShares of common stock repurchased by us are recorded at cost as treasury stock and result in a reduction of shareholders’ equity in the consolidated balance sheets. From time to time, treasury shares may be reissued as contributions to our employee benefit plans and for the retirement or conversion of certain debt instruments. When shares are reissued, we use an average cost method for determining cost. The difference between the cost of the shares and the reissuance price is added to or deducted from additional paid-in capital.
Income TaxesThe Company accounts for income taxes using the asset and liability method. Under this method, deferred tax assets and liabilities are recognized for the future tax consequences attributable to operating loss and tax credit carry forwards and for differences between the carrying amounts of existing assets and liabilities and their respective tax bases.
The effective income tax rate reflects our assessment of the ultimate outcome of tax audits. In evaluating the tax benefits associated with our various tax filing positions, we record a tax benefit for uncertain tax positions using the highest cumulative tax benefit that is more likely than not to be realized. Adjustments are made to our liability for unrecognized tax benefits in the period in which we determine the issue is effectively settled with the tax authorities, the statute of limitations expires for the return containing the tax position or when new information becomes available. Our liability for unrecognized tax benefits, including accrued penalties and interest, is included in other accrued liabilities and other long-term liabilities on our consolidated balance sheets and in income tax expense in our consolidated statements of earnings.
Discrete events such as audit settlements or changes in tax laws are recognized in the period in which they occur. Valuation allowances are established when management is unable to conclude that it is more likely than not that some portion, or all, of the deferred tax asset will ultimately be realized.

CORNING INCORPORATED - 2013 Annual Report60
Notes to Consolidated Financial Statements
The Company is subject to income taxes in the United States and in numerous foreign jurisdictions. No provision is made for U.S. income taxes on the undistributed earnings of wholly-owned foreign subsidiaries because substantially all such earnings are indefinitely reinvested in those companies. Provision for the tax consequences of distributions, if any, from consolidated foreign subsidiaries is recorded in the year in which the earnings are no longer indefinitely reinvested in those subsidiaries.
Equity Method InvestmentsOur equity method investments are reviewed for impairment on a periodic basis or if an event occurs or circumstances change that indicate the carrying amount may be impaired. This assessment is based on a review of the equity investments’ performance and a review of indicators of impairment to determine if there is evidence of a loss in value of an equity investment. Factors we consider include:
• Absence of our ability to recover the carrying amount; • Inability of the equity affiliate to sustain an earnings capacity which would justify the carrying amount of the investment; and
• Significant litigation, bankruptcy or other events that could impact recoverability.
For an equity investment with impairment indicators, we measure fair value on the basis of discounted cash flows or other appropriate valuation methods, depending on the nature of the company involved. If it is probable that we will not recover the carrying amount of our investment, the impairment is considered other-than-temporary and recorded in earnings, and the equity investment balance is reduced to its fair value accordingly. We require our equity method affiliates to provide audited financial statements. Consequently, adjustments for asset recoverability are included in equity earnings. We also utilize these financial statements in our recoverability assessment.
Fair Value of Financial InstrumentsMajor categories of financial assets and liabilities, including short-term investments, other assets and derivatives are measured at fair value on a recurring basis. Certain assets and liabilities including long-lived assets, goodwill, asset retirement obligations, and cost and equity investments are measured at fair value on a nonrecurring basis.
Fair value is the price that would be received from selling an asset or paid to transfer a liability in an orderly transaction between market participants at the measurement date. When determining the fair value measurements for assets and liabilities required to be recorded at fair value, we consider the principal or most advantageous market in which we would transact and consider assumptions that market participants would use when pricing the asset or liability, such as inherent risk, transfer restrictions, and risk of nonperformance.
Derivative InstrumentsWe participate in a variety of foreign exchange forward contracts and foreign exchange option contracts entered into in connection with the management of our exposure to fluctuations in foreign exchange rates. We also entered into interest rate forwards to reduce the risk of changes in a benchmark interest rate from the probable forecasted issuance of debt. These financial exposures are managed in accordance with corporate policies and procedures.
All derivatives are recorded at fair value on the balance sheet. Changes in the fair value of derivatives designated as cash flow hedges and hedges of net investments in foreign operations are not recognized in current operating results but are recorded in accumulated other comprehensive income. Amounts related to cash flow hedges are reclassified from accumulated other comprehensive income when the underlying hedged
item impacts earnings. This reclassification is recorded in the same line item of the consolidated statement of operations as where the effects of the hedged item are recorded, typically sales, royalties, or cost of sales. Changes in the fair value of derivatives designated as fair value hedges are recorded currently in earnings offset, to the extent the derivative was effective, by the change in the fair value of the hedged item. Changes in the fair value of derivatives not designated as hedging instruments are recorded currently in earnings in the other income line of the consolidated statement of operations.
We have issued foreign currency denominated debt that has been designated as a hedge of the net investment in a foreign operation. The effective portion of the changes in fair value of the debt is reflected as a component of other comprehensive income as part of the foreign currency translation adjustment.
New Accounting StandardsIn July 2013, the FASB issued Accounting Standards Update No. 2013-11 Income Taxes (Topic 740): Presentation of an Unrecognized Tax Benefit When a Net Operating Loss Carryforward, a Similar Tax Loss or a Tax Credit Carryforward Exists. With certain exceptions, ASU 2013-11 requires entities to present an unrecognized tax benefit, or portion of an unrecognized tax benefit, as a reduction to a deferred tax asset for a net operating loss carryforward, a similar tax loss or a tax credit carryforward. The guidance is effective for interim and annual periods beginning after December 15, 2013 on either a prospective or retrospective basis with early adoption permitted. Corning does not expect adoption of this guidance to have a material impact on its consolidated results of operations and financial condition.
In July 2013, the FASB issued Accounting Standards Update No. 2013-10 Derivatives and Hedging (Topic 815): Inclusion of the Fed Funds Effective Swap Rate (or Overnight Index Swap Rate) as a Benchmark Interest Rate. ASU 2013-10 permits the use of the Fed Funds Effective Swap Rate as a benchmark interest rate for hedge accounting in addition to interest rates on direct Treasury obligation of the United States government and the LIBOR. In addition, the guidance removes the restriction on using different benchmark rates for similar hedges. The amendments in ASU 2013-10 are effective prospectively for qualifying new or redesignated hedging relationships entered into on or after July 17, 2013. The adoption of this guidance is not expected to have a material impact on the Company’s financial statements.
In March 2013, the FASB issued Accounting Standards Update No. 2013-05 Foreign Currency Matters (Topic 830): Parent’s Accounting for the Cumulative Translation Adjustment upon Derecognition of Certain Subsidiaries or Groups of Assets within a Foreign Entity or of an Investment in a Foreign Entity. ASU 2013-05 clarifies when to release the cumulative translation adjustment into net income for transactions involving the disposition of some or all of an investment or a business combination achieved in stages (step acquisitions). The amendments are effective prospectively for interim and annual periods beginning on or after December 15, 2013. Corning does not expect adoption of this guidance to have a material impact on its consolidated results of operations and financial condition.
In February 2013, the FASB issued Accounting Standards Update No. 2013-04 Liabilities (Topic 405): Obligations Resulting from Joint and Several Liability Arrangements for Which the Total Amount of the Obligation Is Fixed at the Reporting Date. ASU 2013-04 requires an entity to measure such obligations as the sum of the amount that the reporting entity agreed to pay on the basis of its arrangement with co-obligors and any additional amount the reporting entity expects to pay on behalf of its co-obligors. The guidance is effective for interim and annual periods beginning after December 15, 2013. Retrospective presentation for all comparative periods presented is required with early adoption permitted. Corning does not expect adoption of this guidance to have a material impact on its consolidated results of operations and financial condition.

CORNING INCORPORATED - 2013 Annual Report 61
Notes to Consolidated Financial Statements
2. Restructuring, Impairment and Other Charges
2013 ActivityTo better align our 2014 cost position in several of our businesses, Corning implemented a global restructuring plan within several of our segments in the fourth quarter of 2013, consisting of workforce reductions, asset disposals and write-offs, and exit costs. We recorded charges of $67 million
associated with these actions, with total cash expenditures expected to be approximately $40 million. Annualized savings from these actions are estimated to be approximately $40 million and will be reflected largely in selling, general, and administrative expenses.
The following table summarizes the restructuring, impairment and other charges as of and for the year ended December 31, 2013 (in millions):
Reserve at
January 1, 2013
NetCharges/Reversals
Non cash adjustments
Cash payments
Reserve atDecember 31, 2013
Restructuring:
Employee related costs $ 38 $ 34 $ (4) $ (32) $ 36
Other charges (credits) 4 7 (3) 8
Total restructuring activity $ 42 $ 41 $ (4) $ (35) $ 44
Impairment charges and disposal of long-lived assets $ 26
Total restructuring, impairment and other charges $ 67
Cash payments for employee-related and exit activity related to the 2013 corporate-wide restructuring plan are expected to be substantially completed in 2014.
The year-to-date cost of these plans for each of our reportable segments was as follows (in millions):
Operating segmentEmployee-related and other charges
Display Technologies $ 5
Optical Communications 13
Environmental Technologies 1
Specialty Materials 25
Life Sciences 3
Corporate and All Other 20
Total restructuring, impairment and other charges $ 67
2012 ActivityCorning implemented a corporate-wide restructuring plan in the fourth quarter of 2012 due to uncertain global economic conditions, and the potential for slower growth in many of our businesses in 2013. We recorded charges of $89 million, before tax, which included costs for workforce reductions, asset write-offs and exit costs. Total cash expenditures associated with these actions are expected to be approximately $49 million. Annualized savings from these actions are estimated to be approximately $71 million and will be reflected largely in selling, general, and administrative expenses.
The Specialty Materials segment recorded an impairment charge in the fourth quarter of 2011 in the amount of $130 million related to certain assets used in the production of large cover glass due to sales that were significantly below our expectations. In the fourth quarter of 2012, after
reassessing the large cover glass business, Corning concluded that the large cover glass market was developing differently in 2012 than our expectations, demand for larger-sized cover glass was declining, and the market for this type of glass was instead targeting smaller gen size products. Additionally, in the fourth quarter of 2012, our primary customer of large cover glass notified Corning of its decision to exit from this display market. Based on these events, we recorded an additional impairment charge in the fourth quarter of 2012 in the amount of $44 million, before tax. This impairment charge represents a write-down of assets specific to the glass-strengthening process for large size cover glass to their fair market values, and includes machinery and equipment used in the ion exchange process.

CORNING INCORPORATED - 2013 Annual Report62
Notes to Consolidated Financial Statements
The following table summarizes the restructuring, impairment and other charges as of and for the year ended December 31, 2012 (in millions):
Reserve at January 1,
2012
NetCharges/Reversals
Non cashadjustments
Cashpayments
Reserve atDecember 31, 2012
Restructuring:
Employee related costs $ 2 $ 47 $ (7) $ (4) $ 38
Other charges (credits) 8 5 (5) (4) 4
Total restructuring activity $ 10 $ 52 $ (12) $ (8) $ 42
Impairment charges and disposal of long-lived assets:
Assets to be held and used 44
Assets to be disposed of $ 37
Total asset impairment charges and disposals $ 81
Total restructuring, impairment and other charges $ 133
Cash payments for employee-related costs related to the 2012 corporate-wide restructuring plan were substantially completed in 2013. Cash payments for exit activities were substantially completed in 2012.
2011 ActivityDuring the fourth quarter of 2011, the Specialty Materials segment recorded an impairment charge related to certain assets used in the ion exchange process for the production of large cover glass. Although sales of Corning Gorilla Glass used in our large cover glass products increased in 2011 when compared to 2010, gross margins continued to be weak and sales volumes were significantly below our expectations in 2011 and both sales and margins were expected to be lower than forecasted in
2012. As a result, certain assets located in Japan used in the ion exchange process for the production of large cover glass were written down to estimated fair value in the fourth quarter of 2011 and an impairment loss of $130 million was recognized. This asset group includes machinery and equipment used in the ion exchange process and facilities dedicated to the ion exchange process.
The following table summarizes the restructuring, impairment and other charges as of and for the year ended December 31, 2011 (in millions):
Reserve at
January 1, 2011
Net charges/
(reversals) Cash
payments Reserve at
December 31, 2011Restructuring:
Employee related costs $ 15 $ (1) $ (12) $ 2
Other charges (credits) 12 (4) 8
Total restructuring activity $ 27 $ (1) $ (16) $ 10
Impairment of long-lived asset:
Assets to be held and used $ 130
Total impairment charges $ 130
Total restructuring, impairment and other charges $ 129
Cash payments for exit activities and employee-related costs related to the 2011 corporate-wide restructuring plan were substantially completed in 2012.
3. Available-for-Sale Investments
The following is a summary of the fair value of available-for-sale securities (in millions):
Amortized cost December 31, Fair value December 31,
2013 2012 2013 2012Bonds, notes and other securities:
U.S. government and agencies $ 530 $ 1,153 $ 531 $ 1,156
Total short-term investments $ 530 $ 1,153 $ 531 $ 1,156
Asset-backed securities $ 46 $ 51 $ 38 $ 40
Total long-term investments $ 46 $ 51 $ 38 $ 40
We do not intend to sell, nor do we believe it is more likely than not that we would be required to sell, the long-term investment asset-backed securities (which are collateralized by mortgages) before recovery of their amortized cost basis. It is possible that a significant degradation in the delinquency or foreclosure rates in the underlying assets could cause further temporary or other-than-temporary impairments in the future.

CORNING INCORPORATED - 2013 Annual Report 63
Notes to Consolidated Financial Statements
The following table summarizes the contractual maturities of available-for-sale securities at December 31, 2013 (in millions):
Less than one year $ 436
Due in 1-5 years 95
Due in 5-10 years 0
Due after 10 years(1) 38
Total $ 569(1) Included in the maturity table is $38 million of asset-based securities that mature over time and are being reported at their final maturity dates.
Unrealized gains and losses, net of tax, are computed on a specific identification basis and are reported as a separate component of accumulated other comprehensive loss in shareholders’ equity until realized.
The following tables provide the fair value and gross unrealized losses of the Company’s investments and unrealized losses that are not deemed to be other-than-temporarily impaired, aggregated by investment category and length of time that individual securities have been in a continuous unrealized loss position at December 31, 2013 and 2012:
(In millions)
Number of securities in
a loss position
December 31, 201312 months or greater
Total
Fair valueUnrealized
losses(1) Fair valueUnrealized
lossesAsset-backed securities 20 $ 38 $ (8) $ 38 $ (8)
Total long-term investments 20 $ 38 $ (8) $ 38 $ (8)(1) Unrealized losses in securities less than 12 months were not significant.
(In millions)
Number of securities in
a loss position
December 31, 201212 months or greater
Total
Fair valueUnrealized
losses(1) Fair valueUnrealized
losses Asset-backed securities 22 $ 40 $ (11) $ 40 $ (11)
Total long-term investments 22 $ 40 $ (11) $ 40 $ (11)(1) Unrealized losses in securities less than 12 months were not significant.
As of December 31, 2013 and 2012, for securities that have credit losses, an unrealized loss on other than temporary impaired securities of $6 million and $9 million, respectively, is recognized in accumulated other comprehensive income.
Proceeds from sales and maturities of short-term investments totaled $2 billion, $2.3 billion and $3.2 billion in 2013, 2012 and 2011, respectively.
4. Significant Customers
For 2013, Corning’s sales to AU Optronics Corporation, a customer of our Display Technology segment, represented 10% of the Company’s consolidated net sales. In 2012, no customers met or exceeded 10% of Corning’s consolidated net sales. For 2011, Corning’s sales to Sharp Electronics Corporation, a customer of our Display Technologies segment, represented 10% of the Company’s consolidated net sales.
5. Inventories
Inventories comprise the following (in millions):
December 31,
2013 2012Finished goods $ 486 $ 392
Work in process 234 168
Raw materials and accessories 311 271
Supplies and packing materials 239 220
Total inventories $ 1,270 $ 1,051

CORNING INCORPORATED - 2013 Annual Report64
Notes to Consolidated Financial Statements
6. Income Taxes
Income before income taxes follows (in millions):
Years ended December 31,
2013 2012 2011U.S. companies $ 1,274 $ 382 $ 988
Non-U.S. companies 1,199 1,593 2,243
Income before income taxes $ 2,473 $ 1,975 $ 3,231
The current and deferred amounts of the provision (benefit) for income taxes follow (in millions):
Years ended December 31,
2013 2012 2011Current:
Federal $ 3 $ (4) $ (2) State and municipal 12 3 6
Foreign 308 321 289
Deferred:
Federal 112 143 173
State and municipal 50 (8) 14
Foreign 27 (116) (66) Provision for income taxes $ 512 $ 339 $ 414
Amounts are reflected in the preceding tables based on the location of the taxing authorities.
Reconciliation of the U.S. statutory income tax rate to our effective tax rate for continuing operations follows:
Years ended December 31,
2013 2012 2011Statutory U.S. income tax rate 35.0% 35.0% 35.0%
State income tax (benefit), net of federal effect 0.6 0.2 0.1
Tax holidays(1)(1.2) (1.7) (2.0)
Investment and other tax credits(2)(2.0) (1.1) (0.7)
Rate difference on foreign earnings (8.1)(4)
(2.4) (4.5)
Equity earnings impact(3)(6.6) (13.6) (14.9)
Dividend repatriation 0.2 0.4 (0.4)(5)
Valuation allowances 3.1(6)
(0.1) 0.4
Other items, net (0.3) 0.5 (0.2)
Effective income tax (benefit) rate* 20.7% 17.2% 12.8%* Includes impact of defined benefit pension plan methodology change implemented in the first quarter of 2013 and retrospectively applied to
prior periods.(1) Primarily related to a subsidiary in Taiwan operating under tax holiday arrangements. The nature and extent of such arrangements vary, and
the benefits of existing arrangements phase out in future years (through 2018). The impact of tax holidays on net income per share on a diluted basis was $0.02 in 2013, $0.02 in 2012 and $0.04 in 2011.
(2) Primarily related to research and development credits in U.S. (3) Equity in earnings of nonconsolidated affiliates reported in the financials net of tax. The decrease from 2012 – 2013 was driven by significantly
lower earnings from Samsung Corning Precision Materials.(4) $74 million of tax benefit increase was due to $37 million expense recorded in 2012 that was reversed in the first quarter of 2013 as a result of
the retroactive application of the American Taxpayer Relief Act enacted on January 3, 2013. Additional increase in the benefit was attributable to excess foreign tax credits realized in U.S.
(5) Includes benefit of amending 2006 U.S. Federal return to claim foreign tax credits.(6) Primarily related to change in judgment on the realizability of Australia and certain state deferred tax assets.

CORNING INCORPORATED - 2013 Annual Report 65
Notes to Consolidated Financial Statements
The tax effects of temporary differences and carryforwards that gave rise to significant portions of the deferred tax assets and liabilities follows (in millions):
December 31,
2013 2012Loss and tax credit carryforwards $ 1,788 $ 1,923
Other Assets 63 72
Asset impairments and restructuring reserves 172 168
Postretirement medical and life benefits 290 357
Fixed assets 85 89
Other accrued liabilities 320 268
Other employee benefits 387 486
Gross deferred tax assets 3,105 3,363
Valuation allowance (286) (210)
Total deferred tax assets 2,819 3,153
Intangible and other assets (321) (246)
Total deferred tax liabilities (321) (246)
Net deferred tax assets $ 2,498 $ 2,907
The net deferred tax assets are classified in our consolidated balance sheets as follows (in millions):
December 31,
2013 2012Current deferred tax assets $ 278 $ 579
Non-current deferred tax assets 2,234 2,343
Current deferred tax liabilities (1) (4)Non-current deferred tax liabilities (13) (11)
Net deferred tax assets $ 2,498 $ 2,907
Details on deferred tax assets for loss and tax credit carryforwards at December 31, 2013 follow (in millions):
AmountExpiration
2014-2018 2019-2023 2024-2033 IndefiniteNet operating losses $ 429 $ 86 $ 124 $ 219
Capital losses 7 7 Tax credits 1,352 169 999 $ 143 41
Totals as of December 31, 2013 $ 1,788 $ 262 $ 1,123 $ 143 $ 260
The recognition of windfall tax benefits from stock-based compensation deducted on the tax return is prohibited until realized through a reduction of income tax payable. Cumulative tax benefits totaling $313 million will be recorded in additional paid-in-capital when the net operating loss and credit carry forwards are utilized and the windfall tax benefit can be realized.
Deferred tax assets are to be reduced by a valuation allowance if, based on the weight of available positive and negative evidence, it is more likely than not (a likelihood of greater than 50 percent) that some portion or all of the
deferred tax assets will not be realized. Corning has valuation allowances on certain shorter-lived deferred tax assets such as those represented by capital loss carry forwards and state tax net operating loss carry forwards, as well as other foreign net operating loss carryforwards and federal and state tax credits, because we cannot conclude that it is more likely than not that we will earn income of the character required to utilize these assets before they expire. The amount of U.S. and foreign deferred tax assets that have remaining valuation allowances at December 31, 2013 and 2012 was $286 million and $210 million, respectively.
The following is a tabular reconciliation of the total amount of unrecognized tax benefits (in millions):
2013 2012Balance at January 1 $ 16 $ 21
Additions based on tax positions related to the current year 1 1
Additions for tax positions of prior years 2
Reductions for tax positions of prior years Settlements and lapse of statute of limitations (2) (8)
Balance at December 31 $ 15 $ 16

CORNING INCORPORATED - 2013 Annual Report66
Notes to Consolidated Financial Statements
Included in the balance at December 31, 2013 and 2012 are $7 million and $11 million, respectively, of unrecognized tax benefits that would impact our effective tax rate if recognized.
We recognize accrued interest and penalties associated with uncertain tax positions as part of tax expense. For the years ended December 31, 2013, 2012 and 2011, the amounts recognized in interest expense and income were immaterial. The amounts accrued at December 31, 2013 and 2012 for the payment of interest and penalties were not significant.
While we expect the amount of unrecognized tax benefits to change in the next 12 months, we do not expect the change to have a significant impact on the results of operations or our financial position.
Corning Incorporated, as the common parent company, and all 80%-or-more-owned of its U.S. subsidiaries join in the filing of consolidated U.S. federal income tax returns. All such returns for periods ended through December 31, 2004, have been audited by and settled with the Internal Revenue Service (IRS). The statute of limitations to audit the 2007, 2008 and 2009 U.S. federal income tax expired in 2011, 2012 and 2013, respectively. The statute for the 2005 tax return has closed except to the extent the loss generated in 2005 is utilized in future years. The statute for U.S. foreign tax and research and experimentation credit carryforwards generated through 2009 will remain open until the credits are utilized in future years.
Corning Incorporated and its U.S. subsidiaries file income tax returns on a combined, unitary or stand-alone basis in multiple state and local
jurisdictions, which generally have statutes of limitations ranging from 3 to 5 years. Various state income tax returns are currently in the process of examination or administrative appeal.
Our foreign subsidiaries file income tax returns in the countries in which they have operations. Generally, these countries have statutes of limitations ranging from 3 to 7 years. Years still open to examination by foreign tax authorities in major jurisdictions include Japan (2008 onward) and Taiwan (2012 onward).
Corning continues to indefinitely reinvest substantially all of its foreign earnings, with the exception of approximately $12 million of earnings that have very low or no tax cost associated with their repatriation. Our current analysis indicates that we have sufficient U.S. liquidity, including borrowing capacity, to fund foreseeable U.S. cash needs without requiring the repatriation of foreign cash. One time or unusual items that may impact our ability or intent to keep our foreign earnings and cash indefinitely reinvested include significant U.S. acquisitions, stock repurchases, shareholder dividends, changes in tax laws and/or a change in our circumstances or economic conditions that negatively impact our ability to borrow or otherwise fund U.S. needs from existing U.S. sources. As of December 31, 2013, taxes have not been provided on approximately $12.4 billion of accumulated foreign unremitted earnings that are expected to remain invested indefinitely. While it remains impracticable to calculate the tax cost of repatriating our total unremitted foreign earnings, such cost could be material to the results of operations of Corning in a particular period.
7. Investments
Investments comprise the following (in millions):
Ownership interest(1)
December 31,2013 2012
Affiliated companies accounted for by the equity method
Samsung Corning Precision Materials 57% $ 3,709 $ 3,346
Dow Corning 50% 1,420 1,191
All other 20% to 50% 390 375
5,519 4,912
Other investments 18 3
Total $ 5,537 $ 4,915(1) Amounts reflect Corning’s direct ownership interests in the respective affiliated companies. Corning does not control any of such entities.

CORNING INCORPORATED - 2013 Annual Report 67
Notes to Consolidated Financial Statements
Affiliated Companies at EquityThe results of operations and financial position of the investments accounted for under the equity method follow (in millions):
Years ended December 31,2013 2012 2011
Statement of operations(2):
Net sales $ 8,526 $ 9,957 $ 11,381
Gross profit $ 2,655 $ 3,628 $ 5,161
Net income $ 1,135 $ 1,541 $ 2,925
Corning’s equity in earnings of affiliated companies $ 547 $ 810 $ 1,471
Related party transactions:Corning sales to affiliated companies $ 13 $ 50 $ 30
Corning purchases from affiliated companies $ 189 $ 167 $ 138
Corning transfers of assets, at cost, to affiliated companies(1) $ 37 $ 55 $ 113
Dividends received from affiliated companies $ 629 $ 1,089 $ 820
Royalty income from affiliated companies $ 57 $ 84 $ 221
Corning services to affiliates $ 2 $ 24 $ 50
December 31,2013 2012
Balance sheet(2):
Current assets $ 8,416 $ 8,458
Noncurrent assets $ 12,220 $ 13,457
Short-term borrowings, including current portion of long-term debt $ 79 $ 209
Other current liabilities $ 1,886 $ 1,985
Long-term debt $ 937 $ 847
Other long-term liabilities $ 6,502 $ 7,681
Non-controlling interest $ 619 $ 708
Related party transactions:Balances due from affiliated companies $ 45 $ 61
Balances due to affiliated companies $ 5 $ 37
(1) Corning purchases machinery and equipment on behalf of Samsung Corning Precision Materials to support its capital expansion initiatives. The machinery and equipment are transferred to Samsung Corning Precision Materials at our cost basis, resulting in no revenue or gain being recognized on the transaction.
(2) As a result of the series of strategic and financial agreements with Samsung Display entered into on October 22, 2013, certain non-operating assets of Samsung Corning Precision Materials were held for sale as of December 31, 2013 and are reported as discontinued operations in Samsung Corning Precision Materials financial statements, which are attached in Item 15, Exhibits and Financial Statement Schedules. Previous period amounts have been conformed for comparative purposes.
We have contractual agreements with several of our equity affiliates which include sales, purchasing, licensing and technology agreements.
At December 31, 2013, approximately $4.7 billion of equity in undistributed earnings of equity companies was included in our retained earnings.

CORNING INCORPORATED - 2013 Annual Report68
Notes to Consolidated Financial Statements
A discussion and summarized results of Corning’s significant affiliates at December 31, 2013 follows:
Samsung Corning Precision Materials Co., Ltd. (Samsung Corning Precision Materials)Samsung Corning Precision Materials is a South Korea-based manufacturer of liquid crystal display glass for flat panel displays.
Samsung Corning Precision Materials’ financial position and results of operations follow (in millions):
Years ended December 31,2013 2012 2011
Statement of operations(2):
Net sales $ 2,149 $ 2,965 $ 3,939
Gross profit $ 1,196 $ 2,000 $ 2,887
Net income attributable to Samsung Corning Precision Materials $ 649 $ 1,390 $ 2,061
Corning’s equity in earnings of Samsung Corning Precision Materials $ 320 $ 699 $ 1,031
Related party transactions:Corning sales to Samsung Corning Precision Materials $ 7 $ 22
Corning purchases from Samsung Corning Precision Materials $ 160 $ 126 $ 107
Corning transfer of machinery and equipment to Samsung Corning Precision Materials at cost(1) $ 37 $ 55 $ 113
Dividends received from Samsung Corning Precision Materials $ 518 $ 979 $ 492
Royalty income from Samsung Corning Precision Materials $ 56 $ 83 $ 219
December 31,2013 2012
Balance sheet(2):
Current assets $ 3,565 $ 3,491
Noncurrent assets $ 3,522 $ 3,895
Other current liabilities $ 337 $ 405
Other long-term liabilities $ 211 $ 253
Non-controlling interest $ 10 $ 12
(1) Corning purchases machinery and equipment on behalf of Samsung Corning Precision Materials to support its capital expansion initiatives. The machinery and equipment are transferred to Samsung Corning Precision Materials at our cost basis, resulting in no revenue or gain being recognized on the transaction.
(2) As a result of the series of strategic and financial agreements with Samsung Display entered into on October 22, 2013, certain non-operating assets of Samsung Corning Precision Materials were held for sale as of December 31, 2013 and are reported as discontinued operations in Samsung Corning Precision Materials financial statements, which are attached in Item 15, Exhibits and Financial Statement Schedules. Previous period amounts have been conformed for comparative purposes.
In the year ended December 31, 2013, Corning’s equity earnings were negatively impacted by $54 million as a result of higher taxes due to the partial expiration of tax holidays in Korea.
Balances due from Samsung Corning Precision Materials were $8 million at December 31, 2013. Balances due to Samsung Corning Precision Materials were $2 million at December 31, 2013. Balances due from Samsung Corning Precision Materials were $15 million at December 31, 2012. Balances due to Samsung Corning Precision Materials were $34 million at December 31, 2012.
Prior to December 2013, Corning owned 50% of Samsung Corning Precision Materials, Samsung Display Co., Ltd. owned 43% and three shareholders owned the remaining 7%. In the fourth quarter of 2013, in connection with a series of strategic and financial agreements with Samsung Display announced in October 2013, Corning acquired the minority interests of three shareholders in Samsung Corning Precision Materials for $506 million, which included payment for the transfer of non-operating assets and the pro-rata portion of cash on Samsung Corning Precision Materials balance sheet at September 30, 2013. The resulting transfer of shares to Corning increased Corning’s ownership percentage of Samsung Corning
Precision Materials from 50% to 57%. Because this transaction did not result in a change in control based on the governing articles of this entity, Corning did not consolidate this entity as of December 31, 2013. On January 15, 2014, Corning completed the series of strategic and financial agreements to acquire the common shares of Samsung Corning Precision Materials previously held by Samsung Display Co., Ltd. As a result of these transactions, Corning is now the owner of 100% of the common shares of Samsung Corning Precision Materials, which we will consolidate into our results beginning in the first quarter of 2014.
In April 2011, South Korean tax authorities completed a tax audit of Samsung Corning Precision Materials. As a result, the tax authorities issued a pre-assessment of approximately $46 million for an asserted underpayment of withholding tax on dividends paid from September 2006 through March 2009. Our first level of appeal was denied on October 5, 2011 and a formal assessment was issued. The assessment was paid in full in the fourth quarter of 2011, allowing us to continue the appeal process. Samsung Corning Precision Materials and Corning believe we will maintain our position when all available appeal remedies have been exhausted.

CORNING INCORPORATED - 2013 Annual Report 69
Notes to Consolidated Financial Statements
On December 31, 2007, Samsung Corning Precision Materials acquired all of the outstanding shares of Samsung Corning Co., Ltd. (Samsung Corning). After the transaction, Corning retained its 50% interest in Samsung Corning Precision Materials. Prior to their merger, Samsung Corning Precision Materials and Samsung Corning were two of approximately thirty co-defendants in a lawsuit filed by Seoul Guarantee Insurance Co. and thirteen other creditors (SGI and Creditors) for alleged breach of an agreement that approximately twenty-eight affiliates of the Samsung group (Samsung Affiliates) entered into with SGI and Creditors on August 24, 1999 (the Agreement). The lawsuit is pending in the courts of South Korea. Under the Agreement, it is alleged that the Samsung Affiliates agreed to sell certain shares of Samsung Life Insurance Co., Ltd. (SLI), which had been transferred to SGI and Creditors in connection with the petition for court receivership of Samsung Motors Inc. In the lawsuit, SGI and Creditors allege a breach of the Agreement by the Samsung Affiliates and are seeking the loss of principal (approximately $1.95 billion) for loans extended to Samsung Motors Inc., default interest and a separate amount for breach. On January 31, 2008, the Seoul District Court ordered the Samsung Affiliates: to pay approximately $1.3 billion by disposing
of 2,334,045 shares of SLI less 1,165,955 shares of SLI previously sold by SGI and Creditors and paying the proceeds to SGI and Creditors; to satisfy any shortfall by participating in the purchase of equity or subordinate debentures issued by them; and pay default interest of 6% per annum. The ruling was appealed. On November 10, 2009, the Appellate Court directed the parties to attempt to resolve this matter through mediation. On January 11, 2011, the Appellate Court ordered the Samsung Affiliates to pay 600 billion won in principal and 20 billion won in delayed interest to SGI and Creditors. Samsung promptly paid those amounts, which approximated $550 million when translated to United States dollars, from a portion of an escrow account established upon completion of SLI’s initial public offering (IPO) on May 7, 2010. On February 7, 2011, the Samsung Affiliates appealed the Appellate Court’s ruling to the Supreme Court of Korea and the appeal is currently in progress. Samsung Corning Precision Materials has not contributed to any payment related to these disputes, and has concluded that no provision for loss should be reflected in its financial statements. Other than as described above, no claim in these matters has been asserted against Corning or any of its affiliates.
Dow CorningDow Corning is a U.S.-based manufacturer of silicone products. Corning and Dow Chemical each own half of Dow Corning.
Dow Corning’s financial position and results of operations follow (in millions):
Years ended December 31,2013 2012 2011
Statement of operations:
Net sales $ 5,711 $ 6,119 $ 6,427
Gross profit(1) $ 1,280 $ 1,413 $ 1,989
Net income attributable to Dow Corning $ 376 $ 181 $ 806
Corning’s equity in earnings of Dow Corning $ 196 $ 90 $ 404
Related party transactions:Corning purchases from Dow Corning $ 22 $ 23 $ 22
Dividends received from Dow Corning $ 100 $ 100 $ 310
December 31,2013 2012
Balance sheet:
Current assets $ 3,996 $ 4,117
Noncurrent assets $ 8,306 $ 9,184
Short-term borrowings, including current portion of long-term debt $ 79 $ 209
Other current liabilities $ 1,267 $ 1,304
Long-term debt $ 937 $ 844
Other long-term liabilities $ 6,240 $ 7,371
Non-controlling interest $ 606 $ 687
(1) Gross profit for the year ended December 31, 2013 includes R&D cost of $248 million (2012: $281 million and 2011: $259 million) and selling expenses of $13 million (2012: $15 million and $2011: $25 million).
Beginning in the latter half of 2011, and continuing into 2012, Dow Corning began experiencing unfavorable industry conditions at Hemlock, a producer of high purity polycrystalline silicon for the semiconductor and solar industries, driven by over-capacity at all levels of the solar industry supply chain. This over-capacity led to significant declines in polycrystalline spot prices in the fourth quarter of 2011, and prices remained depressed throughout 2012. In 2013, markets stabilized, but prices remained significantly below historical levels.
Due to the conditions and uncertainties during 2012 described above, sales volume declined and production levels of certain operating assets were reduced. As a result, in the fourth quarter of 2012, Dow Corning determined
that a polycrystalline silicon plant expansion previously delayed since the fourth quarter of 2011 would no longer be economically viable and made the decision to abandon this expansion activity. The abandonment resulted in an impairment charge of $57 million, before tax, for Corning’s share of the write down in the value of these construction-in-progress assets. Further, the startup of another polycrystalline silicon plant expansion that was expected to begin production in 2013 was delayed and the assets remain idled. Production will only commence when sales volumes increase to levels necessary to support the plant’s capacity. The timing for startup of this expansion is uncertain and future adverse conditions may cause Dow Corning to re-evaluate the long-term viability of the idled assets.

CORNING INCORPORATED - 2013 Annual Report70
Notes to Consolidated Financial Statements
Additionally, during the fourth quarter of 2012, these negative events and circumstances at Dow Corning indicated that assets of Dow Corning’s polycrystalline silicon business might be impaired. In accordance with accounting guidance for impairment of long-lived assets, Dow Corning compared estimated undiscounted cash flows to the assets’ carrying value and determined that the asset group was recoverable as of December 31, 2012. Upon receiving the preliminary determination notices from MOFCOM in the third quarter of 2013, Dow Corning again evaluated whether the polycrystalline silicon assets might be impaired. The estimate of future undiscounted cash flows continued to indicate the assets were expected to be recovered. However, it is reasonably possible that the estimate of undiscounted cash flows may change in the near term resulting in the need to write down those assets to fair value. Dow Corning’s estimate of cash flows might change as a result of continued pricing deterioration, ongoing oversupply in the market, or other adverse market conditions that result in non-performance by customers under long-term contracts. Corning’s share of the carrying value of this asset group is approximately $1.0 billion.
In July 2012, MOFCOM initiated antidumping and countervailing duty investigations of imports of solar-grade polycrystalline silicon products from the U.S. and Korea based on a petition filed by Chinese solar-grade polycrystalline silicon producers. The petition alleged that producers within these countries exported solar-grade polycrystalline silicon to China at less than fair value and that production of solar-grade polycrystalline silicon in the U.S. has been subsidized by the U.S. government. On July 18, 2013, MOFCOM announced its preliminary determination that China’s solar-grade polycrystalline silicon industry suffered material damage because of dumping by producers in the U.S. and Korea. The Chinese authorities imposed provisional antidumping duties on producers in the U.S. and Korea ranging from 2.4% to 57.0%, including duties of 53.3% on future imports of solar-grade polycrystalline silicon product from the Dow Corning subsidiary into China. On September 16, 2013, the Chinese authorities imposed provisional countervailing duties of 6.5%. On January 20, 2014, MOFCOM issued a final determination. The final determination resulted in no change to the antidumping duties, and the countervailing duties were reduced to 2.1%. The requirement for customers to pay provisional duties on imports from solar-grade polycrystalline silicon producers became effective on July 24, 2013 for the antidumping duties and on September 20, 2013 for the countervailing duties, adjusted for the final determination. Dow Corning will not be subject to duties for previous sales, and is evaluating possible actions in response to the final determination.
In 1995, Corning fully impaired its investment in Dow Corning after it filed for bankruptcy protection. Corning did not recognize net equity earnings from the second quarter of 1995 through the end of 2002. Corning began recognizing equity earnings in the first quarter of 2003 when management concluded that Dow Corning’s emergence from bankruptcy was probable. Corning considers the $171 million difference between the carrying value of its investment in Dow Corning and its 50% share of Dow Corning’s equity to be permanent.
Corning and Dow Chemical each own 50% of the common stock of Dow Corning. In May 1995, Dow Corning filed for bankruptcy protection to address pending and claimed liabilities arising from many thousands of breast implant product lawsuits. On June 1, 2004, Dow Corning emerged from Chapter 11 with a Plan of Reorganization (the Plan) which provided for the settlement or other resolution of implant claims. The Plan also includes releases for Corning and Dow Chemical as shareholders in exchange for contributions to the Plan.
Under the terms of the Plan, Dow Corning has established and is funding a Settlement Trust and a Litigation Facility to provide a means for tort claimants to settle or litigate their claims. Inclusive of insurance, Dow Corning has paid approximately $1.8 billion to the Settlement Trust. As of December 31, 2013, Dow Corning had recorded a reserve for breast implant litigation of $1.6 billion.
As a separate matter arising from the bankruptcy proceedings, Dow Corning is defending claims asserted by a number of commercial creditors who claim additional interest at default rates and enforcement costs, during the period from May 1995 through June 2004. As of December 31, 2013, Dow Corning has estimated the liability to commercial creditors to be within the range of $94 million to $309 million. As Dow Corning management believes no single amount within the range appears to be a better estimate than any other amount within the range, Dow Corning has recorded the minimum liability within the range. Should Dow Corning not prevail in this matter, Corning’s equity earnings would be reduced by its 50% share of the amount in excess of $94 million, net of applicable tax benefits. There are a number of other claims in the bankruptcy proceedings against Dow Corning awaiting resolution by the U.S. District Court, and it is reasonably possible that Dow Corning may record bankruptcy-related charges in the future. The remaining tort claims against Dow Corning are expected to be channeled by the Plan into facilities established by the Plan or otherwise defended by the Litigation Facility.
Pittsburgh Corning Corporation and Asbestos Litigation Corning and PPG Industries, Inc. (PPG) each own 50% of the capital stock of Pittsburgh Corning Corporation (PCC). Over a period of more than two decades, PCC and several other defendants have been named in numerous lawsuits involving claims alleging personal injury from exposure to asbestos. On April 16, 2000, PCC filed for Chapter 11 reorganization in the U.S. Bankruptcy Court for the Western District of Pennsylvania. At the time PCC filed for bankruptcy protection, there were approximately 11,800 claims pending against Corning in state court lawsuits alleging various theories of liability based on exposure to PCC’s asbestos products and typically requesting monetary damages in excess of one million dollars per claim. Corning has defended those claims on the basis of the separate corporate status of PCC and the absence of any facts supporting claims of direct liability arising from PCC’s asbestos products.
PCC Plan of Reorganization
Corning, with other relevant parties, has been involved in ongoing efforts to develop a Plan of Reorganization that would resolve the concerns and objections of the relevant courts and parties. On November 12, 2013, the Bankruptcy Court issued a decision finally confirming an Amended PCC Plan of Reorganization (the “Amended PCC Plan” or the “Plan”).
Under this Plan, Corning is required to contribute its equity interests in PCC and Pittsburgh Corning Europe N.V. (PCE), a Belgian corporation, and to contribute $290 million in a fixed series of payments, recorded at present value. Corning has the option to use its shares rather than cash to make these payments, but the liability is fixed by dollar value and not the number of shares. The Plan requires Corning to make: (1) one payment of $70 million one year from the date the Plan becomes effective and certain conditions are met; and (2) five additional payments of $35 million, $50 million, $35 million, $50 million, and $50 million, respectively, on each of the five subsequent anniversaries of the first payment, the final payment of which is subject to reduction based on the application of credits under certain circumstances.
The Bankruptcy Court’s confirmation of the Plan must be affirmed by the District Court, and two objectors to the Plan have appealed the Bankruptcy Court’s confirmation of the Plan to the District Court. Assuming the District Court affirms the confirmation, that decision may be appealed. If that occurs, it could take many months for the confirmation of the Plan to be finally affirmed.

CORNING INCORPORATED - 2013 Annual Report 71
Notes to Consolidated Financial Statements
Non-PCC Asbestos Litigation
In addition to the claims against Corning related to its ownership interest in PCC, Corning is also the defendant in approximately 9,700 other cases (approximately 37,400 claims) alleging injuries from asbestos related to its Corhart business and similar amounts of monetary damages per case. When PCC filed for bankruptcy protection, the Court granted a preliminary injunction to suspend all asbestos cases against PCC, PPG and Corning – including these non-PCC asbestos cases (the “stay”). The stay remains in place as of the date of this filing. Under the Bankruptcy Court’s order confirming the Amended PCC Plan, the stay will remain in place until the Amended PCC Plan is finally affirmed. These non-PCC asbestos cases have been covered by insurance without material impact to Corning to date. As of December 31, 2013, Corning had received for these cases approximately $19 million in insurance payments related to those claims. If and when the Bankruptcy Court’s confirmation of the Amended PCC Plan is affirmed, these non-PCC asbestos claims would be allowed to proceed against Corning. Corning has recorded in its estimated asbestos litigation liability an additional $150 million for these and any future non-PCC asbestos cases.
Total Estimated Liability for the Amended PCC Plan and the Non-PCC Asbestos Claims
The liability for the Amended PCC Plan and the non-PCC asbestos claims was estimated to be $690 million at December 31, 2013, compared with an estimate of liability of $671 million at December 31, 2012. For the years
ended December 31, 2013 and 2012, Corning recorded asbestos litigation expense of $19 million and $14 million, respectively. The entire obligation is classified as a non-current liability as installment payments for the cash portion of the obligation are not planned to commence until more than 12 months after the Amended PCC Plan becomes effective and the PCE portion of the obligation will be fulfilled through the direct contribution of Corning’s investment in PCE (currently recorded as a non-current other equity method investment).
Non-PCC Asbestos Cases Insurance Litigation
Several of Corning’s insurers have commenced litigation in state courts for a declaration of the rights and obligations of the parties under insurance policies, including rights that may be affected by the potential resolutions described above. Corning is vigorously contesting these cases, and management is unable to predict the outcome of the litigation.
At December 31, 2013 and 2012, the fair value of PCE significantly exceeded its carrying value of $167 million and $149 million, respectively. There have been no impairment indicators for our investment in PCE and we continue to recognize equity earnings of this affiliate. PCC filed for Chapter 11 reorganization in the U.S. Bankruptcy Court on April 16, 2000. At that time, Corning determined it lacked the ability to recover the carrying amount of its investment in PCC and its investment was other than temporarily impaired. As a result, we reduced our investment in PCC to zero.
8. Acquisition
On January 15, 2014, Corning completed a series of strategic and financial agreements with Samsung Display, previously announced on October 22, 2013, to acquire the remaining 50% of the common shares of Samsung Corning Precision Materials. As a result of these transactions, Corning is the owner of 100% of the common shares of Samsung Corning Precision Materials. We have not completed our accounting for the acquisition by the date of the filing of our 2013 Form 10-K, and, therefore, have not included detailed disclosure in this note. Refer to Note 21 (Subsequent Events) for additional details on the transaction.
There were no significant acquisitions for the year ended December 31, 2013.
On October 31, 2012, Corning acquired all of the shares of Discovery Labware, Inc. and Plasso Technology Limited and certain other assets (collectively referred to as “Purchased Assets”) from Becton Dickinson and Company for approximately $739 million. The Purchased Assets constitute a business; therefore, the acquisition was accounted for as a business combination. The business, referred to as Discovery Labware, designs, manufactures, markets and supplies cell culture, other laboratory reagents, core and advanced consumables for basic and applied research for life scientists, clinical researchers, and laboratory professionals globally.
The purchase price of the acquisition was allocated to the net tangible and other intangible assets acquired, with the remainder recorded as goodwill on the basis of fair value as follows (in millions):
Inventory and other current assets $ 74
Fixed Assets 81
Other intangible assets 279
Net tangible and intangible assets $ 434
Purchase price 739
Goodwill(1) $ 305
(1) The goodwill recognized is deductible for U.S. income tax purposes. The goodwill was allocated to the Life Sciences segment.
Goodwill is primarily related to the value of the Discovery Labware product portfolio and distribution network and its combination with Corning’s existing life sciences platform, as well as synergies and other intangibles that do not qualify for separate recognition. Other intangible assets consist mainly of distributor relationships, trademark and trade names and are amortized over a useful life of 20 years. Acquisition-related
costs of $22 million in the twelve months ended December 31, 2012 included costs for legal, accounting, valuation and other professional services and were included in selling, general and administrative expense in the Consolidated Statements of Income. Supplemental pro forma information was not provided because the purchased assets are not material to Corning’s consolidated financial statements.

CORNING INCORPORATED - 2013 Annual Report72
Notes to Consolidated Financial Statements
9. Property, Net of Accumulated Depreciation
Property, net follows (in millions):
December 31,2013 2012
Land $ 121 $ 112
Buildings 4,175 4,324
Equipment 12,286 12,571
Construction in progress 1,084 1,270
17,666 18,277
Accumulated depreciation (7,865) (7,652)
Total $ 9,801 $ 10,625
Approximately $35 million, $74 million and $46 million of interest costs were capitalized as part of property, net in 2013, 2012 and 2011, respectively.
Manufacturing equipment includes certain components of production equipment that are constructed of precious metals. At December 31, 2013 and 2012, the recorded value of precious metals totaled $2.2 billion and $2.4 billion, respectively. Depletion expense related to the years ended December 31, 2013, 2012 and 2011 totaled $20 million, $20 million and $21 million, respectively.
During the fourth quarter of 2012, the Specialty Materials segment recorded an impairment charge of $44 million related to certain assets located in Japan used in the ion exchange process for the production of large cover glass. The large cover glass impairment charge represents a write-down of assets specific to the glass-strengthening process for large size cover glass to their relative fair market values as of the date of impairment. As a result of the impairment, assets included in the category of equipment decreased by approximately $44 million.
10. Goodwill and Other Intangible Assets
GoodwillChanges in the carrying amount of goodwill for the twelve months ended December 31, 2013 and 2012 are as follows (in millions):
OpticalCommunications
Display Technologies
Specialty Materials Life Sciences Total
Balance at December 31, 2011 $ 209 $ 9 $ 150 $ 296 $ 664
Acquired goodwill(1)310 310
Balance at December 31, 2012 $ 209 $ 9 $ 150 $ 606 $ 974
Acquired goodwill(2)32 32
Measurement period adjustment(1)(4) (4)
Foreign currency translation adjustment (1) 1
Balance at December 31, 2013 $ 240 $ 9 $ 150 $ 603 $ 1,002
(1) The Company recorded the acquisition of the Discovery Labware business of Becton Dickinson and Company in the fourth quarter of 2012. In the second quarter of 2013, Corning recorded measurement period adjustments. Refer to Note 8 (Acquisition) to the Consolidated Financial Statements for additional information.
(2) The company recorded a small acquisition and consolidated an equity company due to a change in control in the second quarter of 2013.
Corning’s gross goodwill balance for the fiscal years ended December 31, 2013 and 2012 were $7.5 billion and $7.4 billion, respectively. Accumulated impairment losses were $6.5 billion for the fiscal years ended December 31, 2013 and 2012, respectively, and were generated entirely through goodwill impairments related to the Optical Communications segment.

CORNING INCORPORATED - 2013 Annual Report 73
Notes to Consolidated Financial Statements
Other Intangible AssetsOther intangible assets follow (in millions):
December 31,2013 2012
GrossAccumulated amortization Net Gross
Accumulated amortization Net
Amortized intangible assets:
Patents, trademarks & trade names $ 290 $ 138 $ 152 $ 282 $ 128 $ 154
Customer list and other 436 48 388 394 26 368
Total $ 726 $ 186 $ 540 $ 676 $ 154 $ 522
Amortized intangible assets are primarily related to the Optical Communications and Life Sciences segments. The net carrying amount of intangible assets increased $18 million during the year ended December 31, 2013, primarily due to a small acquisition completed in the second quarter of 2013, and the consolidation of an equity company due to a change in control. This was offset by amortization of $31 million and foreign currency translation adjustments of $6 million.
Amortization expense related to these intangible assets is estimated to be $32 million annually from 2014 to 2018.
11. Other Liabilities
Other accrued liabilities follow (in millions):
December 31,2013 2012
Current liabilities:
Wages and employee benefits $ 445 $ 460
Income taxes 139 282
Other current liabilities 370 359
Other accrued liabilities $ 954 $ 1,101
Non-current liabilities:Asbestos litigation $ 690 $ 671
Other non-current liabilities 793 903
Other liabilities $ 1,483 $ 1,574
Asbestos LitigationThe proposed resolution of PCC asbestos claims under the Amended PCC Plan would have required Corning to contribute its equity interests in PCC and Pittsburgh Corning Europe N.V. (PCE), a Belgian corporation, and to contribute a fixed series of payments, recorded at present value. Corning would have had the option to use its shares rather than cash to make these payments, but the liability would have been fixed by dollar value and not the number of shares. The Amended PCC Plan would, originally, have required Corning to make (1) one payment of $100 million one year from the date the Amended PCC Plan becomes effective and certain conditions are met and (2) five additional payments of $50 million, on each of the five subsequent anniversaries of the first payment, the final payment of which is subject to reduction based on the application of credits under certain circumstances. Documents were filed with the Bankruptcy Court further modifying the Amended PCC Plan by reducing Corning’s initial payment by $30 million and reducing its second and fourth payments by $15 million each. In return, Corning would relinquish
its claim for reimbursement of its payments and contributions under the Amended PCC Plan from the insurance carriers involved in the bankruptcy proceeding with certain exceptions.
The Amended PCC Plan does not include certain non-PCC asbestos claims that may be or have been raised against Corning. Corning has recorded in its estimated asbestos litigation liability an additional $150 million for the approximately 9,700 current non-PCC cases alleging injuries from asbestos, and for any future non-PCC cases. The liability for non-PCC claims was estimated based upon industry data for asbestos claims since Corning does not have recent claim history due to the injunction issued by the Bankruptcy Cou rt. The estimated liability represents the undiscounted projection of claims and related legal fees over the next 20 years. The amount may need to be adjusted in future periods as more data becomes available. Refer to Note 7 (Investments) to the Consolidated Financial Statements for additional information on the asbestos litigation.

CORNING INCORPORATED - 2013 Annual Report74
Notes to Consolidated Financial Statements
12. Debt
(In millions)December 31,
2013 2012Current portion of long-term debt $ 21 $ 76
Long term debtDebentures, 6.75%, due 2013 $ 49
Debentures, 8.875%, due 2016 $ 67 68
Debentures, 1.45%, due 2017 250 249
Debentures, 6.625%, due 2019 238 250
Debentures, 4.25%, due 2020 276 297
Debentures, 8.875%, due 2021 70 71
Debentures, 3.70%, due 2023 249
Medium-term notes, average rate 7.66%, due through 2023 45 45
Debentures, 7.00%, due 2024 99 99
Debentures, 6.85%, due 2029 172 173
Debentures, callable, 7.25%, due 2036 249 249
Debentures, 4.70%, due 2037 250 250
Debentures, 5.75%, due 2040 398 398
Debentures, 4.75%, due 2042 499 500
Other, average rate 6.00%, due through 2042 431 760
Total long term debt 3,293 3,458
Less current portion of long-term debt 21 76
Long-term debt $ 3,272 $ 3,382
At December 31, 2013 and 2012, the weighted-average interest rate on current portion of long-term debt was 2.6% and 5.3%, respectively.
Based on borrowing rates currently available to us for loans with similar terms and maturities, the fair value of long-term debt was $3.5 billion at December 31, 2013 and $3.7 billion at December 31, 2012. The measurement of the fair value of long term debt was determined using Level 2 inputs.
The following table shows debt maturities by year at December 31, 2013 (in millions)*:
2014 2015 2016 2017 2018 Thereafter$ 21 $ 9 $ 72 $ 257 $ 3 $ 2,940
* Excludes interest rate swap gains and bond discounts.
Debt Issuances and Retirements
2013 • In the first quarter of 2013, we amended and restated our existing revolving credit facility. The amended facility provides a $1.0 billion unsecured multi-currency line of credit that expires in March 2018. The facility includes a leverage test (debt to capital ratio) financial covenant. As of December 31, 2013, we were in compliance with this covenant. The proceeds of this credit facility may be used for general corporate purposes, including support for our commercial paper program.
• In the first quarter of 2013, Corning repaid the aggregate principal amount and accrued interest outstanding on the credit facility entered into in the second quarter of 2011 that allowed Corning to borrow up to Chinese Renminbi (RMB) 4.0 billion. The total amount repaid was approximately $500 million. Upon repayment, this facility was terminated.
• In the second quarter of 2013, the Company established a commercial paper program on a private placement basis, pursuant to which we may issue short-term, unsecured commercial paper notes up to a maximum aggregate principal amount outstanding at any time of $1 billion. Under this program, the Company may issue the notes from time to time and will use the proceeds for general corporate purposes. The maturities
of the notes will vary, but may not exceed 390 days from the date of issue. The interest rates will vary based on market conditions and the ratings assigned to the notes by credit rating agencies at the time of issuance. The Company’s $1 billion revolving credit facility is available to support obligations under the commercial paper program, if needed. At December 31, 2013, we did not have any outstanding commercial paper.
• In the fourth quarter of 2013, we issued $250 million of 3.70% senior unsecured notes that mature on November 15, 2023. The net proceeds of approximately $248 million were used for general corporate purposes.
• In the fourth quarter of 2013, we recorded a financing obligation in the approximate amount of $230 million for a new LCD glass substrate facility in China.
2012 • In the first quarter of 2012, we issued $500 million of 4.75% senior unsecured notes that mature on March 15, 2042 and $250 million of 4.70% senior unsecured notes that mature on March 15, 2037. The net proceeds of $742 million were used for general corporate purposes.

CORNING INCORPORATED - 2013 Annual Report 75
Notes to Consolidated Financial Statements
• In the fourth quarter of 2012, we completed the following debt-related transactions: – We issued $250 million of 1.45% senior unsecured notes that mature
on November 15, 2017. The net proceeds of $248 million from the offering were used for general corporate purposes.
– We repurchased $13 million of our 8.875% senior unsecured notes due 2021, $11 million of our 8.875% senior unsecured notes due 2016, and $51 million of our 6.75% senior unsecured notes due 2013. Additionally, we redeemed $100 million of our 5.90% senior unsecured notes due 2014 and $74 million of our 6.20% senior unsecured notes due 2016. We recognized a pre-tax loss of $26 million upon the early redemption of these notes.
• In 2012, we borrowed the equivalent of approximately $377 million from a Chinese Renminbi credit facility that a wholly-owned subsidiary entered into in the second quarter of 2011.
2011 • In the second quarter of 2011, a wholly-owned subsidiary entered into a credit facility that allows Corning to borrow up to Chinese Renminbi (RMB) 4.0 billion, or approximately $642 million when translated to United States Dollars. Corning was able to request advances during the eighteen month period beginning on June 30, 2011 (the “Availability Period”). The time period for Corning to draw under the RMB facility expired at the end of 2012. Our financing agreement requires us to repay the aggregate principal amount and accrued interest outstanding at the end of the Availability Period in six installments, with the final payment due in August 2016, five years from the date of the first advance. Corning also has the right to repay this loan in full at pre-determined dates with no pre-payment penalty. In 2011, Corning borrowed approximately $120 million under this credit facility.
13. Employee Retirement Plans
Defined Benefit PlansWe have defined benefit pension plans covering certain domestic and international employees. Our funding policy has been to contribute, as necessary, an amount in excess of the minimum requirements in order to achieve the Company’s long-term funding targets. In 2013, we did not contribute to our domestic defined benefit pension plan and contributed $5 million to our international pension plans. In 2012, we made voluntary cash contributions of $75 million to our domestic defined benefit pension plan and $30 million to our international pension plans. Although we will not be subject to any mandatory contributions in 2014, we anticipate making voluntary cash contributions of up to $85 million to our U.S. pension plan and up to $8 million to our international pension plans in 2014.
As discussed in Note 1 to the financial statements, in the first quarter of 2013, we elected to change our method of recognizing actuarial gains and losses for our defined benefit pension plans. We did not make this change in accounting for our OPEB plans, and continue to defer all actuarial gains and losses and amortize those amounts outside of the corridor over future periods.
Corning offers postretirement plans that provide health care and life insurance benefits for retirees and eligible dependents. Certain employees may become eligible for such postretirement benefits upon reaching retirement age. For current retirees (including surviving spouses) and active employees eligible for the salaried retiree medical program, we have placed a “cap” on the amount we will contribute toward retiree medical coverage in the future. The cap is equal to 120% of our 2005 contributions toward retiree medical benefits. Once our contributions toward salaried retiree medical costs reach this cap, impacted retirees will have to pay the excess amount in addition to their regular contributions for coverage. This cap was attained for post-65 retirees in 2008 and has impacted their contribution rate in 2009 and going forward. The pre-65 retirees triggered the cap in 2010, which has impacted their contribution rate in 2011 and going forward. Furthermore, employees hired or rehired on or after January 1, 2007 will be eligible for Corning retiree medical benefits upon retirement; however, these employees will pay 100% of the cost.

CORNING INCORPORATED - 2013 Annual Report76
Notes to Consolidated Financial Statements
Obligations and Funded StatusThe change in benefit obligation and funded status of our employee retirement plans follows (in millions):
December 31,Pension benefits Postretirement benefits
2013 2012 2013 2012Change in benefit obligation
Benefit obligation at beginning of year $ 3,630 $ 3,224 $ 987 $ 957 Service cost 70 62 13 13 Interest cost 131 154 39 45 Plan participants’ contributions 1 1 14 12 Amendments 3 (4) Actuarial loss (gain) (362) 409 (178) 20
Other 2 5 5 1 Benefits paid (177) (239) (61) (66)
Medicare subsidy received 1 5 Foreign currency translation 5 11 (1) Benefit obligation at end of year $ 3,300 $ 3,630 $ 815 $ 987 Change in plan assets Fair value of plan assets at beginning of year $ 2,975 $ 2,770 Actual gain on plan assets 71 309 Employer contributions 20 122 Plan participants’ contributions 1 1 Benefits paid (177) (239) Foreign currency translation 6 12 Fair value of plan assets at end of year $ 2,896 $ 2,975 Funded status at end of year Fair value of plan assets $ 2,896 $ 2,975 Benefit obligations (3,300) (3,630) $ (815) $ (987)
Funded status of plans $ (404) $ (655) $ (815) $ (987)Amounts recognized in the consolidated balance sheets consist of:
Noncurrent asset $ 23 $ 14 Current liability (15) (31) $ (49) $ (57)
Noncurrent liability (412) (638) (766) (930)
Recognized liability $ (404) $ (655) $ (815) $ (987)Amounts recognized in accumulated other comprehensive income consist of:
Net actuarial loss(1) $ 132 $ 363 $ 82 $ 274 Prior service cost (credit) 21 25 (29) (29)
Amount recognized at end of year(1) $ 153 $ 388 $ 53 $ 245 (1) Amounts for prior years were revised for the change in our method of recognizing pension expense. See Note 1, Summary of Significant
Accounting Policies, of Notes to Consolidated Financial Statements for a discussion of the change and the impacts of the change for the year ended December 31, 2012.
The accumulated benefit obligation for defined benefit pension plans was $3.2 billion and $3.5 billion at December 31, 2013 and 2012, respectively.
The following information is presented for pension plans where the projected benefit obligation and the accumulated benefit obligation as of December 31, 2013 and 2012 exceeded the fair value of plan assets (in millions):
December 31,2013 2012
Projected benefit obligation $ 447 $ 3,371
Accumulated benefit obligation $ 417 $ 3,196
Fair value of plan assets $ 20 $ 2,702
In 2013, the fair value of plan assets exceeded the accumulated benefit obligation for the United States and the United Kingdom pension plans.

CORNING INCORPORATED - 2013 Annual Report 77
Notes to Consolidated Financial Statements
The components of net periodic benefit expense for our employee retirement plans follow (in millions):
Pension benefits Postretirement benefits2013 2012 2011 2013 2012 2011
Service cost $ 70 $ 62 $ 53 $ 13 $ 13 $ 13
Interest cost 131 154 156 39 45 49
Expected return on plan assets(1)(169) (161) (167)
Amortization of net loss(1) 15 15 18
Amortization of prior service cost (credit) 5 8 9 (6) (6) (6)
Recognition of actuarial (gain) loss(1)(30) 217 64
Total net periodic benefit expense(1)$ 7 $ 280 $ 115 $ 61 $ 67 $ 74
Other changes in plan assets and benefit obligations recognized in other comprehensive income:
Current year actuarial loss (gain) $ (264) $ 257 $ 107 $ (178) $ 20 $ (31)
Recognition of actuarial gain (loss)(1)30 (217) (64)
Amortization of actuarial loss(1) (15) (16) (18)
Current year prior service (credit)/loss 3 3 (5)
Amortization of prior service (cost) credit (5) (8) (9) 6 6 6
Total recognized in other comprehensive (income) loss(1) $ (239) $ 35 $ 37 $ (192) $ 10 $ (43)
Total recognized in net periodic benefit cost and other comprehensive (income) loss(1) $ (232) $ 315 $ 152 $ (131) $ 77 $ 31
(1) Amounts for prior years were revised for the change in our method of recognizing pension expense. See Note 1, Summary of Significant Accounting Policies, of Notes to Consolidated Financial Statements for a discussion of the change and the impacts of the change for the years ended December 31, 2012 and 2011.
The Company expects to recognize $4 million of net prior service cost as components of net periodic pension cost in 2014 for its defined benefit pension plans. The Company expects to recognize $1 million of net loss and $6 million of net prior service credit as components of net periodic postretirement benefit cost in 2014.
Corning uses a hypothetical yield curve and associated spot rate curve to discount the plan’s projected benefit payments. Once the present value of projected benefit payments is calculated, the suggested discount rate is equal to the level rate that results in the same present value. The yield curve is based on actual high-quality corporate bonds across the full
maturity spectrum, which also includes private placements as well as Eurobonds that are denominated in U.S. currency. The curve is developed from yields on approximately 350-375 bonds from four grading sources, Moody’s, S&P, Fitch and the Dominion Bond Rating Service. A bond will be included if at least half of the grades from these sources are Aa, non-callable bonds. The very highest 10% yields and the lowest 40% yields are excluded from the curve to eliminate outliers in the bond population.
Measurement of postretirement benefit expense is based on assumptions used to value the postretirement benefit obligation at the beginning of the year.
The weighted-average assumptions used to determine benefit obligations at December 31 follow:
Pension benefits Postretirement benefitsDomestic International Domestic
2013 2012 2011 2013 2012 2011 2013 2012 2011Discount rate 4.75% 3.75% 4.75% 4.08% 4.48% 4.40% 4.75% 4.00% 4.75%
Rate of compensation increase 4.00% 4.00% 4.25% 3.85% 3.45% 3.44%
The weighted-average assumptions used to determine net periodic benefit cost for years ended December 31 follow:
Pension benefits Postretirement benefitsDomestic International Domestic
2013 2012 2011 2013 2012 2011 2013 2012 2011Discount rate 3.75% 4.75% 5.25% 4.48% 4.40% 4.75% 4.00% 4.75% 5.25%Expected return on plan assets 6.00% 6.00% 6.50% 3.73% 6.01% 5.59% Rate of compensation increase 4.00% 4.25% 4.25% 3.45% 3.44% 4.35%

CORNING INCORPORATED - 2013 Annual Report78
Notes to Consolidated Financial Statements
The assumed rate of return was determined based on the current interest rate environment and historical market premiums relative to fixed income rates of equities and other asset classes. Reasonableness of the results is tested using models provided by the plan actuaries.
Assumed health care trend rates at December 31 2013 2012Health care cost trend rate assumed for next year 7% 7.5%Rate that the cost trend rate gradually declines to 5% 5%Year that the rate reaches the ultimate trend rate 2020 2018
Assumed health care cost trend rates have a significant effect on the amounts reported for the health care plans. A one-percentage-point change in assumed health care cost trend rates would have the following effects (in millions):
One-percentage-point increase
One-percentage-point decrease
Effect on annual total of service and interest cost $ 3 $ (3)
Effect on postretirement benefit obligation $ 54 $ (45)
Plan AssetsCorning’s expected long-term rate of return on plan assets reflects the average rate of earnings expected on the funds invested to provide for the benefits included in the projected benefit obligation. We based this rate on asset/liability forecast modeling, which is based on our current asset allocation, the return and standard deviation for each asset class, current market conditions and transitions from current conditions to long-term returns.
The Company’s overall investment strategy is to obtain sufficient return to offset or exceed inflation and provide adequate liquidity to meet the benefit obligations of the pension plan. Investments are made in public securities to ensure adequate liquidity to support benefit payments.
Domestic and international stocks and bonds provide diversification to the portfolio. The target allocation range for domestic equity investment is 10.0%-12.5% which includes large, mid and small cap companies. The target allocation range of international equities is 10.0%-12.5%, which includes investments in both developed and emerging markets. The target allocation for bond investments is 60%, which predominately includes both government and corporate bonds. Long duration fixed income assets are utilized to mitigate the sensitivity of funding ratios to changes in interest rates. The target allocation range for non-public investments in private equity and real estate is 5%-15%, and is used to enhance returns and offer additional asset diversification. The target allocation range for commodities is 0%-5%, which provides some inflation protection to the portfolio.
The following tables provide fair value measurement information for the Company’s major categories of defined benefit plan assets:
(in millions) December 31, 2013
Fair value measurements at reporting date usingQuoted prices in active markets
for identical assets (Level 1)
Significant other observable
inputs (Level 2)
Significant unobservable
inputs (Level 3) Equity securities:
U.S. companies $ 331 $ 216 $ 115
International companies 316 118 198
Fixed income:U.S. corporate bonds 1,538 142 1,396
International fixed income 245 185 60
Other fixed incomePrivate equity(1)
207 $ 207
Real estate(2)93 93
Insurance contracts 6 6
Cash equivalents 60 60
Commodities(3)100 100
Total $ 2,896 $ 721 $ 1,869 $ 306(1) This category includes venture capital, leverage buyouts and distressed debt limited partnerships invested primarily in U.S. companies. The
inputs are valued by internally generated Discounted Cash Flow Analysis and comparable sale analysis.(2) This category includes industrial, office, apartments, hotels, infrastructure, and retail investments which are limited partnerships predominately
in the U.S. The inputs are valued by internally generated Discounted Cash Flow Analysis; comparable sale analysis and periodic external appraisals.
(3) This category includes investments in energy, industrial metals, precious metals, agricultural and livestock primarily through futures, options, swaps, and exchange traded funds.
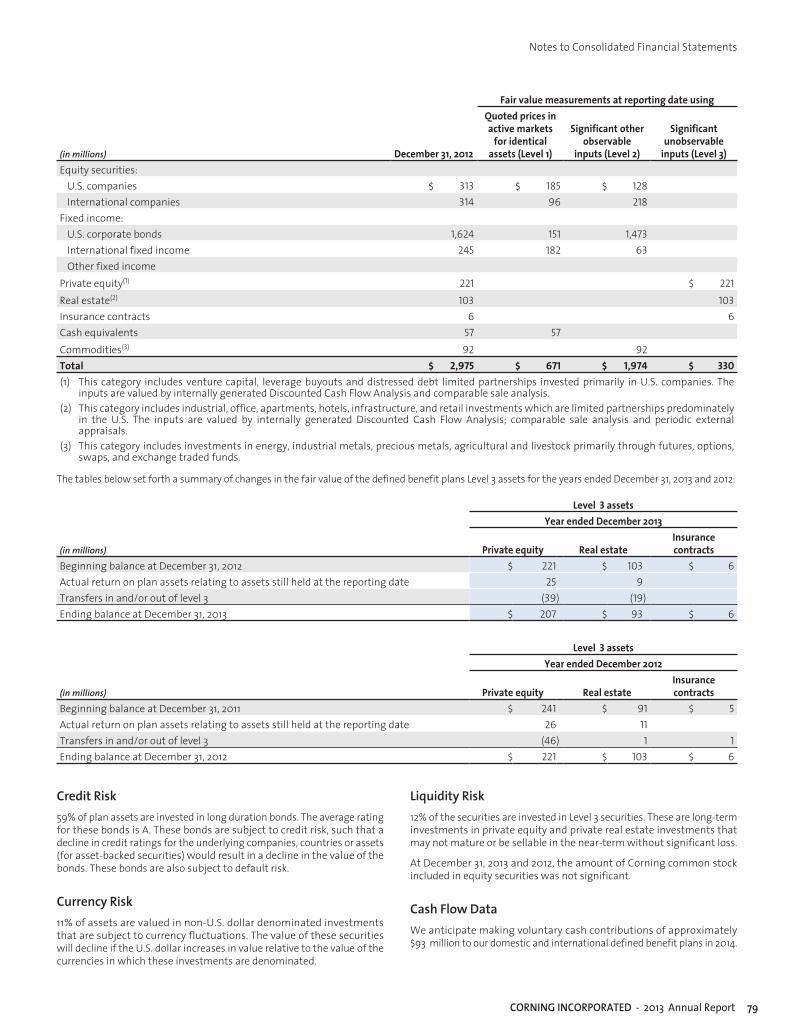
CORNING INCORPORATED - 2013 Annual Report 79
Notes to Consolidated Financial Statements
(in millions) December 31, 2012
Fair value measurements at reporting date usingQuoted prices in active markets
for identical assets (Level 1)
Significant other observable
inputs (Level 2)
Significant unobservable
inputs (Level 3)Equity securities:
U.S. companies $ 313 $ 185 $ 128
International companies 314 96 218
Fixed income:U.S. corporate bonds 1,624 151 1,473
International fixed income 245 182 63
Other fixed incomePrivate equity(1)
221 $ 221
Real estate(2)103 103
Insurance contracts 6 6
Cash equivalents 57 57
Commodities(3)92 92
Total $ 2,975 $ 671 $ 1,974 $ 330(1) This category includes venture capital, leverage buyouts and distressed debt limited partnerships invested primarily in U.S. companies. The
inputs are valued by internally generated Discounted Cash Flow Analysis and comparable sale analysis.(2) This category includes industrial, office, apartments, hotels, infrastructure, and retail investments which are limited partnerships predominately
in the U.S. The inputs are valued by internally generated Discounted Cash Flow Analysis; comparable sale analysis and periodic external appraisals.
(3) This category includes investments in energy, industrial metals, precious metals, agricultural and livestock primarily through futures, options, swaps, and exchange traded funds.
The tables below set forth a summary of changes in the fair value of the defined benefit plans Level 3 assets for the years ended December 31, 2013 and 2012:
(in millions)
Level 3 assetsYear ended December 2013
Private equity Real estateInsurance contracts
Beginning balance at December 31, 2012 $ 221 $ 103 $ 6
Actual return on plan assets relating to assets still held at the reporting date 25 9
Transfers in and/or out of level 3 (39) (19)
Ending balance at December 31, 2013 $ 207 $ 93 $ 6
(in millions)
Level 3 assetsYear ended December 2012
Private equity Real estateInsurance contracts
Beginning balance at December 31, 2011 $ 241 $ 91 $ 5
Actual return on plan assets relating to assets still held at the reporting date 26 11
Transfers in and/or out of level 3 (46) 1 1
Ending balance at December 31, 2012 $ 221 $ 103 $ 6
Credit Risk59% of plan assets are invested in long duration bonds. The average rating for these bonds is A. These bonds are subject to credit risk, such that a decline in credit ratings for the underlying companies, countries or assets (for asset-backed securities) would result in a decline in the value of the bonds. These bonds are also subject to default risk.
Currency Risk11% of assets are valued in non-U.S. dollar denominated investments that are subject to currency fluctuations. The value of these securities will decline if the U.S. dollar increases in value relative to the value of the currencies in which these investments are denominated.
Liquidity Risk12% of the securities are invested in Level 3 securities. These are long-term investments in private equity and private real estate investments that may not mature or be sellable in the near-term without significant loss.
At December 31, 2013 and 2012, the amount of Corning common stock included in equity securities was not significant.
Cash Flow DataWe anticipate making voluntary cash contributions of approximately $93 million to our domestic and international defined benefit plans in 2014.

CORNING INCORPORATED - 2013 Annual Report80
Notes to Consolidated Financial Statements
The following reflects the gross benefit payments that are expected to be paid for the domestic and international plans and the gross amount of annual Medicare Part D federal subsidy expected to be received (in millions):
Expected benefit paymentsExpected federal
subsidy payments postretirement
benefitsPension benefits
Postretirement benefits
2014 $ 193 $ 48 $ 3
2015 $ 214 $ 50 $ 3
2016 $ 199 $ 50 $ 3
2017 $ 203 $ 50 $ 3
2018 $ 207 $ 50 $ 3
2019-2023 $ 1,138 $ 245 $ 19
Other Benefit PlansWe offer defined contribution plans covering employees meeting certain eligibility requirements. Total consolidated defined contribution plan expense was $63 million, $50 million and $44 million for the years ended December 31, 2013, 2012 and 2011, respectively.
14. Commitments, Contingencies, and Guarantees
The amounts of our obligations follow (in millions):
Total
Amount of commitment and contingency expiration per period
Less than 1 year 1 to 3 years 3 to 5 years5 years and thereafter
Performance bonds and guarantees $ 51 $ 24 $ 5 $ 1 $ 21
Credit facilities for equity companies 25 25
Stand-by letters of credit(1)61 54 3 1 3
Loan guarantees 14 14
Subtotal of commitment expirations per period $ 151 $ 103 $ 8 $ 2 $ 38
Purchase obligations(6) $ 126 $ 67 $ 39 $ 13 $ 7
Capital expenditure obligations(2)185 185
Total debt(3)2,890 14 66 249 2,561
Interest on long-term debt(4)2,602 151 299 286 1,866
Capital leases and financing obligations(3)412 7 15 11 379
Imputed interest on capital leases and financing obligations 295 20 39 38 198
Minimum rental commitments 277 54 80 53 90
Uncertain tax positions(5)3 1 2
Subtotal of contractual obligation payments due by period 6,790 499 540 650 5,101
Total commitments and contingencies $ 6,941 $ 602 $ 548 $ 652 $ 5,139(1) At December 31, 2013, $41 million of the $61 million was included in other accrued liabilities on our consolidated balance sheets.(2) Capital expenditure obligations primarily reflect amounts associated with our capital expansion activities.(3) Total debt above is stated at maturity value, and excludes interest rate swap gains and bond discounts.(4) The estimate of interest payments assumes interest is paid through the date of maturity or expiration of the related debt, based upon stated
rates in the respective debt instruments.(5) At December 31, 2013, $5 million was included on our balance sheet related to uncertain tax positions. Of this amount, we are unable to estimate
when $2 million of that amount will become payable.(6) Purchase obligations are enforceable and legally binding obligations which primarily consist of raw material and energy-related take-or-pay
contracts.

CORNING INCORPORATED - 2013 Annual Report 81
Notes to Consolidated Financial Statements
We are required, at the time a guarantee is issued, to recognize a liability for the fair value or market value of the obligation it assumes. In the normal course of our business, we do not routinely provide significant third-party guarantees. Generally, third-party guarantees provided by Corning are limited to certain financial guarantees, including stand-by letters of credit and performance bonds, and the incurrence of contingent liabilities in the form of purchase price adjustments related to attainment of milestones. These guarantees have various terms, and none of these guarantees are individually significant.
In the fourth quarter of 2013, we recorded a financing obligation in the approximate amount of $230 million for a new LCD glass substrate facility in China.
We have agreed to provide up to a $25 million credit facility to Dow Corning. The funding of the Dow Corning credit facility will be required only if Dow Corning is not otherwise able to meet its scheduled funding obligations in its confirmed Bankruptcy Plan.
We believe a significant majority of these guarantees and contingent liabilities will expire without being funded.
Minimum rental commitments under leases outstanding at December 31, 2013 follow (in millions):
2014 2015 2016 2017 20182019 and
thereafter$ 54 $ 44 $ 36 $ 27 $ 26 $ 90
Total rental expense was $85 million for 2013, $80 million for 2012 and $84 million for 2011.
A reconciliation of the changes in the product warranty liability for the year ended December 31 follows (in millions):
2013 2012Balance at January 1 $ 6 $ 23
Adjustments for warranties issued for current year sales 7 3
Adjustments for warranties related to prior year sales (3) (20)
Settlements made during the current year (1)
Balance at December 31 $ 9 $ 6
Corning is a defendant in various lawsuits, including environmental, product-related suits, the Dow Corning and PCC matters discussed in Note 7(Investments) to the Consolidated Financial Statements, and is subject to various claims that arise in the normal course of business. In the opinion of management, the likelihood that the ultimate disposition of these matters will have a material adverse effect on Corning’s consolidated financial position, liquidity, or results of operations, is remote. Other than certain asbestos related claims, there are no other material loss contingencies related to litigation.
Corning has been named by the Environmental Protection Agency (the Agency) under the Superfund Act, or by state governments under similar state laws, as a potentially responsible party for 15 active hazardous waste sites. Under the Superfund Act, all parties who may have contributed any waste to a hazardous waste site, identified by the Agency, are jointly and severally liable for the cost of cleanup unless the Agency agrees otherwise. It is Corning’s policy to accrue for its estimated liability related to Superfund sites and other environmental liabilities related to property owned by
Corning based on expert analysis and continual monitoring by both internal and external consultants. At December 31, 2013 and December 31,2012, Corning had accrued approximately $15 million (undiscounted) and $21 million (undiscounted), respectively, for the estimated liability for environmental cleanup and related litigation. Based upon the information developed to date, management believes that the accrued reserve is a reasonable estimate of the Company’s liability and that the risk of an additional loss in an amount materially higher than that accrued is remote.
The ability of certain subsidiaries and affiliated companies to transfer funds is limited by provisions of foreign government regulations, affiliate agreements and certain loan agreements. At December 31, 2013, the amount of equity subject to such restrictions for consolidated subsidiaries and affiliated companies was not significant. While this amount is legally restricted, it does not result in operational difficulties since we have generally permitted subsidiaries to retain a majority of equity to support their growth programs.
15. Hedging Activities
Corning is exposed to interest rate and foreign currency risks due to the movement of these rates.
The areas in which exchange rate fluctuations affect us include:
• Financial instruments and transactions denominated in foreign currencies, which impact earnings; and
• The translation of net assets in foreign subsidiaries for which the functional currency is not the U.S. dollar, which impacts our net equity.
Our most significant foreign currency exposures relate to the Japanese yen, South Korean won, New Taiwan dollar, Chinese Renminbi, and the Euro. We seek to mitigate the impact of exchange rate movements in our income statement by using over-the-counter (OTC) derivative instruments including foreign exchange forward and option contracts typically with
durations of 36 months or less. In general, these hedges expire coincident with the timing of the underlying foreign currency commitments and transactions.
We are exposed to potential losses in the event of non-performance by our counterparties to these derivative contracts. However, we minimize this risk by limiting the counterparties to a diverse group of highly-rated major international financial institutions with which we have other financial relationships. We do not expect to record any losses as a result of such counterparty default. Neither we nor our counterparties are required to post collateral for these financial instruments. In July 2013, the Finance Committee of the Board of Directors approved the Company’s qualification for and election of the end-user exception to the mandatory swap clearing requirement of the Dodd-Frank Act.

CORNING INCORPORATED - 2013 Annual Report82
Notes to Consolidated Financial Statements
Cash Flow HedgesOur cash flow hedging activities utilize OTC foreign exchange forward contracts to reduce the risk that movements in exchange rates will adversely affect the net cash flows resulting from the sale of products to foreign customers and purchases from foreign suppliers. Our cash flow hedging activity also uses interest rate swaps to reduce the risk of increases in benchmark interest rates on the probable issuance of debt and associated interest payments. Corning uses a regression analysis to monitor the effectiveness of its cash flow hedges both prospectively and retrospectively. Through December 31, 2013, the hedge ineffectiveness related to these instruments is not material. Corning defers net gains and losses related to effective portion of cash flow hedges into accumulated other comprehensive (loss) income on the consolidated balance sheet until such time as the hedged item impacts earnings. At December 31, 2013, the amount of net gain expected to be reclassified into earnings within the next 12 months is $5 million.
Fair Value HedgesIn October of 2012, we entered into two interest rate swaps that are designated as fair value hedges and economically exchange a notional amount of $550 million of previously issued fixed rate long-term debt to floating rate debt. Under the terms of the swap agreements, we pay the counterparty a floating rate that is indexed to the one-month LIBOR rate.
Corning utilizes the long haul method for effectiveness analysis, both retrospectively and prospectively. The analysis excludes the impact of credit risk from the assessment of hedge effectiveness. The amount recorded in current period earnings in the other income, net component, relative to ineffectiveness, is nominal for the year ended December 31, 2013. There were no outstanding fair value hedges in 2012 or 2011.
Net gains and losses from fair value hedges and the effects of the corresponding hedged item are recorded on the same line item of the consolidated statement of operations.
Undesignated HedgesCorning also uses OTC foreign exchange forward and option contracts that are not designated as hedging instruments for accounting purposes.
The undesignated hedges limit exposures to foreign functional currency fluctuations related to certain subsidiaries’ monetary assets, monetary liabilities and net earnings in foreign currencies.
A significant portion of the Company’s non-U.S. revenues are denominated in Japanese yen. When these revenues are translated back to U.S. dollars, the Company is exposed to foreign exchange rate movements in the Japanese yen. To protect translated earnings against movements in the Japanese yen, the Company has entered into a series of purchased collars and average rate forwards.
The Company also uses these types of contracts to reduce the potential for unfavorable changes in foreign exchange rates to decrease the U.S. dollar value of translated earnings. With a purchased collar structure, the Company writes a local currency call option and purchases a local currency put option. The purchased collars offset the impact of translated earnings above the put price and below the call strike price and that offset is reported in other income, net. The Company entered into a series of purchased collars, settling quarterly, to hedge the effect of translation impact for each respective quarter, and span up to the fourth quarter of 2014. Due to the nature of the instruments, only either the put option or the call option can be exercised at maturity. As of December 31, 2013, the U.S. dollar net notional value of the purchased collars is $3 billion. The Company entered into a series of average rate forwards with no associated premium, which will partially hedge the impact of Japanese yen translation on the Company’s projected 2015 net income. These forwards have a notional value of $0.9 billion and will settle net without obligation to deliver Japanese yen.
The Company benefits from the increase in the U.S. dollar equivalent value of its foreign currency earnings in translation. The purchased collar, within other income, would cap the benefit at the strike price of the written call or offset the decline from translation above the strike price of the purchased put.
The fair value of these derivative contracts are recorded as either assets (gain position) or liabilities (loss position) on the Consolidated Balance Sheet. Changes in the fair value of the derivative contracts are recorded currently in earnings in the other income line of the Consolidated Statement of Operations.
The following table summarizes the notional amounts and respective fair values of Corning’s derivative financial instruments on a gross basis for December 31,2013 and December 31, 2012 (in millions):
Notional amountAsset derivatives Liability derivatives
Balance sheet location
Fair value Balance sheet location
Fair value2013 2012 2013 2012 2013 2012
Derivatives designated as hedging instruments
Foreign exchange contracts $ 433 $ 719
Other current assets $ 8 $ 57
Other accrued liabilities $ (3) $ (3)
Interest rate contracts $ 550 $ 550
Other liabilities $ (28)
Derivatives not designated as hedging instruments
Foreign exchange contracts $ 804 $ 1,939
Other current assets $ 20 $ 109
Other accrued liabilities $ (3) $ (10)
Translated earnings contracts $ 6,826
Other current assets $ 344
Other accrued liabilities $ (3)
Other assets $ 90
Other liabilities
Total derivatives $ 8,613 $ 3,208 $ 462 $ 166 $ (37) $ (13)

CORNING INCORPORATED - 2013 Annual Report 83
Notes to Consolidated Financial Statements
The following tables summarize the effect on the consolidated financial statements relating to Corning’s derivative financial instruments (in millions):
Derivatives in hedging relationships
Effect of derivative instruments on the consolidated financial statements for the years ended December 31
Gain/(loss) recognized in other comprehensive income (OCI)(2)
Location of gain/(loss) reclassified from accumulated OCI into
income effective/ineffective
Gain/(loss) reclassified from accumulated OCI into income
ineffective/effective(1)
2013 2012 2011 2013 2012 2011Cash flow hedges
Net sales $ 1 Interest rate hedge $ 33 $ 15 $ (33 ) Cost of sales $ 38 $ 16 $ (12)
Foreign exchange contracts $ 56 $ 85 $ (28) Other income, net $ 91 $ 11 $ (42)
Total cash flow hedges $ 89 $ 100 $ (61) $ 129 $ 28 $ (54)
Undesignated derivatives LocationGain (loss) recognized in income(2)
2013 2012 2011Foreign exchange contracts – balance sheet Other income, net $ 100 $ 82 $ 137
Foreign exchange contracts – loans Other income, net $ 87 $ 141 $ (252)
Translated earnings contracts Other income, net $ 435
Total undesignated $ 622 $ 223 $ (115)(1) The amount of hedge ineffectiveness for the year ended December 31, 2013 was $24 million related to interest rate swaps settled in the fourth
quarter. The amount of ineffectiveness for 2012 and 2011 was insignificant.(2) Certain amounts for prior periods were reclassified to conform to the current presentation. The gain (loss) on foreign exchange contracts is now
disclosed in two categories, Foreign exchange contracts – balance sheet, and Foreign exchange contracts – loans.
16. Fair Value Measurements
Fair value standards under U.S. GAAP define fair value, establish a framework for measuring fair value in applying generally accepted accounting principles, and require disclosures about fair value measurements. The standards also identify two kinds of inputs that are used to determine the fair value of assets and liabilities: observable and unobservable. Observable inputs are based on market data or independent sources while unobservable inputs are based on the Company’s own market assumptions. Once inputs have been characterized, the inputs are prioritized into one of three broad levels (provided in the table below) used to measure fair value.
Fair value standards apply whenever an entity is measuring fair value under other accounting pronouncements that require or permit fair value measurement and require the use of observable market data when available. As of December 31, 2013 and 2012, the Company did not have any financial assets or liabilities that were measured on a recurring basis using unobservable (or Level 3) inputs.
The following tables provide fair value measurement information for the Company’s major categories of financial assets and liabilities measured on a recurring basis:
(in millions) December 31, 2013
Fair value measurements at reporting date usingQuoted prices in
active markets for identical assets (Level 1)
Significant other observable inputs (Level 2)
Significant unobservable inputs (Level 3)
Current assets: Short-term investments $ 531 $ 531 Other current assets(1) $ 372 $ 372
Non-current assets: Other assets(2) $ 128 $ 128
Current liabilities:Other accrued liabilities(1) $ 9 $ 9
Non-current liabilities:Other liabilities(1) $ 28 $ 28
(1) Derivative assets and liabilities include foreign exchange contracts which are measured using observable quoted prices for similar assets and liabilities.
(2) Other assets include asset-backed securities which are measured using observable quoted prices for similar assets.

CORNING INCORPORATED - 2013 Annual Report84
Notes to Consolidated Financial Statements
(in millions) December 31, 2012
Fair value measurements at reporting date usingQuoted prices in
active markets for identical assets (Level 1)
Significant other observable inputs (Level 2)
Significant unobservableinputs (Level 3)
Current assets: Short-term investments $ 1,156 $ 1,156 Other current assets(1) $ 166 $ 166
Non-current assets: Other assets(2) $ 40 $ 40
Current liabilities: Other current liabilities(1) $ 13 $ 13
(1) Derivative assets and liabilities include foreign exchange contracts which are measured using observable quoted prices for similar assets and liabilities.
(2) Other assets include asset-backed securities which are measured using observable quoted prices for similar assets.
There were no significant financial assets and liabilities measured on a nonrecurring basis during the years ended December 31, 2013 and 2012.
Long-lived assets held and used related to certain assets used in the ion exchange process for the production of large cover glass, with a carrying amount of $82 million at December 31, 2012, were written down to their fair value of $38 million, resulting in an impairment charge of $44 million in 2012. The impairment charge was determined using a market value approach to fair value the asset base after indicators of impairment were identified. The valuation methodology determined fair value by comparing market transactions of similar assets as well as an evaluation of the fair value of the underlying assets through the application of the cost approach and income
approach. The cost approach determines current replacement cost adjusted for physical deterioration and the income approach starts with the forecasts of all expected future cash flows including the eventual disposition at market value of the long-lived assets and applies a risk adjusted discount rate. The key assumptions used in these approaches, which requires significant management judgment, include business assumptions, growth rate, terminal value, physical deterioration, and discount rate. The Company believes its current assumptions and estimates of the impairment are reasonable.
17. Shareholders’ Equity
The following table presents changes in capital stock for the period from January 1, 2011 to December 31, 2013 (in millions):
Common stock Treasury stockShares Par value Shares Cost
Balance at December 31, 2010 1,626 $ 813 (65) $ (1,227)
Shares issued to benefit plans and for option exercises 10 5 (7) Shares purchased for treasury (55) (779)
Other, net (1) (11)
Balance at December 31, 2011 1,636 $ 818 (121) $ (2,024)
Shares issued to benefit plans and for option exercises 13 7 (1)
Shares purchased for treasury (56) (719)
Other, net (2) (29)
Balance at December 31, 2012 1,649 $ 825 (179) $ (2,773)
Shares issued to benefit plans and for option exercises 12 6 (1)
Shares purchased for treasury (82) (1,316)
Other, net (1) (9)
Balance at December 31, 2013 1,661 $ 831 (262) $ (4,099)
On October 31, 2013, as part of the previously authorized share repurchase program announced on April 24, 2013, Corning entered into an accelerated share repurchase (“ASR”) agreement with JP Morgan Chase Bank, National Association, London Branch (“JPMC”). Under the ASR, Corning agreed to purchase $1 billion of its common stock, in total, with an initial delivery by JPMC of 47.1 million shares based on the current market price, and payment of $1 billion made by Corning to JPMC. The payment to JPMC was recorded as a reduction to shareholders’ equity, consisting of an $800 million increase in treasury stock, which reflects the value of the initial 47.1 million shares received upon execution, and a $200 million decrease in other-paid-in capital, which reflects the value of the stock held back by JPMC pending final settlement. On January 28, 2014, the
ASR was completed. Corning received an additional 10.5 million shares on January 31, 2014 to settle the ASR. In total, Corning purchased 57.6 million shares based on the average daily volume weighted-average price of Corning’s common stock during the term of the ASR, less a discount.
In addition to the ASR, during 2013, we repurchased 35 million shares of common stock on the open market for approximately $500 million as part of the share repurchase program announced on April 24, 2013. During 2012 and 2011, we repurchased 56 million and 55 million shares of common stock on the open market for $719 million and $779 million, respectively, as part of the share repurchase program announced on October 5, 2011.

CORNING INCORPORATED - 2013 Annual Report 85
Notes to Consolidated Financial Statements
Accumulated Other Comprehensive Income A summary of changes in the components of accumulated other comprehensive income (loss), including our proportionate share of equity method investee’s accumulated other comprehensive income (loss), is as follows (in millions)(1):
Foreign currency translation adjustment and other
Unamortized actuarial
losses andprior service
costs
Net unrealized gains (losses) on
investments
Net unrealized gains (losses) on
designated hedges
Accumulated other comprehensive income (loss)
Balance at December 31, 2010 $ 1,374 $ (698) $ (33) $ (23) $ 620
Other comprehensive income before reclassifications(2) 144 (53) (2) (38) 51 Amounts reclassified from accumulated other comprehensive income(3) 3 54 34 91 Equity method affiliates(4) (168) (122) 6 (2) (286)
Net current-period other comprehensive income (loss) (21) (121) 4 (6) (144)
Balance at December 31, 2011 $ 1,353 $ (819) $ (29) $ (29) $ 476 Other comprehensive income before reclassifications(5) $ (439) $ (181) $ 11 $ 63 $ (546)
Amounts reclassified from accumulated other comprehensive income(3) (52) 149 (6) (18) 73 Equity method affiliates(4) 312 31 8 2 353
Net current-period other comprehensive income (loss) (179) (1) 13 47 (120)
Balance at December 31, 2012 $ 1,174 $ (820) $ (16) $ 18 $ 356
Other comprehensive income before reclassifications(6) $ (756) $ 283 $ 1 $ 56 $ (416)
Amounts reclassified from accumulated other comprehensive income(3) (10) (1) (81) (92) Equity method affiliates(4) 74 119 2 1 196 Net current-period other comprehensive income (loss) (682 ) 392 2 (24) (312)
Balance at December 31, 2013 $ 492 $ (428) $ (14) $ (6) $ 44
(1) All amounts are after tax. Amounts in parentheses indicate debits to accumulated other comprehensive income.(2) Amounts are net of total tax benefit of $49 million, including $23 million related to the hedges component and $26 million related to the
retirement plans component.(3) Tax effects of reclassifications are disclosed separately in this Note 17.(4) Tax effects related to equity method affiliates are not significant.(5) Amounts are net of total tax benefit of $56 million, including $(37) million related to the hedges component, $99 million related to the retirement
plans component and $(6) million related to the investments component.(6) Amounts are net of total tax expense of $(197) million, including $(33) million related to the hedges component and $(164) million related to the
retirement plans component.

CORNING INCORPORATED - 2013 Annual Report86
Notes to Consolidated Financial Statements
(in millions)
Reclassifications Out of Accumulated Other Comprehensive Income (AOCI) by Component(1)
Details about AOCI Components
Amount reclassified from AOCI Affected line itemin the consolidated
statements of incomeYears ended December 31,
2013 2012 2011Foreign currency translation adjustment $ 52 $ (3) Other income, net
52 (3) Net of taxAmortization of net actuarial loss $ 15 $ (233) $ (82)
(2)
Amortization of prior service cost 1 (2) (3)(2)
16 (235) (85) Total before tax(6) 86 31 Tax benefit
$ 10 $ (149) $ (54) Net of taxRealized gains on investments $ 1 $ 10 Other income, net
(4) Tax expense$ 1 $ 6 Net of tax
Realized gains on designated hedges $ 1 Sales$ 38 16 $ (12) Cost of sales
91 11 (42) Other income, net129 28 (54) Total before tax(48) (10) 20 Tax (expense) benefit
$ 81 $ 18 $ (34) Net of taxTotal reclassifications for the period $ 92 $ (73) $ (91) Net of tax(1) Amounts in parentheses indicate debits to the statement of income.(2) These accumulated other comprehensive income components are included in net periodic pension cost. See Note 13 – Employee Retirement
Plans for additional details.
18. Earnings Per Common Share
Basic earnings per common share are computed by dividing income attributable to common shareholders by the weighted-average number of common shares outstanding for the period. Diluted earnings per common share assumes the issuance of common shares for all potentially dilutive securities outstanding.
The reconciliation of the amounts used to compute basic and diluted earnings per common share from continuing operations follows (in millions, except per share amounts):
Years ended December 31,2013 2012 2011
Net incomeattributableto Corning
Incorporated
Weighted-averageshares
Pershare
amount
Net incomeattributableto Corning
Incorporated
Weighted-averageshares
Pershare
amount
Net incomeattributableto Corning
Incorporated
Weighted-averageshares
Pershare
amountBasic earnings per common share $ 1,961 1,452 $ 1.35 $ 1,636 1,494 $ 1.10 $ 2,817 1,562 $ 1.80
Effect of dilutive securities:
Employee stock options and awards 10 12 21
Diluted earnings per common share $ 1,961 1,462 $ 1.34 $ 1,636 1,506 $ 1.09 $ 2,817 1,583 $ 1.78
The following potential common shares were excluded from the calculation of diluted earnings per common share because their inclusion would have been anti-dilutive (in millions):
Years ended December 31,2013 2012 2011
Potential common shares excluded from the calculation of diluted earnings per share:Employee stock options and awards 39 43 29
Accelerated share repurchase forward contract 3
Total 42 43 29

CORNING INCORPORATED - 2013 Annual Report 87
Notes to Consolidated Financial Statements
19. Share-based Compensation
Stock Compensation PlansWe maintain long-term incentive plans (the Plans) for key team members and non-employee members of our Board of Directors. The Plans allow us to grant equity-based compensation awards, including stock options, stock appreciation rights, performance share units, restricted stock units, restricted stock awards or a combination of awards (collectively, share-based awards). At December 31, 2013, there were approximately 78 million unissued common shares available for future grants under the Plans.
The Company measures and recognizes compensation cost for all share-based payment awards made to employees and directors based on estimated fair values.
The fair value of awards granted subsequent to January 1, 2006 that are expected to ultimately vest is recognized as expense over the requisite service periods. The number of options expected to vest equals the total options granted less an estimation of the number of forfeitures expected to occur prior to vesting. The forfeiture rate is calculated based on 15 years of
historical data and is adjusted if actual forfeitures differ significantly from the original estimates. The effect of any change in estimated forfeitures would be recognized through a cumulative adjustment that would be included in compensation cost in the period of the change in estimate.
Total share-based compensation cost of $54 million, $70 million and $86 million was disclosed in operating activities on the Company’s Consolidated Statements of Cash Flows for the years ended December 31, 2013, 2012 and 2011, respectively.
Stock OptionsOur stock option plans provide non-qualified and incentive stock options to purchase authorized but unissued, or treasury shares, at the market price on the grant date and generally become exercisable in installments from one to five years from the grant date. The maximum term of non-qualified and incentive stock options is 10 years from the grant date.
The following table summarizes information concerning options outstanding including the related transactions under the stock option plans for the year ended December 31, 2013:
Number of shares (in thousands)
Weighted-average exercise price
Weighted-average remaining
contractual term in years
Aggregate intrinsic value (in thousands)
Options outstanding as of December 31, 2012 64,061 $ 16.63
Granted 4,430 14.34
Exercised (9,597) 9.02
Forfeited and expired (1,755) 13.58
Options outstanding as of December 31, 2013 57,139 17.83 4.89 $ 145,129
Options expected to vest as of December 31, 2013 56,956 17.84 4.89 144,379
Options exercisable as of December 31, 2013 43,523 18.87 3.82 94,824
The aggregate intrinsic value (market value of stock less option exercise price) in the preceding table represents the total pretax intrinsic value, based on the Company’s closing stock price on December 31, 2013, which would have been received by the option holders had all option holders exercised their “in-the-money” options as of that date. The total number of “in-the-money” options exercisable on December 31, 2013, was approximately 14 million.
The weighted-average grant-date fair value for options granted for the years ended December 31, 2013, 2012 and 2011 was $5.02, $4.95 and $9.22, respectively. The total fair value of options that vested during the years ended December 31, 2013, 2012 and 2011 was approximately $29 million, $47 million and $57 million, respectively. Compensation cost related to stock options for the years ended December 31, 2013, 2012 and 2011, was approximately $25 million, $37 million and $48 million, respectively.
As of December 31, 2013, there was approximately $19 million of unrecognized compensation cost related to stock options granted under the Plans. The cost is expected to be recognized over a weighted-average period of 1.3 years.
Proceeds received from the exercise of stock options were $85 million for the year ended December 31, 2013, which were included in financing activities on the Company’s Consolidated Statements of Cash Flows. The total intrinsic value of options exercised for the years ended December 31, 2013, 2012 and 2011 was approximately $55 million, $51 million and $77 million, respectively, which is currently deductible for tax purposes. However, these tax benefits were not fully recognized due to net operating
loss carryforwards available to the Company. Refer to Note 6 (Income Taxes) to the Consolidated Financial Statements.
An award is considered vested when the employee’s retention of the award is no longer contingent on providing subsequent service (the “non-substantive vesting period approach”). Awards to retirement eligible employees are earned ratably each month that the employee provides service over the twelve months following the grant date, and the related compensation expense is recognized over this twelve month service period or over the period from the grant date to the date of retirement eligibility for employees that become age 55 during the vesting period.
Corning uses a multiple-point Black-Scholes valuation model to estimate the fair value of stock option grants. Corning utilizes a blended approach for calculating the volatility assumption used in the multiple-point Black-Scholes valuation model defined as the weighted average of the short-term implied volatility, the most recent volatility for the period equal to the expected term, and the most recent 15-year historical volatility. The expected term assumption is the period of time the options are expected to be outstanding, and is calculated using a combination of historical exercise experience adjusted to reflect the current vesting period of options being valued, and partial life cycles of outstanding options. The risk-free rates used in the multiple-point Black-Scholes valuation model are the implied rates for a zero-coupon U.S. Treasury bond with a term equal to the option’s expected term. The ranges given below reflect results from separate groups of employees exhibiting different exercise behavior.

CORNING INCORPORATED - 2013 Annual Report88
Notes to Consolidated Financial Statements
The following inputs were used for the valuation of option grants under our Stock Option Plans:
2013 2012 2011Expected volatility 46.5-47.4% 47.8-48.9% 47.2-49.2%Weighted-average volatility 46.6-47.3% 48.0-48.5% 47.2-49.1%Expected dividends 2.35-3.02% 2.28-3.31% 1.05-1.10%Risk-free rate 0.8-2.2% 0.8-1.3% 1.0-2.7%Average risk-free rate 1.1-2.2% 1.0-1.3% 1.3-2.6%Expected term (in years) 5.8-7.2 5.7-7.1 5.1-6.7 Pre-vesting departure rate 0.4-4.1% 0.4-4.2% 0.4-3.9%
Incentive Stock PlansThe Corning Incentive Stock Plan permits restricted stock and restricted stock unit grants, either determined by specific performance goals or issued directly, in most instances, subject to the possibility of forfeiture and without cash consideration. Restricted stock and restricted stock units under the Incentive Stock Plan are granted at the closing market price on the grant date, contingently vest over a period of generally one to ten years, and generally have contractual lives of one to ten years. The fair value of each restricted stock grant or restricted stock unit awarded under the Incentive Stock Plan was estimated on the date of grant.
Time-Based Restricted Stock and Restricted Stock Units:Time-based restricted stock and restricted stock units are issued by the Company on a discretionary basis, and are payable in shares of the Company’s common stock upon vesting. The fair value is based on the closing market price of the Company’s stock on the grant date. Compensation cost is recognized over the requisite vesting period and adjusted for actual forfeitures before vesting.
The following table represents a summary of the status of the Company’s non-vested time-based restricted stock and restricted stock units as of December 31, 2012, and changes which occurred during the year ended December 31, 2013:
Shares (000’s)
Weighted-average grant-date fair value
Non-vested shares at December 31, 2012 5,363 $ 15.97
Granted 2,835 13.73
Vested (1,993) 17.08
Forfeited (97) 15.41
Non-vested shares and share units at December 31, 2013 6,108 $ 14.58
As of December 31, 2013, there was approximately $27 million of unrecognized compensation cost related to nonvested time-based restricted stock and restricted stock units compensation arrangements granted under the Plan. The cost is expected to be recognized over a weighted-average period of 1.8 years. The total fair value of time-based restricted stock that vested during the years ended December 31, 2013, 2012 and 2011 was approximately $29 million, $13 million and $15 million, respectively. Compensation cost related to time-based restricted stock and restricted stock units was approximately $29 million, $31 million and $29 million for the years ended December 31, 2013, 2012 and 2011, respectively.
Performance-Based Restricted Stock and Restricted Stock Units:The performance-based restricted stock and restricted stock unit compensation program was terminated in 2010. All performance-based restricted stock and restricted stock units were fully vested in the first quarter of 2012.
Performance-based restricted stock and restricted stock units were earned upon the achievement of certain targets, and were payable in shares of the Company’s common stock upon vesting, typically over a three-year period. The fair value was based on the closing market price of the Company’s stock on the grant date and assumed that the target payout level will be achieved. Compensation cost was recognized over the requisite vesting period and adjusted for actual forfeitures before vesting. During the performance period, compensation cost was adjusted based on changes in the expected outcome of the performance-related target.
As of December 31, 2013, there is no unrecognized compensation cost related to non-vested performance-based restricted stock and restricted stock units compensation arrangements granted under the Plan. The total fair value of performance-based restricted stock that vested during the years ended December 31, 2012 and 2011, was approximately $45 million and $10 million, respectively. Compensation cost related to performance-based restricted stock and restricted stock units was approximately $2 million and $9 million for the years ended December 31, 2012 and 2011, respectively.
20. Reportable Segments
Our reportable segments are as follows:
• Display Technologies – manufactures glass substrates for flat panel liquid crystal displays.
• Optical Communications – manufactures carrier network and enterprise network components for the telecommunications industry.
• Environmental Technologies – manufactures ceramic substrates and filters for automotive and diesel applications.
• Specialty Materials – manufactures products that provide more than 150 material formulations for glass, glass ceramics and fluoride crystals to meet demand for unique customer needs.
• Life Sciences – manufactures glass and plastic labware, equipment, media and reagents to provide workflow solutions for scientific applications.
All other reportable segments that do not meet the quantitative threshold for separate reporting have been grouped as “All Other.” This group is primarily comprised of development projects and results for new product lines.
We prepared the financial results for our reportable segments on a basis that is consistent with the manner in which we internally disaggregate financial information to assist in making internal operating decisions. We included the earnings of equity affiliates that are closely associated with our reportable segments in the respective segment’s net income. We have allocated certain common expenses among reportable segments differently than we would for stand-alone financial information. Segment net income may not be consistent with measures used by other companies. The accounting policies of our reportable segments are the same as those applied in the consolidated financial statements.

CORNING INCORPORATED - 2013 Annual Report 89
Notes to Consolidated Financial Statements
The following provides historical segment information as described above:
SEGMENT INFORMATION
(in millions)Display
TechnologiesOptical
CommunicationsEnvironmental Technologies
Specialty Materials
Life Sciences All Other Total
For the year endedDecember 31, 2013
Net sales $ 2,545 $ 2,326 $ 919 $ 1,170 $ 851 $ 8 $ 7,819
Depreciation(1) $ 481 $ 147 $ 120 $ 137 $ 57 $ 18 $ 960
Amortization of purchased intangibles $ 10 $ 21 $ 31
Research, development and engineering expenses(2) $ 84 $ 140 $ 89 $ 144 $ 20 $ 116 $ 593
Restructuring, impairment and other charges(3) $ 7 $ 12 $ 1 $ 19 $ 4 $ 8 $ 51
Equity in earnings of affiliated companies(4) $ 357 $ 2 $ 1 $ 4 $ (24) $ 340
Income tax (provision) benefit $ (327) $ (101) $ (65) $ (91) $ (36) $ 61 $ (559)
Net income (loss)(5) $ 1,267 $ 199 $ 132 $ 187 $ 71 $ (163) $ 1,693
Investment in affiliated companies, at equity $ 3,666 $ 3 $ 31 $ 10 $ 232 $ 3,942
Segment assets(6) $ 9,501 $ 1,654 $ 1,230 $ 1,333 $ 551 $ 422 $ 14,691
Capital expenditures $ 350 $ 105 $ 196 $ 62 $ 51 $ 55 $ 819
For the year endedDecember 31, 2012*
Net sales $ 2,909 $ 2,130 $ 964 $ 1,346 $ 657 $ 6 $ 8,012
Depreciation(1) $ 514 $ 130 $ 117 $ 153 $ 44 $ 14 $ 972
Amortization of purchased intangibles $ 9 $ 10 $ 19
Research, development and engineering expenses(2) $ 103 $ 137 $ 100 $ 143 $ 22 $ 123 $ 628
Restructuring, impairment and other charges(3) $ 21 $ 39 $ 3 $ 54 $ 2 $ 119
Equity in earnings of affiliated companies $ 692 $ 1 $ 17 $ 710
Income tax (provision) benefit $ (367) $ (58) $ (58) $ (69) $ (14) $ 53 $ (513)
Net income (loss)(5) $ 1,589 $ 146 $ 112 $ 137 $ 28 $ (98) $ 1,914
Investment in affiliated companies, at equity $ 3,262 $ 17 $ 30 $ 4 $ 262 $ 3,575
Segment assets(6) $ 9,953 $ 1,435 $ 1,103 $ 1,707 $ 552 $ 351 $ 15,101
Capital expenditures $ 845 $ 311 $ 154 $ 93 $ 47 $ 52 $ 1,502
For the year endedDecember 31, 2011*
Net sales $ 3,145 $ 2,072 $ 998 $ 1,074 $ 595 $ 6 $ 7,890
Depreciation(1) $ 511 $ 123 $ 107 $ 156 $ 34 $ 12 $ 943
Amortization of purchased intangibles $ 7 $ 1 $ 7 $ 15
Research, development and engineering expenses(2) $ 91 $ 125 $ 94 $ 136 $ 18 $ 97 $ 561
Restructuring, impairment and other charges(3) $ (1) $ 130 $ 129
Equity in earnings (loss) of affiliated companies(4) $ 1,027 $ 3 $ 1 $ 4 $ 15 $ 1,050
Income tax (provision) benefit $ (502) $ (82) $ (59) $ 23 $ (29) $ 39 $ (610)
Net income (loss)(5) $ 2,346 $ 194 $ 119 $ (36) $ 60 $ (78) $ 2,605
Investment in affiliated companies, at equity $ 3,132 $ 19 $ 31 $ 4 $ 243 $ 3,429
Segment assets(6) $ 10,387 $ 1,201 $ 1,089 $ 1,455 $ 363 $ 396 $ 14,891
Capital expenditures $ 1,304 $ 195 $ 174 $ 348 $ 57 $ 116 $ 2,194
* Includes impact of defined benefit pension plan methodology change implemented in the first quarter of 2013 and retrospectively applied to prior periods.
(1) Depreciation expense for Corning’s reportable segments includes an allocation of depreciation of corporate property not specifically identifiable to a segment.
(2) Research, development and engineering expenses include direct project spending that is identifiable to a segment.(3) In 2012, Corning recorded a $44 million impairment charge in the Specialty Materials segment related to certain assets located in Japan used
for the production of large cover glass. In 2011, Corning recorded a $130 million impairment charge in the Specialty Materials segment related to certain assets located in Japan used for the production of large cover glass.
(4) In 2013, equity in earnings of affiliated companies in the Display Technologies segment included a $28 million restructuring charge for our share of costs for headcount reductions and asset write-offs. In 2012, equity in earnings of affiliated companies in the Display Technologies segment included a $18 million restructuring charge for our share of costs for headcount reductions and asset write-offs.
(5) Many of Corning’s administrative and staff functions are performed on a centralized basis. Where practicable, Corning charges these expenses to segments based upon the extent to which each business uses a centralized function. Other staff functions, such as corporate finance, human resources and legal are allocated to segments, primarily as a percentage of sales.
(6) Segment assets include inventory, accounts receivable, property and associated equity companies and cost investments.

CORNING INCORPORATED - 2013 Annual Report90
Notes to Consolidated Financial Statements
For the year ended December 31, 2013, the following number of customers, which individually accounted for 10% or more of each segment’s sales, represented the following concentration of segment sales:
• In the Display Technologies segment, four customers accounted for 94% of total segment sales. • In the Optical Communications segment, one customer accounted for 10% of total segment sales. • In the Environmental Technologies segment, three customers accounted for 87% of total segment sales. • In the Specialty Materials segment, three customers accounted for 47% of total segment sales. • In the Life Sciences segment, two customers accounted for 44% of total segment sales.
A significant amount of specialized manufacturing capacity for our Display Technologies segment is concentrated in Asia. It is at least reasonably possible that the use of a facility located outside of an entity’s home country could be disrupted. Due to the specialized nature of the assets, it would not be possible to find replacement capacity quickly. Accordingly, loss of these facilities could produce a near-term severe impact to our display business and the Company as a whole.
A reconciliation of reportable segment net income (loss) to consolidated net income (loss) follows (in millions):
Years ended December 31,2013 2012 2011
Net income of reportable segments $ 1,856 $ 2,012 $ 2,683
Net loss of All Other (163) (98) (78)
Unallocated amounts:
Net financing costs(1)(66) (196) (190)
Stock-based compensation expense (54) (70) (86)
Exploratory research (112) (89) (79)
Corporate contributions (42) (44) (48)
Equity in earnings of affiliated companies, net of impairments(2)207 82 421
Asbestos litigation(3)(19) (14) (24)
Purchased collars(4)435
Other corporate items(5)(6)(81) 53 218
Net income $ 1,961 $ 1,636 $ 2,817
(1) Net financing costs include interest expense, interest income, and interest costs and investment gains and losses associated with benefit plans.(2) Equity in earnings of affiliated companies, net of impairments, is primarily equity in earnings of Dow Corning, which includes the following
items:• In 2013, gains in the amount of approximately $30 million for the resolution of contract disputes against customers relating to enforcement of
long-term supply agreements and $16 million for the positive impact of the settlement of a derivative, along with a charge of $4 million related to the impact of a tax valuation allowance. Also included are restructuring charges in the amount of $11 million.
• In 2012, restructuring and impairment charges in the amount of $87 million for our share of a charge related to workforce reductions and asset write-offs at Dow Corning, and a $10 million credit for Corning’s share of Dow Corning’s settlement of a dispute related to long term supply agreements.
• In 2011, a $89 million credit for our share of Dow Corning’s settlement of a dispute related to long term supply agreements.(3) In 2013, 2012 and 2011, Corning recorded charges of $19 million, $14 million and $24 million to adjust the asbestos liability for the change in value
of the components of the Amended PCC Plan. (4) In 2013, Corning recorded a net gain of $435 million, related to its purchased collars and average rate forward contracts.(5) Other corporate items include the tax impact of the unallocated amounts and the following significant items:
• In 2013, Corning recorded a $54 million tax benefit for the impact of the American Taxpayer Relief Act enacted on January 3, 2013 and made retroactive to 2012.
• In 2012, Corning recorded a $52 million translation gain on the liquidation of a foreign subsidiary; a loss of $26 million ($17 million after tax) from the repurchase of $13 million principal amount of our 8.875% senior unsecured notes due 2021, $11 million of our 8.875% senior unsecured notes due 2016, and $51 million principal amount of our 6.75% senior unsecured notes due 2013; and a $37 million tax expense resulting from the delay of the passage of the American Taxpayer Relief Act of 2012 until January 2013, that was reversed in the first quarter of 2013.
• In 2011, Corning recorded a $41 million tax benefit from the filing of an amended 2006 U.S. Federal Tax return to claim foreign tax credits.(6) As revised for the change in our method of recognizing pension expense. See Note 1, Summary of Significant Accounting Policies, of Notes to
Consolidated Financial Statements for a discussion of the change and the impacts of the change.

CORNING INCORPORATED - 2013 Annual Report 91
Notes to Consolidated Financial Statements
A reconciliation of reportable segment net assets to consolidated net assets follows (in millions):
December 31,2013 2012 2011
Total assets of reportable segments $ 14,269 $ 14,750 $ 14,495
Non-reportable segments 422 351 396
Unallocated amounts:Current assets(1)
6,349 7,300 6,602
Investments(2)1,595 1,340 1,298
Property, net(3)1,594 1,494 1,283
Other non-current assets(4)4,249 4,140 3,774
Total assets $ 28,478 $ 29,375 $ 27,848(1) Includes current corporate assets, primarily cash, short-term investments and deferred taxes.(2) Represents corporate investments in affiliated companies, at both cost and equity (primarily Dow Corning).(3) Represents corporate property not specifically identifiable to an operating segment.(4) Includes non-current corporate assets, pension assets and deferred taxes.
Selected financial information concerning the Company’s product lines and reportable segments follow (in millions):
Revenues from External CustomersFiscal Years Ended December 31,
2013 2012 2011Display Technologies $ 2,545 $ 2,909 $ 3,145Optical Communications
Carrier network 1,782 1,619 1,556
Enterprise network 544 511 516
Total Optical Communications 2,326 2,130 2,072Environmental Technologies
Automotive and other 485 486 476
Diesel 434 478 522
Total Environmental Technologies 919 964 998Specialty Materials
Corning Gorilla Glass 848 1,027 712
Advanced optics and other specialty glass 322 319 362
Total Specialty Materials 1,170 1,346 1,074Life Sciences
Labware 529 430 419
Cell culture products 322 227 176
Total Life Science 851 657 595All Other 8 6 6
$ 7,819 $ 8,012 $ 7,890

CORNING INCORPORATED - 2013 Annual Report92
Notes to Consolidated Financial Statements
Information concerning principal geographic areas was as follows (in millions):
2013 2012 2011
Net sales(2)Long-lived
assets(1) Net sales(2)Long-lived
assets(1) Net sales(2)Long-lived
assets(1)
North America United States $ 2,061 $ 7,170 $ 1,859 $ 6,771 $ 1,676 $ 6,087
Canada 308 246 229
Mexico 23 36 24 87 26 78
Total North America 2,392 7,206 2,129 6,858 1,931 6,165Asia Pacific
Japan 621 1,548 751 1,949 1,252 2,210
Taiwan 1,376 2,277 1,708 2,836 1,850 3,341
China 1,916 1,218 2,103 1,215 1,550 764
Korea 96 3,234 94 3,342 101 3,357
Other 278 127 243 84 145 11
Total Asia Pacific 4,287 8,404 4,899 9,426 4,898 9,683Europe
Germany 337 171 264 139 318 134
France 79 287 57 267 65 197
United Kingdom 165 6 134 14 124
Other 280 1,147 274 550 263 273
Total Europe 861 1,611 729 970 770 604Latin America
Brazil 77 66 29 1 29 1
Other 37 6 33 6 25 6
Total Latin America 114 72 62 7 54 7All Other 165 25 193 35 237 25
Total $ 7,819 $ 17,318 $ 8,012 $ 17,296 $ 7,890 $ 16,484(1) Long-lived assets primarily include investments, plant and equipment, goodwill and other intangible assets. Assets in the U.S. and Korea include
investments in Dow Corning and Samsung Corning Precision Materials.(2) Net sales are attributed to countries based on location of customer.
21. Subsequent Events
AcquisitionsOn January 15, 2014, Corning completed the series of strategic and financial agreements previously announced on October 22, 2013, to acquire the common shares of Samsung Corning Precision Materials previously held by Samsung Display Co., Ltd. As a result of these transactions, Corning is now the owner of 100% of the common shares of Samsung Corning Precision Materials, giving us greater flexibility in asset use, improved operational efficiencies, and better positioning for new specialty-glass market opportunities. A summary of the series of transactions follow:
• Corning obtained full ownership of Samsung Corning Precision Materials on January 15, 2014;
• After redemption of Samsung Display’s 43% interest in Samsung Corning Precision Materials, Corning issued its Fixed Rate Cumulative Convertible Preferred Stock, Series A (“Preferred Stock”), to Samsung Display in an aggregate face amount of $1.9 billion;
• Samsung Display invested an additional $400 million in Corning’s Preferred Stock; and
• A new long-term LCD display glass supply agreement between Corning and Samsung Display through 2023.
As part of the acquisition process, Corning hired a third-party valuation firm to assist it in estimating the fair value of the acquired business. Included in this process is the valuation of pre-existing arrangements, which could result in a gain or loss which will be recognized in the first quarter of 2014. We have not completed our accounting for the acquisition by the date of the filing of our 2013 Form 10-K, and, therefore, have not included detailed purchase accounting in this note.
In addition, Corning’s Board of Directors has authorized an additional $2 billion of share repurchases through December 31, 2015.
Foreign Exchange ContractsIn February 2014, the Company obtained authorization from the Board of Directors to execute a series of foreign exchange contracts over a three year period to hedge our exposure to movements in the Japanese yen and its impact on our earnings. The Company’s execution of these contracts will be dependent upon market conditions. The foreign exchange contracts will not be designated derivatives and will be marked to market through the other income line of the consolidated statements of income.

CORNING INCORPORATED - 2013 Annual Report 93
Valuation Accounts and Reserves(in millions)
Year ended December 31, 2013Balance at
beginning of period AdditionsNet deductions
and otherBalance at end
of periodDoubtful accounts and allowances $ 26 $ 2 $ 28
Deferred tax assets valuation allowance $ 210 $ 80 $ 4 $ 286
Accumulated amortization of purchased intangible assets $ 154 $ 31 $ 185
Reserves for accrued costs of business restructuring $ 42 $ 41 $ 39 $ 44
Year ended December 31, 2012Balance at
beginning of period AdditionsNet deductions
and otherBalance at end
of periodDoubtful accounts and allowances $ 19 $ 7 $ 26
Deferred tax assets valuation allowance $ 219 $ 10 $ 19 $ 210
Accumulated amortization of purchased intangible assets $ 135 $ 19 $ 154
Reserves for accrued costs of business restructuring $ 10 $ 52 $ 20 $ 42
Year ended December 31, 2011Balance at
beginning of period AdditionsNet deductions
and otherBalance at end
of periodDoubtful accounts and allowances $ 20 $ 1 $ 19
Deferred tax assets valuation allowance $ 214 $ 15 $ 10 $ 219
Accumulated amortization of purchased intangible assets $ 221 $ 15 $ 101 $ 135
Reserves for accrued costs of business restructuring $ 27 $ 17 $ 10

CORNING INCORPORATED - 2013 Annual Report94
Quarterly Operating Results(Unaudited) (In millions, except per share amounts)
2013 First quarter Second quarter Third quarter Fourth quarter Total yearNet sales $ 1,814 $ 1,982 $ 2,067 $ 1,956 $ 7,819
Gross margin $ 770 $ 883 $ 901 $ 770 $ 3,324
Restructuring, impairment and other credits $ 67 $ 67
Asbestos litigation charges $ 2 $ 6 $ 5 $ 6 $ 19
Equity in earnings of affiliated companies $ 173 $ 166 $ 138 $ 70 $ 547
Provision for income taxes $ (34) $ (191) $ (141) $ (146) $ (512)
Net income attributable to Corning Incorporated $ 494 $ 638 $ 408 $ 421 $ 1,961
Basic earnings per common share $ 0.33 $ 0.43 $ 0.28 $ 0.30 $ 1.35
Diluted earnings per common share $ 0.33 $ 0.43 $ 0.28 $ 0.30 $ 1.34
2012 First quarter Second quarter Third quarter Fourth quarter Total yearNet sales $ 1,920 $ 1,908 $ 2,038 $ 2,146 $ 8,012
Gross margin* $ 824 $ 808 $ 889 $ 798 $ 3,319
Restructuring, impairment and other charges* $ 133 $ 133
Asbestos litigation charges $ 1 $ 5 $ 3 $ 5 $ 14
Equity in earnings of affiliated companies $ 218 $ 259 $ 240 $ 93 $ 810
Provision for income taxes* $ (118) $ (100) $ (94) $ (28) $ (339)
Net income attributable to Corning Incorporated* $ 474 $ 474 $ 533 $ 155 $ 1,636
Basic earnings per common share* $ 0.31 $ 0.31 $ 0.36 $ 0.11 $ 1.10
Diluted earnings per common share* $ 0.31 $ 0.31 $ 0.36 $ 0.10 $ 1.09
* Includes impact of defined benefit pension plan methodology change implemented in the first quarter of 2013 and retrospectively applied to prior periods.

(This page intentionally left blank.)

(This page intentionally left blank.)

(This page intentionally left blank.)

“Safe Harbor” StatementUnder the Private Securities Litigation Reform Act of 1995
The statements in this Annual Report that are not historical facts or information are forward-looking statements. These forward-looking statements involve risks and uncertainties that may cause the outcome to be materially different. Such risks and uncertainties include, but are not limited to:
— Global business, economic and political conditions,— conditions in the financial and credit markets,— tariffs, import duties, tax rates and currency fluctuations,— product demand and industry capacity,— competition and pricing,— sufficiency of manufacturing capacity and efficiencies,— availability and costs of critical components and materials,— new product development and commercialization,— order activity and demand from major customers,— fluctuations in spending by customers and pricing,— disruptions in commercial activities due to terrorist activity, armed conflict, cyber attack, political or financial instability, natural disasters or major health concerns,— new plant start-up or restructuring costs,— effect of regulatory or legal developments,— adequacy and availability of insurance,— capital resource and cash flow activities,— ability to pace capital spending to customer demand,— credit rating and ability to obtain financing and capital,— financial risk management,— capital spending,— equity company activities,— interest costs,— restructuring, goodwill and intangible asset impairment charges,— acquisition and divestiture activities,— rate of technology change,— level of excess or obsolete inventory,— ability to enforce patents,— adverse litigation or regulatory developments,— product, materials and components performance issues,— retention of key personnel,— stock price fluctuations,— rate of substitution by end-users purchasing LCDs,— downturn in demand for LCD glass substrates,— customer ability to maintain profitable operations and obtain financing to fund expansions,— fluctuations in supply chain inventory levels,— movements in foreign exchange rates,— adverse weather conditions and earthquakes, and— other risks detailed in Corning’s SEC filings.
Neither this report nor any statement contained herein is furnished in connection with any offering of securities or for the purpose of promoting or influencing the sale of securities.
Trademarks
A number of Corning trademarks appear throughout this annual report. For a complete listing of Corning’s registered trademarks, visit: www.corning.com/legal/legal_notices.aspx
Corning is an equal opportunity employer.
Board of Directors
John Seely Brown Retired Chief Scientist Xerox Corporation Palo Alto, CA(2) (5)
Stephanie A. BurnsRetired Chairman& Chief Executive OfficerDow Corning CorporationSunset, SC(3) (4)
John A. Canning, Jr.Co-Founder & ChairmanMadison Dearborn Partners, LLCChicago, IL(4) (5) (6)
Richard T. ClarkRetired Chairman, President& Chief Executive OfficerMerck & Co., Inc.Whitehouse Station, NJ(2) (5) (6)
Robert F. Cummings, Jr.Vice Chairmanof Investment BankingJPMorgan Chase & Co.New York, NY(3) (4) (6)
James B. FlawsVice Chairman& Chief Financial OfficerCorning IncorporatedCorning, NY(4) (6)
Deborah A. HenrettaGroup President of Global BeautyProctor & GambleCincinnati, OH(1) (4)
Kurt M. LandgrafRetired President& Chief Executive OfficerEducational Testing ServicePrinceton, NJ(1) (2) (6)
Kevin J. MartinPartnerPatton Boggs, LLPWashington, DC(3) (4)
Deborah D. Rieman Executive Chairman MetaMarkets Group Woodside, CA(1) (2)
Board Committees: (1) Audit; (2) Compensation; (3) Corporate Relations; (4) Finance; (5) Nominating & Corporate Governance; (6) Executive
© Corning Incorporated 2014. All Rights Reserved.
Annual Meeting
The annual meeting of shareholders will be held on Tuesday, April 29, 2014, in Corning, New York. A formal notice of the meeting and a proxy statement will be mailed to shareholders on or about March 13, 2014. The proxy statement can also be accessed electronically through the Investor Relations page of the Corning website at www.corning.com and at www.corning.com/2014_proxy. A summary report of the proceedings at the annual meeting will be available without charge upon written request to Linda E. Jolly, Corporate Secretary, Corning Incorporated, HQ-E2-10, Corning, NY 14831.
Additional Information
A copy of Corning’s 2013 Annual Report on Form 10-K filed with the Securities and Exchange Commission (SEC) is avail-able without charge to shareholders upon written request to Corporate Secretary, Corning Incorporated, HQ-E2-10, Corning, NY 14831. The annual report, proxy statement, Form 10-K and other information can also be accessed electronically through the Investor Relations page of the Corning website at www.corning.com.
Investor Information
Investment analysts and investors who need additional infor-mation may contact Ann Nicholson, Division Vice President, Investor Relations, Corning Incorporated, HQ-E2-25, Corning, NY 14831. Telephone: 607.974.9000.
Common Stock
Corning Incorporated common stock is listed on the New York Stock Exchange. In addition, it is traded on the Boston, Midwest, Pacific, and Philadelphia stock exchanges. Common stock options are traded on the Chicago Board Options Exchange. The ticker symbol for Corning Incorporated is “GLW.”
Transfer Agent & Registrar
Computershare Trust Company P.O. Box 30170, College Station, TX 77842-3170Telephone: 800.255.0461Website: www.computershare.com/contactus
Independent Auditors
Printed in the USA
PricewaterhouseCoopers LLP
New York, NY 10017
Executive Certifications
Corning submitted its 2013 Annual CEO Certification to NYSE on compliance with NYSE corporate governance listing standards, and filed with the SEC its Sarbanes Oxley Act 301 Certifications as exhibits to its most recent Form 10-K.
300 Madison Ave.

Board of Directors
John Seely Brown Retired Chief Scientist Xerox Corporation Palo Alto, CA(2) (5)
Stephanie A. BurnsRetired Chairman& Chief Executive OfficerDow Corning CorporationSunset, SC(3) (4)
John A. Canning, Jr.Co-Founder & ChairmanMadison Dearborn Partners, LLCChicago, IL(4) (5) (6)
Richard T. ClarkRetired Chairman, President& Chief Executive OfficerMerck & Co., Inc.Whitehouse Station, NJ(2) (5) (6)
Robert F. Cummings, Jr.Vice Chairmanof Investment BankingJPMorgan Chase & Co.New York, NY(3) (4) (6)
James B. FlawsVice Chairman& Chief Financial OfficerCorning IncorporatedCorning, NY(4) (6)
Deborah A. HenrettaGroup President of Global BeautyProctor & GambleCincinnati, OH(1) (4)
Kurt M. LandgrafRetired President& Chief Executive OfficerEducational Testing ServicePrinceton, NJ(1) (2) (6)
Kevin J. MartinPartnerPatton Boggs, LLPWashington, DC(3) (4)
Deborah D. Rieman Executive Chairman MetaMarkets Group Woodside, CA(1) (2)
Hansel E. Tookes IIRetired Chairman& Chief Executive OfficerRaytheon Aircraft CompanyPalm Beach Gardens, FL(2) (5) (6)
Wendell P. Weeks Chairman of the Board, Chief Executive Officer& PresidentCorning IncorporatedCorning, NY(6)
Mark S. WrightonChancellor& Professor of ChemistryWashington University in St. LouisSt. Louis, MO(1) (4)
Corporate Officers
Wendell P. WeeksChairman of the Board,Chief Executive Officer& President
James B. FlawsVice Chairman& Chief Financial Officer
Kirk P. GreggExecutive Vice President& Chief Administrative Officer
Lawrence D. McRae Executive Vice President — Strategy & Corporate Development
David L. MorseExecutive Vice President& Chief Technology Officer
Lewis A. SteversonSenior Vice President & General Counsel
Jeffrey W. EvensonSenior Vice President& Operations Chief of Staff
Mark S. RogusSenior Vice President& Treasurer
R. Tony TripenySenior Vice President& Corporate Controller
Linda E. JollyCorporate Secretary
Other Officers
Mark A. BeckExecutive Vice President —Environmental Technologies& Life Sciences Business Group
James P. ClappinPresident —Corning Glass Technologies
Martin J. CurranExecutive Vice President& Innovation Officer
Clark S. KinlinExecutive Vice President —Optical Communications
Eric S. MusserPresident —Corning International
Christine M. Pambianchi Senior Vice President — Human Resources
Thomas AppeltVice President —Corning InternationalEmerging Markets
Madapusi K. BadrinarayanVice President& Research Director —Inorganic & Broad-basedTechnologies
John P. Bayne, Jr.Vice President& General Manager —High Performance Displays
Gary S. Calabrese Senior Vice President — Global Research
Cheryl C. CappsVice President —Global Supply Management
Jack H. ClelandVice President,Deputy General Counsel& Chief Compliance Officer
Charles R. CraigSenior Vice President —Science & Technology
Michael W. Donnelly Vice President — Business Services
Richard M. EglenVice President& General Manager —Life Sciences
Li FangPresident& General Manager —Corning Greater China
Lisa FerreroGeneral Manager —Display Technologies
Susan L. Ford Vice President — Tax
Vivian L. GernandVice President & ChiefInformation Security Officer
Marc S. GirouxSenior Vice President& Chief Engineer —Global ManufacturingTechnology & Engineering
Clifford L. HundGeneral Manager & President — Corning East Asia
Wilfred M. Kenan, Jr.Vice President& Manufacturing Manager —Environmental Technologies
Lydia A. KentonVice President —Commercial OperationsLife Sciences
John P. MacMahonSenior Vice President —Global Compensation & Benefits
Jean-Pierre Mazeau Senior Vice President — Corporate Product& Process Development
Kevin J. McManusSenior Vice President& Chief Information Officer
Stephen P. MillerVice President& General Manager —Corning Optical Fiber & Cable
Timothy J. ReganSenior Vice President —Worldwide Government Affairs
Robert J. RitchieVice President —Technology Exchange
James R. SteinerSenior Vice President& General Manager —Specialty Materials
Curt WeinsteinVice President& General Manager —Advanced Optics
Mariam O. WrightSenior Vice President —Manufacturing
Board Committees: (1) Audit; (2) Compensation; (3) Corporate Relations; (4) Finance; (5) Nominating & Corporate Governance; (6) Executive
© Corning Incorporated 2014. All Rights Reserved.
For more than 160 years, Corning has applied its unparalleled expertise in specialty glass, ceramics, and optical physics to develop products that have created new industries and transformed people’s lives.
Cover: Corning’s proprietary fusion process feeds molten glass into a trough called an “isopipe,” filling until the glass flows evenly over both sides. It then rejoins — or fuses — at the bottom, where it is drawn down to form a continuous sheet of extremely precise flat glass.
Glass Envelope for Edison’s Light Bulb — 1879 Television Tube — 1939 Glass-Ceramic/Pyroceram® — 1952 L
160 yearsover
261068_LRI_CVR_R3.indd 2 3/3/14 9:40 AM

Corning IncorporatedOne Riverfront PlazaCorning, NY 14831-0001
U.S.A.
www.corning.com
02AR40013EN
© Corning Incorporated 2014. All Rights Reserved.
FPO
Engineering the Future
2013 Annual Report
261068_LRI_CVR_R3.indd 1 3/3/14 9:40 AM