Embed Size (px)
Citation preview
Engineering Fracture Mechanics 150 (2015) 96–114
Contents lists available at ScienceDirect
Engineering Fracture Mechanics
journal homepage: www.elsevier .com/locate /engfracmech
A crack-tracking technique for localized cohesive–frictionaldamage
http://dx.doi.org/10.1016/j.engfracmech.2015.10.0390013-7944/� 2015 Elsevier Ltd. All rights reserved.
⇑ Corresponding author.E-mail addresses: [email protected] (S. Saloustros), [email protected] (L. Pelà), [email protected] (M. Cervera).
Savvas Saloustros ⇑, Luca Pelà, Miguel CerveraInternational Center for Numerical Methods in Engineering (CIMNE), Universitat Politècnica de Catalunya (UPC-BarcelonaTech), Jordi Girona 1-3, 08034Barcelona, Spain
a r t i c l e i n f o
Article history:Received 15 May 2015Received in revised form 14 September 2015Accepted 26 October 2015Available online 29 October 2015
Keywords:Continuum damage modelCrack-propagationCrackingStrain localizationMohr–Coulomb
a b s t r a c t
This paper extends the use of crack-tracking techniques within the smeared crackapproach for the numerical simulation of cohesive–frictional damage on quasi-brittlematerials. The mechanical behaviour is described by an isotropic damage model with aMohr–Coulomb failure surface. The correct crack propagation among the two alternativefracture planes proposed by the Mohr–Coulomb theory is selected with the use of anenergy criterion based on the total elastic strain energy. The simulation of three benchmarkproblems of mixed-mode fracture in concrete demonstrates that the proposed methodol-ogy can reproduce the material’s frictional characteristics, showing robustness, as wellas mesh-size and mesh-bias independence.
� 2015 Elsevier Ltd. All rights reserved.
1. Introduction
The accurate structural assessment of existing structures and the efficient design of new ones necessitate, apart from thecomprehensive knowledge of the construction materials’ characteristics, the realistic simulation of fracture phenomena,potentially leading to structural failure. Geomaterials, such as concrete, mortar and bricks, are typically found in the existingbuildings. Owing to their high competence under compressive loading, the critical state in such materials is usually deter-mined by their shear or tensile capacity. Under these two stress states, fracture initiates upon reaching the material’s ulti-mate capacity and propagates exhibiting a drop in the stress (i.e. stress softening) for increasing strain. It is for this reasonthat these materials are termed as quasi-brittle materials.
Simulation of fracture in quasi-brittle materials within the computational failure mechanics is possible by means of twoalternative ways: the discrete and the smeared crack approaches. In the discrete crack approach, cracking is modelled as anactual discontinuity within the discretized finite element domain. In most of the numerical strategies of the discrete crackapproach the onset and the propagation of the modelled crack bases on energy criteria. On the contrary, in the smeared crackapproach the fracture is initiated by a stress/strain criterion and is modelled as smeared within the area of a finite element bymodifying its mechanical properties (stiffness and strength). For a comprehensive review of discrete and smeared crackapproaches the reader is referred to [13,19,20,5,6,35].
Independently of the approach chosen to simulate fracture, it was soon realised that the numerical solution was stronglydependent on the discretization characteristics of the analysed domain, i.e. there was a strong mesh-bias dependence. Toovercome this drawback, the aforementioned numerical strategies are usually enhanced by means of an integrated

Nomenclature
Symbolsc cohesionC isotropic linear-elastic constitutive tensord damage indexD specific dissipated energyE Young’s modulusf t tensile strengthf c compressive strengthGf tensile fracture energyhe average element sizeHd discrete softening parameterHmat material softening parameterldis discrete characteristic widthlmat material characteristic lengthle finite element sizer damage threshold internal variablerexcl exclusion radius defined by the userrneigh radius of the neighbourhood where ~Vc is computedrcrack radius for the application of the energetic criterionrcrit radius defined by the user used for the selection of rcrackr0 initial value of the damage threshold internal variablev Poisson’s ratioVe the volume of element e~Ve crack direction for the current element~Vc crack average direction vector~Vc;max vector which forms an angle amax with vector ~Vc
V1; V2 the volume of the potential cracks in the directions h1 and h2w1; w2 the elastic strain energy per volume crack for crack propagation h1 and h2We the elastic strain energy of element ea angle between ~Vc and ~Ve
amax maximum curvature angleb angle between a potential failure surface and the direction of the minimum principal stressesdj distance between new potential and crack tip/root elementh1;2 direction of the two potential fracture planes according to the Mohr–Coulomb theoryR equivalent stressr normal stressr stress tensor�r effective stress tensors shear stresse strain tensorwe the selected crack propagation angle of element eu internal friction angleU damage criterionxe direction of the minimum principal stresses of element e: double contraction
AbbreviationsDEN double edge notchedXFEM Extended Finite Element MethodEFEM Embedded Finite Element Method
S. Saloustros et al. / Engineering Fracture Mechanics 150 (2015) 96–114 97
crack-tracking procedure. The use of crack-tracking techniques permits to identify the path for the crack propagation andallow in this way the application of the selected numerical strategy on a restricted part of the mesh. This necessity forthe prediction of the crack propagation has triggered the research on the methodology to identify the correct crack path.Within the discrete crack method, a variety of procedures have been proposed. These include on one hand the use of localcriteria, where the crack propagates towards the direction of the maximum circumferential stress at the vicinity of the cracktip [2,40,23,44] or perpendicular to the direction of the maximum principal stress of an averaged stress/strain tensor at the

98 S. Saloustros et al. / Engineering Fracture Mechanics 150 (2015) 96–114
vicinity of the advancing crack [42,18]. On the other hand, global criteria have been proposed by Oliver and co-workers[27,28] and Meschke and Dumstorff [22]. In the first methodology the crack-direction is determined by iso-lines runningperpendicular to the maximum principal stresses, while in the latter both the crack orientation and extension are includedas additional unknowns in the variational formulation. A comparison of the above methodologies is available in [16]. Theinventory of crack propagation criteria within the smeared crack approach is still narrow. In the first application of crack-tracking techniques within the smeared approach, Cervera and Chiumenti [5,6] determined the crack direction using theaforementioned global criterion of Oliver and co-workers [27,28]. Later, the concept of tracking of the crack path was appliedat a local level [7] with the crack orientation determined to be perpendicular to the direction of the maximum principalstresses at the crack tip. Within this local criterion, spurious changes of propagation direction can be avoided by the oppor-tune correction of the crack orientation based on potentially and consolidated damaged elements [7] or by means of delayedcrack path fixation [39]. Another competent way for modelling strain localization within the smeared crack approach is theuse of mixed stress/displacement or strain/displacement formulations [8,9,11,1]. An important feature of these mixedformulations is their general applicability to two and three-dimensional problems without the necessity of an auxiliarycrack-tracking technique.
A common ground of the majority of the presented crack propagation criteria is the explicit or implicit assumption thatthe crack propagates in a direction perpendicular to the maximum principal stress direction. This hypothesis is consistentwith the Rankine failure criterion, in which cracking occurs when the maximum stress reaches the tensile strength of thematerial on a plane orthogonal to the first stress eigenvector (see Fig. 1). However, for a failure criterion different from
Fig. 1. Failure planes of Mohr–Coulomb, Rankine and Tresca failure criteria in the r; s plane.

S. Saloustros et al. / Engineering Fracture Mechanics 150 (2015) 96–114 99
Rankine’s (e.g. Tresca or Mohr–Coulomb, see Fig. 1), the failure condition is satisfied in two potential planes diverging fromthe direction of the minimum principal stresses by an angle b [10,43]. Inevitably, these cases require a crack propagationcriterion that (a) is consistent with the used failure criterion and (b) is capable to select the correct propagation directionbetween the two potential ones.
The aim of this work is to propose a crack-propagation criterion that is consistently connected to the assumed failure cri-terion. The study focuses on the simulation of fracture in geomaterials, which present cohesive–frictional characteristicsunder shear failure. Therefore, cracks due to shear or tension are considered separately, with different propagation criteriafor each case. Crack propagation in the direction perpendicular to the maximum principal stresses is attained only for thecase of pure tension. Under shear, the crack propagation direction is defined according to the Mohr–Coulomb planes of fail-ure. To this end, the answer to the dilemma on the correct selection among the two alternative potential fracture planesdefined by the Mohr–Coulomb theory is sought with the use of an energy criterion based on the total elastic strain energy.
The paper is organized in the following way. Section 2 includes a brief review of the Mohr–Coulomb theory, as well as thedescription of the tensile and shear failures considered in this work. Section 3 presents an overview of the used continuumdamage model. Then, the proposed local crack-tracking algorithm is described in detail in Section 4. Section 5 presentsnumerical examples for the validation of the algorithm’s capacity to simulate the frictional characteristics in quasi-brittlematerials. The paper ends with some concluding remarks in Section 6.
2. Criterion for crack initiation and propagation
2.1. The Mohr–Coulomb theory of rupture
Geomaterials such as rocks, concrete and mortar, exhibit quite different strength in tension and compression. As a con-sequence, the simulation of fracture in these materials requires a pressure dependent criterion. Such criterion occurs in theMohr–Coulomb theory of failure. Mohr’s postulate, dating from 1900, states that failure occurs on a plane where the normal(r) and the shear (s) stresses reach a critical combination. For isotropic materials, in which the strength properties are thesame when the shear stress is reversed, this critical combination can be expressed as:
f ¼ s� gðrÞ ¼ 0 ð1Þ
A special case of Mohr’s postulate is when the bounding curves gðrÞ are straight lines in the form of Coulomb’s equation,dating from 1773:
gðrÞ ¼ c � r tanu ð2Þ
where c is the cohesion and u the internal friction angle of the material. The use of Coulomb’s model of friction in Eq. (1)results in the Mohr–Coulomb failure criterion:jsj ¼ c � r tanu ð3Þ
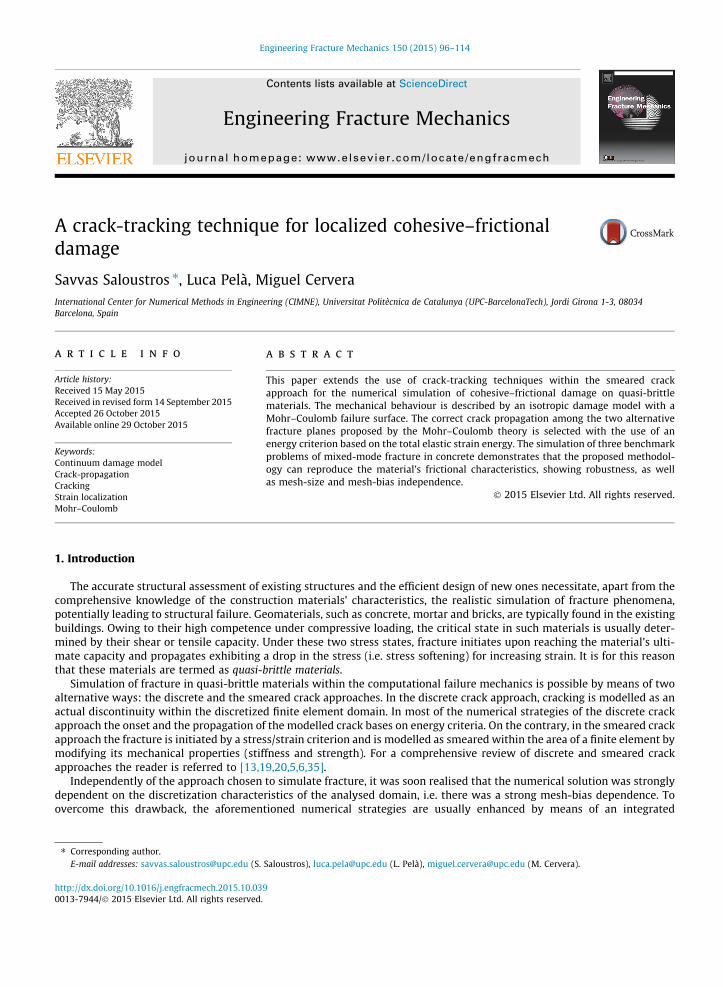
In the r; s plane, Eq. (3) represents two straight lines symmetrical to the r-axis (see Fig. 2). An alternative way for present-ing Mohr–Coulomb’s failure criterion is in terms of the principal stresses:f ðr1;r3Þ ¼ r1
f t� r3
f c� 1 ¼ 0; r1 P r2 P r3 ð4Þ
where f t and f c are the tensile and compressive strength of the material equal to:
f t ¼2c cosu1þ sinu
f c ¼2c cosu1� sinu
ð5a—bÞ
From Eq. (5a–b) the friction angle and cohesion can be expressed in terms of the tensile and the compressive strength:
u ¼ sin�1 f c=f t � 1f c=f t þ 1
� �0 6 u <
p2; c ¼ 1
2
ffiffiffiffiffiffiffiffif cf t
qð6a—bÞ
Fig. 3 illustrates the dependence of the failure surface on the compressive to tensile strength ratio (or the friction angleand cohesion). As expected, for f c=f t ¼ 1 (u ¼ 0Þ the Mohr–Coulomb failure criterion coincides with Tresca’s hexagon. On theother end, a large compressive to tensile strengths ratio (f c=f t ! 1 or u! p=2) results in the coincidence of the Mohr–Cou-lomb failure surface with Rankine’s one (Fig. 3).
2.2. Failure types
In the present work, under plane stress conditions, two types of failure are considered depending on the stress-state atthe location of the crack origin: (a) tensile failure and (b) shear failure. Tensile failure occurs under a stress state of puretension, i.e. the criterion is violated in the first quadrant in Fig. 3, and is characterized by a crack forming in a directionperpendicular to the maximum principal stress/strain. Shear failure occurs when r1r3 < 0, viz. the criterion in Fig. 3 is
Fig. 2. Mohr–Coulomb failure criterion in the r; s plane.
Fig. 3. Comparison of Mohr–Coulomb failure criterion with Tresca and Rankine in the biaxial stress plane.
100 S. Saloustros et al. / Engineering Fracture Mechanics 150 (2015) 96–114
violated either in the second or fourth quadrant. Under such conditions, the normal and shear stresses reach a critical com-bination on two planes. These planes, noted by the points B and B0 in Fig. 2, are symmetrical with respect to the direction ofthe minimum principal stress diverging from it by an angle b ¼ � p
4 � u2
� �, depending on the frictional characteristics of the
material.

S. Saloustros et al. / Engineering Fracture Mechanics 150 (2015) 96–114 101
3. Continuum damage model
In this work, fracture of material is simulated by the use of a constitutive model based on continuum damage mechanics[4]. This model has proven to be adequate for the analysis of structures made of quasi-brittle materials such as concrete e.g.[5,6] and masonry e.g. [30,31,32].
The constitutive equation for the damage model is defined as:
r ¼ ð1� dÞ�r ¼ ð1� dÞC : e ð7Þ
where �r denotes the effective stress tensor [21] computed in terms of the total strain tensor e and C is the usual fourth orderisotropic linear-elastic constitutive tensor. The damage index d represents the damage state of the material, varying fromzero when the material is undamaged to one when the material is completely damaged. In this work, the use of a single dam-age variable is justified by our aim to investigate fracture due to only tensile and shear stress states. In the general case,where damage due to compression may be critical, an equivalent damage model with two separate damage variables forcompressive and tensile damage can be used (see [36,34,33,38]).The equivalent stress is a positive scalar depending on the effective stress tensor and the failure criterion assumed. In thecurrent work, according to the Mohr–Coulomb theory, it assumes the following form:
R ¼ �r1 � f tf c
�r3 ð8Þ
where �r1 and �r3 are the maximum and minimum effective principal stresses, respectively.The damage criterion can be expressed as:
UðR; rÞ ¼ R� r 6 0 ð9Þ
The internal stress-like variable r represents the current damage threshold. Its value is determined as the maximumbetween r0 ¼ f t and the greatest value ever attained by the equivalent stress R during the loading history [4]:
r ¼ max½r0;maxðRÞ� ð10Þ
Following the above, the internal damage variable d can be defined in terms of the corresponding current value of thethreshold d ¼ dðrÞ, so that it is a monotonically increasing function such that 0 6 d 6 1. In particular, the following exponen-tial function is considered:
dðrÞ ¼ 1� r0rexp �2Hd
r � r0r0
� �� �r0 6 r ð11Þ
where Hd P 0 is the discrete softening parameter. For ensuring mesh-size independence the specific dissipated energy D isadjusted for each damaged finite element so that the equation
Dldis ¼ Gf ð12Þ
holds, where ldis is the discrete crack characteristic width and Gf the tensile fracture energy of the material. For the isotropicdamage model with exponential softening the specific dissipated energy is [6]:D ¼ 1þ 1Hd
� � ðf tÞ22E
ð13Þ
Using Eqs. (12) and (13) the discrete softening parameter is defined as:
Hd ¼ ldislmat � ldis
ð14Þ
where the material characteristic length lmat ¼ 1=Hmat , with Hmat ¼ ðf tÞ2=ð2EGf Þ, depends only on the material properties.Finally, the discrete crack characteristic width can be taken as the representative size of the element ldis ¼ le ¼
ffiffiffiffiffiffiffiffi2Ae
p, being
Ae the surface of the triangular element.
4. The local crack-tracking algorithm
The proposed crack-tracking technique is based on the algorithm developed by Cervera and co-workers [7]. This sectionincludes an overview of the algorithm, focusing on the added features for the simulation of cohesive–frictional damage.
The methodology bases on a labelling system and is applied at the beginning of each load increment. According to thestress field of the previous converged load increment, the algorithm identifies new cracks within the discretized domain. Fol-lowing this, the propagation of the old and the new cracks is defined according to the stress state of the crack tip or the crackorigin elements, respectively. Then, the elements lying on the crack path are recognised and labelled as able to damage. Thislabelling system remains unchanged during the equilibrium equations of the current load increment, when the stress field is

Fig. 4. Flowchart with the basic steps of the proposed local crack-tracking algorithm.
102 S. Saloustros et al. / Engineering Fracture Mechanics 150 (2015) 96–114
evaluated activating the constitutive law presented in Section 3 only for the labelled as able to damage elements. Fig. 4 illus-trates the main steps of the proposed algorithm that are detailed in the following sections.
4.1. New crack detection
The crack-tracking algorithm starts with the detection of new cracks. For the purposes of this work, new cracks originateat the boundaries of the domain, at elements satisfying Mohr–Coulomb’s failure criterion, as defined in Eq. (4). In the case ofseveral elements reaching failure at the same increment, an exclusion radius criterion is applied [7]. Under this criterion, theelement with the highest value of f ðr1;r3Þ within a defined by the user radius rexcl is labelled as a crack root element.
4.2. Crack propagation
The next step of the algorithm consists in determining the crack propagation direction for new and old cracks. This pro-cedure takes place either at the crack root elements for new cracks or at the crack tip elements for consolidated cracks. A cracktip element is an element located at the propagating front of an old crack.
Depending on the stress-state of the crack tip/root element, two types of failure may occur and, consequently, two alter-native values of the propagation angle w0 can be defined for the crack tip element:
(a) Tensile failure. An element fails in tension when its principal stresses are greater or equal to zero. In this case, the crackpropagates towards a direction x, perpendicular to the direction of the maximum principal stress.

S. Saloustros et al. / Engineering Fracture Mechanics 150 (2015) 96–114 103
(b) Shear failure. An element fails in shear when it has at least one tensile and one compressive principal stresses. Asdescribed in Section 2.2, in this case failure can occur in two possible planes according to the Mohr–Coulomb theoryof fracture, see Fig. 2. The two possible crack-propagation directions h1;2 are:
h1 ¼ xþ p4�u
2
; h2 ¼ x� p
4�u
2
ð15a—bÞ
The selection among these two fracture planes is decided in this work with the use of an energy-based criterion that willbe presented in Section 4.3.
Once the propagation direction for each crack is decided, then the path of each crack is evaluated and the elements per-taining to it are labelled as potential elements to damage in the current load increment. Fig. 5b illustrates this procedure.Starting from the crack tip/root element, the neighbour element lying on the defined crack propagation direction is labelledas the new potential element. To this end two actions are carried-out:
1. Determination of the crack angle of the new potential element. During an increment each crack will propagate in the direc-tion determined from the crack tip/root element, i.e. either perpendicular to the direction of the maximum principal stressor according to Eq. (15a–b). However, the value of the cracking angle of the new potential element (we) is calculatedaccording to its own stress state and therefore is denoted by xe; he1; or he2.
2. Control and correction of the propagation angle. The maximum curvature criterion ensures that no spurious change occurs
in the crack direction [7]. To achieve this purpose, the angle a between the vector ~Ve and the vector ~Vc is calculated. The
vector ~Ve denotes the crack direction for the new potential element. The vector ~Vc represents the vector sum of the crackdirections of both the potential elements and the consolidated damaged elements within a neighbourhood of radius rneigh(see Fig. 5b). The radius rneigh is a length defined by the user and it is measured from the centroid of the current tip potential
element. In case of a 6 amax, the vector ~Ve is used for the crack propagation direction of the new potential element. In case
of a > amax, the vector ~Vc is used for the definition of the crack propagation direction.
Following these two actions, the next potential element lying on the crack path can be recognised. The above procedurecontinues until two cracks coalesce (crack meeting criterion), a crack reaches the mesh boundary (boundary criterion) orthe value f ðr1;r3Þ (see Eq. (4)) of the new potential element is lower than a threshold defined by the user (stress thresholdcriterion). In this work the threshold used is f ðr1;r3Þ ¼ �0:25 [7].
After performing the above procedure for all the new and old cracks of the analysed domain, each element is clarified intotwo categories. The first one declares the cracking state of the element:
Fig. 5. Basic steps of the proposed local crack-tracking algorithm: selection between the two possible crack propagation directions for frictional failure(a) and labelling of potential elements with angle correction (b).
104 S. Saloustros et al. / Engineering Fracture Mechanics 150 (2015) 96–114
� Intact & unable to damage element: element that does not belong to any crack and will remain linear elastic.� Intact & able to damage element: element that belongs to a crack path and it is allowed to damage during the current loadincrement.
� Damaged element: element belonging to a consolidated crack and has entered the non-linear regimen.
The second category denotes the selected crack propagation direction of each damaged element.
� x: damaged element with crack propagation direction perpendicular to the direction of the maximum principal stress.� h1: damaged element with crack propagation direction equal to h1 ¼ xþ ðp=4�u=2Þ.� h2: damaged element with crack propagation direction equal to h2 ¼ x� ðp=4�u=2Þ.
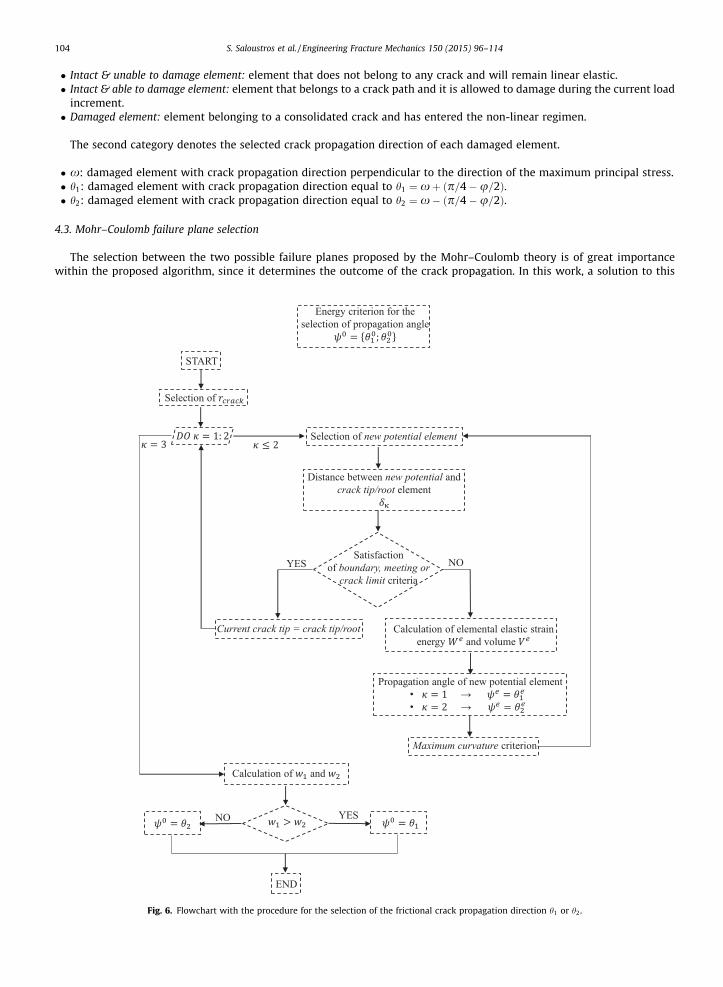
4.3. Mohr–Coulomb failure plane selection
The selection between the two possible failure planes proposed by the Mohr–Coulomb theory is of great importancewithin the proposed algorithm, since it determines the outcome of the crack propagation. In this work, a solution to this
Fig. 6. Flowchart with the procedure for the selection of the frictional crack propagation direction h1 or h2.

S. Saloustros et al. / Engineering Fracture Mechanics 150 (2015) 96–114 105
dilemma is given by evaluating the elastic strain energy fields of the two possible crack paths prior to their opening. Theselected path is the one with the highest stored elastic strain energy. This choice is based on the premise that upon fracturethe material neighbouring to the fracture zone will unload elastically. In this way the strain energy release is maximized,minimizing the total strain energy of the body. This procedure also minimizes the energy dissipated during the developmentof the fracture. Similar criteria have proved to be successful in geotechnical engineering simulations for determining thepropagation of fracture in faults (see [29,26]).
The process for the selection of the crack propagation direction starts after the crack tip and crack root elements aredefined (see Fig. 4). Then for each crack tip/root element the procedure, illustrated in Fig. 6, for determining the crack prop-agation direction is as follows:
1. The two possible angles for the crack propagation of the crack tip/root element are defined.2. For each of these two angles, the two possible crack paths are determined and the composing potential elements on each
of them are defined (Fig. 5a). This occurs in the following order:i. The crack propagation direction of the crack tip element is defined at the direction of h1.ii. For this crack propagation direction, the new potential element is identified.iii. The distance dj between the centroid of the new potential element and the centroid of the crack tip/root element is
computed.iv. If the new potential element lies within the limit of the radius rcrack (defined in the step (vii) of this section) the total
strain energy We on the volume Ve are computed:
We ¼ZVe
12r : edV ð16Þ
where r and e are the stress and strain tensors of the new potential element and Ve is the volume of the element.v. The propagation angle of the new potential element is calculated and the maximum curvature criterion is applied.vi. The new potential element is named as current crack tip and the above steps are repeated.vii. The procedure stops when the crack meeting criterion, the boundary criterion or the crack limit criterion is satisfied. The
first two are the same criteria as described in Section 4.2. The crack limit criterion is satisfied when the distancebetween the crack tip/root and the new potential element dj overpasses a radius rcrack (see Fig. 5a). This radius is cal-culated for each crack at each load increment. It is the minimum between a radius defined by the user rcrit and thedistance between the crack tip/root and the last potential element before the crack meets a mesh boundary or anothercrack.
viii. When one of the above criteria is met, the steps from (ii) to (vii) are repeated with the crack propagation direction ofthe crack tip/root element set as h2.
3. To this end, with the composing elements of the two possible cracks and their strain energy and volume defined, the totalstrain energy per crack volume for each of the two cracks can be defined as:
Fig. 7. Geometry and load for double edge notched specimen [24].

Fig. 8. Experimentally obtained crack patterns in the front (solid lines) and rear (dashed lines) faces for double edge notched specimens [24].
Fig. 9. Load-path 4a for f c=f t ¼ 20: contour of the selected crack propagation direction in the damaged elements case h1 (a), case h2 (b) and load vsdisplacement (P–d) for the two possible fracture planes (c).
106 S. Saloustros et al. / Engineering Fracture Mechanics 150 (2015) 96–114
w1 ¼ 1V1
Xni
Wei w2 ¼ 1
V2
Xmj
Wej ð17a—bÞ
The crack volume at each direction (V1;V2Þ is defined as the sum of the volume of the elements (VeÞ pertaining to thecrack path,
V1 ¼Xni
Vei ; V2 ¼
Xmj
Vej ð18a—bÞ
where i ¼ 1; n are the elements on the direction of the crack determined with h1 and j ¼ 1; m are the elements on thedirection of the crack determined with h2.

S. Saloustros et al. / Engineering Fracture Mechanics 150 (2015) 96–114 107
Finally, the selected crack direction for the particular increment is the direction with the greatest strain energy per crackvolume.
5. Numerical examples
In this section, the proposed formulation is applied to the analysis of three benchmark problems for mixed mode fracturein concrete. They correspond to a series of experiments on a double edge notched (DEN) specimen under non-proportionalloading, performed by Nooru-Mohamed [24]. The tested concrete specimen is square shaped with dimensions200 � 200 � 50 mm3 and two notches with a depth of 25 mm and height of 5 mm at each lateral side. The DEN specimenwas glued to four platens in the configuration of Fig. 7. The numerical simulations correspond to the load-path 4 of theexperimental campaign, which was performed in two steps. In the first one, a compressive load was applied to the lateralplatens in displacement control up to a value Ps. Subsequently, a traction load P was applied over the top platen in displace-ment control keeping the lateral force Ps constant under load control. Fig. 8 illustrates the cracking patterns observed at theDEN specimens after the experiments for the load paths 4a (specimen 48-03), 4b (specimen 46-05) and 4c (specimen 47-06)corresponding to lateral force Ps = 5 kN, 10 kN and 27.5 kN respectively. Two concrete specimens were tested for load-path4b, whereas only one specimen was tested for load-paths 4a and 4c. Nooru-Mohamed mentions that although theexperiment itself as well as the experimental apparatus were sophisticatedly designed, undesirable eccentricities in the
Fig. 10. Load-path 4a: contour of the selected crack propagation direction in the damaged elements for Mohr–Coulomb’s criterion and f c=f t ¼ 5 (a),f c=f t ¼ 20 (b), f c=f t ¼ 1 (c); for Rankine’s criterion and f c=f t ¼ 20 (d) and load vs displacement (P–d) for different compressive to tensile strength ratios (e).

108 S. Saloustros et al. / Engineering Fracture Mechanics 150 (2015) 96–114
experiment can be provoked by the skew-symmetric bonding of the specimen to the steel platens, the possible relative rota-tions between the two used coupled frames and the non-symmetric behaviour of the springs (in the longitudinal direction)that were used to avoid the in-plane rotation of the DEN specimen. For a comprehensive discussion on the experimental pro-cedure, apparatus and problems the reader is referred to the original work [24,25].
The material parameters used for the numerical simulation are based on the data provided by Nooru-Mohamed [24] andare the same for the three different load paths: tensile strength f t = 3.0 MPa, Young Modulus E = 30 MPa, Poisson’s ratiom = 0.2, and mode I fracture energy Gf = 110 J/m2.
The three experiments are discretized in an unstructured mesh with average mesh size of he = 2.5 mm (8394 nodes). Forload path 4c a second mesh is used, with average mesh size of he = 5 mm (2162 nodes), aiming to investigate the mesh-sizeand mesh-bias dependency of the algorithm. The discretization consists of 2D plane-stress 3-noded linear triangular ele-ments. The computational boundary conditions are exactly skew-symmetrical, with the central node of the mesh being fixedin the horizontal and vertical degrees of freedom. Regarding the input parameters for the local crack-tracking algorithm,rexcl ¼ 0:12 m and rcrit ¼ 0:03 m for all the presented examples. The definition of amax and rneigh has been unnecessary sinceno important bending occurs.
Calculations are performed with an enhanced version of the finite element program COMET [3,12], while pre and post-processing with GiD [17]. Both software have been developed at the International Center for Numerical Methods in Engineer-ing (CIMNE), in Barcelona. The discrete weak form of the problem is solved incrementally in a step-by-step manner. At eachload increment, the corresponding nonlinear equations are solved with the use of a modified Newton–Raphson method(using the secant stiffness matrix) along with a line search procedure. Convergence of an increment is attained when theratio between the iterative residual forces and the norm of the total residual forces is lower than 0.01 (1%).
The outline of each simulated experiment is as follows. Firstly, the two possible solutions indicated by the Mohr–Coulombfracture criterion are presented. It is noted that for these analyses the procedure for the angle selection has been turned-offand the angle of the fracture is selected explicitly to be equal to h1 or h2 according to the studied case. Following this, thecapacity of the local crack-tracking algorithm, proposed in Section 4, to model the frictional characteristics of quasi-brittle materials is demonstrated by presenting the numerical solutions for three different compressive to tensile strengthratios f c=f t ¼ 5;20;1. For comparison purposes, each example is simulated also with the use of the previous version ofthe local crack-tracking algorithm based in the Rankine failure criterion [7].
Fig. 11. Load-path 4b for f c=f t ¼ 20: contour of the selected crack propagation direction in the damaged elements: case h1 (a), case h2 (b) and load vsdisplacement (P–d) for the two possible fracture planes (c).

S. Saloustros et al. / Engineering Fracture Mechanics 150 (2015) 96–114 109
5.1. Load-path 4a
For load-path 4a the lateral compressive load applied during the first stage of the experiment is Ps = 5 kN. At the secondstage, the vertical displacement d is gradually increased keeping the lateral load Ps constant.
As commented, the numerical analysis of the specimen starts by presenting the two possible solutions according to theMohr–Coulomb postulate, for f c=f t ¼ 20. Hence, the results presented in Fig. 9 have been produced by turning off the pro-cedure described in Section 4.3 for the selection of the crack propagation direction. In these analyses, the fracture undershear propagates at a constant angle h1 (Fig. 9a) or h2 (Fig. 9b) depending on the case. Note that when damage occurs underpure tension the fracture propagates at a direction perpendicular to the maximum principal stresses (i.e.x). It can be seen inFig. 9a and b that, for this load-path, the cracking of the specimen is mostly defined by tensile failure. It is only a small part atthe middle of the crack that fails under shear and where the direction of the crack is different in the two analysed cases. As aresult, the dissipated energy is very similar for both cases. Nevertheless, the less curved crack for a propagation direction h1results in the slightly lower dissipated energy, see Fig. 9c.
Fig. 12. Load-path 4b: contour of the selected crack propagation direction in the damaged elements for Mohr–Coulomb’s criterion and f c=f t ¼ 5 (a),f c=f t ¼ 20 (b), f c=f t ¼ 1 (c); for Rankine’s criterion and f c=f t ¼ 20 (d) and load vs displacement (P–d) for different compressive to tensile strength ratios (e).

110 S. Saloustros et al. / Engineering Fracture Mechanics 150 (2015) 96–114
The capacity of the local crack-tracking algorithm to capture the effect of the material’s frictional properties is demon-strated by considering three different compressive to tensile strength ratios: f c=f t ¼ 5;20;1. As shown in Fig. 10, the effectof the frictional angle is evident in the crack propagation direction of the part of the crack failing under shear. In the samefigure, we can see that the curvature of the crack using the Mohr–Coulomb failure criterion with f c=f t � 1 (Fig. 10c) is iden-tical to that obtained by using Rankine (Fig. 10d). This outcome illustrates that the (nonrealistic) use of a friction angle ofalmost p=2 results in the coincidence of the Mohr–Coulomb failure criterion with that of the Rankine for tensile and shearstress states u � p=2 ) p
4 � u2
� � � 0� �
as presented previously in Section 2.1, Fig. 3.The small part of the crack failing under shear leads to the insignificant differences in the dissipated energy for the speci-
fic load path for the different values of f c=f t , as illustrated in the graph of Fig. 10e. In overall, the obtained load vs. displace-ment curves follow the same pattern as the experimental one presenting a slowly curving part when the cracks propagateand finally entering into a softening branch upon the cracks have sufficient length to develop the failure mechanism. How-ever, differences exist in terms of peak load and dissipated energy. This divergence has been observed by several authors(e.g., [15,41,14,37]) simulating the same test and can be possibly attributed to the experimental problems previouslydescribed.
5.2. Load-path 4b
In this load-path the lateral compressive force applied in the first step is Ps ¼ 10 kN. Then, a vertical traction is imposedby increasing gradually the vertical displacement d under the constant effect of Ps.
As for load-path 4a, first the procedure for the angle selection is turned-off and the two possible solutions according to theMohr–Coulomb postulate, i.e. h1 or h2 for failure under shear are presented for f c=f t ¼ 20. As shown in Fig. 11, the two cracksinitiate under tension, but soon after, they evolve under a shear stress state. As a consequence, the crack propagation direc-tion plays an important role to both the curvature of the crack and the dissipated energy, which can be appreciated inFig. 11a & b and Fig. 11c, respectively. In this case it is evident that a crack propagating at a direction h1 leads to a shortercrack with less curvature and to less dissipated energy.
The effect of the material frictional characteristics is evident in Fig. 12, which presents the obtained crack trajectories forf c=f t ¼ 5;20;1. As it is shown, the proposed formulation succeeds both in capturing the frictional properties of the material
Fig. 13. Load-path 4c for f c=f t ¼ 20: contour of the selected crack propagation direction in the damaged elements: case h1 (a), case h2 (b) and load vsdisplacement (P–d) for the two possible fracture planes (c).

S. Saloustros et al. / Engineering Fracture Mechanics 150 (2015) 96–114 111
and in selecting the h1 crack propagation direction in all the cases. Smaller compressive to tensile strengths ratios result in asmaller curvature of the crack trajectory and in less dissipated energy (see Fig. 12e). For the ratio f c=f t ¼ 5 the two cracksreach the opposite notch and the specimen starts rotating around the developed compressive strut, resulting in the suddendrop of load, as can be appreciated in Fig. 12e. Once again, when a high compressive to tensile strength ratio is selected, thesolution approaches the Rankine’s one (see Fig. 12c and d). Note that when f c=f t tends to infinity the two potential crackpropagation directions are almost equal (i.e. h1 � h2) in Mohr–Coulomb’s criterion, resulting in an identical possible crackpath in most cases.
Comparing to the experimental results, the obtained load vs. displacement graphs (Fig. 12e) show an overestimation ofthe predicted peak load. The same discrepancies have been observed in references (e.g. [16,14,39,37]). As commented before,the reason for this divergence may be due to the possible experimental eccentricities.
5.3. Load-path 4c
For load-path 4c the lateral load applied in the first stage Ps is equal to 27.5 kN. During the second stage of the simulationthe axial vertical displacement d is increased under the constant effect of the lateral load Ps.
Fig. 13a and b presents the two possible crack paths, for f c=f t ¼ 20, according to the Mohr–Coulomb postulate. Contrarilyto the previous two load-paths, and due to the high value of the lateral load Ps, the two cracks start and progress in this casemostly due to shear. Failure under pure tension is visible only at the end of the cracks and when the collapse mechanism iscompletely developed. As a consequence, the difference between the crack trajectories is important for the two possiblecrack propagation directions h1 and h2. This importance of the selected crack path is also reflected in the difference of thedissipated energy visible in the load vs. displacement curves of Fig. 13c.
Fig. 14 presents the solutions using the proposed algorithmwith two different meshes, including the procedure for select-ing among the two possible crack propagation directions of Section 4.3. As shown, the crack propagation direction h1, whichrequires less dissipated energy to form, has been correctly selected independently of the degree of refinement of the mesh.The difference in the level of discretization can be appreciated in Fig. 14a and b. In both cases two skew-symmetric cracksstart from the two notches and propagate towards the interior of the specimen. The crack curvature is very similar for the
Fig. 14. Load-path 4c: contour of the selected crack propagation direction in the damaged elements for mesh with element size he = 5.0 mm (a) andhe = 2.5 mm (b) and load vs. displacement (P–d) for two different meshes (c).

112 S. Saloustros et al. / Engineering Fracture Mechanics 150 (2015) 96–114
two meshes and no spurious mesh bias is observed. Fig. 14c shows the load versus displacement curves for these two sim-ulations. The two graphs present the same trend, with the dissipated energy being almost identical upon mesh-refinement.
Fig. 15 shows the effect of f c=f t for load-path 4c in the obtained crack trajectories. Due to the shear failure that occursalong the greatest length of the crack, the effect of the f c=f t is clearly observed also in the load vs. displacement curves, pre-sented in Fig. 15e. As for load-path 4b, for a ratio f c=f t ¼ 5 the two cracks form for very small values of vertical load, resultingin the sudden drop of the load and the rotation of the upper and lower parts of the specimen afterwards. Once again, thecoincidence between the Mohr–Coulomb criterion with f c=f t � 1 and the Rankine solution is evident both in terms ofthe crack-trajectory (Fig. 15c and d) as well as of the dissipated energy (Fig. 15e). Note that the proposed algorithm succeedsin selecting the crack propagation direction that minimizes the dissipated energy for all the studied ratios of f c=f t .
In general, the load displacement graphs attain the same shape as in the previous cases. However, the applied load needsto become compressive to keep stable the propagation of the crack. In the experimental results, a vertical compressive loadneeds to be applied from the beginning of the second stage of the experiment. This is related to the opening of the bottomcrack during the application of the lateral force Ps at the first stage of the experiment, as reported by the authors of the exper-iments [24]. The fact that the rear side of the same crack opened later comparing to the front side reveals the out-of-planebending effects experienced by the specimen, which may have affected the experiment and have led to the observed differ-ences between numerical and experimental outcomes e.g. [16,37]. As a result of the earlier cracking at the left notch, the
Fig. 15. Load-path 4c: contour of the selected crack propagation direction in the damaged elements for Mohr–Coulomb’s criterion and f c=f t ¼ 5 (a),f c=f t ¼ 20 (b), f c=f t ¼ 1 (c); for Rankine’s criterion and f c=f t ¼ 20 (d) and load vs displacement (P–d) for different compressive to tensile strength ratios (e).

S. Saloustros et al. / Engineering Fracture Mechanics 150 (2015) 96–114 113
experimental obtained crack trajectory of the lower and upper crack is different. Contrarily, in the numerical solution thetwo cracks show an almost perfect skew-symmetry.
6. Conclusions
This paper has presented a crack-tracking algorithm oriented to the study of fracture in quasi-brittle materials with cohe-sive–frictional behaviour. To this aim, a new crack-propagation criterion is proposed that is consistent with the failure typessuggested by the Mohr–Coulomb theory failure criterion under shear failure. This methodology extends the applicability ofcrack-tracking algorithms combined with the smeared crack approach to the simulation of mixed mode loading conditions ina larger family of construction materials.
The proposed crack-tracking algorithm categorizes cracking into shear and tensile. Under pure tension, cracking propa-gates towards a direction perpendicular to the direction of the maximum principal stress, whereas under shear crackingoccurs at a failure plane proposed by the Mohr–Coulomb theory. As shown from the simulated experiments, this separationof the crack regimens is a valuable tool for understanding fracture phenomena in mixed mode problems. Another specialfeature of the presented algorithm is the ability to select among the two mutually possible fracture planes proposed bythe Mohr–Coulomb failure criterion. To achieve this, an energy based criterion is applied at the propagating front of eachcrack prior to the crack opening. This procedure has proved capable to identify the crack path that maximizes the releasedstrain energy and minimizes the dissipated energy in cracking of concrete under non-proportional loading.
The presented crack-tracking algorithm results in mesh-bias independency of the numerical solution, while the use of thelocal continuum damage model ensures mesh-size independency. These features allow for the realistic, in qualitative andquantitative terms, numerical simulation of cracking phenomena in geomaterials within the framework of the smeared crackapproach. Additionally, the proposed algorithm offers a numerical solution with reasonable computational cost, since theoverhead of using the crack-tracking technique is relatively small. This makes the study of structures with multiple cracksfeasible. The proposed algorithm can be easily combined with different constitutive models or with discrete approaches suchas the X-FEM and E-FEM.
Acknowledgments
This research has received the financial support from the MINECO (Ministerio de Economia y Competitividad of the Span-ish Government) and the ERDF (European Regional Development Fund) through the MICROPAR project (Identification ofmechanical and strength parameters of structural masonry by experimental methods and numerical micro-modelling, refnum. BIA2012-32234) and from the Excellence Programme for Knowledge Generation by MINECO, through the EACY project(Enhanced accuracy computational and experimental framework for strain localization and failure mechanisms, ref.MAT2013-48624-C2-1-P).
References
[1] Benedetti L, Cervera M, Chiumenti M. Stress-accurate Mixed FEM for soil failure under shallow foundations involving strain localization in plasticity.Comput Geotech 2015;64:32–47.
[2] Cendón DA, Gálvez JC, Elices M, Planas J. Modelling the fracture of concrete under mixed loading. Int J Fract 2000;103(3):293–310.[3] Cervera M, Agelet de Saracibar C, Chiumenti M. COMET: COupled MEchanical and Thermal analysis. Data input manual, Version 5.0. Technical report
IT-308; 2002. <http://www.cimne.upc.es>.[4] Cervera M. Viscoelasticity and rate-dependent continuum damage models. CIMNE, Monography N-79. Barcelona (Spain): Technical University of
Catalunya; 2003.[5] Cervera M, Chiumenti M. Smeared crack approach: back to the original track. Int J Numer Anal Meth Geomech 2006;30(12):1173–99.[6] Cervera M, Chiumenti M. Mesh objective tensile cracking via a local continuum damage model and a crack-tracking technique. Comput Methods Appl
Mech Engng 2006;196(1–3):304–20.[7] Cervera M, Pelá L, Clemente R, Roca P. A crack-tracking technique for localized damage in quasi-brittle materials. Engng Fract Mech 2010;77
(13):2431–50.[8] Cervera M, Chiumenti M, Codina R. Mixed stabilized finite element methods in nonlinear solid mechanics. Part I: formulation. Comput Methods Appl
Mech Engng 2010;199:2559–70.[9] Cervera M, Chiumenti M, Codina R. Mixed stabilized finite element methods in nonlinear solid mechanics. Part II: strain localization. Comput Methods
Appl Mech Engng 2010;199:2571–89.[10] Cervera M, Chiumenti M, Di Capua D. Benchmarking on bifurcation and localization in J2 plasticity for plane stress and plane strain conditions. Comput
Methods Appl Mech Engng 2012;241–244:206–24.[11] Cervera M, Chiumenti M, Benedetti L, Codina R. Mixed stabilized finite element methods in nonlinear solid mechanics. Part III: compressible and
incompressible plasticity. Comput Methods Appl Mech Engng 2015;285:752–75.[12] COMET: Coupled Mechanical and Thermal analysis; 2013. <http://www.cimne.com/comet/>.[13] De Borst R. Fracture in quasi-brittle materials: a review of continuum damage-based approaches. Engng Fract Mech 2001;69:95–112.[14] DeJong MJ, Hendriks MAN, Rots JG. Sequentially linear analysis of fracture under non-proportional loading. Engng Fract Mech 2008;75(18):5042–56.[15] Di Prisco M, Ferrara L, Meftah F, Pamin J, De Borst R, Mazars J, et al. Mixed mode fracture in plain and reinforced concrete: some results on benchmark
tests. Int J Fract 2000;103(1991):127–48.[16] Dumstorff P, Meschke G. Crack propagation criteria in the framework of X-FEM-based structural analyses. Int J Numer Anal Meth Geomech
2007:239–59.[17] GiD: the personal pre and post-processor. Barcelona: CIMNE; 2014. <http://www.gidhome.com/>.[18] Jirásek M, Zimmermann T. Embedded crack model. Part II. Combination with smeared cracks. Int J Numer Meth Engng 2001;50(6):1291–305.[19] Jirásek M, Belytschko T. Computational resolution of strong discontinuities. In: Fifth world congress on computational mechanics, Vienna, Austria;
2002. p. 7–12.
114 S. Saloustros et al. / Engineering Fracture Mechanics 150 (2015) 96–114
[20] Karihaloo BL, Xiao QZ. Modelling of stationary and growing cracks in FE framework without remeshing: a state-of-the-art review. Comput Struct2003;81:119–29.
[21] Lemaitre J, Chaboche JL. Aspects phénoménologiques de la rupture par endommagement. J Méc Appl 1978;2:317–65.[22] Meschke G, Dumstorff P. Energy-based modelling of cohesive and cohesionless cracks via X-FEM. Comput Methods Appl Mech Engng 2007;196(21–
24):2338–57.[23] Moës N, Belytschko T. Extended finite element method for cohesive crack growth. Engng Fract Mech 2002;69(7):813–33.[24] Nooru-Mohamed M. Mixed-mode fracture of concrete: an experimental approach. PhD. Delft University of Technology; 1992.[25] Nooru-Mohamed MB, Schlangen E, van Mier JGM. Experimental and numerical study on the behavior of concrete subjected to biaxial tension and
shear. Adv Cem Based Mater 1993;1(1):22–37.[26] Okubo C, Schultz R. Evolution of damage zone geometry and intensity in porous sandstone: insight gained from strain energy density. J Geol Soc
2005;162(Engelder 1974):939–49.[27] Oliver J, Huespe AE. Theoretical and computational issues in modelling material failure in strong discontinuity scenarios. Comput Methods Appl Mech
Engng 2004;193(27–29):2987–3014.[28] Oliver J, Huespe AE, Samaniego E, Chaves EWV. Continuum approach to the numerical simulation of material failure in concrete. Int J Numer Anal Meth
Geomech 2004;28(78):609–32.[29] Olson EL, Cooke ML. Application of three fault growth criteria to the Puente Hills thrust system, Los Angeles, California, USA. J Struct Geol
2005;27(10):1765–77.[30] Pelà L, Cervera M, Roca P. Continuum damage model for orthotropic materials: application to masonry. Comput Methods Appl Mech Engng
2011;200:917–30.[31] Pelà L, Cervera M, Roca P. An orthotropic damage model for the analysis of masonry structures. Constr Build Mater 2013;41:957–67.[32] Pelà L, Cervera M, Oller S, Chiumenti M. A localized mapped damage model for orthotropic materials. Engng Fract Mech 2014;124–125:196–216.[33] Pelà L, Bourgeois J, Roca P, Cervera M, Chiumenti M. Analysis of the effect of provisional ties on the construction and current deformation of Mallorca
Cathedral. Int J Archit Heritage 2014. http://dx.doi.org/10.1080/15583058.2014.996920.[34] Petromichelakis Y, Saloustros S. Pelà L. Seismic assessment of historical masonry construction including uncertainty. In: Cunha Á et al., editors.
Proceedings of EuroDyn 2014; 2014. p. 297–304.[35] Rabczuk T. Computational methods for fracture in brittle and quasi-brittle solids: state-of-the-art review and future perspectives. ISRN Appl Math
2012;2013:1–61.[36] Roca P, Cervera M, Pelá L, Clemente R, Chiumenti M. Continuum FE models for the analysis of Mallorca Cathedral. Engng Struct 2013;46:653–70.[37] Roth S-N, Léger P, Soulaïmani A. A combined XFEM–damage mechanics approach for concrete crack propagation. Comput Methods Appl Mech Engng
2015;283:923–55.[38] Saloustros S, Pelà L, Roca P, Portal J. Numerical analysis of structural damage in the church of the Poblet monastery. Engng Fail Anal 2015;48:41–61.[39] Slobbe AT, Hendriks MAN, Rots JG. Smoothing the propagation of smeared cracks. Engng Fract Mech 2014;132:147–68.[40] Stolarska M, Chopp DL, Moës N, Belytschko T. Modelling crack growth by level sets in the extended finite element method. Int J Numer Meth Engng
2001;51(8):943–60.[41] Unger JF, Eckardt S, Könke C. Modelling of cohesive crack growth in concrete structures with the extended finite element method. Comput Methods
Appl Mech Engng 2007;196:4087–100.[42] Wells GN, Sluys LJ. A new method for modelling cohesive cracks using finite elements. Int J Numer Meth Engng 2001;50(12):2667–82.[43] Wu J-Y, Cervera M. On the equivalence between traction- and stress-based approaches for the modelling of localized failure in solids. J Mech Phys
Solids 2015;82:137–63. http://dx.doi.org/10.1016/j.jmps.2015.05.016.[44] Zi G, Belytschko T. New crack-tip elements for XFEM and applications to cohesive cracks. Int J Numer Meth Engng 2003;57(15):2221–40.


![A stabilized mixed explicit formulation for plasticity ...cervera.rmee.upc.edu/papers/2017-RIMNI-Explicit-Mixed-Plast-pre.pdf · deformaciones (MEX-FEM)[23, 24] para la solución](https://img.dokumen.tips/doc/110x75/5e180748c47ee14a8d66b70d/a-stabilized-mixed-explicit-formulation-for-plasticity-deformaciones-mex-fem23.jpg)