Embed Size (px)
Citation preview
Engineering Fracture Mechanics 169 (2017) 262–275
Contents lists available at ScienceDirect
Engineering Fracture Mechanics
journal homepage: www.elsevier .com/locate /engfracmech
Comparison of fracture test standards for a super pavedense-graded hot mix asphalt
http://dx.doi.org/10.1016/j.engfracmech.2016.10.0160013-7944/� 2016 Elsevier Ltd. All rights reserved.
⇑ Corresponding author at: 500 West University Avenue, Suite A126, El Paso, TX 79968, United States.E-mail addresses: [email protected] (C.M. Stewart), [email protected] (J.G. Reyes), [email protected] (V.M. Garcia).
Calvin Maurice Stewart a,⇑, Jesús Gerardo Reyes a, Victor M. Garcia b
aDepartment of Mechanical Engineering, The University of Texas at El Paso, United StatesbDepartment of Civil Engineering, The University of Texas at El Paso, United States
a r t i c l e i n f o
Article history:Received 18 July 2016Received in revised form 19 October 2016Accepted 24 October 2016Available online 25 October 2016
Keywords:Fracture resistanceHot mix asphaltTest standardsDigital image correlationRepeatability
a b s t r a c t
The objective of this work is to compare the semi-circular bend (SCB) and disk-compacttension (DCT) fracture tests for asphalt-aggregate mixtures. Fracture tests are performed.Statistical analysis, digital image correlation, and 3D scans show that the SCB tests measurea low fracture resistance with a high coefficient of variation due to stress concentrationsand plasticity developing at the anvil contact point. The DCT test is found to measure a highfracture resistance with a low coefficient of variation. The DCT tests is determined to pro-vide a superior measurement of fracture resistance. Evidence concerning the physical prob-lems with SCB is provided.
� 2016 Elsevier Ltd. All rights reserved.
1. Introduction
The accumulation of cracks in HMA layers is often due to damage induced by repeated traffic loading and climatic effects:defined as fatigue cracking [1]. The cracking of HMA layers is one of the predominate forms of distress observed in flexiblepavements, that significantly reduce service life [2]. An HMA overlay must have a balance of both good rut and crack resis-tance properties, to perform well in the field [3–5]. Over the past decade, HMA’s designed in Texas have been modified tominimize the deformation of roads and moisture susceptibility of new mixtures using the Hamburg rutting test. This testapplies vertical deformation to a specimen simulating constant traffic loading. Less attention has been paid to the crackingresistance of the new HMA surfaces. Stiffer binders and good stone-to-stone contact may improve rut resistance but it mayalso reduce the mix flexibility and cracking resistance [3].
The pavement industry is moving towards physics-based computational models as opposed to data-founded models forlife prediction. Experimental fracture mechanics has become the de facto choice of many scientists and researchers in thisarea to obtain physical measures of fracture resistance. Much effort has been directed towards the development of testingand analysis methods to study the cracking mechanisms of asphalt pavement [4–9]. To date, several performance tests havebeen proposed to determine the cracking resistance of HMAs such as the flexural fatigue, dissipated creep strain energy, indi-rect tension, Texas overlay, single-edge notch bend, disk-shaped compact tension (DCT), and semi-circular bend (SCB) tests[10]. So far, the definitive or best fracture test method to determine the cracking resistance of asphaltic materials has yet tobe determined.
Nomenclature
HMA hot mix asphaltDCT disk-shaped compact tensionSCB semi-circular bendingLEFM linear elastic fracture mechanicsEPFM elastic-plastic fracture mechanicsCOV coefficient of variationSP-D dense grade superpave3D-DIC three-dimensional digital image correlationGf fracture energyKIC fracture toughnessJc critical strain energy release rateAV% air void percentagea notch depthPmax peak loadWf work of fractureAlig ligament areaYI(0.8) dimensionless geometric factorU strain energy to failureeyy strain in the vertical directionexx strain in the horizontal direction
C.M. Stewart et al. / Engineering Fracture Mechanics 169 (2017) 262–275 263
Hot mix asphalts exhibit a viscoelastic plastic response, where cracks tend to grow through the asphalt binder and alongthe asphalt-aggregate interfaces. This tortuous cracking process creates a large plastic zone that exceeds the small-scaleplasticity limitation of the linear elastic fracture mechanics (LEFM) approach. The fracture toughness KIC has continued tobe used to analyze the fracture resistance of HMAs despite the deficits of LEFM [11–15]. The LEFM approach is assumed rea-sonable if the test temperature is 10 �C below the performance grade lower limit of the asphalt binder and the moduluschanges less than 5% for the duration of the test. These conditions are rarely met. In practice HMAs are subjected to a widertemperature range. As an alternative, elastic-plastic fracture mechanics (EPFM) has been introduced to measure the fractureresistance of HMAs. In EPFM, fracture resistance is measured using the energy of fracture (i.e. the energy required to open acrack).
The EPFM-based DCT and SCB tests have been identified as two of the most popular approaches to fracture resistancemeasurement of HMAs [16]. The prevalence of SCB testing stems from its simplicity, repeatability, and consistency [9].Recent studies by the Louisiana Transportation Research Center have shown that the SCB test is promising in evaluatingthe cracking resistance of HMAs [7]. They concluded that specimens with a pre-fabricated notch are more suitable at mea-suring the cracking properties of asphalt mixtures. The SCB test exhibits certain advantages as a cracking resistancepredictor:
(a) different notch depths, notch orientations, and specimen positioning can be introduced; hence, mixed-mode fractureproperties can be evaluated directly;
(b) the test setup and procedure are fairly simple and rapid;(c) the SCB specimens can be prepared directly from cylindrical samples obtained from standard cores prepared in a super
pave gyratory compactor or can be taken from field cores; and(d) multiple specimens can be obtained from one field core, reducing the error caused by the heterogeneity among cores
[17].
The main disadvantages of the SCB test is that it is susceptible to operator error where a small misalignment of the spec-imen will lead to mixed-mode fracture and fracture resistance measurements can exhibit low repeatability. The DCT testexhibits certain advantages as a cracking resistance predictor:
(a) according to the National Cooperative Highway Research Program, the DCT test often produces the lowest coefficientof variation (COV) of all HMA fracture tests with a COV in the 10–15% range [18];
(b) the DCT test provides a larger fracture area which is important because it reduces the impact that a single large aggre-gate or zone of weakness might have on the overall fracture resistance of the HMA [19];

264 C.M. Stewart et al. / Engineering Fracture Mechanics 169 (2017) 262–275
(c) a specimen can be prepared directly from a cylindrical sample obtained from standard cores prepared in a super pavegyratory compactor or can be taken from field cores.
The main disadvantage of the DCT test is that it is more laborious to machine DCT specimen in comparison to other stan-dard geometry.
Dense grade super-paves (SP-Ds) have aggregate size distributions that provide a high degree of compaction resulting inhigher fatigue and fracture strength [20]. Chen and Huang conducted indirect tension tests on a SP-D mixture and observedthat the average tensile strength is 1.08 MPa with variability of 0.1 MPa. Increasing the coarse aggregate angularity from zeroto one hundred percent reduced the tensile strength of SP-D [21]. Wu and colleagues conducted SCB tests on thirteen SP-Dmixtures at room temperature (25 �C). The SP-Ds. with lower tensile strength offer higher fracture resistance and vice versa(from 0.57 to 1.53 kJ m�2). Kim and colleagues conducted several DCT tests on dense grade HMA and recorded an average3 kN peak load, 0.344 kJ m�2 fracture energy, and young’s modulus of 14.2 GPa at �10 �C [11]. Braham et al. conducted aDCT-based study on the effect of the constituents on the fracture energy of twenty-eight HMAs at 2 �C below, 10 �C above,and 22 �C above the lower temperature grade. It was concluded that the binder, air void content, and dominant aggregatetype have a large influence on the fracture energy values calculated at high temperature, but not at mid or low temperature[12]. A review of literature finds that few studies that compare and contrast the accuracy and repeatability of SCB and DCTtest standards for HMAs have been performed.
In this study, the room temperature fracture resistance of a SP-D HMA is evaluated using two competing SCB test stan-dards and a DCT test standard. The AASHTO TP105 standard for SCB is performed using ten specimens with the standardnotch depth (24 ± 1.5 mm) to calculate the fracture energy, Gf, and fracture toughness, KIC [22]. The provisional AASHTOTPXXX standard for SCB is performed using five repetitions of three specimens with different notch depths (24, 30,36 ± 1.5 mm) to calculate the critical energy release rate, Jc [23]. The ASTM D7313 standard for DCT is performed using fourspecimens with a standard notch depth (62.5 ± 2.5 mm) to calculate the fracture energy, Gf [24]. The fracture resistanceparameters of SCB and DCT standards are compared. The digital image correlation (DIC) technique is employed to analyzethe strain field near the crack tip. Fracture area analysis using a 3D scanner is performed to compare the fracture area result-ing from SCB and DCT tests.
2. Materials and test methods
2.1. Material
A dense-grade superpave (SP-D) hot mix asphalt (HMA) is the subject material. The material was sourced in Abilene, TXand transported to the UTEP Center for Transportation Infrastructure Systems for specimen preparation. The properties ofthe SP-D are summarized in Table 1. The gradation of the SP-D mix is depicted in Fig. 1. The typical distribution of the aggre-gates, mastic, and binder in the SP-D mix is shown in Fig. 2.
2.2. Specimen preparation
The SCB and DCT specimens are trimmed from standard 150 mm diameter by 114 mm thick briquettes compacted with asuperpave gyratory compactor in accordance with AASHTO T312 (ASTM D6925) [13,14]. After the briquette reaches roomtemperature, a disk shape specimen is trimmed from the middle of the briquette and the disk is quality checked for anair-void percentage (AV%) target of 7 ± 1.0%. A typical disk specimen is shown in Fig. 2a. Two SCB specimens as depictedin Fig. 2b can be extracted from a disk. One DCT specimen as depicted in Fig. 2c can be extracted from a disk. A schematicand dimensions of the SCB and DCT specimens is provided in Fig. 3a and b respectively.
2.3. Mechanical test equipment
The SCB and DCT tests were conducted using an INSTRON 5969 Table-Top Universal Test System. This electromechanicalframe is capable of 0.001–600 mm/min displacement rates and equipped with a 50 kN load cell. The data captured from the
Table 1Summary of SP-D HMA properties.
Properties SP-D MixLocation Abilene, TXAsphalt source AlonAsphalt performance grade 70–22Binder substitution 64–22Binder percent, % 5.3Asphalt specific gravity 1.051%Reclaimed asphalt pavement 8%Reclaimed asphalt shingles 2

Sive size (Raised to 0.45 power)0 1 2 3 4
Perc
ent p
assi
ng (%
)
1
10
100
Fig. 1. Gradation of aggregates in SP-D HMA.
C.M. Stewart et al. / Engineering Fracture Mechanics 169 (2017) 262–275 265
INSTRON machine during tests included time, load, and load-line displacement. Specimens were exposed to the laboratoryroom temperature of 27 �C during testing.
2.4. Semi-Circular Bend (SCB) test
The AAHSTO TP105 and provisional AAHSTO TPXXX test standards for SCB specimen are based on the calculation of thefracture energy, Gf and critical strain energy release rate, Jc respectively [22,23]. It is important to note that both quantities Gf
and Jc are equal representations of the critical J-integral. The Gf represents the single specimen method proposed by Rice [25]while Jc represents the multiple specimen method proposed by Begley and Landes [26]. The different nomenclature is due toinconsistency in the test standards.
A schematic of the test setup for SCB testing is shown in Fig. 3a. For both SCB standards, the specimen is mounted into athree-point bending fixture and subjected to compressive displacement. The three-point bend fixture consists of a top load-ing anvil and two support anvils under the specimen with a diameter of 5 mm. No seating load is applied to the specimen;however, the anvil is placed into neutral contact with the specimen just before testing. Tests are performed with a constantdisplacement rate of 5 mm/min at a room temperature of 27 �C. The test is stopped once the specimen has completelyfractured.
2.4.1. AASHTO TP105The AASHTO TP105 SCB standard calculates the fracture energy, Gf using the single-specimen geometry-specific solution
for the Jc of a three-point bending specimen originally proposed by Rice and adopted by RILEM TC 50-FMC [22,25,27]. Thefracture energy, Gf is a fracture mechanics concept that represents the amount of energy required to create a unit surfacearea of a crack. The fracture energy is obtained using the work of fracture, Wf (total area under the load versus load-linedisplacement curve) depicted in Fig. 4a. The fracture energy, Gf is computed as follows
Fig. 2. SP-D HMA specimen (a) disk, (b) SCB, and (c) DCT.
bL
a
r Da
(a) (b)
d
CWB
B = 50 ± 5 mmC = 35 ± 2.5 mmD = 150 ± 10 mmW = 110 ± 2.5 mm
a = 27.5 ± 2.5 mmd = 25 ± 2.5 mm
= 25 ± 1 mm
a = 24, 30, or 36 ± 1.5 mmb = 50 mmr = 75 mmL = 127 mm
φ
φ
Fig. 3. Schematic and dimensions of (a) SCB and (b) DCT specimen.
Displacement, u
Forc
e, F
f tailW W W
Forc
e, F
Displacement, u
iU
(a) (b)
W
tailW
= +
Fig. 4. Strain energy measurement for SCB and DCT (a) Gf and SCB (b) Jc.
266 C.M. Stewart et al. / Engineering Fracture Mechanics 169 (2017) 262–275
Gf ¼ Wf
Alig; Alig ¼ ðr � aÞb; ð1Þ
where Gf is the fracture energy (kJ m�2), Wf is the work of fracture (J), Alig is the ligament area (mm2), r is the specimen’sradius (mm), a is the notch depth (mm), and b is the specimen thickness (mm). It should be noted that a unit conversionis needed to calculate Gf using the given units.
The AASHTO TP105 standard also provides a procedure for calculating the fracture toughness, KIC (MPa m0.5) [22]. Thefracture toughness, KIC is defined as the stress intensity factor corresponding to the initiation of the crack. Fracture tough-ness, KIC is computed as follows
KIC ¼ YIð0:8Þr0ffiffiffiffiffiffipa
p ð2Þ
where YIð0:8Þ is the dimensionless geometric factor, r0 is the applied stress, and a is the notch depth. The applied stress iscalculated as r0 ¼ Pmax=2rt where Pmax is the peak load, and r and t are the specimen radius and thickness respectively.The dimensionless geometric factor, YIð0:8Þ is calculated using the followingYIð0:8Þ ¼ 4:782þ 1:219ar
� �þ 0:063exp 7:045
ar
� �h ið3Þ
where a is the notch depth (mm) and r is the specimen’s radius (mm) [28,29].
2.4.2. AASHTO TPXXXThe provisional AASHTO TPXXX SCB standard calculates the critical strain energy release rate, Jc, using the non-geometry
specific solution to determine Jc [26,32]. This method requires multiple specimens to calculate Jc as proposed by Begley andLandes [26]. The critical strain energy release rate is obtained by determining the change in strain energy to failure, U withrespect to notch depth, a. The strain energy to failure, U is calculated as the strain energy up to the peak load as depicted inFig. 4b. The critical strain energy release rate, Jc is computed as follows
Jc ¼ � 1b
� �dUda
ð4Þ

C.M. Stewart et al. / Engineering Fracture Mechanics 169 (2017) 262–275 267
where b is the thickness (mm), a is the notch depth (mm), U is the strain energy to failure (J), and dU/da is the change ofstrain energy with notch depth (kN). It should be noted that a unit conversion is needed to calculate Jc using the given units.
2.5. Disk-Shaped Compact Tension (DCT) test
The ASTM D7313 DCT standard calculates the fracture energy, Gf using a single-specimen geometry-specific solution [24].A schematic and dimensions of a DCT specimen is shown in Fig. 3b. A seating load of 0.2 kN (45 lbf) is applied. Tests are per-formed with a constant crack mouth opening displacement of 0.017 mm/s at a room temperature of 27 �C. The test isstopped when the post-peak load drops by 22 lbf. The fracture energy, Gf for DCT is calculated similar to (Eq. (1)) for SCBas follows
Gf ¼ Wf
B � ðW � aÞ ð5Þ
where Wf is the work of fracture (J) depicted in Fig. 4a, B is the thickness (mm), and (W � a) is the initial ligament length(mm).
2.6. 3D digital image correlation
Three-dimensional digital image correlation (3D DIC) is performed using a Correlated Solutions VIC-3D DIC system. Usingthe VIC-3D software, the surface displacements (u, v, and w) can be captured. These displacements are then processed tocalculate the strain vector and principal strain. Before correlation, photos of a calibration square are taken to provide a phys-ical reference of pixel distances. Next, specimens are primed with a randomly applied speckle pattern and inserted into thetest frame. The speckles act as reference points. Tunable LED lights are focused on the specimen to increase the contrast ofcaptured photographs and subsequently increase the accuracy of digital image correlation.
2.7. 3D surface scanning
The fractured specimen are 3D scanned to produce a 3D CAD replication of the fracture surface using a Makerbot Digitizer3D Scanner. The scanner has a nominal dimensional accuracy of ±2 mm and detail resolution of 0.5 mm. This device uses twolasers and a rotating platform to generate a 3D dimensional replication of the surface of 3D objects. The Makerware software,exports a stereo lithography format file (.STL). The AutoDesk MeshMixer software is employed to analyze the physical fea-tures of the 3-D .STL files. The 3D scanner and software introduce error into the fracture area measurement; however, con-sidering the size of the available fracture area (in all cases >2500 mm2) and resolution of the 3D scanner (0.5 mm) it isdetermined that this error will not have a significant impact on the fracture area recorded.
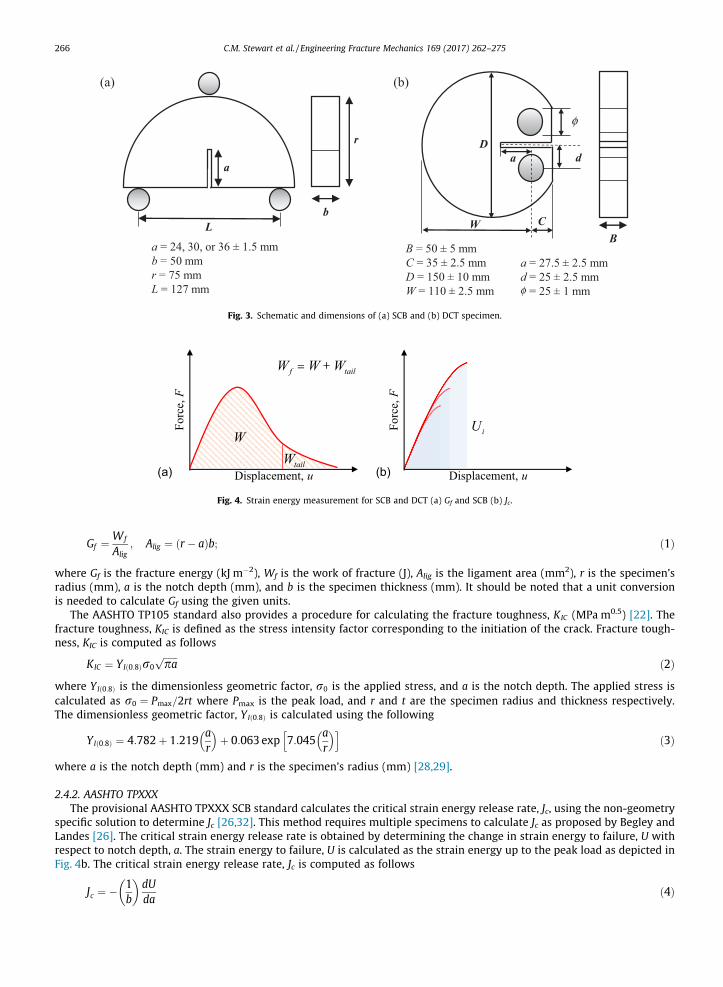
3. Results and discussion
3.1. SCB - AASHTO TP105
The AASHTO TP105 SCB test method was performed on ten 24 mm specimens to measure the fracture energy, Gf and frac-ture toughness, KIC. The average load versus load-line displacement curve of the ten SCB specimens is depicted in Fig. 5. Errorbars of one standard deviation were added to illustrate the repeatability of the tests. The error bars increase with strain afterthe peak load has been reached. This indicates decrease repeatability post the peak load.
The resulting fracture energy and toughness calculated using AASHTO TP105 are summarized in Table 2. The averagepeak load, work of fracture, fracture energy, and fracture toughness were calculated as 1400 N, 1.57 J, 0.595 kJ m�2, and0.287 MPa m0.5 respectively. Fracture toughness, KIC presented the lowest COV value at 12.7% while the COV of fractureenergy, Gf is relatively high at 26.9%. Applying one standard deviation, the fracture energy, Gf should vary between0.435–0.755 kJ m�2. These results are comparable to those established by Wu and colleagues for thirteen superpave mix-tures, with the room temperature SCB-calculated fracture energy, Gf ranging from 0.57 to 1.53 kJ m�2 [9].
3.2. SCB - AASHTO TPXXX
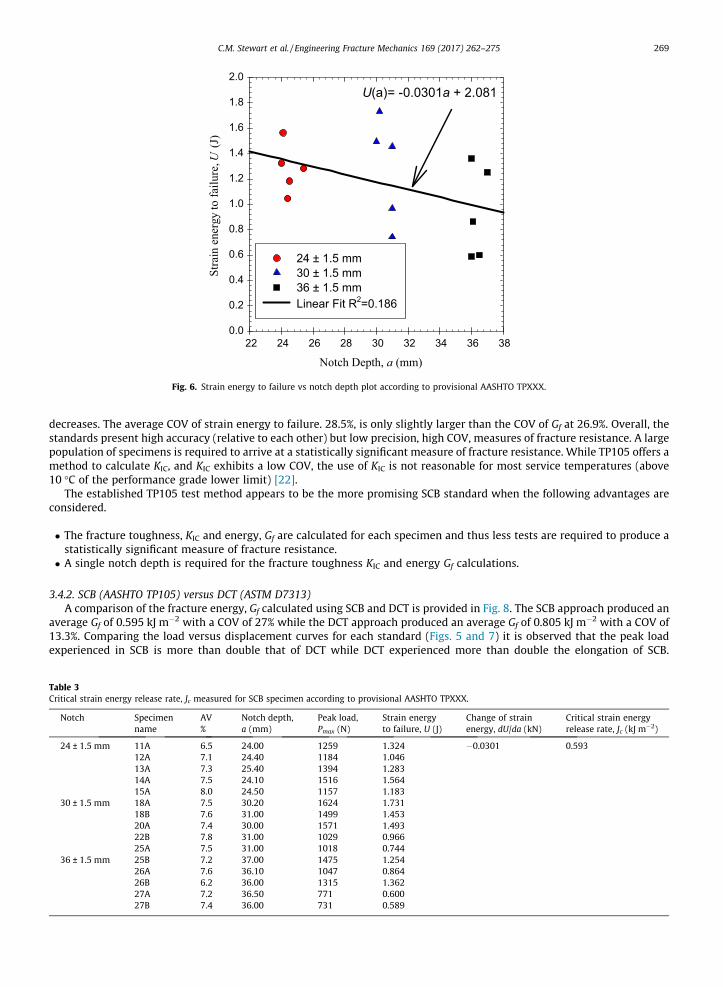
The provisional AASHTO TPXXX SCB test method was performed using three notch depths (24, 30, 36 ± 1.5 mm). The testfor each notch depth was repeated five times to assess repeatability. The strain energy to failure, U was calculated for allspecimen (see Fig. 4b) and plotted against the notch depth to compute the change of strain energy, dU/da. The resulting plotis depicted in Fig. 6. A linear function used to determine the change of strain energy, produced a low coefficient of determi-nation, R2 of 0.186. This low value indicates significant scatter in the experiments. The supporting parameters to determinethe critical strain energy release rate, Jc are summarized in Table 3. The Jc was calculated as 0.593 kJ m�2. This value com-pares well to the room temperature SCB-calculated Jc of a control superpave obtained by Mull and colleagues at 0.540 kJ m�2
[14].

Displacement, u (mm)0 1 2 3 4
Load
, P (N
)
0
200
400
600
800
1000
1200
1400
1600
1800
Average Load
Fig. 5. Average load-displacement curve for 24 ± 1.5 mm SCB specimens according to AASHTO TP105.
268 C.M. Stewart et al. / Engineering Fracture Mechanics 169 (2017) 262–275
3.3. DCT - ASTM D7313
The ASTM D7313 DCT test method was performed on four 62.5 mm notched specimens to measure the fracture energy,Gf. The average load versus load-line displacement curve of the four SCB specimens is depicted in Fig. 7. Error bars of onestandard deviation were added to illustrate the repeatability of the tests. The error bars decrease after the peak load has beenreached suggesting good repeatability.
The resulting fracture energy, Gf calculated using ASTM D7313 are summarized in Table 4. The average peak load, work offracture, and fracture energy are 632 N, 3.37 J, and 0.805 kJ m�2 respectively. The fracture energy, Gf has a low COV of 13.3%.Applying one standard deviation, the fracture energy, Gf should vary between 0.698 and 0.912 kJ m�2.
3.4. Comparison of fracture resistance parameters
3.4.1. SCB (AASHTO TP105) versus SCB (AASHTO TPXXX)A comparison of the fracture resistance parameters of the two SCB standards is provided in Fig. 8. The average fracture
energy, Gf using AAHSTO TP105 and the critical strain energy release rate Jc using AAHSTO TPXXX are almost identical at0.595 and 0.593 kJ m�2 respectively; an absolute difference of only 0.34%. The TP105 calculated fracture toughness, KIC yieldsthe lowest COV at 13% while Gf is much higher at 26.9%. A COV cannot be assigned to the TPXXX calculated Jc due to the waythat Jc is measured; however, the COV of the strain energy to failure, U for the 24, 30, and 36 mm notched specimens are14.9%, 31.9%, and 38.6% respectively. This expanding COV indicates decreasing repeatability as the available fracture area
Table 2Fracture energy Gf measured for SCB specimen according to AASHTO TP105.
Specimenname
AV% Notch depth,a (mm)
Peak load,Pmax (N)
Work of fracture,Wf (J)
Fracture energy,Gf (kJ m�2)
Fracture toughness,KIC (MPa m0.5)
11A 6.5 24 1259 1.32 0.499 0.25711B 7.0 24 1572 1.90 0.717 0.32012A 7.1 24.4 1184 1.05 0.398 0.24412B 7.2 22.9 1308 1.36 0.502 0.25713A 7.3 25.4 1394 1.28 0.497 0.29713B 7.3 24.1 1488 1.62 0.614 0.30414A 7.5 24.1 1516 1.56 0.591 0.31014B 7.5 24.1 1716 2.38 0.898 0.35115A 8.0 24.5 1157 1.18 0.451 0.24015B 7.8 24 1408 2.09 0.786 0.287
Average 7.3 24 1400 1.57 0.595 0.287St. dev. 0.4 1 178 0.43 0.160 0.037COV % 5.8% 2.5% 12.7% 26.9% 26.9% 12.7%
Notch Depth, a (mm)22 24 26 28 30 32 34 36 38
Stra
in e
nerg
y to
failu
re, U
(J)
0.0
0.2
0.4
0.6
0.8
1.0
1.2
1.4
1.6
1.8
2.0
24 ± 1.5 mm30 ± 1.5 mm36 ± 1.5 mmLinear Fit R2=0.186
U(a)= -0.0301a + 2.081
Fig. 6. Strain energy to failure vs notch depth plot according to provisional AASHTO TPXXX.
C.M. Stewart et al. / Engineering Fracture Mechanics 169 (2017) 262–275 269
decreases. The average COV of strain energy to failure. 28.5%, is only slightly larger than the COV of Gf at 26.9%. Overall, thestandards present high accuracy (relative to each other) but low precision, high COV, measures of fracture resistance. A largepopulation of specimens is required to arrive at a statistically significant measure of fracture resistance. While TP105 offers amethod to calculate KIC, and KIC exhibits a low COV, the use of KIC is not reasonable for most service temperatures (above10 �C of the performance grade lower limit) [22].
The established TP105 test method appears to be the more promising SCB standard when the following advantages areconsidered.
� The fracture toughness, KIC and energy, Gf are calculated for each specimen and thus less tests are required to produce astatistically significant measure of fracture resistance.
� A single notch depth is required for the fracture toughness KIC and energy Gf calculations.
3.4.2. SCB (AASHTO TP105) versus DCT (ASTM D7313)A comparison of the fracture energy, Gf calculated using SCB and DCT is provided in Fig. 8. The SCB approach produced an
average Gf of 0.595 kJ m�2 with a COV of 27% while the DCT approach produced an average Gf of 0.805 kJ m�2 with a COV of13.3%. Comparing the load versus displacement curves for each standard (Figs. 5 and 7) it is observed that the peak loadexperienced in SCB is more than double that of DCT while DCT experienced more than double the elongation of SCB.
Table 3Critical strain energy release rate, Jc measured for SCB specimen according to provisional AASHTO TPXXX.
Notch Specimenname
AV%
Notch depth,a (mm)
Peak load,Pmax (N)
Strain energyto failure, U (J)
Change of strainenergy, dU/da (kN)
Critical strain energyrelease rate, Jc (kJ m�2)
24 ± 1.5 mm 11A 6.5 24.00 1259 1.324 �0.0301 0.59312A 7.1 24.40 1184 1.04613A 7.3 25.40 1394 1.28314A 7.5 24.10 1516 1.56415A 8.0 24.50 1157 1.183
30 ± 1.5 mm 18A 7.5 30.20 1624 1.73118B 7.6 31.00 1499 1.45320A 7.4 30.00 1571 1.49322B 7.8 31.00 1029 0.96625A 7.5 31.00 1018 0.744
36 ± 1.5 mm 25B 7.2 37.00 1475 1.25426A 7.6 36.10 1047 0.86426B 6.2 36.00 1315 1.36227A 7.2 36.50 771 0.60027B 7.4 36.00 731 0.589

Displacement, u (mm)0 2 4 6 8 10
Load
, P (N
)
0
100
200
300
400
500
600
700
Average Load
Fig. 7. Average load-displacement curve for the DCT specimens according to ASTM D7313.
270 C.M. Stewart et al. / Engineering Fracture Mechanics 169 (2017) 262–275
Examining the tabular value for the work of fracture,Wf (Tables 2 and 4), it is observed that the Wf of DCT is 114% larger andcarries half the COV of SCB. Possible sources for the large COV of SCB are:
� stress concentrations and plasticity developing at the anvil contact points;� miss alignment of the specimen, resulting in an otherwise asymmetrical loading setup;� aggregates (of varying shape and size) along the fracture area acting as obstacles or accelerants to fracture, increasing ordecreasing the fracture resistance;
It is hypothesized that the former and later are the primary cause of variation and these variations decrease as the avail-able fracture area increases. Hot mix asphalts are an inherently heterogonous and uncertain material. A rule of thumb fortransportation materials is that the coefficient of variation of mechanical properties must be below 15%; however, someresearchers have stated up to 25% is acceptable [30]. The ASTM D7313 DCT tests standard defines the COV limit for fractureenergy at 15.7%. The two AASHTO standards do not provide any information concerning COV limits. In literature, COVs muchlarger than 15.7% are routinely reported [30,31]. Composition (particle size, particle properties, air void content, etc.), mois-ture, and test temperature can have a significant impact on the repeatability of measurements. For the given test conditions,the ASTM D7313 DCT test method is the most reliable approach to measure fracture resistance. The DCT approach exhibits alow COV such that a smaller test matrix can be used to obtain statistically significant fracture resistance measures.
3.5. Digital image correlation
Three-dimensional DIC was performed on a 24 mm SCB and 62.5 mm DCT specimen respectively. Contours of the openingstrain are provided in Fig. 9. The opening strain contours where collected near 80% of the peak load before crack initiationwas observed. In both specimen, strain concentrations are observed. Strain concentrations correlate to the presence of stressconcentrations. These concentrations indicate the possible crack initiation sites as well as identify the state of tension orcompression in the specimen.
Table 4Fracture energy, Gf measured for DCT specimens according to ASTM D7313.
Specimen name AV% Peak load, Pmax (N) Work of fracture, Wf (J) Fracture energy, Gf (kJ m�2)
4D 6.2 691.06 2.923 0.6985D 6.5 653.46 3.984 0.9517D 6.7 643.30 3.359 0.80210D 6.1 541.08 3.213 0.767
Average 6.38 632.22 3.370 0.805STD 0.28 64.14 0.448 0.107COV % 4.3% 10.1% 13.3% 13.3%

Frac
ture
Res
ista
nce,
Gf o
r Jc (
kJ-m
2 )
0.0
0.2
0.4
0.6
0.8
1.0
COV N/ACOV 26.9%COV 13.3%
SCB, Jc
(AASHTO TPXXX)
SCB, Gf
(AASHTO TP105)
DCT, Gf
(ASTM D7313)
Frac
ture
Tou
ghne
ss, K
IC (M
Pa-
m0.
5 )
0.00
0.05
0.10
0.15
0.20
0.25
0.30
0.35
COV 12.7%
SCB, KIC
(AASHTO TP105)
Fig. 8. Comparison of fracture resistance properties of SCB and DCT test standards.
εyy (10-2)1.31
0.520
0.352
-0.280
εxx (10-2)0.24
0.134
0.027
-0.186(a) (b)
Fig. 9. Opening strain of the (a) 24 mm SCB exx and (b) 62.5 mm DCT eyyspecimens.
C.M. Stewart et al. / Engineering Fracture Mechanics 169 (2017) 262–275 271
For the SCB specimen, strain concentrations are observed at both the notch tip as well as the loading anvil with the mag-nitude at the notch tip being only 29% larger than that at the loading anvil. This suggests that plasticity could develop at theanvil contact point during cracking. As the crack propagates, the compressive field at the anvil will interact with the tensilefield at the crack tip and negatively impact the work of fracture,Wf in the cracking zone. Due to the size of the SCB specimen,the intensity of the strain concentration is highly dependent on the aggregates near the notch tip and anvil contact point. Thestrain concentration variation contributes to the high coefficient of variation observed in the calculated fracture energy, Gf.
For the DCT specimen, strain concentrations are observed at the notch tip as well as the back edge of the specimen withthe magnitude at the notch tip being 350% larger than that on the back edge of the specimen. The concentration at the notchtip will dominate the cracking response of the specimen. The concentration at the back edge of the specimen is not expectedto negatively impact fracture energy calculations.
Overall, it is determined that the SCB specimens are susceptible to a large strain concentration at the anvil contact point.
3.6. Three-dimensional fracture area analysis
Three-dimensional scans of a 24 mm SCB and 62.5 mm DCT specimen were performed. Measurements of both the maleand female fracture areas for each specimen were recorded. Only the 24 mm SCB specimen was scanned because it repre-sents the best-case scenario with the largest fracture area of the three available SCB specimen notch depths.
A graphical depiction of the ideal versus actual fracture surface of male SCB and DCT specimen are provided in Fig. 10. Theideal fracture area is considered the area available for fracture if a planar crack is formed along the ligament. The ideal frac-

(a) (b) (c) (d)
Origin
Origin
Fast Fracture
Propaga�onPropaga�on
Note: images are not to scale
Fast Fracture is Absent!
Fig. 10. Ideal versus actual fracture surface of male (a and b) 24.5 mm SCB and (c and d) 62.5 mm DCT specimen.
272 C.M. Stewart et al. / Engineering Fracture Mechanics 169 (2017) 262–275
ture area is equal to the distance from the crack tip to the edge of the specimen multiplied by specimen thickness. For the24 mm SCB and 62.5 mm DCT specimen, the ideal fracture area is equal to 2590.8 and 4191 mm2 respectively such that theideal fracture area of the DCT specimen is 61.8% larger than the SCB specimen.
The actual fracture area of the SCB and DCT specimen are depicted as 3D scans in Fig. 10b and d. In both specimen, crackinitiation occurs at the notch tip and propagates towards the far edge of the specimen. During propagation, the crack growsthrough the binder around the heterogeneously disturbed aggregates leading to a rough fracture surface. A fast fractureregion is absent in the SCB specimen while for the DCT specimen it is almost equivalent in ligament length to the propaga-tion region. The presence of the fast fracture region is important in fracture testing. The fast fracture region indicates that thefracture energy, Gf or critical strain energy release rate, Jc has truly been exceeded in the specimen and the remaining areaavailable for fracture offers little resistance to rupture. A lack of the fast fracture region means that plasticity (or generalyielding) is the main driving forces behind crack propagation and the specimen continues to offer resistance to fractureup to cleavage.
Slight non-planar cracking is observed in the fast fracture region of the DCT specimen shown in Fig. 10d. Non-planarcracking is often reported in bituminous mixtures. While the ASTM D7313 for DCT does not mention the limits for non-planar cracking, the European Standard EN 12697-44 for SCB states that a test is valid as long as the crack ends in a zone10% of the diameter from the center of the load line [33]. This forms a 13� right triangle along the ligament length. Forthe DCT geometry, this would allow a 19 mm crack offset before the test is declared invalid. The definition of the valid zoneis necessary to mitigate high COVs. The number of invalid tests increases with nominal aggregate size. A cause of these vari-ations are instances where the notch is cut into large hard aggregate particles. The notch embedded in a particle will alter theoverall fracture resistance of the specimen. The DCT specimen depicted in Fig. 10d is valid.
Measurements of the actual fracture area for male and female pieces are provided in Fig. 11. Overall, the actual fracturearea is much larger than the idea as indicated by the absolute differences in Fig. 11. The actual fracture area of male and
Frac
ture
Are
a, A
F (m
m2 )
0
2000
4000
6000
8000
IDEAL ACTUAL
SCB-Female SCB-Male DCT-Female DCT-Male
44.7% 55.7%
34.9%53%
%2
actual ideal
actual ideal
A AA A
=−
+( )
Fig. 11. Fracture area of SCB and DCT specimen.
Note: not to scale.(a) (b)
Average Aggregate SizeFracture Area
SCB is largeDCT is small
r
rr
=
Fig. 12. Schematic of (a) SCB and (b) DCT specimen with representative aggregates.
C.M. Stewart et al. / Engineering Fracture Mechanics 169 (2017) 262–275 273
female pieces for both the SCB and DCT specimen are not equal. The difference in fracture area of male and female piecescould be due to different magnitudes of elastic recovery, plastic deformation, and aggregate spallation.
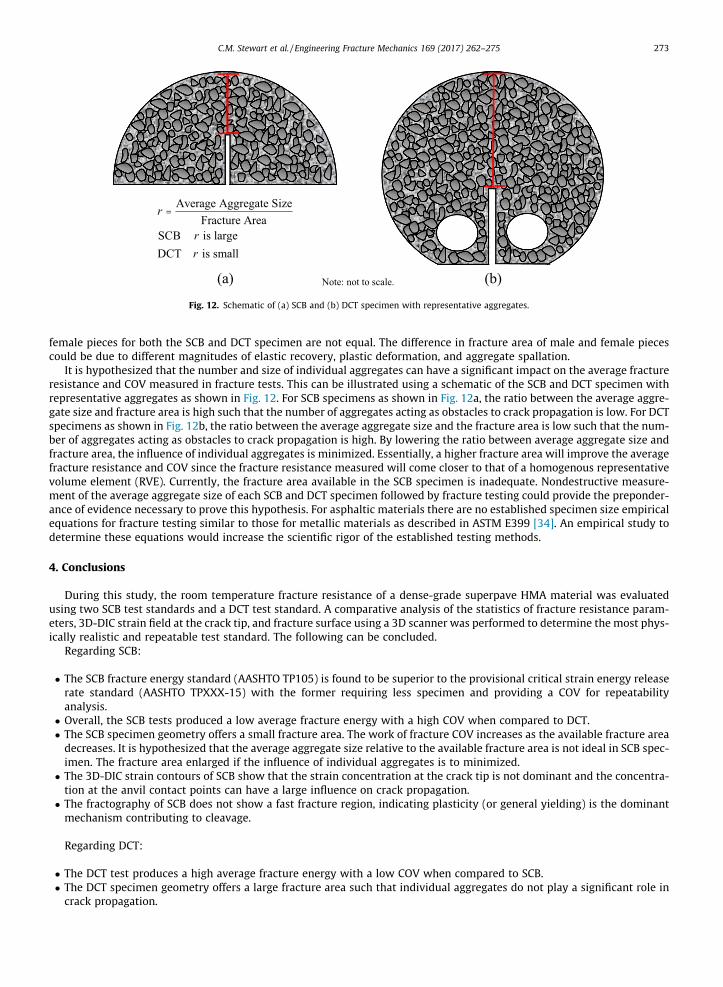
It is hypothesized that the number and size of individual aggregates can have a significant impact on the average fractureresistance and COV measured in fracture tests. This can be illustrated using a schematic of the SCB and DCT specimen withrepresentative aggregates as shown in Fig. 12. For SCB specimens as shown in Fig. 12a, the ratio between the average aggre-gate size and fracture area is high such that the number of aggregates acting as obstacles to crack propagation is low. For DCTspecimens as shown in Fig. 12b, the ratio between the average aggregate size and the fracture area is low such that the num-ber of aggregates acting as obstacles to crack propagation is high. By lowering the ratio between average aggregate size andfracture area, the influence of individual aggregates is minimized. Essentially, a higher fracture area will improve the averagefracture resistance and COV since the fracture resistance measured will come closer to that of a homogenous representativevolume element (RVE). Currently, the fracture area available in the SCB specimen is inadequate. Nondestructive measure-ment of the average aggregate size of each SCB and DCT specimen followed by fracture testing could provide the preponder-ance of evidence necessary to prove this hypothesis. For asphaltic materials there are no established specimen size empiricalequations for fracture testing similar to those for metallic materials as described in ASTM E399 [34]. An empirical study todetermine these equations would increase the scientific rigor of the established testing methods.
4. Conclusions
During this study, the room temperature fracture resistance of a dense-grade superpave HMA material was evaluatedusing two SCB test standards and a DCT test standard. A comparative analysis of the statistics of fracture resistance param-eters, 3D-DIC strain field at the crack tip, and fracture surface using a 3D scanner was performed to determine the most phys-ically realistic and repeatable test standard. The following can be concluded.
Regarding SCB:
� The SCB fracture energy standard (AASHTO TP105) is found to be superior to the provisional critical strain energy releaserate standard (AASHTO TPXXX-15) with the former requiring less specimen and providing a COV for repeatabilityanalysis.
� Overall, the SCB tests produced a low average fracture energy with a high COV when compared to DCT.� The SCB specimen geometry offers a small fracture area. The work of fracture COV increases as the available fracture areadecreases. It is hypothesized that the average aggregate size relative to the available fracture area is not ideal in SCB spec-imen. The fracture area enlarged if the influence of individual aggregates is to minimized.
� The 3D-DIC strain contours of SCB show that the strain concentration at the crack tip is not dominant and the concentra-tion at the anvil contact points can have a large influence on crack propagation.
� The fractography of SCB does not show a fast fracture region, indicating plasticity (or general yielding) is the dominantmechanism contributing to cleavage.
Regarding DCT:
� The DCT test produces a high average fracture energy with a low COV when compared to SCB.� The DCT specimen geometry offers a large fracture area such that individual aggregates do not play a significant role incrack propagation.

274 C.M. Stewart et al. / Engineering Fracture Mechanics 169 (2017) 262–275
� The 3D-DIC strain contours of DCT show that the strain concentration at the crack tip is dominant and concentrations atthe load points and/or on the back edge do not interfere with crack propagation.
� The fractography of DCT shows a fast fracture region, indicating that the fracture energy or critical strain energy releaserate has been reached.
It is concluded that the DCT standard is superior to both SCB standards. Further work is needed fully validate this claim. Alarger test matrix including more repeat tests would improve the statistical significance of the fracture resistance measure-ments. Additional HMA mixtures should be evaluate to determine the extent that average aggregate size influences variabil-ity. An analysis of the strain and displacement fields during crack initiation, propagation, and fracture should be performedusing 3D-DIC to obtain a clearer picture concerning the onset of fast fracture and the influence of strain concentrations awayfrom the crack tip. In addition, 3D-DIC can be applied to measure a full traction-opening displacement relationship for theligament and measure the crack advancement towards a length scale parameter to characterize the fracture phenomenon,see e.g. [35]. In-situ volumetric scans using X-ray microtomography could also be conducted to characterize the evolution ofthe 3D crack during fracture, see e.g. [36].
Acknowledgments
We would like to thank Steven D. Ambriz, Carlos A. Catzin, Jose L. Coronel, Mohammad Shafinul Haque, and Victor M.Ornelas for their contributions to project. We also would like to thank the Center for Transportation Infrastructure Systems(CTIS), especially their Executive Director Dr. Imad Abdallah and Director Dr. Soheil Nazarian, as well as the Challenger-Columbia Materials Research Facility for the use of equipment and materials. This research was support with funds fromthe Southern Plains Transportation Center.
References
[1] Germann F, Lytton R. Methodology for predicting the reflection cracking life of asphalt concrete overlays. Interim report, September 1974–March 1979;1979.
[2] Mechanistic–empirical pavement design guide: a manual of practice, interim ed. Washington, DC: AASHTO; 2008.[3] Zhou F, Hu S, Scullion T, Mikhail M, Walubita LF. A balanced hma mix design procedure for overlays (with discussion). J Assoc Asph Paving Technol
2007;76:823–50.[4] Zhou F, Scullion T. Upgraded overlay tester and its application to characterize reflection cracking resistance of asphalt mixtures. College Station, TX;
2003.[5] Zhou F, Scullion T. Overlay tester: a rapid performance related crack resistance test. College Station, TX: 2005.[6] Wagoner M, Buttlar W, Paulino G, Blankenship P. Investigation of the fracture resistance of hot-mix asphalt concrete using a disk-shaped compact
tension test. Transp Res Rec 2005;1929:183–92. http://dx.doi.org/10.3141/1929-22.[7] Kim M, Mohammad L, Elseifi M. Characterization of fracture properties of asphalt mixtures as measured by semicircular bend test and indirect tension
test. J Transp Res Board 2012;2296:115–24. http://dx.doi.org/10.3141/2296-12.[8] Huang L, Cao K, Zeng M. Evaluation of semicircular bending test for determining tensile strength and stiffness modulus of asphalt mixtures. J Test Eval
2009;37:122–8.[9] Molenaar AAA, Scarpas A, Liu X, Erkens MJGS. Semi-circular bending test; simple but useful? J Assoc Asph Paving Technol 2002;71:794–815.[10] Bashin A, Masad E, Kutay ME, Buttlar W, Kim Y-R, Marasteanu M, et al. Applications of advanced models to understand behavior and performance of
asphalt mixtures. Transp Res Board 2012;14.[11] Kim H, Wagoner MP, Buttlar WG. Simulation of fracture behavior in asphalt concrete using a heterogeneous cohesive zone discrete element model. J
Mater Civ Eng 2008;20:552–63. http://dx.doi.org/10.1061/(ASCE)0899-1561(2008) 20:8(552).[12] Braham A, Buttlar W, Marasteanu M. Effect of binder type, aggregate, and mixture composition on fracture energy of hot-mix asphalt in cold climates. J
Transp Res Board 2007;2001:102–9. http://dx.doi.org/10.3141/2001-12.[13] AASHTO. T312-15 preparing and determining density of hot mix asphalt (hma) specimens by means of the superpave gyratory compactor; 2015. p. 1–
6.[14] Mull MA, Stuart K. Fracture resistance characterization of chemically modified crumb rubber asphalt pavement. J Mater Sci 2002;37:557–66.[15] Saha G, Biligiri KP. Fracture damage evaluation of asphalt mixtures using Semi-Circular Bending test based on fracture energy approach. Eng Fract
Mech 2015;142:154–69. http://dx.doi.org/10.1016/j.engfracmech.2015.06.009.[16] Romeo E, Birgisson B, Montepara A, Tebaldi G. The effect of polymer modification on hot mix asphalt fracture at tensile loading conditions. Int J
Pavement Eng 2010;11:403–13. http://dx.doi.org/10.1080/10298436.2010.488735.[17] Wu Z, Mohammad L, Wang L, Mull M. Fracture resistance characterization of superpave mixtures using the semi-circular bending test. J ASTM Int
2005;2:1–15. http://dx.doi.org/10.1520/JAI12264.[18] Zhou F, Newcomb D, Gurganus C, Banihashemrad S, Park ES, Sakhaeifar M, et al. Experimental design for field validation of laboratory tests to assess
cracking resistance of asphalt mixtures. National Cooperative Highway Research Program Transportation Research Board of the National Academies.No 9-57; 2016. p. 1–104.
[19] Wagoner M, Buttlar W, Paulino G, Blankenship P. Investigation of the fracture resistance of hot-mix asphalt concrete using a disk-shaped compacttension test; 2006. <http://dx.doi.org/103141/1929-22>.
[20] Roberts FL, Kandhal PS, Brown ER, Lee D-Y, Kennedy TW. Hot mix asphalt materials, mixture design and construction. Lanham, MD; 1991.[21] Chen X, Huang B. Evaluation of moisture damage in hot mix asphalt using simple performance and superpave indirect tensile tests. Constr Build Mater
2008;22:1950–62. http://dx.doi.org/10.1016/j.conbuildmat.2007.07.014.[22] AASHTO. TP105-13 standard method of test for determining the fracture energy of asphalt mixtures using the semi circular bend geometry (SCB);
2013. p. 1–14.[23] AASHTO. TPXXX-15 provisional standard method of test for determining the fracture energy of asphalt mixtures using the semicircular bend geometry
(SCB) at intermediate temperature; 2015. p. 1–7.[24] ASTM. D7313-13 standard test method for determining fracture energy of asphalt-aggregate mixtures using the disk-shaped compact tension
geometry; 2013. p. 1–9. http://dx.doi.org/10.1520/D7313.[25] Rice J, Paris P, Merkle J. Some further results of J-integral analysis and estimates. STP536 Prog. Flaw growth fract. Toughness test. West Conshohocken
(PA): ASTM International; 1973. http://dx.doi.org/10.1520/STP49643S. p. 231–45.

C.M. Stewart et al. / Engineering Fracture Mechanics 169 (2017) 262–275 275
[26] Begley J, Landes J. The J integral as a fracture criterion. STP514 Fract. Toughness Part II. West Conshohocken (PA): ASTM International; 1972. http://dx.doi.org/10.1520/STP38816S. p. 1–20.
[27] Rilem TCS. Determination of the fracture energy of mortar and concrete by means of three-point bend tests on notched beams. Mater Struct1985;18:285–90. http://dx.doi.org/10.1007/BF02472918.
[28] Li X, Marasteanu M. Evaluation of the low temperature fracture resistance of asphalt mixtures using the semi circular bend test (with discussion).Assoc Asph Paving Technol 2004;73:401–26.
[29] Li X, Marasteanu M. Investigation of low temperature cracking in asphalt mixtures by acoustic emission. Road Mater Pavement Des 2006;7:491–512.[30] Li X, Marasteanu M. Using semi circular bending test to evaluate low temperature fracture resistance for asphalt concrete. Exp Mech 2010;50:867–76.[31] Wagoner MP, Buttlar WG, Paulino GH. Disk-shaped compact tension test for asphalt concrete fracture. Exp Mech 2005;45:270–7.[32] Landes D, Begley J. The effect of specimen geometry on Jic. STP514 Fract. Toughness Part II. West Conshohocken (PA): ASTM International; 1972. http://
dx.doi.org/10.1520/STP38817S. p. 24–9.[33] European Committee for Standardization. Bituminous mixtures - test methods for hot mix asphalt – Part 44: Crack propagation by semi-circular
bending test. EN 12697-44; 2010.[34] ASTM. E399-12E3 standard test method for linear-elastic plane-strain fracture toughness Kic of metallic materials; 2013. p. 1–33. http://dx.doi.org/10.
1520/E0399-09E02.2.[35] Valoroso N, Sessa S, Lepore M, Cricrì G. Identification of mode-I cohesive parameters for bonded interfaces based on DCB test. Eng Fract Mech
2013;104:56–79. http://dx.doi.org/10.1016/j.engfracmech.2013.02.008.[36] Skarzynski, Nitka M, Tejchman J. Modelling of concrete fracture at aggregate level using FEM and DEM based on X-ray lCT images of internal structure.
Eng Fract Mech 2015;147:13–35. http://dx.doi.org/10.1016/j.engfracmech.2015.08.010.