Embed Size (px)
Citation preview

Engineering Experimentation
Module Designs Project Number: ME-JMS-1702
A Major Qualifying Project Report
Submitted to the Faculty
of the
WORCESTER POLYTECHNIC INSTITUTE
in partial fulfillment of the requirements for the
Degree of Bachelor of Science
in Mechanical Engineering
by
_______________________
Peter Ofsthun
_______________________
Elizabeth Thompson
Date: March 22, 2017
Approved:
_______________________
Professor John Sullivan, Major Advisor
1. Engineering Measurements
2. Sensors and Test Equipment
3. Modular Experiments

1
Abstract This paper proposes a self-contained modularized alternative to the engineering
experimentation course (ME3901) at WPI and offers example modules utilizing various sensor
types with an inexpensive microcontroller. A framework was developed for modules that have a
unified structure that can be individually adapted and changed to create a course that highlights
desired sensors, how they function, how to configure them with the microcontroller and a
working code. This proposal is a test basis for a new course.

2
Table of Contents Abstract ........................................................................................................................................... 1
Table of Contents ............................................................................................................................ 2
Table of Figures .............................................................................................................................. 4
Introduction ..................................................................................................................................... 6
Module 1: Exploring the Arduino ................................................................................................... 9
Objectives: ................................................................................................................................... 9
Background: ................................................................................................................................ 9
Materials: ................................................................................................................................... 13
Procedure:.................................................................................................................................. 13
1.1 Build a circuit and write code that blinks an LED on for 1 second and off for one
second repeatedly .................................................................................................................. 13
1.2 Build a circuit with a button and a potentiometer ..................................................... 17
1.3 Control an RGB LED with a serial port.................................................................... 20
1.4 Multiple LED control ................................................................................................ 24
Module 2: Distance and Proximity Sensing.................................................................................. 26
Objectives: ................................................................................................................................. 26
Background: .............................................................................................................................. 26
Materials: ................................................................................................................................... 29
Procedure:.................................................................................................................................. 29
2.1 Calibrate and use an ultrasonic range finder ................................................................... 29
2.2 Calibrate and use an IR sensor ........................................................................................ 32
2.3 Compare the two sensors ................................................................................................. 33
Module 3: Motor Control .............................................................................................................. 36
Objectives: ................................................................................................................................. 36
Background: .............................................................................................................................. 36
Materials: ................................................................................................................................... 39
Procedure:.................................................................................................................................. 39
3.1 Use an H-bridge to control a DC motor .......................................................................... 39
3.2 Control a servo and check accuracy ................................................................................ 42
3.3 Use an H-bridge to control a stepper motor .................................................................... 44
3.4 Create a sun tracker ......................................................................................................... 46
Module 4: Temperature Measurements ........................................................................................ 48
Objectives: ................................................................................................................................. 48
Background: .............................................................................................................................. 48

3
Materials: ................................................................................................................................... 53
Procedure:.................................................................................................................................. 53
4.1 Calibrate a thermistor ...................................................................................................... 53
4.2 Measure temperature with an IR thermometer ................................................................ 57
4.3 Compare thermistor, IR thermometer, and thermocouple ............................................... 61
4.4 Calculate heat flux ........................................................................................................... 64
Module 5 ....................................................................................................................................... 65
Objectives: ................................................................................................................................. 65
Background: .............................................................................................................................. 65
Materials: ................................................................................................................................... 66
Procedure:.................................................................................................................................. 66
Part 1: ..................................................................................................................................... 67
Part 2: ..................................................................................................................................... 67
Part 3: ..................................................................................................................................... 67
Bonus part: ............................................................................................................................. 68
Report: ................................................................................................................................... 68
Conclusion .................................................................................................................................... 69
Works Cited .................................................................................................................................. 70
Appendices .................................................................................................................................... 72
Appendix A: Bill of Materials ................................................................................................... 72
Appendix B: Arduino Code Reference ..................................................................................... 73
Appendix C: Material Reference............................................................................................... 77
RedBoard ............................................................................................................................... 77

4
Table of Figures Figure 1: Examples of Duty Cycles ............................................................................................................ 11 Figure 2: Breadboard .................................................................................................................................. 12 Figure 3: LED Diagram and Polarity .......................................................................................................... 14 Figure 4: 1.1 Wiring Diagram ..................................................................................................................... 15 Figure 5: 1.1 Built Circuit ........................................................................................................................... 15 Figure 6: Code for 1.1 ................................................................................................................................. 17 Figure 7: 1.2 Wiring Diagram ..................................................................................................................... 18 Figure 8: 1.2 Built Circuit ........................................................................................................................... 18 Figure 9: Code for 1.2 ................................................................................................................................. 20 Figure 10: 1.3 Wiring Diagram ................................................................................................................... 21 Figure 11: 1.3 Built Circuit ......................................................................................................................... 21 Figure 12: Arduino Serial Monitor ............................................................................................................. 23 Figure 13: Code for 1.3 ............................................................................................................................... 24 Figure 14: Sequential LED Control ............................................................................................................ 25 Figure 15: Ultrasonic Sensor Diagram ........................................................................................................ 27 Figure 16: Infrared Proximity Sensor ......................................................................................................... 28 Figure 17: 2.1 Wiring Diagram ................................................................................................................... 30 Figure 18: 2.1 Built Circuit ......................................................................................................................... 30 Figure 19: Code for 2.1 ............................................................................................................................... 31 Figure 20: Table and Graph of Data Used for Calibration .......................................................................... 31 Figure 21: 2.2 Wiring Diagram ................................................................................................................... 32 Figure 22: 2.2 Built Circuit ......................................................................................................................... 32 Figure 23: H-Bridge Diagram ..................................................................................................................... 37 Figure 24: H-Bridge Logic Diagram ........................................................................................................... 38 Figure 25: 3.1 Wiring Diagram ................................................................................................................... 40 Figure 26: 3.1 Built Circuit ......................................................................................................................... 41 Figure 27: Code for 3.1 ............................................................................................................................... 42 Figure 28: 3.2 Wiring Diagram ................................................................................................................... 43 Figure 29: 3.2 Built Circuit ......................................................................................................................... 43 Figure 30: Code for 3.2 ............................................................................................................................... 44 Figure 31: 3.3 Wiring Diagram ................................................................................................................... 45 Figure 32: 3.3 Built Circuit ......................................................................................................................... 45 Figure 33: Code for 3.3 ............................................................................................................................... 46 Figure 34: The Built Sun Tracker ............................................................................................................... 47 Figure 35: Temperature Conversion Chart ................................................................................................. 49 Figure 36: Relation between Thermistor's Change in Resistance and Temperature ................................... 50 Figure 37: Change in Resistance over 120 °C ............................................................................................ 51 Figure 38: Change in Resistance over 40 °C .............................................................................................. 51 Figure 39: 4.1 Wiring Diagram ................................................................................................................... 54 Figure 40: 4.1 Built Circuit ......................................................................................................................... 54 Figure 41: Code for 4.1 ............................................................................................................................... 56 Figure 42: Thermistor ................................................................................................................................. 57 Figure 43: Thermistor Wrapped in Tubing ................................................................................................. 57 Figure 44: Infrared Thermometer Pins........................................................................................................ 58 Figure 45: 4.2 Wiring Diagram ................................................................................................................... 59 Figure 46: 4.2 Built Circuit ......................................................................................................................... 59 Figure 47: Code for 4.2 ............................................................................................................................... 60 Figure 48: 4.3 Wiring Diagram ................................................................................................................... 61 Figure 49: 4.3 Built Circuit ......................................................................................................................... 62

5
Figure 50: Code for 4.3 ............................................................................................................................... 63

6
Introduction Instrumentation is a critical tool in an engineer's toolbox. It aids an engineer in bridging
the gap between theory and practice by allowing the collection of measurements of the physical
world that can be compared to theoretically predicted values. Not only is instrumentation used in
testing during design and validation but systems are increasingly reliant on embedded sensing.
With the advent of computerized control and control theory sensors are becoming an integral part
of feedback control loops. These loops function by having sensors that detect the state of a
system and changes in it and then manipulate inputs to the system to control the state and
generate desired changes. This theory allows for a higher level of control of a system than is
possible by simply having a human controlling the system.1 Additionally, embedded sensors can
be used to monitor the health of a system and track diagnostics about performance that can
dictate maintenance schedules as well as provide statistics about wear and failures that can be
used to improve the design in future versions.
With the rapid pace of advancements in microcontrollers and sensor manufacturing and
components shrinking there is less of a cost or size barrier preventing sensor integration in new
systems. Sensors are being made smaller, cheaper and smarter. Gone are the days of large
expensive and complicated systems for data acquisition and a new generation of miniature plug
and play sensing systems now exist. Largely the days of having to calibrate sensors before each
experiment is over, except in cases where higher precisions are necessary. Sensors often come
calibrated from the factory and only require validation before use and spot checking to ensure
they remain accurate. However, with these rapid advances in technology there is a need to keep
up to date on the latest in sensing technologies to fully take advantage of what is available.
Until now WPI has taught instrumentation through the course Engineering
Experimentation (ME3901). The course is described as “A course designed to develop analytical
and experimental skills in modern engineering measurement methods, based on electronic
instrumentation and computer-based data acquisition systems.” At the top level this course is a
course in experimentation with a focus on instrumentation. The experiments “address both
mechanical and thermal systems and instrumentation in either traditional mechanical engineering
(heat transfer, flow measurement/visualization, force/torque/strain measurement,
motion/vibration measurement) or materials engineering (temperature and pressure
measurements in materials processing, measurement of strain and position in mechanical testing
of materials).” This course is a very traditional educational model of lectures and laboratory
experiments designed to teach students about instrumentation. The course provides a strong basis
but leaves room for improvement in the area of modernizing what is taught.
This MQP project looked to enhance the current offerings which form the basis of the
ME3901 course by creating or using alternative methods for teaching students about
instrumentation and measurements. The model chosen was for a set of discrete modules that each
teach the student about a chosen set of sensors. These modules are designed to work with a
laboratory kit the students would purchase. Each kit supplied all the required components but
more importantly, allowed the student to retain the instrumentation and measurement devices for
future uses. Modules were designed to be completed by students independently. Their goal was
to teach the student the same engineering measurement techniques/procedures as the currently
offered course but in a self contained way that they might complete at their own pace. The
structure chosen for the modules was an introductory module followed by a series of modules
1 Åström & Murray, 2012

7
targeting specific components for measurement and experimentation. The set of modules
culminates in a final capstone project module.
The introductory module explains the basics of using the included microcontroller and
integrating sensors. It covers how to use the input and output functionality of the controller to get
data from sensors to a computer. There are lessons within the module that walk students through
how to use different sensors and inputs to provide them with the knowledge they need to
complete the later modules. This first module needs to be completed by all students prior to other
modules.
The rest of the modules were all designed to focus on a specific topic and work with the
related sensors. For example, modules were created on temperature, motor control and distance
sensing. Each module informs the student about the included sensors and provides instructions
for the student to perform tasks with each sensor to learn how they work. Each module is
concluded with a small capstone project that the students must complete with less instruction
than the rest of the module to demonstrate skills while also applying the sensors in a realistic
application.
The idea behind the modules with the exception of the introduction and the capstone
modules is that the students have choices in which modules that they do to tailor their experience
to their interests. This project includes a pilot set of modules used to demonstrate the idea of the
module based system. These modules can be used to test if the modules meet the intended
learning objectives. A full course would require additional modules. The idea would be to
generate a pool of 10-12 modules. Students would be expected to complete a certain number of
modules for example eight out of the 12 modules and once they have completed that many they
would have completed enough learning objectives to be counted as completing the course. This
is based off of the idea that the methods of instrumentation are to some extent independent of
what specifically is being measured with the sensors. With a full course the students could also
be required to select modules from different groups.
The introductory and capstone modules would be independent because they serve a
specific purpose that every student would be required to do. However, the rest of the modules
tend to have overlap and could be group so they students only had to perform certain
experiments. For example, controls could be a set of modules that include motors, actuators and
other systems to control a system. Similarly, thermodynamics could be a set that does
measurement relevant to temperature, pressure and/or flow rate. Another might be a mechanical
set, which focuses on sensing strain, force and accelerations. This modularity provides a lot of
flexibility to how the course is tailored to students and their needs while still requiring all
students to at least have some breadth of knowledge.
The flexibility of the modules also would enable the program to be constantly updated,
added to and improved upon. If individual modules become outdated they can be updated
without impacting the broader structure. In addition, more modules could easily be added to
expand the instrumentation that is covered to broaden the scope. For example, a module with
biomonitoring sensors could be developed for students for whom that would be relevant.
The final module is an open-ended capstone design project. This project is designed to
give students a framework to start. The project has multiple solution pathways using a collection
of previous module completions. It requires the student to determine the path and bring the
project to fruition. This capstone module requires the student to think critically and undertake
design work on their own. The module demonstrates the competence of the student to reach the
learning objectives by requiring a certain number or types of sensors to be used in their final

8
project. The capstone module functions to require the students to act as engineers and develop a
system utilizing the skills they learned from the previous modules.

9
Module 1: Exploring the Arduino This mandatory introduction module provides the basis for the other modules. It consists
of experiments that explain the basics of using an Arduino as well as providing information
about basic circuitry. The experiments cover blinking an LED, turning an LED on and off using
a button, controlling the brightness of an LED with a potentiometer, and using inputs to control
the Arduino.
Objectives: Learn the fundamentals of engineering measurement
o Why measurements are necessary
o How to make measurements
Learn how to program an Arduino
o Basic structures, void setup, void loop
o Digital I/O
o Analog I/O
o Serial Connection
o Python/Arduino interface
Background: Making measurements of the physical world is necessary in all parts of engineering.
Anytime engineers need to understand a physical problem, it can be useful to be able to sense
and quantify phenomenon that may be difficult to observe. When a prototype of a design is built,
validation of the design must be done. For example, a new car engine design would be wired
with sensors measuring pressure and temperature in the chamber, composition of the exhaust,
and torque and speed of the crankshaft. All of these measurements can be used to analyze how
the design is performing which can be compared to the original theoretical design. Beyond
development work, sensors are being embedded in all new systems to make them smarter and
improve performance. This trend is continuing so it is important for mechanical engineers to
understand how sensors operate and how to best utilize them. Sensors can also be used by a
system to aid the system in controlling itself. With the advent of computer systems and sensors
new mechanical designs can be designed to be higher performing by utilizing a feedback loop. A
feedback loop is when a computer uses sensors to measure the state of a system and make
appropriate adjustments to maintain stability.1
Sensors enable measurement by taking changes in physical properties and converting
them into electrical signals. Generally, the signal is in the form of a change in voltage, current or
resistance that can then be measured using a computer system to track and record the data. These
changes can often be very small, but using simple circuit components including Wheatstone
bridges or microcontrollers aid in parsing out and recording the signal.
Most computers do not have a means for connecting analog or digital components like
sensors directly to them so an intermediary between the sensors and the computer must be used.
The intermediary system is an electronics component that takes the signals from the sensors and
interprets them into a signal that is understood by the computer and then transfers the
information to the computer typically via a USB port. This system is often referred to as a data
acquisition system such as the Texas Instrument DAQ box. With the growing area of hobby
1 Åström & Murray, 2012

10
electronics, microcontrollers are becoming more prevalent and less expensive, making them a
viable choice for use as an intermediary between a computer and a set of sensors.
Single-board computers, commonly referred to as microcontrollers are a class of
electronic boards that operate on small low-power processors and are designed to be inexpensive
computing options for applications where some level of computer control is desired but no major
processing is needed as well as interfacing with sensors and control. There are many different
brands of microcontrollers on the market with most brands offering a range of levels of
microcontrollers. Most boards, referred to as microcontrollers, fall into two categories of either
being powered by a 32-bit system on a chip, similar to a traditional computer or powered by an
8-bit or 16-bit microcontroller. The first category contains boards such as the Raspberry Pi or the
Intel Edison which while useful for embedded computing applications they are much more akin
to miniature computers generally having more computing power than a true microcontroller. The
second category is boards powered by microcontrollers, which are generally contain less
processing power but are designed with a higher focus on embedded computing such as
Arduinos or any of their derivatives. In most cases both function similarly, being able to control
sensors and communicate with a computer but vary in the exact hardware and coding used to
achieve these goals. The boards contain the main chip and all the supporting circuitry for a USB
connection, power and both digital and analog I/O with specific boards having additional support
for other attachments. For example, the Raspberry Pi has a connection for an SD card and an
HDMI port for connecting a monitor to it.
The Arduino family of microcontroller was chosen to be used in this kit. The Arduino
family was chosen because it contains a whole range of boards with varying levels of capability
that all share a common programming structure so for any given project an appropriately sized
Arduino can be chosen that provides what is needed for any specific project. The Uno is the
smallest of the main boards in the Arduino line and features an ATmega328 microcontroller.1 A
derivative of the Uno called a RedBoard is included in this kit. The Arduino line extends from
the basic Arduino Uno to the Arduino Mega, which is similar to the Uno but it differs in that it
has significantly more I/O and a more powerful microcontroller powering it. The Arduino line
also includes boards like the Arduino Zero, which is a 32-bit variant of the Arduino platform.
Boards like the Zero are based off of the architecture of Advanced RISC Machine or ARM
processors which provide significantly higher processing power but does limit the I/O
capabilities such as a reduced operating voltage of 3.3 volts versus 5 volts on an Uno and only ⅓
of the current capacity.2 These limits reduce the ability of the board to power sensors with higher
power requirements.
The programming for Arduinos is handled via the open-source Arduino Software
available for free from Arduino.cc. This includes an Arduino specific integrated development
environment. There is also extensive documentation supporting the software available from the
Arduino foundation's website. While an Arduino can be used to do rudimentary data analysis this
is not really the purpose of the device. For a more complete data analysis, a tool like Python is
far more powerful. The serial interface on Arduinos allow them to easily connect to a computer
running software like MATLAB and through this connection data can be passed to MATLAB for
logging and analysis purposes. An Arduino is not natively equipped for any large-scale data
logging. Consequently, for remote sensing applications an Arduino could be equipped with
1 Arduino UNO & Genuino UNO, n.d. 2 Arduino ZERO & Genuino ZERO, n.d.

11
either an SD card module to log data and then the card can be downloaded manually or via a
WIFI or Bluetooth transmission to a computer.
Circuit Components for Module 1 A button is a simple circuit component that works as a momentary switch. When it is
depressed, electrical contacts are closed allowing electricity to pass through the switch. This can
be used to toggle a contact either high (+V) or low (ground) which can be used for tasks like
turning on an LED or sending a signal to an Arduino.
Light-emitting diodes or LEDs are simple circuit components that generate light when
they are supplied power. Being a diode, LEDs have a polarity meaning they can only be powered
when connected with current in one direction. Due to how LEDs work they require a minimum
voltage to trigger the light to be emitted so the easiest way to control the brightness of an LED is
to use a method called pulse width modulation (PWM). PWM effectively consists of turning
power on and off quickly so that the circuit element spends some of its time not energized. For
example, an LED can be dimmed to half its brightness if it is modulated to only be lit for half the
time and as long as the pulses are faster than the human eye can see it is perceived as a single
even light level. The percent of time that an LED is on or off in a given time period is called duty
cycle.
FIGURE 1: EXAMPLES OF DUTY CYCLES1
Figure 1 shows that for a 50% duty cycle the light is on and off for an equal amount of
time. Your eye will not see the light as only 50% as bright because eyes do not perceive
brightness in a linear fashion.2 A 75% duty cycle is when the LED is on for 75% of the time, it
would appear to be brighter than an LED with a 50% duty cycle, but duller than an LED with a
100% duty cycle. An LED that is on 100% of the time would be the same as the full power
voltage. An LED with a 0% duty cycle is essentially hooking an LED to ground.
The breadboard will be the base of the circuits that you will be building in this module. A
breadboard is a circuit prototyping tool used to build and test circuits before permanent circuits
are built. A breadboard sets of pins that are all interconnected. There are 4 vertical power headers
that are connected vertically. Between the power headers are horizontal rows of pins that are
connected but broken by the large gap in the middle. See Figure 2. Components will be
assembled into circuits on the breadboard for each part of the module.
1 Pulse Width Modulation, n.d. 2 Measured light vs. perceived light

12
FIGURE 2: BREADBOARD

13
Materials: Below you will find a materials list for this module including photos of each item to
assist with identification.
Procedure: 1.1 Build a circuit and write code that blinks an LED on for 1 second and off for one
second repeatedly
For this part you will need the following components:
Arduino Uno
Breadboard
USB Cord

14
LED Light
330Ω Resistor
Jumper Wires
Building the Circuit
Now that you are familiar with the relevant theory it is time to begin the circuit. Take the
breadboard and place an LED into it, connect the positive side to the 330 Ohm resistor. The
purpose of this resistor in series is to limit the current going through the LED to prevent it from
being burnt out. Referring to Ohm’s Law V = I*R, the voltage is constant so the current can be
limited by increasing the resistance. In this case since the current just needs to be limited to not
burn out the LED and not be carefully regulated this resistance of this resistor does not need to
be precise but in a general range. Two common sizes used with LEDs in a 5-volt circuit are 330
Ohm or 220 ohm resistors, either resistor limits the LED current to an acceptable range. Connect
the other side of the resistor to one of the pins (2-13) on the Arduino. The negative or flat side of
the LED should connect to the ground as shown in Figure 3.
FIGURE 3: LED DIAGRAM AND POLARITY
Note that the negative terminal has a shorter lead and a flat side on the plastic of the
LED. Connect the ground from the breadboard to one of the ground pins on the Arduino. While
you could just connect the positive and ground to the Arduino directly it is a good idea to get in
the habit of using the headers on the breadboard for these since later on more complex circuits
will require this. A wiring diagram for the circuit can be found in Figure 4.

15
FIGURE 4: 1.1 WIRING DIAGRAM
In Figure 5 there is a photo of the completed circuit built on a SparkFun RedBoard. In
this photo the LED, the resistor, the jumper wires, the breadboard, and the RedBoard are all
visible.
FIGURE 5: 1.1 BUILT CIRCUIT
Writing the Program
Now that the circuit is built it is time to write the programs for the Arduino in the circuit.
Programs are written as a series of functions that perform tasks necessary to achieve the desired
goal. The necessary functions are listed below with an explanation of what they do. Take some
time to review these functions and how they work and then move on to the instructions on how
to write this code. Pay special attention to these functions because they will become the basis for
most of the codes that will be written throughout these modules. These functions and commands
as well as their explanations in all the modules have come from both the Arduino and SparkFun
websites.

16
Functions follow the structure above. The output data type, the function name, followed
by a pair of parentheses and a pair of braces. The output data type determines what type of data
the function will pass out once complete. In most cases a function will either pass an integer
(abbreviated “int” as seen in the example above) or nothing in which case void should be written
as the data type (see setup function for an example). The function name is how the code
identifies the function. The parentheses contain any parameters given to the function. The braces
contain the codes that is executed when the function is executed. Functions are useful because
they can be defined once and referenced multiple times in the code for repeated actions.
Functions native to Arduino do not need to be defined but all other functions must be defined
before they can be used. Each line with a few exceptions in Arduino code must end with a
semicolon.
An Arduino code always has two default functions, void setup and void loop.
The void setup function begins every Arduino code and is run once by the program. It is
used to do setup tasks that need to be performed once like setup pin modes and turn on serial
ports. Void setup follows the structure above with an empty set of parentheses because they do
not take inputs. The braces then contain all of the setup for the Arduino code.
The void loop function is the main body of every Arduino code and is run repeatedly. It is
used to perform the main body of whatever function the program is meant to perform. For
example, if a code is designed to read an input and turn a light on the functions to do these task
would be in the void loop.
The pinMode function is used to set the state of the pins on an Arduino. The function
requires two parameters. The first parameter is the pin, either a pin number or a variable that has
been assigned to a pin number. The second is the mode for the pin which has two modes either
“INPUT” or “OUTPUT”.
The delay function is used to make the code wait for a period of time before continuing
with its execution. This function requires one parameter “x” which is how long of a delay is
desired measured in milliseconds.
The digitalWrite function is used to set the state of a pin that has previously been set as
an output. The function requires two parameters, the pin must be identified and then the state of
the pin must be identified. There are two possible states, either LOW (ground) or HIGH (5V).

17
Utilizing the above functions now try to create a simple Arduino code that can can blink
an LED by turning it on for one second and then turning it back off, waiting another second and
turning it back on. An example code can be found in Figure 6.
FIGURE 6: CODE FOR 1.1
1.2 Build a circuit with a button and a potentiometer
For this part you will need the following components:
Arduino Uno
Breadboard
USB Cord
LED
10kΩ Resistor
220Ω Resistor
Push Button
Potentiometer
Jumper Wires
Building the Circuit
For this experiment you will need a circuit containing an LED, button and potentiometer.
Begin by placing the LED on the breadboard; connect the positive side to a 220Ω resistor unlike
the previous part where a 330 ohm resistor was uses this part used a 220 ohm resistor seeing as
they can be used interchangeably because the LED will work but just be a bit brighter. Then, you
should connect the resistor to an analog output. Connect the negative side of the LED to the
ground. Connect the push button to a 10k resistor and a digital input pulse width modulation or
PWM pin. Connect the other side of the button to the ground, and connect the other side of the
10k Ohm to the power source. Finally put the potentiometer in the breadboard. The
potentiometer has an indentation on one of the 4 sides of the square. If the indentation side is on
your right side, then connect the pin that is the furthest away from you to the power supply,
connect the middle pin to an analog input, and connect the third pin to the ground. The power
supply should be 5 volts. Figure 7 offers a traditional wiring diagram.
18
FIGURE 7: 1.2 WIRING DIAGRAM
A photo of the built circuit is shown in Figure 8. The LED, the potentiometer, and the
button are positioned from top to bottom, respectively.
FIGURE 8: 1.2 BUILT CIRCUIT
Writing the Program
Now the code for the experiment needs to be written. This code will take input data from
a button to turn the LED on and off as well as data from a potentiometer to dim the LED. Below
are the new functions that are necessary to write the code. Review these functions and then
follow the instructions below.
The const command can be use to define variables within Arduino codes (note the value
cannot be changed once defined this way). The command must be followed by a data type such
as an integer, float or string, in the example above the variable is defined as an integer. After the

19
data type the variable name should be listed followed by whatever value is to be assigned to the
variable. This function can be useful for things such as designating a pin number, for example
use the variable LED1 in the body of the code wherever a pin related to an LED is used and then
at the beginning of the code define that variable as whatever pin the LED is plugged into.
The int function can be used to definite variables as integers to be used later in the code.
The function is followed by the variable name and then can either set the variable equal to a
value or leave the variable undefined.
The digitalRead function can be used to read the state of a digital input pin. The function
must give the input pin as a parameter. It will return a binary response as either LOW (0V) or
HIGH (5V). This function can be used to read inputs from components like buttons.
The if else function can be used to control the action of the code based on a set of test
cases. The function is followed by the first test case in a set of parentheses and a set of braces
containing the functions to be performed if that case is true. The if can then be followed by any
number of else if statements with their own test case and actions in the same structure as the if
statement. Finally, there can be an else function that has no test case but is the action the code
will take if none of the test cases are met. The code will run through all the test cases until one is
met and then it will perform the function related to that test case.
The analogRead function can be used to read the state of an analog input pin. The
function must give the input pin as a parameter. It will return an integer value between 0 and
1023. This function can be used to read inputs from components like potentiometers or
photocells.
The map function can be used to proportionally reassign a variable in a range to a value
in a new range. The function must be passed five parameters. First the variable to be reassigned
followed by the original range of the variable followed by the new range of the variable. For
example, a value of 5 in a range of 1-10 can be reassigned to be the proportional value 50 in the
range 10-100. This can be useful when a range needs to be either expanded or reduced.
The code for this experiment should be able to read both a button as in input to turn an
LED on and off and then nested with that there should be a second set of functions that reads the
input from a potentiometer and dims the LED based on the potentiometer position. Use if
statements to achieve these effects and nest them to generate the nested effect. An example code
for this section is shown in Figure 9. Once you have the circuit and code all set up try turning the

20
potentiometer; does the LED light up? Press the button once and then turn the potentiometer
again. Does the LED light up? Can you dim it and brighten it? If it does, congratulations;
otherwise you can troubleshoot your code using the example code.
FIGURE 9: CODE FOR 1.2
1.3 Control an RGB LED with a serial port
For this part you will need the following components:
Arduino Uno
Breadboard
USB Cord
RGB LED Light
3x 330Ω Resistors
Jumper Wires
Building the Circuit
The circuit for this section uses just an RGB LED and the supporting connections. Begin
by placing the RGB LED into the breadboard and connect pin 2 (longest lead) to ground.
Connect pins 1,3,4 (red, green, blue) to digital output PWM pins (2-13) on the Arduino via a 330
Ohm resistor. Figure 10 shows a traditional wiring diagram.

21
FIGURE 10: 1.3 WIRING DIAGRAM
Figure 11 is a photo of the circuit including the LED and the three resistors connecting
the digital output pins to the LED pins.
FIGURE 11: 1.3 BUILT CIRCUIT
Writing the Program
Now it is time to write the code for this part. The RGB LED controls just like dimming
an LED in the earlier section except the RGB is effectively three LEDs in one package so each
color (red, blue, green) must be controlled independently. The other main addition to this code is
that it will be taking inputs over the serial port from the computer to change the color. Review
the new functions below and then begin writing the code.
The while function is used to cause an action to happen for the entire time that a test case
is true. The function is followed by a set of parentheses which contain whatever test case is being

22
looked for. Then there is a set of braces that contain the action to be performed when the case is
met.
The serial begin function is used to initiate a serial connection between the Arduino and a
computer over the USB connection. The only parameter that must be given to the function is the
baud rate which is the communication rate over the connect. The default baud rate is 9600.
The serial available function queries the serial buffer of commands coming in from a
computer to the Arduino. The function does not do anything with the information in the serial
buffer. This is useful for creating cases where the code waits for an input before doing something
based on the command.
The parseInt function queries the serial buffer for the first integer value in the buffer and
then returns this value and remove it from the serial buffer. This function allows for a series of
integers to be sent over the serial connection and then individually be assigned to variables
within the code.
The serial read function queries the serial buffer for the next byte of information it and
returns that byte of information.
The constraint function is used to limit the range of values for a variable. This function
must be given three parameters. The first is the variable to be constrained followed by a
minimum and maximum value for the variable.
The serial println function can be used to print values from the Arduino to the serial port for the
computer to read. This function can either be used to print values from the Arduino or messages
in the form of strings if the message is put in quotation marks.
For this exercise the code must utilize a series of serial commands that allow the Arduino
to connect to the PC. The code should be able to read a series of integers from the serial port for
the color levels of each part of the RGB LED and then change the color of the LED to
correspond with the values sent. The Arduino serial monitor can be opened by the button in the
top right corner of the Arduino screen. Before attempting to send serial commands be sure to set
the commands to end with a newline character (select this from the dropdown menu on the
bottom right of the serial monitor. See Figure 12. The structure for the serial command should be
three integers between 0-255 separated by a space. (NOTE: if values above or below are entered
the “constrain” function will set them to the maximum or minimum value respectively.)

23
FIGURE 12: ARDUINO SERIAL MONITOR
Figure 12 shows the Arduino serial monitor. In the bottom right is the default baud rate is
set at 9600 baud, and to the left of the baud rate is a dropdown menu for the end of line or EOL
character which is set to Newline.
An example of the code used for 1.3 is shown in Figure 13.

24
FIGURE 13: CODE FOR 1.3
1.4 Multiple LED control
For this final experiment use the knowledge from the earlier parts to create this final circuit
and code. The circuit for this part should consist of a series of five LEDs each controlled by their
own pin on the Arduino. In addition to the LEDs there should be a potentiometer and two
buttons. The functionality should be that when one button is pressed the LEDs start blinking in a
series where the first turns on for a period of time and then turns off as the next one on the series
turns on for the same period and continues down the line until it reaches LED 5 and then starts
over at LED 1 this should continue until the button is pressed again. The second button should
change the direction of the sequence so starting at LED 5 and running backwards to LED 1.
Finally, the Potentiometer should control how fast the sequence runs (how much time each light
is on for) for the timing try and have the time range controlled by the potentiometer run from a
time of ½ second where the cycle is slow is visible then have the potentiometer shorten the time
until all of the LEDs appear to be lit the circuit is running so fast. A picture of how the circuit
might look is provided in Figure 14. You may notice when the circuit is running fast enough all
the LEDs appear to be on that each LED will appear dimmer than when it was clearly just one
LED on at a time. Why do you think this is?

25
FIGURE 14: SEQUENTIAL LED CONTROL

26
Module 2: Distance and Proximity Sensing In order to complete this module, the introduction module should be completed. This
module provides information about distance and proximity sensing. It consists of experiments
that show how to calibrate proximity sensors. The experiments include, calibrating an ultrasonic
range finder and an infrared proximity sensor and comparing the two sensors for a variety of
measurements.
Objectives: Learn how to use IR proximity sensor
Learn how to use an ultrasonic range finder
Identify the ideal distance ranges for each sensor
Background: Distance is a dimensional measurement that can be measured with the standard unit of
length, which is the meter (m). Lengths can be measured with wood or metal rulers within ±0.01
cm. The errors with using these types of length measuring devices are usually from the ruler
expanding or contracting due to extreme temperatures.1 This module will use rulers and
dimensional measuring devices in order to calibrate the distance sensors.
Distance sensing is an extremely diverse area of sensing. Distance sensing has an
extremely broad range of applications everything from small robotics applications like a robotic
vacuum to self-driving vehicles to targeting packages on spacecraft for docking. There are also
nearly as many types of distance sensors as there are applications. Some common distance
sensors include; LIDAR, RADAR, ultrasonic, and infrared. Each will be described subsequently.
Selection of sensors depends on many factors including distance to the target, required
precision, target material and cost. Most distance sensors operate on a similar principle. The
basic idea of most distance sensors is having an emitter that transmits some signal which then
bounces off of the target and is reflected back to a receiver on the device. Based off of analysis
of this signal either just by time it takes to reflect or analysis of changes in signal can be used to
determine range to a target.
A rapidly developing application for distance sensing is efforts being made to develop
self-driving cars. Self-driving cars use a suite of sensing technologies to be able to view the
world around them. Frequently they will use a system like LIDAR or RADAR for long range
distance sensing in concert with camera based systems for the mid range. Finally, self-driving
cars will use a system like an ultrasonic sensor for close range distance sensing.
Radar is one form of distance sensing that can be used for many applications. Radar
works by emitting an electromagnetic wave and then detecting the reflection when those waves
bounce off of objects and back to the target. By measuring the time it takes for the signal to
return the distance to the target can be calculated. There is more that Radar can determine about
a target, for example based on the Doppler shift of the signal the velocity of the target can be
calculated and based on how strong the reflection is information can be determined about the
material and size of a target. The multifaceted data provided by Radar has made it an ideal sensor
for many applications including many military applications for detecting everything from
missiles and planes to ships on the sea.2
1 Holman, 1994 2 Skolnik, 1990

27
Another upcoming application of Radar is in autonomous vehicles. Radar is used in this
application because it is good at detecting metallic targets like other vehicles. However, Radar is
a less accurate sensor for softer materials such as plant matter or animals. The size of an object
that can be detected is dependent on the wavelength of the Radar so Radar can be tuned to not
see things like water droplets, which allows it to see through things like fog that could obscure
other sensors.1
Ultrasonic sensors work in a similar manner to Radar sensors. Ultrasonic sensors work by
sending out sound waves that are outside the range of human hearing. These sound waves will
eventually hit what is trying to be measured and will bounce back to the device, Fig. 15. The
sensor then can determine the distance by using the amount of time that it takes for the sound
waves to return and knowing the speed of sound in dry air which is 1,125 ft/s, 767 mph or
343m/s.2 However, there are many properties that affect the speed of sound like humidity and
elevation, which make the ultrasonic sensor less effective.
FIGURE 15: ULTRASONIC SENSOR DIAGRAM
Some materials also absorb ultrasonic sound waves, which means the waves do not
bounce back and the sensor will not be able to measure it. An example of this is why movie
theaters cover the walls with carpet covered acoustic panels. These panels are made of sound
wave absorbing materials, so the room does not echo. Ultrasonic sensors are not able to measure
objects made of these types of materials. Similarly, objects made from porous materials like cork
and foam cannot be measured because of the air pockets in the material.3 Ultrasonic sensors do
not work in a vacuum, as sound waves need a medium such as air to travel.
A benefit of ultrasonic sensors is that measurements are not affected by color,
reflectivity, or transparency as opposed to infrared proximity sensors, which are effected by dark
colors due to infrared sensors being less accurate with objects that have high emissivity.
Emissivity is how effective the object’s surface is at releasing energy as heat. Black and dark
surfaces have high a higher emissivity. An example of this is a car with black interior left out in
the sun. After an hour or two of sitting under the sun, the black interior gets very hot because
1 Distance Sensors - RADAR, n.d. 2 Findlay, 2011 3 Grumney, 2011

28
black surfaces emit a lot of energy as heat. Infrared distance sensors do not work well with dark
surfaces because the infrared waves are absorbed.
Infrared sensors send out infrared waves that will hit the object that is being measured
and reflect back to the sensor. If the reflected light is strong, then the sensor knows that the
object is closer than if the light is weak.1 Figure 16 illuminates how infrared distance sensors
work. The arrows show the infrared light direction. The infrared light hits the object and then
bounces back and hits the proximity sensor, which determines how far the object is.
FIGURE 16: INFRARED PROXIMITY SENSOR
Infrared Distance sensor are an approach for distance sensing that is popular in robotics
applications because they are inexpensive and accurate sensors. These sensors rely on infrared
light being reflected off a target so they can be susceptible to the target material and how
reflective it is to infrared light and they are limited in range to about a meter. However, the
accuracy and quick detection time make them idea for robotics applications where robots need to
detect objects close to them to avoid crashing into their environment.2
This module will test both IR proximity sensors and ultrasonic sensors. All the circuits
being built in this module are basic and do not require many parts. You do not necessarily need a
breadboard for this module however you can still use one.
1 Hamilton–Smith, Khondker, & Norris, n.d. 2 Mondal, 2014

29
Materials:
Procedure: 2.1 Calibrate and use an ultrasonic range finder
For this section you will need the following components:
Arduino Uno
Breadboard
USB Cord
Ultrasonic Range Finder
Wires
Building the Circuit
The first thing you will need to do is to attach wires to your ultrasonic sensor. In order to do this,
you will need to use a soldering iron. A soldering iron will heat up to melt solder, often times a
mix of tin and lead, onto the the wires and the ultrasonic sensor. Here is a link to a soldering
tutorial: https://www.youtube.com/watch?v=BLfXXRfRIzY

30
Once the solder cools, and the wires are soldered onto the sensor, connect the ground on the
ultrasonic sensor to the ground on the Arduino, connect the 5V on the sensor to the 5V on the
board, and the connect the AN pin to any analog input pin on the Arduino. Figure 17 shows a
traditional wiring diagram.
FIGURE 17: 2.1 WIRING DIAGRAM
And in Figure 18 is a photo of how the ultrasonic range finder hooks directly up to the Arduino.
FIGURE 18: 2.1 BUILT CIRCUIT
Writing the Program
For this code you only need to set up a serial monitor as in module 1.3. You will need to
set your Arduino to read whichever analog input that is connected to your Rangefinder, and have
it convert the measurement to inches with a decimal. Then add a delay as shown in module 1.1,
but only for 0.1 seconds to allow time in between measurements. The frequency of ultrasonic is
over 20,000 Hz, which means that the time it takes for a single wave to oscillate is at most 5 ×10⁻⁵s, so 0.1 seconds gives plenty of time for a wave to oscillate. However, this delay is not
based on frequency it is to help with readability of your serial monitor. If the delay was only
0.01s you would have 100 readings each second. This code can be written using only commands

31
from the introduction module. The raw data collected from the sensor will not be an actual
distance measurement so the code should perform a linear fit.
𝑦 = 𝑚𝑥 + 𝑏 Figure 19 is an example of the code.
FIGURE 19: CODE FOR 2.1
Performing the Experiment
Take the distance sensor and set up the circuit with a set of code that prints out the raw
sensor data. Now place an object a known distance from the sensor (6 inches for example) and
record both the distance measured and the sensor value. Move the object farther away (3 inches
further for example) and repeat the recording. Continue this until the distance sensor does not
give a consistent reading anymore. Plug this data into a spreadsheet and generate a linear fit as
seen below in Figure 20. Add this calibration to your code and check your results.
FIGURE 20: TABLE AND GRAPH OF DATA USED FOR CALIBRATION

32
2.2 Calibrate and use an IR sensor
For this section you will need the following components:
Arduino Uno
Breadboard
USB Cord
IR Proximity Sensor
IR Jumper Wire
Building the Circuit
Connect the IR jumper wire to the IR distance sensor. Connect the red wire to the 3.3V
on the Arduino, the yellow wire to one of the analog pins, and the black wire to the ground.
Figure 21 provides a traditional wiring diagram.
FIGURE 21: 2.2 WIRING DIAGRAM
Figure 22 shows how the infrared proximity sensor hooks up to the Arduino in only three
places, power, ground, and an analog input.
FIGURE 22: 2.2 BUILT CIRCUIT

33
Writing the Program
You need to identify which analog input will be read by the Arduino. Then you should
start up a serial monitor as done previously. Then have it read the value from the input, and print
that value on your serial monitor. The code is the same as in module 2.1.
Performing the Experiment
For the infrared proximity sensor, you will need to calibrate it similarly to the way that
you calibrated the ultrasonic range finder. You will want to plot the value the sensor reads with
the distance away the object is. This relationship might not be linear.
2.3 Compare the two sensors
Choose four items and place at each distance, a few inches away, about a foot away,
between 1-2 feet away, and between 2-4 feet away. Be sure to measure each of these distances
with a measuring tape or ruler, to have a known measurement. Then measure each distance with
each sensor. Calculate the percent error with each measurement. With which distances was the
ultrasonic rangefinder more accurate, and with which was the IR sensor?

34
Item 1
Reference
Measurement Sensor Measurement
Percent Error
Infrared Sensor
Ultrasonic Sensor
Item 2
Reference
Measurement Sensor Measurement
Percent Error
Infrared Sensor
Ultrasonic Sensor

35
Item 3
Reference
Measurement Sensor Measurement
Percent Error
Infrared Sensor
Ultrasonic Sensor
Item 4
Reference
Measurement Sensor Measurement
Percent Error
Infrared Sensor
Ultrasonic Sensor

36
Module 3: Motor Control In order to complete this module, the introduction module should be completed.
This module provides information about motors, controlling motors, and H-bridges. The
experiments include controlling a DC gear motor, a servo, a stepper motor, and creating a sun
tracker with the use of photocells.
Objectives: Learn about the functions and about how to control motors
o DC motors
o Servo motors
o Stepper motors
Be able to identify which type of motor is best for various applications
Background: Motor controls on any system govern the movements and motion of the body. For any
mechanical body that moves, a motor is in place to provide the movement. Motors come in many
varieties for specific jobs, but all are classified under either DC or AC based on how it works.1
DC motors use electricity running through a wire and some metal “bristles” to create a static
magnetic field. Within the wire loop is a permanent magnetic that is the polar opposite of the
created magnetic field. This opposite polarity causes the magnet to spin creating mechanical
energy that is utilized in whatever system it is installed in. AC motors utilize the magnetic field
differently by having the magnetic field oscillate between directions, causing the magnet in the
middle to move constantly to try to “catch up” with the magnetic field.2 Each type of motor uses
magnetism to produce mechanical energy but each type comes with it’s own strengths and
weaknesses.
Each type of motor has pros and cons that dictate which should be used to accomplish a
goal or provide a certain outcome. AC motors can keep up a constant speed for a long period of
time and benefits from being simpler than a DC motor but the motor is heavier than a
comparable power DC motor. A major strength of DC motors is running of DC current which is
what is supplied from most battery packs so it eliminates the need for AC rectifiers that AC
motors need to run off batteries. The speed of a DC motor depends on the amount of voltage
being put into the motor, this makes controlling the speed far easier than an AC motor. This
module focuses on DC motors because of their simplicity in implementation and versatility.
Within the DC motor classifications there are three main types, DC gear motors, servo
motors and stepper motors. Gear motors are dc motors with a gearbox that spin continuously
when voltage is applied and stops when the voltage is removed. Servo-motors operate over a
limited rotational range, typically 90 or 180 degrees of rotation. The benefit of servo motors is
that they can be position precisely and have a holding torque so they can be used for control
applications where something needs to be moved a precise amount and held in position. The
Stepper Motor functions like a hybrid and can rotate continuously but can make precise rotations
and when it stops it has a holding torque that prevents rotation. Stepper-motors have multiple
small electromagnets; one on an outer ring and one on an inside ring, on opposite ends of each
1 Different types of motors and their use, 2016 2 Woodford, Induction motors, 2017

37
other to create concentrated magnetic fields. With these smaller magnets the stepper is able to
make “half-steps” in which you can control even further the movement of the inner ring but also
control the angle in which the inner ring stops at. This enables the ability stop the rotation at a
certain point generating the holding torque.1
You can control these motors with an H-bridge. An H-bridge is an electronic circuit in
itself. It has a certain amount of switches. The switches are separated in pairs and depending on
which set of switches are open, the electricity flows in a particular direction. If the other set of
switches is open the electricity will flow in the other direction.2 The H-bridge included in your
kit is a Texas Instruments SN754410 Quadruple Half-H Driver. Figure 23 shows a diagram of an
H-bridge.
FIGURE 23: H-BRIDGE DIAGRAM3
Figure 23 delineates what each pin on the H-bridge does. Pin 1 and pin 9 are both enable
pins. Depending on whether the enable pin is high or low will determine if the motor is on or off.
Figure 23 depicts a function table for the H-bridge. Whenever the enable pin is set to low, the
output is high-impedance or (off). In Figure 24 is the logic diagram of the H-bridge.
1 Woodford, Stepper motors, 2017 2 Sarafan, n.d. 3 SN754410 Quadruple Half-H Driver, 2015

38
FIGURE 24: H-BRIDGE LOGIC DIAGRAM1
All the triangles in the diagram are “buffer” gates. “Buffer” gates are a type of logic gate.
Many logic gates have only two states, high and low. These have thee possible states high, low,
and high-impedance. High means that the motor is obtaining current from the positive voltage
terminal whereas low means it is obtaining current from the negative. High-impedance is when
the circuit is disconnected and therefore the motor is off.
For this module you will be controlling both a DC gear motor and a stepper motor using
an H-bridge. You will need to use your breadboard in order to build these circuits. You will not
need to use all the pins on the H-bridge, but make sure to count pins starting from the left of the
semi-circle on the top.
1 SN754410 Quadruple Half-H Driver, 2015

39
Materials:
Procedure: 3.1 Use an H-bridge to control a DC motor
For this section you will need the following components:
Arduino Uno
Breadboard
USB Cord
40
Jumper Wires
DC Gear Motor
H-Bridge
Building the Circuit
The circuit for this section utilizes an integrated circuit called an H-bridge. The H-bridge gets
data connections from the Arduino as well as power supply from it and an output to the motor.
The value of using an H-bridge instead of directly controlling the motor from the Arduino is to
allow a larger power supply to be used with a bigger motor than can be handled by the Arduino
itself. The H-bridge requires data connections to the Arduino as well as power connections and
connections to the motor to be controlled. The bridge has two sizes and is capable of controlling
two motors. At the end of this part try modifying the code and circuit to drive both DC motors
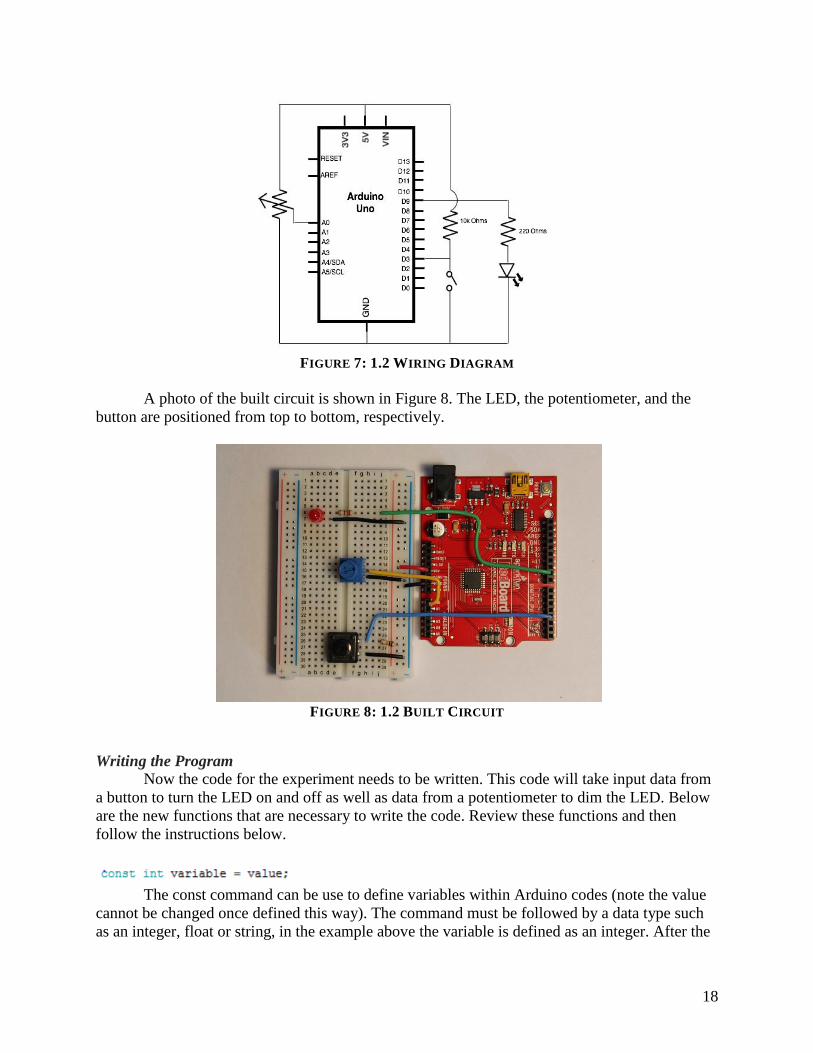
provided in the kit. In Figure 25 is the wiring diagram.
FIGURE 25: 3.1 WIRING DIAGRAM
In Figure 26, there is a photo of the built circuit showing the motor and the wires connecting it to
the H-bridge.

41
FIGURE 26: 3.1 BUILT CIRCUIT
Writing the Code
The code for this part is straight-forward performing one main loop that is all functions
covered in module one. First the code waits for data from the serial port and then reads this data
instructing it which way to turn and how fast. The code takes this data and using if statements
determines what direction it should turn and at what speed. The code then writes the to the pins
to set the direct and then the speed of the motor. The code then waits for further instructions.
This code can be written using only the commands that were used in the introduction module.
Figure 27 provides an example code that will run the DC motor.

42
FIGURE 27: CODE FOR 3.1
3.2 Control a servo and check accuracy
For this part you will need the following components:
Arduino Uno
Breadboard
USB cord
Servo motor
Jumper Wires
Building the Circuit
The circuit for the servo is extremely simply. All a servo requires is a ground, 5V and
data connected to its black, red and white pin respectively. The servo has on board logic that
takes the data input and cycles the motor appropriately to rotate the servo to the desired position.
Figure 28 shows a traditional wiring diagram.

43
FIGURE 28: 3.2 WIRING DIAGRAM
Figure 29 shows a picture of the built circuit. It shows that you only need three jumper
wires to connect the motor to the power, ground, and a digital input/output pin.
FIGURE 29: 3.2 BUILT CIRCUIT
Writing the Code
The code for this section uses three new functions.
This allows you to include functions from other Arduino libraries. In this case you will be
using functions from the Servo.h library.
The attach function sets up that there is a servo attached to the specified pin (in this case
the pin a variable called servopin).
44
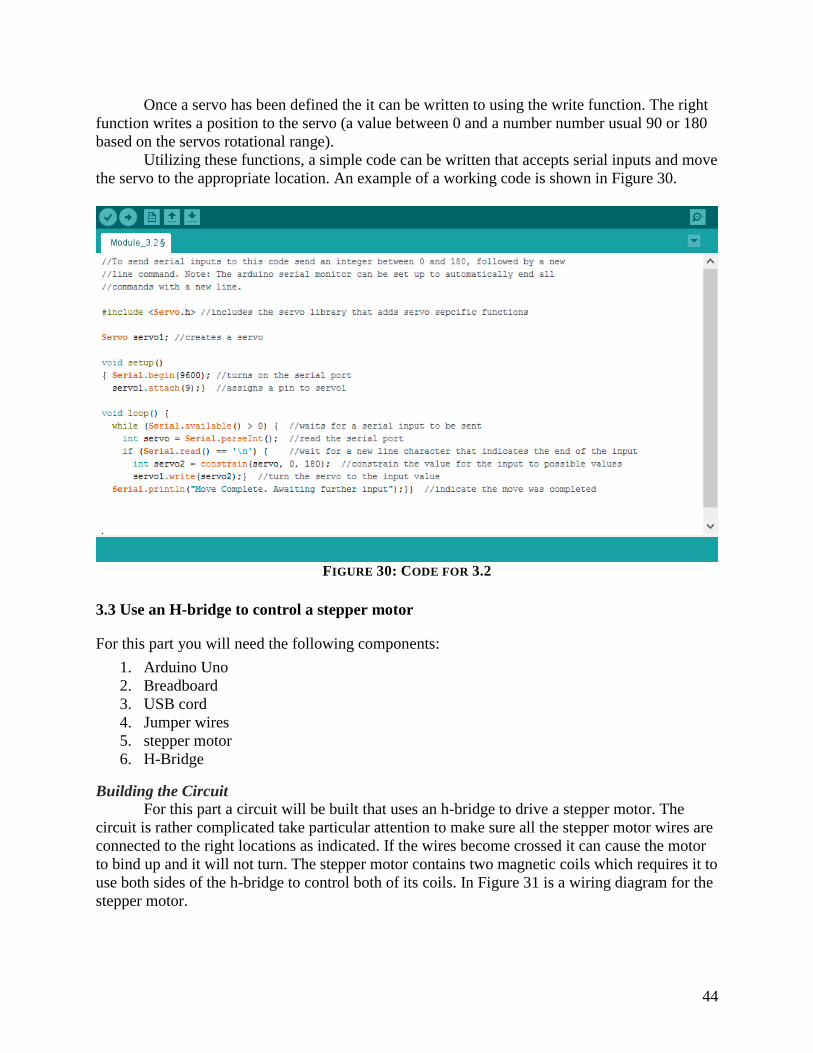
Once a servo has been defined the it can be written to using the write function. The right
function writes a position to the servo (a value between 0 and a number number usual 90 or 180
based on the servos rotational range).
Utilizing these functions, a simple code can be written that accepts serial inputs and move
the servo to the appropriate location. An example of a working code is shown in Figure 30.
FIGURE 30: CODE FOR 3.2
3.3 Use an H-bridge to control a stepper motor
For this part you will need the following components:
1. Arduino Uno
2. Breadboard
3. USB cord
4. Jumper wires
5. stepper motor
6. H-Bridge
Building the Circuit
For this part a circuit will be built that uses an h-bridge to drive a stepper motor. The
circuit is rather complicated take particular attention to make sure all the stepper motor wires are
connected to the right locations as indicated. If the wires become crossed it can cause the motor
to bind up and it will not turn. The stepper motor contains two magnetic coils which requires it to
use both sides of the h-bridge to control both of its coils. In Figure 31 is a wiring diagram for the
stepper motor.

45
FIGURE 31: 3.3 WIRING DIAGRAM
Figure 32 is a photo of the circuit for the stepper motor. It displays both the H-bridge and
the stepper motor.
FIGURE 32: 3.3 BUILT CIRCUIT
Writing the Code
The code for this part utilizes a purpose built library for controlling stepper motors which
greatly simplifies the required code. First follow the example code below and create a code that
makes the motor rotate a fixed number of steps in each direction. You will need to use
commands from the Stepper.h library.
You will also need three new commands in order to complete this part of the module.
This command lets the Arduino know that there is a stepper motor and to which pins the
stepper motor is connected to, and how many steps the stepper will take.

46
This sets the speed that the stepper motor will rotate in RPMs.
This gives the number of steps that the stepper motor will take. In order to maximize the
amount of control you have over your stepper motor you should use a high speed and only go a
few steps.
An example of this code is shown in Figure 33.
FIGURE 33: CODE FOR 3.3
Performing the Experiment
Place a tape flag on the output shaft or mark it to help you identify how many steps it takes to
complete one full revolution. This will be required for the second part. Once the first part is
complete. Modify the code using the code for the RGB LED in module one as an example to
take serial input to control the motor. Make a code that takes three pieces of data in to control the
direction, speed and number of steps to take.
3.4 Create a sun tracker
For this part you will need the following components:
Arduino Uno
Breadboard
USB cord
Jumper wires
servo motor
Two 10k ohm resistors
Two photocells
Tape (not provided)
Cardboard tube (not provided)
For the final circuit take note that the physical structure of the circuit is important. Set up the
pair of photocells on the breadboard spacing them approximately an inch apart (note you must be

47
able to slide the cardboard tube over them. Now on the axis perpendicular to both the line
between the two photocells and perpendicular to the longitudinal axis of the cardboard tube
connect the servo so its axis of rotation lines up with the axis that was just defined. (see photo
below) Connect the servo to the Arduino as was done in part two. Figure 34 shows how the final
sun tracker might look.
FIGURE 34: THE BUILT SUN TRACKER
The code for this section reads a pair of light sensors. As a light source moves left or
right one of the two sensors will go into shadow and the code detects when the sensor goes into
shadow by detecting a difference between the two sensors (note using a difference vs. an
absolute cutoff to define darkness makes the system auto adjusting to ambient light levels). Once
the difference is detected the code will turn the servo to repoint the sensors towards the light
source until it detects the difference has disappeared.

48
Module 4: Temperature Measurements This module requires that the introduction module has already been completed. This
module provides information about temperature, properties related to temperature, and each of
the sensors that will be used. In Module 4 you will perform experiments that show how to
calibrate thermal sensors. The experiments include, calibrating a thermistor, thermometer, and
thermocouple, using all three to measure temperature, and calculating heat flux from
measurements.
Objectives: Learn how to calibrate thermal sensing devices
o Thermistor
o Infrared thermometer
o Thermocouple
Measure temperature using temperature sensors
Calculate heat flux from measured change in temperature
Background: All physical components can be affected by temperature. Due to the fundamental
molecular structure, many other properties are related to temperature such as pressure, volume,
and resistance. Some of these relationships are easier to see than others. The relationship
between temperature and pressure can easily be noticed in the winter. Whenever the first cold
front of the season comes in, your car tires lose air pressure. If you do not bother to put more air
in the tires, by the end of winter when the weather heats up, your car tires pressure will increase
again. That is because there is a direct correlation between temperature and pressure; as
temperature decreases the pressure also decreases. The ideal gas law models this phenomenon,
𝑃𝑉 = 𝑚𝑅𝑇, where 𝑃 is pressure, 𝑉 is volume, 𝑚 is the mass of the gas, 𝑅 is the ideal gas
constant, and 𝑇 is temperature.1
There are two common scales for measuring temperature Celsius and Fahrenheit. The
Celsius or centigrade scale is based off the freezing and boiling point of water at atmospheric
pressure or 101 kPa. Both Celsius and Fahrenheit have absolute scales, Kelvin and Rankine
respectively. Zero on both the Rankine and Kelvin represents absolute zero.2 Conversions at
selected pressures can be seen in Figure 35.
1 Clark, 2013 2 Holman, 1994

49
Temperature in F Temperature in R Temperature in C Temperature in K
--------------------------
----- °𝐹 + 459.67
5
9°𝐹 − 17.78
5
9°𝐹 − 255.37
°𝑅 − 459.67 --------------------------
-----
5
9°𝑅 − 237.59
5
9°𝑅
9
5°𝐶 + 32
9
5°𝐶 + 491.67
--------------------------
----- °𝐶 + 273.15
9
5𝐾 − 459.67
9
5𝐾 𝐾 − 273.15
--------------------------
-----
−459.67 °𝐹 0 °𝑅 −273.15 °𝐶 0 𝐾
0 °𝐹 459.67 °𝑅 −17.78 °𝐶 255.37 𝐾
32 °𝐹 491.67 °𝑅 0 °𝐶 273.15 𝐾
100 °𝐹 559.67 °𝑅 37.78 °𝐶 310.93 𝐾
212 °𝐹 671.67 °𝑅 100 °𝐶 373.15 𝐾 FIGURE 35: TEMPERATURE CONVERSION CHART
Traditionally the mercury thermometer is based off the relationship that as temperature
increases so does volume. The glass thermometer used to contain mercury in a narrow tube and
as the mercury heats up, the volume increases and the mercury expands up the tube in the
thermometer. However, due to the toxicity of mercury, most thermometers use surrogates or
another red fluid instead.
There is a plethora of temperature or heat sensors on the market. One mode of classifying
them is: contact temperature sensors and noncontact temperature sensors. Contact temperature
sensors mean that the sensor must touch or make physical contact with whatever is being
measured such as a common thermometer. Non-contact sensors measure the changes in
temperature by radiation of liquids and gases, like an infra-red sensor.1
Infrared temperature sensors measure surface temperatures by radiation. Infra-red waves
are radiation waves, with a slightly longer wavelength than red on the visible electromagnetic
spectrum. The thermometer sends out infrared waves which bounce off at whichever object the
thermometer is pointed at. The difference in heat from the waves coming off the objects and the
heat of the object’s surroundings are measured with an infrared thermometer.2 It uses a lens to
focus light from the object being measured onto a thermopile, or detector. Thermopiles are often
made of multiple thermocouples connected in series. The thermopile sends an output voltage
proportional to the difference of the object temperature and the temperature of the thermopile.
This voltage is measured and converted to a corresponding temperature using a known
regression equation.3 Infrared thermometers have many advantages. Along with being fast, they
are also great for taking temperatures of objects that should not be touched. They are, however,
less ideal for humid and dirty or dusty environments, as dust or dirt will compromise the
temperature reading accuracy.4
1 Temperature Sensors, 2016 2 General Tools, 2016 3 General Tools, 2016 4 Dumey, 2014

50
Thermistors are another temperature sensor. Based on the temperature of the thermistor,
its resistance will change which can be measured as a voltage drop in a circuit if current is
constant as shown in Ohm’s Law 𝑉 = 𝐼 ∙ 𝑅. Thermistors are often made from ceramics like
nickel oxides or glass-coated cobalt. This ceramic material allows for a quicker response to
temperature changes, as well as the thermistor will be more accurate.15 Benefits of using a
thermistor are that they are inexpensive, small, highly sensitive, and long-lasting. Thermistors
are very stable temperature sensors. Some disadvantages include that the thermistor’s output data
is nonlinear, the response time is measured in multiple seconds,2 and thermistors have a center
temperature that they measure and their range of measurements are usually limited to within
50°C of this temperature. The relationship between resistance and temperature is a nonlinear
relationship that is modeled by the Steinhart-Hart equation 1
𝑇= 𝐴 + 𝐵𝑙𝑛(𝑅) + 𝐶[ln (𝑅)]3 where
𝑇 is temperature in Kelvin, 𝑅 is the resistance at 𝑇 in ohms, and 𝐴, 𝐵, and 𝐶 are the Steinhart
Hart coefficients which vary based on the type of thermistor and the temperature range.3 This is
often times linearized with an added resistance in parallel or series.4 Figure 36 a nonlinear graph
showing the change of resistance versus the change in temperature for thermistors.
FIGURE 36: RELATION BETWEEN THERMISTOR'S CHANGE IN RESISTANCE AND TEMPERATURE5
Figure 36 shows that changing the temperature from -80 °C to -60 °C, a range of 20 °C,
creates a large change in over 400kΩ of resistance. Figure 37 illuminates the nonlinearity of the
sensor for a temperature range extending 200 oC. However, in smaller temperature ranges such
as the range shown in Figure 38, the resistance drop in respect to change in temperature is almost
linear.
1 General Tools, 2016 2 Thermistors, n.d. 3 Steinhart-Hart Thermistor Calculator, 2016 4 Burris, 2016 5 P/N 1600-10K Thermistor, 2012

51
FIGURE 37: CHANGE IN RESISTANCE OVER 120 °C
FIGURE 38: CHANGE IN RESISTANCE OVER 40 °C
Some examples of when thermistors are used are microwaves, circuit protectors, cars,
and digital thermometers. In a microwave thermistors help to keep the internal temperature
constant, without it the microwave could overheat. Thermistors also measure the oil’s and
various coolants’ temperature in cars.1
Thermocouples are temperature sensors that are made of two different metal wires
connected at a point, called a “junction.” When there is a difference in temperature, a voltage is
created which can be converted into a temperature by using a reference table.2 Thermocouples
are often covered in order to protect them from external elements.
Thermocouples come in various types and with various junctions. There are eight main
types of thermocouples. Each type of thermocouple is made of different materials and has
different properties. The thermocouple that is used in this module is a Type K. Type K’s are the
most common type of thermocouple; they are inexpensive, accurate, and can measure a wide
range of temperatures. One of the wires is made from Nickel-Chromium and the other Nickel-
1 Different Uses for Thermistors, 2014 2 What is a Thermocouple?, 2011

52
Alumel. This thermocouple can measure from -455 °F to 2,300 °F, with an accuracy of ±0.75%.1
Thermocouples are used in hospitals as thermometers, in engine diagnostic tests, and they are
often used as a safety feature in ovens and radiators.2
The basis of the circuits that you will be building will require the breadboard, Arduino,
USB cord, and jumper wires used in the introduction module. You will also require three
temperature sensors. The infrared thermometer and thermistor can just be plugged into your
breadboard like the LEDs and resistors in the introduction module. However, the thermocouple,
requires the use of extra circuitry, the breakout board, in order to read the voltage created and
digitize it so that it can be read by the Arduino.
1 What is a Thermocouple?, 2011 2 Lewis, n.d.

53
Materials:
Procedure: 4.1 Calibrate a thermistor
For this section you will need the following components:
Arduino Uno
Breadboard
USB Cord
10kΩ Resistor
Thermistor
Electrical tape or heat-shrink tubing
Thermometer

54
Building the Circuit
Connect the 3.3 V to AREF, and the 10kΩ resistor. You need a 10kΩ resistor as a voltage
divider and you want the resistance on both sides to be approximately equal in order to get an
accurate measurement. If you used a 1kΩ or a 1MΩ your measurement will be compromised.
Connect the other side of the resistor to one of the analog pins and the 10kΩ thermistor. Connect
the other side of the 10kΩ resistor to the ground. Figure 39 shows a traditional wiring diagram.
FIGURE 39: 4.1 WIRING DIAGRAM
Figure 40 shows how the built circuit looks. Notice the resistor and the wrapped
thermistor connected in series.
FIGURE 40: 4.1 BUILT CIRCUIT

55
Writing the Code
You will want to set up the function and the function as
shown in previous modules. You will also want to include the serial functions from before in
order to record the temperatures in a separate window.
This defines a chosen variable as a value or a pin. Instead of typing out a certain number
each time you can define a variable as that number, then if you need to change the number you
only have to change it once and not everywhere that you used it. Define can be used with values
and with pins.
Analog reference is used to configure the the top of the voltage range for an analog input.
There are only certain options, the default setting is a 5V reference voltage, internal is the built-
in ATmega168 reference voltage of 1.1V, and external is for a reference voltage of what is
applied to the AREF pin.
Using this will let the Arduino know that the variable will be an integer with a length of 8
bits.
This lets Arduino know that the variable assigned as a float will have a decimal point.
A for loop repeats the statements until the condition is found false. The first thing that
happens is the initialization statement, then the condition is tested. Whenever the condition is
proven true the statements and increment are enacted, and the condition is then retested. When
the condition is untrue then the loop ends.
Serial.print prints whichever values are within the parenthesis into the serial connection.
You can add a base to the expression to have the values printed as binary, octal, etc.
In Figure 41 is an example code that works with a thermistor. At the top are all the
defined values that you will need to change to calibrate your thermistor.
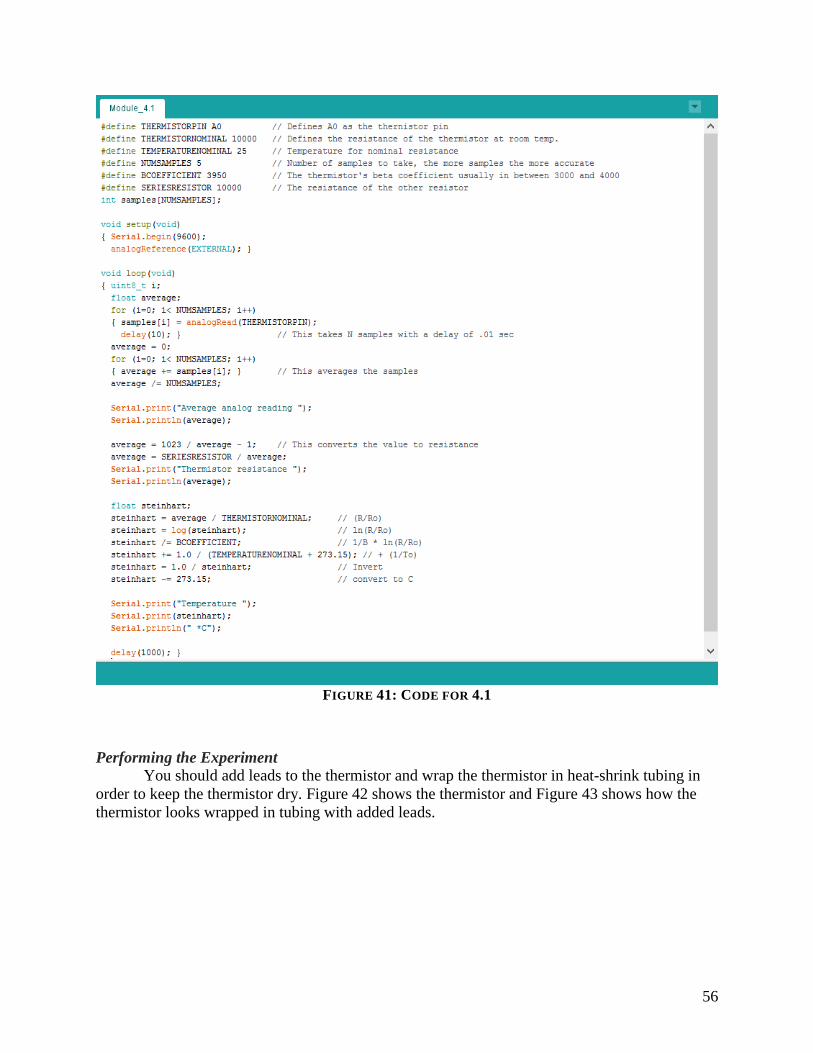
56
FIGURE 41: CODE FOR 4.1
Performing the Experiment
You should add leads to the thermistor and wrap the thermistor in heat-shrink tubing in
order to keep the thermistor dry. Figure 42 shows the thermistor and Figure 43 shows how the
thermistor looks wrapped in tubing with added leads.

57
FIGURE 42: THERMISTOR
FIGURE 43: THERMISTOR WRAPPED IN TUBING
Once everything is wired and the sketch is written, you should start calibration by
measuring the temperature of ice water. What temperature does your serial connection say? Now
try boiling water. What does your serial connection say? Each of the resistors and the b-
coefficient all have error margins, you should change the values that were defined previously so
that the measurements of the ice and boiling water temperatures are more accurate. Try to
measure other things with your thermistor. Choose objects with different properties for example
liquids, solids, shiny objects, dull objects, clear objects, and opaque objects. Make sure to record
these objects and their temperatures because you will need them again for 4.3.
4.2 Measure temperature with an IR thermometer
An IR thermometer is a useful temperature measurement tool because it is able to
measure temperature from a distance. To wire this lab simply wire the 4 pins to the VDD, VSS,
A4 and A5 pins, for A4 and A5 a 4.7kΩ resistor should be added in series as a pull-up resistor to
3.3 volts (see wiring diagram for correct wiring locations).

58
The MLX90614 chip that is used in this lab has a supporting Arduino library that can be
downloaded from SparkFun’s website. Here is the link
https://learn.sparkfun.com/tutorials/mlx90614-ir-thermometer-hookup-guide#mlx90614-arduino-
library. This library must be included in the Arduino code for the code to work correctly. Full
documentation for this chip can be found in the appendix.
For this part you will need the following components:
Arduino Uno
Breadboard
USB Cord
2x 4.7kΩ Resistors
Infrared Thermometer
Building the Circuit
The IR thermometer has four pins as highlighted in Figure 44. The IR thermometer has a
notch and the numbering of the pins start on the left side, numbering counter-clockwise.
FIGURE 44: INFRARED THERMOMETER PINS
The first pin connects to a 4.7k Ohm resistor which connects to the SCL port and the
3.3V on the Arduino. The second pin connects to a 4.7k Ohm resistor, which connects to both
the voltage and the SDA. The third pin is connected to the voltage, and the fourth pin is
connected to the ground. Figure 45 provides a traditional wiring diagram of the circuit for 4.2.

59
FIGURE 45: 4.2 WIRING DIAGRAM
Figure 46 displays the infrared temperature sensor and how it connects to the RedBoard.
Writing the Code
In order to write code for the infrared temperature sensor you will need to be able to have
the device measure, record, and write temperatures on the serial monitor.
IRTherm comes from the library that you have downloaded. You can label your infrared
thermometer however you like, sensor, thermometer, infrared, etc.
This starts the sensor for data measuring. You would replace sensor with the name of
your infrared thermometer.
FIGURE 46: 4.2 BUILT CIRCUIT

60
setUnit allows for you to set the measurements in whichever unit you would like. For
example, if you want Fahrenheit then you should use TEMP_F as the unit.
This reads all of the incoming data from your sensor.
This is the ambient temperature measurement. If you know the ambient temperature you
can set it as a value, or if it is changing you can set it as a variable.
This is the temperature of the object. It can also be set as a variable or a value depending
on what you are trying to measure. In this case you want your thermometer to measure both.
This writes the measured data to the serial port.
This creates a string of text. This is a helpful command when using the serial monitor as
you can increase the readability of your measured data by labeling it with strings of text.
In Figure 47 is a sample code that measures the ambient and object temperature with an
infrared thermometer.
FIGURE 47: CODE FOR 4.2

61
Performing the Experiment
Once everything is wired and the script is written, you should point the infrared
thermometer at two different types of surfaces to check and see if the temperature is measuring.
Try measuring the temperature of something clear. Use something opaque to hold both the ice
and boiling water. Try measuring the temperature of the waters. How close is it to 0°C and
100°C? What is the thermometer actually measuring? Try measuring the same things that you
measured with the thermistor, and make sure to record your results.
4.3 Compare thermistor, IR thermometer, and thermocouple
For this final exercise you should compare the measurements that you get with your
thermocouple and compare them to the measurements from your thermistor and thermocouple to
best determine which thermometers are better for which applications.
For this part you will need the following components:
Arduino Uno
Breadboard
USB Cord
Thermocouple Breakout Board
Type K Thermocouple
Logic Level Converter
Building the Circuit
This circuit involves a lot of hookups. Starting from the thermocouple connect the
positive side to the positive terminal of the breakout board and the negative to the negative
terminal on the breakout board. Connect the ground on the breakout board to the ground on the
Arduino. Connect breakout board’s VCC to the 5V pin on the Arduino. The SCK on the breakout
board connects to one of the TXI’s on the logic level converter. SO connects to the other TXI.
CS on the breakout board connects to 3.3V. Connect both TX0’s on the logic level converter to
two different digital pins on the Arduino. Connect the HV on the converter to the 5V and the LV
to the 3.3V. Connect both grounds to the grounds on the Arduino. Figure 48 shows a wiring
diagram.
FIGURE 48: 4.3 WIRING DIAGRAM

62
Figure 49 shows a picture of how the RedBoard, the logic level converter, the breakout
board, and the thermocouple all connect.
FIGURE 49: 4.3 BUILT CIRCUIT
Writing the Code
For this code you will need to include both the library for the breakout board and the
SPI.h library. You want to set up the Arduino so that it records the thermocouples measurements
and prints them on a serial monitor. There are no new commands needed for this part. A example
of a working code is provided in Figure 50.

63
FIGURE 50: CODE FOR 4.3
Performing the Experiment
Once everything is wired and the script is written, you should touch the thermocouple on
different types of surfaces to check and see if the temperature is measuring. Try measuring the
ice and boiling water. How close is it to 0°C and 100°C? Try measuring the same things that you
measured with the thermistor and infrared thermometer, and make sure to record your results.
Which ones were more accurate for which applications?

64
4.4 Calculate heat flux
The objective of this module is to calculate the heat flux between two volumes of water
using some of the skills you learned earlier in this module.
For this section you will need the following components:
Arduino
Breadboard
USB Cord
Thermocouple Breakout Board
Type K Thermocouple
Logic Level Converter
Styrofoam Cooler
Ice Water
Hot Water
16 oz. Plastic Cup
16 oz. Paper Cup
16 oz. Styrofoam Cup
The first step is to setup the experiment. For this experiment the code and circuit is what
was used in part three of this module. Once the circuit is ready make an ice water bath inside the
Styrofoam cooler (note throughout the experiment there should always be a significant quantity
of ice floating in the water). Because this exterior bath contains ice water its temperature will
remain approximately zero degrees Celsius. Next heat up water and fill one of the cups with a
known mass of water (either weigh the water or use a set volume and calculate the mass from the
density at that temperature). Then place the thermocouple inside the cup of water and submerge
the cup into the ice water bath. Make note of how deep the cup goes into the water so you can
calculate the contact area between the two. Record the temperature of the water over a period of
time at a consistent interval (you can set the recording interval in your code for the first test try
one second). Once the temperature has dropped near the temperature of the ice water bath stop
collecting data. Now repeat this experiment with the two other cups. Knowing the temperature
and volume of water you should be able to calculate how much thermal energy is in the cup of
water and using all of this data calculate the rate of heat flux between the two volumes of water.
From doing this you will be able to find the conductivity of each cup material and be able to
compare them.
Important equations you’ll need are:
𝑄 = 𝑚 ∙ 𝑐𝑝 ∙ 𝑇 𝑞 =𝑄2−𝑄1
𝑇2−𝑇1 𝑞 = −𝑘 ∙ 𝐴 ∙
𝑑𝑇
𝑑𝑥 𝑞 =
𝑑𝑄
𝑑𝑡
𝑑𝑇
𝑑𝑥=
𝑇𝑐𝑢𝑝−𝑇𝑏𝑎𝑡ℎ
𝑥
Where 𝑄 is thermal energy, 𝑚 is mass, 𝑐𝑝 is specific heat, 𝑇 is temperature, 𝑞 is heat flux or the
derivative of thermal energy in respect to time, 𝑘 is the thermal conductivity coefficient, 𝐴 is the
surface area of the cup holding the warm water, 𝑡 is time, and 𝑥 is the thickness of the cup
holding the warm water.1
1 Incropera, DeWitt, Bergman, & Lavine
65
Module 5 This final module is to serve as a capstone design project for the course. As such this
module will have a different structure than the rest and the product from the module will be
different than previous modules. The purpose of this module is to design an automated system to
take care of a plant. This includes, sensing and tracking light levels and controlling a window
shade, measuring and logging the temperature by the plant and measuring the moisture level and
watering the plant. All of these functions should be controlled by an Arduino and automated into
a daily cycle. In addition to designing the system you must write a lab report about the design
process and construction.
Objectives: Design a system to control watering and sun exposure for a plant
Integrate multiple sensors and controllers into a system
Log data from the Arduino to a computer using Python
Background: The first step in the design process is to research the problem. Unlike the previous
modules where background was provided for this module you are expected to do research
yourself. This research should be written up as background for your lab report. After doing the
initial research as additional topic come up during building the system be sure to add them to
your background. To help get started with the background some relevant topics can be found
below.
1. Relays and how to use them to control a high voltage with signal voltage.
2. SparkFun soil moisture sensor
3. Solenoid valves
4. (Bonus) Interfacing Arduino with python to log data to a spreadsheet. This will be
relevant if you wish to complete the bonus part of the module.

66
Materials:
Procedure: The procedure for this module is broken into three parts and a bonus part. Each part will
build and test one part of the system. The final part will bring it all together into one complete
system. Since this code will be very complicated be sure to carefully comment your code to help
keep track of what parts do to avoid confusion later when putting all the parts together.

67
Part 1:
For the first part of this module create a system to measure light intensity and control a
sun shade. Using the photocell in the kit set up a simple circuit that measures the light intensity
and prints that value to the serial port to be viewed. Using this circuit measure the light intensity
in the window the plant will be in front of and use that data to determine what value will be read
as the cutoff for what is considered sun exposure (potentially 80% of full sun values).
Next using the provided parts in the kit build a sunshade that attaches to a window via
suction cups and is controlled by a DC gear motor. The gear motor should have plenty of holding
torque to hold the shade. Measure how much time the motor must be activated to raise and lower
the shade. If these times are consistent create functions to open and close the shade. If it is not
consistent consider adding a sensor to detect the position of the shade to help open and close it.
Based on the type of plant determine what the max sun exposure should be. The code
should check the light intensity every 15 minutes and when it detects sunlight in the morning
begin a counter that counts how much sun exposure the plant is getting and once it reaches its
maximum close the shade for the day. The code should then reset at some point at night and
reopen the shade for the next day.
Part 2:
This part of the module should create a set of code that utilizes the soil moisture sensor to
measure the plants water level and control a solenoid for watering the plant. A calibration for the
sensor should be done using a sample of soil similar to the light intensity in part two. After
correlating the values from the sensor to levels of moisture the plant should be watered fixed
amounts to see how much a quantity of water changes the moisture sensor. This data should then
be used to create a code that monitors and controls watering of the plant similar to the system for
lighting in part two.
Once a control code is created using the moisture sensor, build the circuit to control the
flow of water. Using the provided hose and valve create a gravity fed system for watering the
plant you must provide a container to be used for the basin. Place the provided hose adapter into
the side of the container you have near the bottom and be sure to seal the adapter to prevent
leaks. The valve provided operates on 12 volts so a relay circuit must be built to control it with
the Arduino, which can only handle 5 volts. Once built this system should be calibrated by
opening the valve for a period of time and measuring how much flows in each time period. Use
this data to calibrate how long the valve should be opened by the code to successfully water the
plant. Ensure the water feeds a consistent amount no matter how full the basin is.
Part 3:
Create a base Arduino code to be combined with the previous parts to complete this
module. This base code should keep track of time and initiate the other parts (sun exposure and
watering) at certain intervals. The structure should have clearly defined Variables at the top to set
things like when water level testing and watering take place and how much sun exposure is
allowed. Use this code with a temperature sensor and record the temperature every 15 minutes to
test the codes timekeeping ability. Once that is working incorporate the previous sections to
build a full code. This code should now manage sun exposure, watering and temperature and
monitor these print the results every 15 to the serial port. This should include printing what

68
happened for example if the shade was closed or if the plant was watered as well as the current
moisture level, temperature and sun exposure level.
Bonus part:
Create code that takes all the data collected about the plant as well as actions taken
(watering or closing the shade) that is printed the serial port and logs that data. This might be
done with the python programming language. There are plenty of resources online about using
python to interface with Arduinos. For this part, the python code should read the data the
Arduino prints to the serial port and log them into a spreadsheet. This logging will allow you to
go back and check on the system and the plant. In addition, this can be useful for other
applications with sensors to log data for in depth evaluate than possible with only the Arduino
and serial monitor.
Report:
Once the system is all running a report should be written that documents exact how the
system was created. Each part should have its own section that explains how that part was
created. Discuss the challenges and how the final design ended up working. Include photographs
of the system setup and the code.

69
Conclusion These modules provide a framework for designing a module-based system to teach
engineering experimentation. The basis of an introductory module and a capstone design provide
bookends to begin and end the course. One of the main challenges encountered was determining
how explicit instructions should be versus requiring the students to figure things out on their
own. A balance was struck where clear explanations are given for the first part of the modules
and later parts require the students to do more on their own. With the current design of the
middle modules not having to be performed in a specific order limits there being any progression
from module to module. It is worth investigating having a fixed path of module, potentially with
multiple paths but a set sequence within a set to allow for later modules to push students to do
more on their own. Choosing a method with set paths but different paths could allow the
modules to be personalized for students such as aerospace students versus mechanical students.
Even within mechanical there could be slightly different paths for students more interested in
thermodynamics vs mechanical design.
The biggest addition needed for these modules is to add more modules to the series. This
set lacks modules focusing on mechanical properties like strain, pressure or acceleration, which
are all good candidate for modules. The current modules should also be tested to see not only
how educational they are but also to determine how long each will take students to complete. An
additional suggestion would be to add a section to the first module instructing students how to
interface Arduinos with python code on the computer. This would allow for more complex data
logging very reminiscent of data logging done in the current class with DAQ boxes but on far
cheaper and more accessible hardware. This is currently included as a bonus in module five but
if it was added to module one it could be incorporated into all of the modules.
Finally, the last major consideration would be to change the type of Arduino board used
in the kits. Arduinos were chosen because they are more similar to data acquisition systems than
alternatives like the raspberry pi. The Arduino works with a computer especially if data logging
is done with python compared to raspberry pi which is more like a full small computer. There are
other options to be considered within the Arduino family. There are larger more capable boards
like the mega as well as other versions of the Uno. There are for example versions with
Bluetooth or Wi-Fi connectivity which both would allow for remote connections to Arduinos
doing data collection. This is one option that could bring a modern edge to the education
provided.

70
Works Cited Åström, K. J., & Murray, R. M. (2012). Feedback Systems: An Introduction for Scientists and Engineers.
California Institute of Technology, Control and Dynamical Systems. Princeton: Princeton
University Press. Arduino UNO & Genuino UNO. (n.d.). Retrieved from Arduino:
https://www.arduino.cc/en/Main/ArduinoBoardUno
Arduino ZERO & Genuino ZERO. (n.d.). Retrieved from Arduino:
https://www.arduino.cc/en/Main/ArduinoBoardZero
Burris, M. (2016, August 3). Basic Circuit Laws. (About, Inc.) Retrieved from Lifewire:
https://www.lifewire.com/basic-circuit-laws-818993
Clark, J. (2013, October). IDEAL GASES AND THE IDEAL GAS LAW. Retrieved from Chemguide:
http://www.chemguide.co.uk/physical/kt/idealgases.html
Different types of motors and their use. (2016, May 5). Retrieved from Design Spark: https://www.rs-
online.com/designspark/different-types-of-motors-and-their-use
Different Uses for Thermistors. (2014). (Sensor Scientific, Inc.) Retrieved from Sensor Scientific, Inc.:
http://www.sensorsci.com/different-uses-for-thermistors
Distance Sensors - RADAR. (n.d.). (The Clemson University Vehicular Electronics Laboratory) Retrieved
from CVEL Automotive Electronics: http://www.cvel.clemson.edu/auto/sensors/distance-
radar.html
Dumey, B. (2014, March 24). Davis Instruments. Retrieved from Advantages And Disadvantages Of
Infrared Thermometers: http://www.davis.com/blog/2014/03/24/advantages-and-disadvantages-
of-infrared-thermometers/
Findlay, K. (2011, September 16). Radar and Ultrasonic Sensors. (Automation Products Group, Inc.)
Retrieved from APG: https://www.apgsensors.com/about-us/blog/radar-and-ultrasonic-sensors
General Tools. (2016, February 15). HOW DO INFRARED THERMOMETERS WORK? (General Tools
& Instruments LLC) Retrieved from General: https://www.generaltools.com/blog/how-do-
infrared-thermometers-work/
Grumney, D. (2011, March 1). Ultrasonic Transmitters vs. Guided-Wave Radar for Level Measurement.
(Questex, LLC.) Retrieved from Sensors Online: http://www.sensorsmag.com/sensors/leak-
level/ultrasonic-transmitters-vs-guided-wave-radar-level-measureme-8289
Hamilton–Smith, G., Khondker, R., & Norris, W. (n.d.). Infrared Proximity Sensor. Retrieved from Grade
9 to Engineering: http://www.g9toengineering.com/AllSaints/infraredproximity.htm
Holman, J. P. (1994). Experimental Methods for Engineers (6th ed.). New York: McGraw-Hill.
Incropera, F. P., DeWitt, D. P., Bergman, T. L., & Lavine, A. S. (n.d.). Fundamentals of Heat and Mass
Transfer. Wiley.
Lewis, K. (n.d.). What are Thermocouples Used For? Retrieved from SCIENCING:
http://sciencing.com/thermocouples-used-5422876.html
Measured light vs. perceived light. (n.d.). Retrieved from Lutron:
http://www.lutron.com/TechnicalDocumentLibrary/Measured_vs_Perceived.pdf
Mondal, R. (2014, April 14). Proximity Sensor. Retrieved from Ron Robotics:
http://www.rakeshmondal.info/sensors/proximity-sensor
P/N 1600-10K Thermistor. (2012). Retrieved from Arroyo Instruments:
http://arroyoinstruments.com/manuals/ArroyoThermistorInstructions.pdf
Pulse Width Modulation. (n.d.). Retrieved from Sparkfun: https://learn.sparkfun.com/tutorials/pulse-
width-modulation
Sarafan, R. (n.d.). How to make an H-bridge. Retrieved from Instructables:
http://www.instructables.com/id/How-to-make-an-H-bridge/step2/The-truth-about-H-bridges/
Skolnik, M. I. (1990). Radar Handbook. Boston, Massachusetts, USA: McGraw-Hill Book Co.
SN754410 Quadruple Half-H Driver. (2015, January). Retrieved from Texas Instruments:
http://www.ti.com/lit/ds/symlink/sn754410.pdf

71
Steinhart-Hart Thermistor Calculator. (2016). Retrieved from Day Counter Inc.:
http://www.daycounter.com/Calculators/Steinhart-Hart-Thermistor-Calculator.phtml
Temperature Sensors. (2016). (Aspen Core, Inc.) Retrieved from Electronics Tutorials:
http://www.electronics-tutorials.ws/io/io_3.html
Thermistors. (n.d.). (Wavelength Electronics, Inc.) Retrieved from Wavelength Electronics:
http://www.teamwavelength.com/info/thermistors.php
What is a Thermocouple? (2011). (REO TEMP INSTRUMENTS) Retrieved from
ThermocoupleInfo.com: http://www.thermocoupleinfo.com
Woodford, C. (2017, February 21). Induction motors. Retrieved from EXPLAINTHATSTUFF!:
http://www.explainthatstuff.com/induction-motors.html
Woodford, C. (2017, January 21). Stepper motors. Retrieved from EXPLAINTHATSTUFF!:
http://www.explainthatstuff.com/how-stepper-motors-work.html

72
Appendices
Appendix A: Bill of Materials
Tinker Kit Contents:
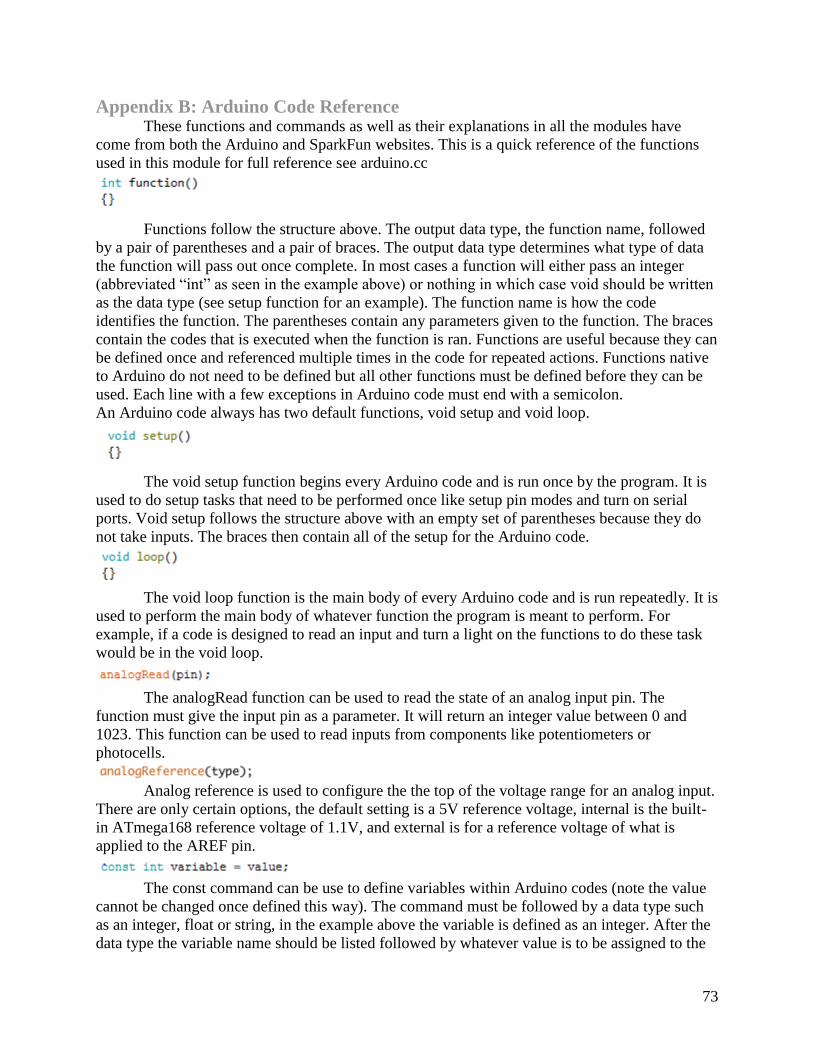
73
Appendix B: Arduino Code Reference These functions and commands as well as their explanations in all the modules have
come from both the Arduino and SparkFun websites. This is a quick reference of the functions
used in this module for full reference see arduino.cc
Functions follow the structure above. The output data type, the function name, followed
by a pair of parentheses and a pair of braces. The output data type determines what type of data
the function will pass out once complete. In most cases a function will either pass an integer
(abbreviated “int” as seen in the example above) or nothing in which case void should be written
as the data type (see setup function for an example). The function name is how the code
identifies the function. The parentheses contain any parameters given to the function. The braces
contain the codes that is executed when the function is ran. Functions are useful because they can
be defined once and referenced multiple times in the code for repeated actions. Functions native
to Arduino do not need to be defined but all other functions must be defined before they can be
used. Each line with a few exceptions in Arduino code must end with a semicolon.
An Arduino code always has two default functions, void setup and void loop.
The void setup function begins every Arduino code and is run once by the program. It is
used to do setup tasks that need to be performed once like setup pin modes and turn on serial
ports. Void setup follows the structure above with an empty set of parentheses because they do
not take inputs. The braces then contain all of the setup for the Arduino code.
The void loop function is the main body of every Arduino code and is run repeatedly. It is
used to perform the main body of whatever function the program is meant to perform. For
example, if a code is designed to read an input and turn a light on the functions to do these task
would be in the void loop.
The analogRead function can be used to read the state of an analog input pin. The
function must give the input pin as a parameter. It will return an integer value between 0 and
1023. This function can be used to read inputs from components like potentiometers or
photocells.
Analog reference is used to configure the the top of the voltage range for an analog input.
There are only certain options, the default setting is a 5V reference voltage, internal is the built-
in ATmega168 reference voltage of 1.1V, and external is for a reference voltage of what is
applied to the AREF pin.
The const command can be use to define variables within Arduino codes (note the value
cannot be changed once defined this way). The command must be followed by a data type such
as an integer, float or string, in the example above the variable is defined as an integer. After the
data type the variable name should be listed followed by whatever value is to be assigned to the

74
variable. This function can be useful for things such as designating a pin number, for example
use the variable LED1 in the body of the code wherever a pin related to an LED is used and then
at the beginning of the code define that variable as whatever pin the LED is plugged into.
The constraint function is used to limit the range of values for a variable. This function
must be given three parameters. The first is the variable to be constrained followed by a
minimum and maximum value for the variable.
This defines a chosen variable as a value or a pin. Instead of typing out a certain number
each time you can define a variable as that number, then if you need to change the number you
only have to change it once and not everywhere that you used it. Define can be used with values
and with pins.
The delay function is used to make the code wait for a period of time before continuing
with its execution. This function requires one parameter “x” which is how long of a delay is
desired measured in milliseconds.
The digitalRead function can be used to read the state of a digital input pin. The function
must give the input pin as a parameter. It will return a binary response as either LOW (0V) or
HIGH (5V). This function can be used to read inputs from components like buttons.
The digitalWrite function is used to set the state of a pin that has previously been set as
an output. The function requires two parameters, the pin must be identified and then the state of
the pin must be identified. There are two possible states, either LOW (ground) or HIGH (5V).
This lets Arduino know that the variable assigned as a float will have a decimal point.
A for loop repeats the statements until the condition is found false. The first thing that
happens is the initialization statement, then the condition is tested. Whenever the condition is
proven true the statements and increment are enacted, and the condition is then retested. When
the condition is untrue then the loop ends.
The if else function can be used to control the action of the code based on a set of test
cases. The function is followed by the first test case in a set of parentheses and a set of braces
containing the functions to be performed if that case is true. The if can then be followed by any
number of else if statements with their own test case and actions in the same structure as the if
statement. Finally, there can be an else function that has no test case but is the action the code
will take if none of the test cases are met. The code will run through all the test cases until one is
met and then it will perform the function related to that test case.

75
This allows you to include functions from other Arduino libraries.
The int function can be used to definite variables as integers to be used later in the code.
The function is followed by the variable name and then can either set the variable equal to a
value or leave the variable undefined.
IRTherm comes from the library that you have downloaded. You can label your infrared
thermometer however you like, sensor, thermometer, infrared, etc.
The map function can be used to proportionally reassign a variable in a range to a value
in a new range. The function must be passed five parameters. First the variable to be reassigned
followed by the original range of the variable followed by the new range of the variable. For
example, a value of 5 in a range of 1-10 can be reassigned to be the proportional value 50 in the
range 10-100. This can be useful when a range needs to be either expanded or reduced.
The pinMode function is used to set the state of the pins on an Arduino. The function
requires two parameters. The first parameter is the pin, either a pin number or a variable that has
been assigned to a pin number. The second is the mode for the pin which has two modes
either INPUT or OUTPUT.
This is the ambient temperature measurement. If you know the ambient temperature you
can set it as a value, or if it is changing you can set it as a variable.
This starts the sensor for data measuring. You would replace sensor with the name of
your infrared thermometer.
This is the temperature of the object. It can also be set as a variable or a value depending
on what you are trying to measure. In this case you want your thermometer to measure both.
This reads all of the incoming data from your sensor.
setUnit allows for you to set the measurements in whichever unit you would like. For
example, if you want Fahrenheit then you should use TEMP_F as the unit.
The serial available function queries the serial buffer of commands coming in from a
computer to the Arduino. The function does not do anything with the information in the serial
buffer. This is useful for creating cases where the code waits for an input before doing something
based on the command.
The serial begin function is used to initiate a serial connection between the Arduino and a
computer over the USB connection. The only parameter that must be given to the function is the
baud rate which is the communication rate over the connect. The default baud rate is 9600.

76
The parseInt function queries the serial buffer for the first integer value in the buffer and
then returns this value and remove it from the serial buffer. This function allows for a series of
integers to be sent over the serial connection and then individually be assigned to variables
within the code.
Serial.print prints whichever values are within the parenthesis into the serial connection.
You can add a base to the expression to have the values printed as binary, octal, etc.
The serial println function can be used to print values from the Arduino to the serial port
for the computer to read. This function can either be used to print values from the Arduino or
messages in the form of strings if the message is put in quotation marks.
The serial read function queries the serial buffer for the next byte of information it and
returns that byte of information.
This writes the measured data to the serial port.
The attach function sets up that there is a servo attached to the specified pin.
Once a servo has been defined the it can be written to using the write function. The right
function writes a position to the servo (a value between 0 and a number number usual 90 or 180
based on the servos rotational range).
This sets the speed that the stepper motor will rotate in RPMs.
This gives the number of steps that the stepper motor will take. In order to maximize the
amount of control you have over your stepper motor you should use a high speed and only go a
few steps.
This command lets the Arduino know that there is a stepper motor and to which pins the
stepper motor is connected to, and how many steps the stepper will take.
This creates a string of text. This is a helpful command when using the serial monitor as
you can increase the readability of your measured data by labeling it with strings of text.
Using this will let the Arduino know that the variable will be an integer with a length of 8
bits.
The while function is used to cause an action to happen for the entire time that a test case
is true. The function is followed by a set of parentheses which contain whatever test case is being
looked for. Then there is a set of braces that contain the action to be performed when the case is
met.

77
Appendix C: Material Reference RedBoard