Embed Size (px)
Citation preview

ENGINEERING AND CONSTRUCTION BULLETIN
No. 2016-25 Issuing Office: CECW-CE Issued: 16 Sep 16 Expires: 16 Sep 18
SUBJECT: Guidance for Incorporating Climate Change Impacts to Inland Hydrology in Civil Works Studies, Designs, and Projects CATEGORY: Guidance 1. References: Required and related references are provided in Attachment A. a. Engineering and Construction Bulletin (ECB) 2014-10, Subject: Guidance for Incorporating Climate Change Impacts to Inland Hydrology in Civil Works Studies, Designs, and Projects, 2 May 2014. b. Engineer Regulation (ER) 1110-2-8159, Life Cycle Design and Performance, 31 October 1997. c. Engineer Manual (EM) 1110-2-1417, Flood Runoff Analysis, 31 August 1994. 2. Purpose. This Engineering and Construction Bulletin (ECB) reissues and updates the policy in ECB 2014-10 (reference 1a), Guidance for Incorporating Climate Change Impacts to Inland Hydrology in Civil Works Studies, Designs, and Projects. This ECB is effective immediately and applies to all hydrologic analyses supporting planning and engineering decisions having an extended decision time frame (i.e., not for short-term water management decisions). It provides guidance for incorporating climate change information in hydrologic analyses in accordance with the USACE overarching climate change adaptation policy. This policy requires consideration of climate change in all current and future studies to reduce vulnerabilities and enhance the resilience of our water resources infrastructure. 3. Objective. The objective of this ECB is to enhance USACE climate preparedness and resilience by incorporating relevant information about climate change impacts in hydrologic analyses for new and existing USACE projects. The required qualitative analysis includes any completed projects where Federal funds are being used to rehabilitate a project. It does not apply to short-term water management decisions. Changes other than climate that affect inland hydrology will continue to be evaluated in the manner described in current USACE guidance (e.g., Chapter 18, Evaluating Change in EM 1110-2-1417, Flood-Runoff Analysis). 4. Background. Up to this time, USACE projects, programs, missions, and operations have generally proven to be robust in the face of natural climate variability over their operating life spans. Recent scientific evidence shows, however, that in some geographic locations and for some impacts relevant to USACE operations, climate change is shifting the climatological
2
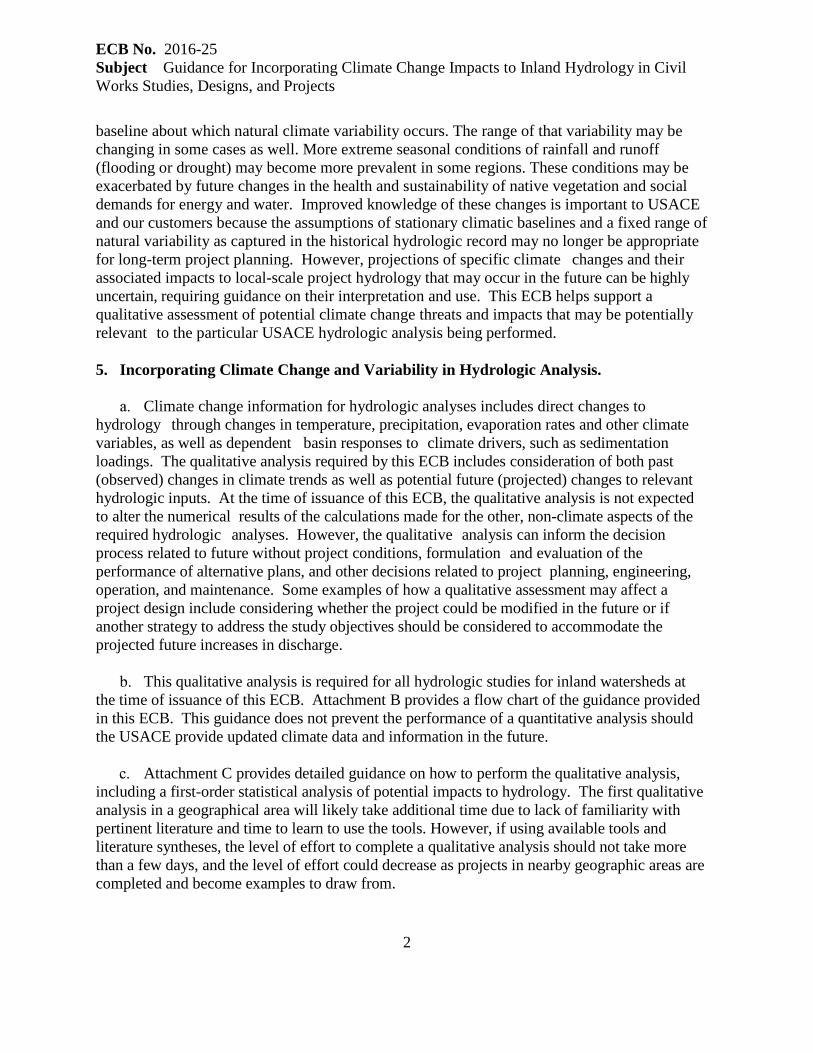
ECB No. 2016-25 Subject Guidance for Incorporating Climate Change Impacts to Inland Hydrology in Civil Works Studies, Designs, and Projects baseline about which natural climate variability occurs. The range of that variability may be changing in some cases as well. More extreme seasonal conditions of rainfall and runoff (flooding or drought) may become more prevalent in some regions. These conditions may be exacerbated by future changes in the health and sustainability of native vegetation and social demands for energy and water. Improved knowledge of these changes is important to USACE and our customers because the assumptions of stationary climatic baselines and a fixed range of natural variability as captured in the historical hydrologic record may no longer be appropriate for long-term project planning. However, projections of specific climate changes and their associated impacts to local-scale project hydrology that may occur in the future can be highly uncertain, requiring guidance on their interpretation and use. This ECB helps support a qualitative assessment of potential climate change threats and impacts that may be potentially relevant to the particular USACE hydrologic analysis being performed. 5. Incorporating Climate Change and Variability in Hydrologic Analysis.
Climate change information for hydrologic analyses includes direct changes to hydrology through changes in temperature, precipitation, evaporation rates and other climate variables, as well as dependent basin responses to climate drivers, such as sedimentation loadings. The qualitative analysis required by this ECB includes consideration of both past (observed) changes in climate trends as well as potential future (projected) changes to relevant hydrologic inputs. At the time of issuance of this ECB, the qualitative analysis is not expected to alter the numerical results of the calculations made for the other, non-climate aspects of the required hydrologic analyses. However, the qualitative analysis can inform the decision process related to future without project conditions, formulation and evaluation of the performance of alternative plans, and other decisions related to project planning, engineering, operation, and maintenance. Some examples of how a qualitative assessment may affect a project design include considering whether the project could be modified in the future or if another strategy to address the study objectives should be considered to accommodate the projected future increases in discharge.
This qualitative analysis is required for all hydrologic studies for inland watersheds at the time of issuance of this ECB. Attachment B provides a flow chart of the guidance provided in this ECB. This guidance does not prevent the performance of a quantitative analysis should the USACE provide updated climate data and information in the future.
Attachment C provides detailed guidance on how to perform the qualitative analysis, including a first-order statistical analysis of potential impacts to hydrology. The first qualitative analysis in a geographical area will likely take additional time due to lack of familiarity with pertinent literature and time to learn to use the tools. However, if using available tools and literature syntheses, the level of effort to complete a qualitative analysis should not take more than a few days, and the level of effort could decrease as projects in nearby geographic areas are completed and become examples to draw from.

3
ECB No. 2016-25 Subject Guidance for Incorporating Climate Change Impacts to Inland Hydrology in Civil Works Studies, Designs, and Projects (1) A web-based qualitative Climate Hydrology Assessment Tool (see https://maps.crrel.usace.army.mil/projects/rcc/portal.html for internal and http://corpsclimate.us/ptcih.cfm for public access) has been developed by USACE to assist in this analysis, along with other tools that support assessments of climate preparedness and resilience. The study team must recognize that the climate hydrology output available from USACE and partner agencies at the time of issuance of this ECB is limited in precision and accuracy, that the routed hydrology does not include the effects of regulation, may not adequately represent the complexities of watershed responses such as prairie pothole characteristics or snowmelt regimes, and that its outputs are intended for watershed-scale decisions. The part of the Climate Hydrology Assessment Tool that deals with observed trends only uses active gages with at least 30 years of data, as this is the minimum needed to produce sound results. In the absence of gages, or where records are short, hydrologically similar and/or nearby gages may be used for assessments of observed trends. Alternatively, the observed trends for the geographic area of interest from another source may be reported. This does not prevent the user from continuing with the analysis of projected conditions.
(2) At the time of issuance of this ECB, USACE policy does not require a quantitative assessment of how climate change might impact probable maximum flood (PMF) magnitudes for a particular study area. Only after a substantial body of research has been amassed to facilitate a quantitative understanding of the relationship between climate change and the magnitudes of extreme storms can USACE begin to develop the tools and technical guidance necessary to facilitate a quantitative assessment of how to incorporate climate change impacts into applied hydrologic analyses supporting PMF magnitudes and/or the uncertainties associated with them. Attachment D provides a preview of planned future quantitative guidance, which will depend on more highly resolved climate hydrology information now in production by an interagency and expert consortium. At the time of the issuance of this ECB, there is no consensus how extreme storms will evolve in the future, and this issue is not addressed in this ECB.
At least one member of an Agency Technical Review Team for projects covered by this ECB must be certified by the Climate Preparedness and Resilience CoP in the Corps of Engineers Review Certification and Access Program (CERCAP). Alternatively, this may be delegated to a District with a subject matter expert (SME) who has successfully completed a similar qualitative analysis on a separate study. The Climate Preparedness and Resilience CoP may help identify those who can perform, assist, or review qualitative assessments. 6. Update. All new requirements will be included in the next appropriate policy document update prior the expiration of this ECB. A series of guidance documents will be published in the future to support quantitative analyses of climate threats and impacts to specific project types.

4
ECB No. 2016-25 Subject Guidance for Incorporating Climate Change Impacts to Inland Hydrology in Civil Works Studies, Designs, and Projects 7. Points of Contact. The HQUSACE POCs for this action are Dr. Kathleen White, Lead, Climate Preparedness and Resilience CoP, [email protected] and Mr. Sean Smith, Lead, Hydrology, Hydraulics, and Coastal CoP, [email protected]. //S// THOMAS A. HOLDEN, JR., P.E. Acting Chief, Engineering and Construction U.S. Army Corps of Engineers Encl. Attachment A – References Attachment B – Flow Chart Attachment C – Method and Case Studies Attachment D – Preview of Quantitative Analysis Requirements
ECB No. 2016-25 – Attachment A 1
ATTACHMENT A: References Bonfils, C., B.D. Santer, D.W. Pierce, H.G. Hidalgo, G. Bala, T. Das, and T Nozawa. 2008. Detection and attribution of temperature changes in the mountainous western United States. Journal of Climate 21(23):6404–6424. Cavazos, T., and S. Arriaga-Ramírez. 2012. Downscaled climate change scenarios for Baja California and the North American Monsoon during the twenty-first century. J. Clim. 25:5904-5915. Cayan, D.R., M. Tyree, K.E. Kunkel, C. Castro, A. Gershunov, J. Barsugli, A.J. Ray, J.T. Overpeck, M. Anderson, J. Russell, B. Rajagopalan, I. Rangwala, and P. Duffy. 2013. Future climate: projected average. In G. Garfin, A. Jardine, R. Merideth, M. Black, and S. LeRoy (eds.) Assessment of Climate Change in the Southwest United States: A Report Prepared for the National Climate Assessment. Island Press, Washington, D.C., pp. 101-125. Cayan, D.R., S.A. Kammerdiener, M.D. Dettinger, J.M. Caprio, and D.H. Peterson. 2001. Changes in the onset of spring in the western United States. Bulletin of the American Meteorological Society 82:399–415. Cook, B.I., and R. Seager. 2013. The response of the North American Monsoon to increased greenhouse gas forcing. Journal of Geophysical Research-Atmospheres 118:1690-1699. Dettinger, M.D., and D.R. Cayan. 1995. Large-scale atmospheric forcing of recent trends toward early snowmelt runoff in California. Journal of Climate 8:606–623. Executive Office of the President. 2013a. The President's Climate Action Plan (June 2013). Executive Office of the President. 2013b. Executive Order 13653, Preparing the United States for the Impacts of Climate Change (1 November 2013). Friedman, D., J. Schechter, B. Baker, C. Mueller, G. Villarini, and K. D. White. 2016. US Army Corps of Engineers Nonstationarity Detection. US Army Corps of Engineers: Washington, D.C. Gershunov, A., B. Rajagopalan, K. Guirguis, D.R. Cayan, M.K. Hughes, M.D. Dettinger, C. Castro, R.E. Schwartz, M. Anderson, A.J. Ray, J. Barsugli, T. Cavazos, M. Alexander M. 2013. Future climate: projected extremes. In G. Garfin, A. Jardine, R. Merideth, M. Black, and S. LeRoy (eds.) Assessment of Climate Change in the Southwest United States: A Report Prepared for the National Climate Assessment. Island Press, Washington, D.C., pp. 126-147. Grundstein, A. 2009. Evaluation of climate change over the continental United States using a moisture index. Climatic Change 93:103-115.
ECB No. 2016-25 – Attachment A 2
Gutowski, W.J., G.C. Hegerl, G.J. Holland, T.R. Knutson, L.O. Mearns, R.J. Stouffer, P.J. Webster, and F.W. Wehner MFZ. 2008. Causes of observed changes in extremes and projections of future changes. In T.R. Karl, G.A. Meehl, C.D. Miller, S.J. Hassol, A.M. Waple, and W.L. Murray (eds.) Weather and climate extremes in a changing climate. Regions of focus: North America, Hawaii, Caribbean, and U.S. Pacific Islands. U.S. Climate Change Science Program and the Subcommittee on Global Change Research Synthesis and Assessment Product 3.3, Washington, D.C. Gutzler, D.S. 2013. Regional climatic considerations for borderlands sustainability. Ecosphere 4:art7. Gutzler, D.S., K.M. Wood, E.A. Ritchie, A.V. Douglas, and M.D. Lewis. 2013. Interannual variability of tropical cyclone activity along the Pacific coast of North America. Atmosfera 2. Hegerl, G., and F. Zwiers. 2011. Use of models in detection and attribution of climate change. Wiley Interdisciplinary Reviews: Climate Change 2011. Knowles, N., and D.R. Cayan. 2002. Potential effects of global warming on the Sacramento/San Joaquin watershed and the San Francisco estuary. Geophyscial Research Letters, 29(18):1891. Knowles, N., M.D. Dettinger, and D.R. Cayan. 2006. Trends in snowfall versus rainfall in the western United States. Journal of Climate 19:4545–4559. Kunkel, K.E, L.E. Stevens, S.E. Stevens, L. Sun, E. Janssen, D. Wuebbles, M.C. Kruk, D.P. Thomas, M. Shulski, N. Umphlett, K. Hubbard, K. Robbins, L. Romolo, A. Akyuz, T. Pathak, T. Bergantino, and J.G. Dobson. 2013. Regional Climate Trends and Scenarios for the U.S. National Climate Assessment. Part 4. Climate of the U.S. Great Plains. NOAA Technical Report NESDIS 142-4. http://scenarios.globalchange.gov/regions/great-plains Kunkel, K.E., L.E. Stevens, S.E. Stevens, L. Sun, E. Janssen, D. Wuebbles, K.T. Redmond, and J.G. Dobson. 2013b. Regional climate trends and scenarios for the U.S. National Climate Assessment: Part 5. Climate of the Southwest U.S. NOAA Technical Report NESDIS 142-5. Lettenmaier, D.P., and T.Y. Gan. 1990. Hydrologic sensitivities of the Sacramento–San Joaquin River Basin, California, to global warming. Water Resources Research 26: 69–86. Liang, X., D.P. Lettenmaier, E.F. Wood, and S.J. Burges. 1994. A simple hydrologically based model of land surface water and energy fluxes for GSMs. Journal of Geophysical Research 99(D7)14:415–428. Lu, J., G.A. Vecchi, and T. Reichler. 2007. Expansion of the Hadley cell under global warming. Geophysical Research Letters 34:L06805.

ECB No. 2016-25 – Attachment A 3
Melillo, J.M., T.C. Richmond, and G.W. Yohe (eds.). 2014. Climate Change Impacts in the United States: The Third National Climate Assessment, U.S. Global Change Research Program. NOAA. 2011. 2010 tied for warmest year on record. Press release dated 12 January 2011. NOAA. 2013. Regional Climate Trends and Scenarios for the U.S. National Climate Assessment. U.S. Department of Commerce, National Oceanic and Atmospheric Administration, National Environmental Satellite Data, and Information Service, Washington, DC. http://www.nesdis.noaa.gov/technical_reports/142_Climate_Scenarios.html NOAA. 2013. Regional Climate Trends and Scenarios for the U.S. National Climate Assessment: Part 5. Climate of the Southwest U.S. U.S. Department of Commerce, National Oceanic and Atmospheric Administration, Washington, D.C. NOAA/NWS. 2014. NOAA Atlas 14 Precipitation Frequency Data Server (PFDS). NOAA/NWS Hydrometerological Design Studies Center webpage, online at http://hdsc.nws.noaa.gov/hdsc/pfds/index.html, accessed 5 May 2014. Palecki, M.A., J.R. Angel, and S.E. Hollinger. 2005. Storm precipitation in the United States. Part I: Meteorological characteristics. Journal of Applied Meteorology 44:933-946. Pryor, S.C., J.A. Howe, and K.E. Kunkel. 2009. How spatially coherent and statistically robust are temporal changes in extreme precipitation in the contiguous USA? International Journal of Climatology 29:31-45. Stewart, I.T., D.R. Cayan, and M.D. Dettinger. 2005. Changes towards earlier streamflow timing across western North America. Journal of Climate 18(8):1136–1155. Vogel, R.M., C. Yaindl, and M. Walter. 2011. Nonstationarity: Flood magnification and recurrence reduction factors in the United States. Journal of the American Water Resources Association 47(3):464-474. Western Regional Climate Center. 2014a. Caballo Dam, New Mexico (291286) online at http://www.wrcc.dri.edu/cgi-bin/cliMAIN.pl?nm1286, accessed 2 December 2014. Western Regional Climate Center. 2014b. Hatch 2 W, New Mexico (293855) online at http://www.wrcc.dri.edu/cgi-bin/cliMAIN.pl?nm3855, accessed 2 December 2014. Wood, A.W., E.P. Maurer, A. Kumar, and D.P. Lettenmaier. 2002. Long-range experimental hydrologic forecasting for the Eastern United States. Journal of Geophysical Research– Atmospheres 107(D20):4429.

ECB No. 2016-25 – Attachment A 4
USACE. 1994a. Flood-Runoff Analysis. Engineer Manual (EM) 1110-2-1417, 31 August 1994. USACE. 1994b. Hydrologic Analysis of Watershed Runoff. Engineer Regulation (ER) 1110-2-1464, 30 June 1994. USACE. 2011. Enterprise Standard (ES)-08101, Software Validation for the Hydrology, Hydraulics and Coastal Community of Practice, 01 June 2011. USACE. 2014. Engineering and Construction Bulletin 2014-10: Guidance for Incorporating Climate Change Impacts to Inland Hydrology in Civil Works Studies, Designs, and Projects. USACE. 2015a. Recent US Climate Change and Hydrology Literature Applicable to US Army Corps of Engineers Missions – Missouri River Region 10. Civil Works Technical Report, CWTS-2015-04, USACE, Washington, DC. USACE. 2015b. Recent US Climate Change and Hydrology Literature Applicable to the US Army Corps of Engineers Missions - Ohio Region. Wang, H., S. Schubert, M. Suarez, J. Chen, M. Hoerling, A. Kumar, and P. Pegion. 2009. Attribution of the seasonality and regionality in climate trends over the United States during 1950-2000. Journal of Climate 22:2571-2590. Wang, .J, and X. Zhang. 2008. Downscaling and projection of winter extreme daily precipitation over North America. Journal of Climate 21:923-937.

ECB No. 2016-25 – Attachment B 1
ATTACHMENT B: Flow Chart Note: This guidance provides information to support a qualitative assessment of the impacts of climate change in hydrologic analyses in accordance with the USACE overarching climate change adaptation policy that requires consideration of climate change in all current and future studies to reduce vulnerabilities and enhance the resilience of our water-resource infrastructure. More quantitative guidance will be developed as actionable science evolves.

ECB No. 2016-25 – Attachment C 1
ATTACHMENT C: Method and Case Studies 1. Qualitative Climate Change Analysis for Hydrologic Analyses in Planning and Engineering Design Studies. The goal of a qualitative analysis of potential climate threats and impacts to USACE hydrology-related projects and operations is to describe the observed present and possible future climate threats, vulnerabilities, and impacts relevant to the study goals or engineering designs. The qualitative approach on its own will not produce binding numerical outputs, but may identify the direction of change in climate variables relevant to elements of the hydrology study. In some cases, the qualitative approach may be useful in characterizing future conditions that can be considered in the context of project goals or design vulnerabilities and impacts. This, in turn, can be used to describe future without project conditions or inform decisions during the alternative formulation and selection phase, when one project alternative can be judged to reduce vulnerabilities or enhance resilience more than the others, as well as during the design phase. At the time of this publication, the methods for incorporating climate change into the planning process are still developing. The best available science and the use of professional judgement are needed to address the risks associated with climate change. 2. Qualitative Analysis Framework.
a. To improve climate preparedness and resilience, USACE requires climate science-informed decision-making in studies, designs, projects, and groups of projects. The certainty and applicability of the science on climate change and hydrology available at the time of issuance of this ECB varies with location and spatial scale. It is important to conduct a qualitative analysis at the appropriate scale of the study. This does not mean that broad, global or continental-scale analyses, nor that the changes in current climate and hydrologic responses observed and measured at very fine scales cannot be used for this analysis. Rather, a successful qualitative analysis will combine the most useful information from a range of sources, noting the differences in information types, such as observed and projected data and the differences in uncertainty or confidence in the data and information deployed for the analysis.
b. The current state of actionable climate science, regardless of its scale of analysis,
encompasses large uncertainties about projected future conditions relevant to USACE projects and programs. In some cases, these uncertainties may be comparable in scale to existing sources of uncertainty, such as future changes in land use and land cover. In other cases, the climate-related uncertainties can also be larger or smaller than the ones more often considered in previous hydrologic analyses. Uncertainties associated with different climate variables and in different locations should be noted in the qualitative assessment and placed into context with the other uncertainties relevant to the hydrologic analysis.
c. Climate change is relevant to all USACE undertakings. The framework of the

ECB No. 2016-25 – Attachment C 2
qualitative analysis has two phases, introduced here and described in more detail below.
(1) Phase I: Relevant Current Climate and Climate Change. All analyses of climate change impacts begin with a literature review that outlines the broad trends of observed and projected changes to climate that might impact watershed hydrology and project purpose. An evaluation is made of information gathered about impacts to the important hydrologic variables and the underlying physical processes, such as changes in processes governing rainfall runoff or snowmelt, and trends in precipitation intensity and seasonality.
(a) The USACE Climate Hydrology Assessment Tool
(https://maps.crrel.usace.army.mil/projects/rcc/portal.html) can be used to identify historic trends in instantaneous peak flows at the gage(s) nearest the study area as a proxy for understanding how flows in the watershed have changed over the period of record (or other, relevant period of analysis). More highly resolved climate hydrology data, including a range of hydrologic variables, is in preparation by an interagency expert consortium and will be incorporated in the Climate Hydrology Tool in the future. At a minimum, this tool must be used in the qualitative analysis.
(b) In this phase, the USACE Nonstationarity Detection Tool (Friedman, et al. 2016)
(https://maps.crrel.usace.army.mil/projects/rcc/portal.html) may also be used to assess abrupt or slowly varying changes in observed peak flow data. The tool will be expanded to other hydrologic variables of interest in the future. This tool can support a qualitative analysis in an unregulated basin. It can also be used in a regulated basin, with the caveat that engineering judgement must be applied if no unregulated flow data is available to compare. The tools have slider bars to narrow a time window to allow the analysis to focus on a particular window of time. The window may be selected based on change points identified with the Nonstationarity Detection Tool, or an individual’s local knowledge. Because of issues related to data and model scale, data quality, and methodological sufficiency, the Climate Preparedness and Resilience Community of Practice should be contacted to provide guidance and coordination on further analysis if there are additional project needs.
(2) Phase II: Projected Changes to Watershed Hydrology and Assessment of
Vulnerability to Climate Change. This portion of the analysis focuses on projected changes in the study area and watershed(s) of interest.
(a) The USACE Climate Hydrology Assessment Tool can be used to identify projected
changes in annual maximum monthly flows for the Hydrologic Unit Code (HUC) 4 watershed(s) most relevant to the project. Typically this will be the watershed within which the project lies, but for some projects upstream HUC 4 watersheds may also be of interest.

ECB No. 2016-25 – Attachment C 3
(b) The USACE Watershed Vulnerability Assessment Tool
(https://maps.crrel.usace.army.mil/projects/rcc/portal.html) can provide information on the relative vulnerability of a given watershed to climate change using a wider variety of flow variables. The tool enables vulnerability assessment for each USACE business line within each HUC4 watershed across the United States. The qualitative analysis should, at a minimum, focus on the business line(s) and indicator(s) relevant to the project purpose. The information developed in Phase II should be used to help identify opportunities to reduce potential vulnerabilities and increase resilience as a part of the project’s authorized operations and also identify any caveats or particular issues associated with the data (e.g., different literature sources may project different outcomes). The information gathered in Phase II can be included either in risk registers or separately in a manner consistent with risk characterization in planning and design studies, depending on the project phase.
3. Information Included in Phase I Literature Synthesis. Information to support the qualitative assessment will be compiled from available, established, and reputable, scientific and engineering research literature. Where non-peer-reviewed literature is used, the assessment must include justification for its use and its peer-review equivalence. Examples of peer-reviewed information on which the qualitative analyses can draw include the US Global Research Program’s Third National Climate Assessment (http://www.globalchange.gov/what-we-do/assessment) and subsequent updates, the USACE climate change literature syntheses at the two-digit Hydrologic Unit Code (HUC2) scale (http://www.corpsclimate.us/rccciareport.cfm), the West-Wide Climate Risk Assessments and Basin Studies prepared by the Bureau of Reclamation (http://www.usbr.gov/WaterSMART/wcra/), the National Oceanic and Atmospheric Administration (NOAA)’s Technical Report NESDIS 142, Regional Climate Trends and Scenarios for the U.S. National Climate Assessment (NOAA 2013), relevant regional and sector information in the reports prepared as part of USACE climate change adaptation pilots, and reputable and peer-reviewed journal papers describing climate impacts to water resources in the watershed. Other sources of peer-reviewed information that are available at watershed or other scales should be explored and included if appropriate to the particular scales and variables of the hydrologic study. 4. Evaluation of Phase I Information. A robust evaluation of available information encompasses present patterns of climate change as well as future projected climate changes expected to impact watershed hydrology in the project region.
a. The literature evaluation should include a description of each source along with:
(1) The length and quality of the observed record;
(2) Any statistically significant trends in the observed record for the hydrologic

ECB No. 2016-25 – Attachment C 4
variables of interest or underlying physical processes;
(3) The type and quality of the projected climate information related to the hydrologic variables of interest or underlying physical processes;
(4) The direction and (if available) magnitude of the projected relevant changes, as well
as any projected trends. Where a trend line is determined, indicate the significance by reporting the p-value.
b. Similarities and differences in the literature should be noted, with a discussion about
how these might be considered in project planning and design. In cases where information from the literature conflicts, these results could be considered to provide a range of potential future conditions without assigning weights or expected probabilities to those potential futures. It is important that the qualitative analyses do not inject false precision by prematurely down-selecting to a limited set of the available projected future conditions.
c. A first-order statistical analyses of readily available projected climate data can be performed using standard statistical methods to characterize the data and identify trends for variables relevant and at a scale appropriate to the hydrologic study. However, the data developed by USACE along with an interagency and expert consortium and posted to the public archive (see http://gdo-dcp.ucllnl.org/downscaled_cmip_projections/dcpInterface.html) can pose difficulties in downloading and translating for use in analyses. To ensure consistent results, decrease errors, and minimize level of effort, the Climate Preparedness and Resilience CoP has made the data available in the CorpsMap database, and developed the USACE Climate Hydrology Assessment Tool to accomplish this first order analysis. Other analyses may be applied, such as the USACE Nonstationarity Detection Tool, but at minimum the USACE Climate Hydrology Assessment Tool should be run. Consultation with the CRP CoP is strongly encouraged at the start of analysis to ensure model, data, and methodological sufficiency. 5. Example Qualitative Analysis: Flood Risk Management project in Northeastern Kansas. The example qualitative analysis is for a Flood Risk Management project in northeastern Kansas, in HUC 1027 (Kansas: The Kansas River Basin, excluding the Republican and Smoky Hill River Basins. Kansas, Nebraska, Missouri).
a. Project Description. For the purpose of this example, let us assume that a flood risk management study includes a system of levees currently in place. The no-action alternative is to maintain flood risk management activities as they currently exist, including an existing levee system. Further, let us assume that the study is being conducted to evaluate additional measures to reduce the flood risk in the study area. The hydrologic analysis is directed at updating estimates of flood frequency. As is the case for many locations, the existing flood frequency information was last investigated for a period of record ending in the 1960s. Since that time, several floods have occurred, including the flood of record. Increases in projected future flood magnitude and frequency could impact both the future with- and without-project conditions.

ECB No. 2016-25 – Attachment C 5
Increases in future flood magnitude or frequency could also alter the project performance. Therefore, the hydrologic analyses should address how climate change may impact future conditions, with or without additional flood risk management measures.
b. Phase I: Relevant Current Climate and Climate Change.
(1) Climate in Kansas. Kansas has a temperate climate characterized by relatively cool
winters (with average temperatures below freezing) and warm summers (average temperatures just below 80°F). Summers are humid, with precipitation averaging about 4 inches in June, while winters are relatively dry (averaging less than an inch of precipitation in the winter months). Almost three quarters of the state’s average of 28 inches of precipitation comes during the warmest six months of the year, peaking in late spring (May). Interannual variability in precipitation is large. Flooding occurs most often due to intense precipitation in the warmer months (late spring through fall), although mainstem flooding along the Missouri River can also result from high winter snowpack in upstream mountains.
(2) According to USACE (2015a), over the historic period there has been an increasing
trend in observed mean and daily minimum air temperature in the study region; however, there is no discernable trend in daily maximum air temperature. A strong positive linear trend in mean air temperature has been observed over the period 1950-2000 in the winter (December-February) and spring (March-May), with decreasing temperature trends in the summer (June-August) and fall (September-November) (Wang et al., 2009). In the third National Climate Assessment, Kunkel et al. (2013) show temperatures over the previous 20 years were above the average for the period 1901-1960 for the Great Plains, inclusive of this study area. These trends were statistically significant (95 percent confidence interval) for all seasons in the region. Kunkel et al. (2013) also noted an increasing trend in the freeze-free season length, noting that there has been an average increase of 6 days in the freeze-free season when comparing 1991 – 2010 to a baseline of 1961 – 1990.
(3) With respect to precipitation, there has been a mild upward trend in annual and
extreme precipitation in the lower portion of the Missouri River Region identified by multiple authors. An increase in total annual precipitation in the lower portion of the Missouri River Region has been observed (Pryor et al. 2009). Increases in winter storm totals for the southern portion of the Missouri River Basin, including northeastern Kansas, have been observed for the period 1972-2002 (Palecki et al. 2005) and for annual precipitation for the period 1895-2006 (Grundstein 2009). The Wang et al. (2009) study showed generally increasing precipitation in northeastern Kansas in all seasons but summer, when precipitation declined over the period 1950-2000. Extreme precipitation events, measured as the frequency of the 20-year maximum daily precipitation event, were 33-50% higher for the period 1977-1999 as compared to 1949-1976 (Wang and Zhang 2008). A slight upward

ECB No. 2016-25 – Attachment C 6
trend in mean stream flow in the Missouri River Region has been identified by multiple authors (USACE 2015a).
(4) Observed Changes. The USACE Climate Hydrology Assessment Tool was used to
examine observed streamflow trends in the vicinity of the example project. At the time of release of this ECB, the tool has capability only the annual peak instantaneous streamflow; additional hydrologic variables of interest will be added in the future. The hydrologic time series of annual peak instantaneous streamflow at the gage Kansas River near Belvue, KS (06888350) is shown in Figure C-1. The gage exhibits a declining trend in annual peak instantaneous streamflow; however, this trend is not statistically significant as indicated by the high p-value. This indicates that overall, there has been no change in flood risk, as measured by the annual maximum flood, over the last 32-year period of record (1983-2014).
(5) Observed Changes. The Nonstationarity Detection Tool was also used to examine
the hydrologic time series at the gage Kansas River near Belvue, KS (06888350). No nonstationarities were detected in the record Figure C-2), indicating that no change can be detected in the long term mean, variance, or trend in the maximum annual flow time series. Over the period of record, the same gage shows a declining trend in annual peak instantaneous streamflow; however, this trend is not statistically significant (Error! Reference source not found.). The results of the nonstationarity detection analysis indicate that overall, there has been no statistically significant change in flood risk, as measured by the annual maximum flood, over the 32-year period of record (1983-2014).
(6) Projected Changes in Climate. The NOAA National Environmental Satellite, Data
and Information Service (NESDIS) released a report in January 2013 assessing climate trends and scenarios into the next 50–100 years for the Great Plains region (NOAA 2013). The report indicates that over the period of hydroclimatological record for northeast Kansas, both temperature and precipitation have trended above normal, especially over the last 50 years. To account for climate change, the projected meteorological conditions in the region considers the past temperature and precipitation records, as well as the modeled future conditions in the area through 2070. According to the NESDIS report, a warming trend of about 3-5°F and a precipitation trend toward slightly wetter conditions can be expected over the next 50 years, although these estimates have significant uncertainty.
c. Phase II: Projected Changes to Watershed Hydrology and Assessment of Vulnerability
to Climate Change.
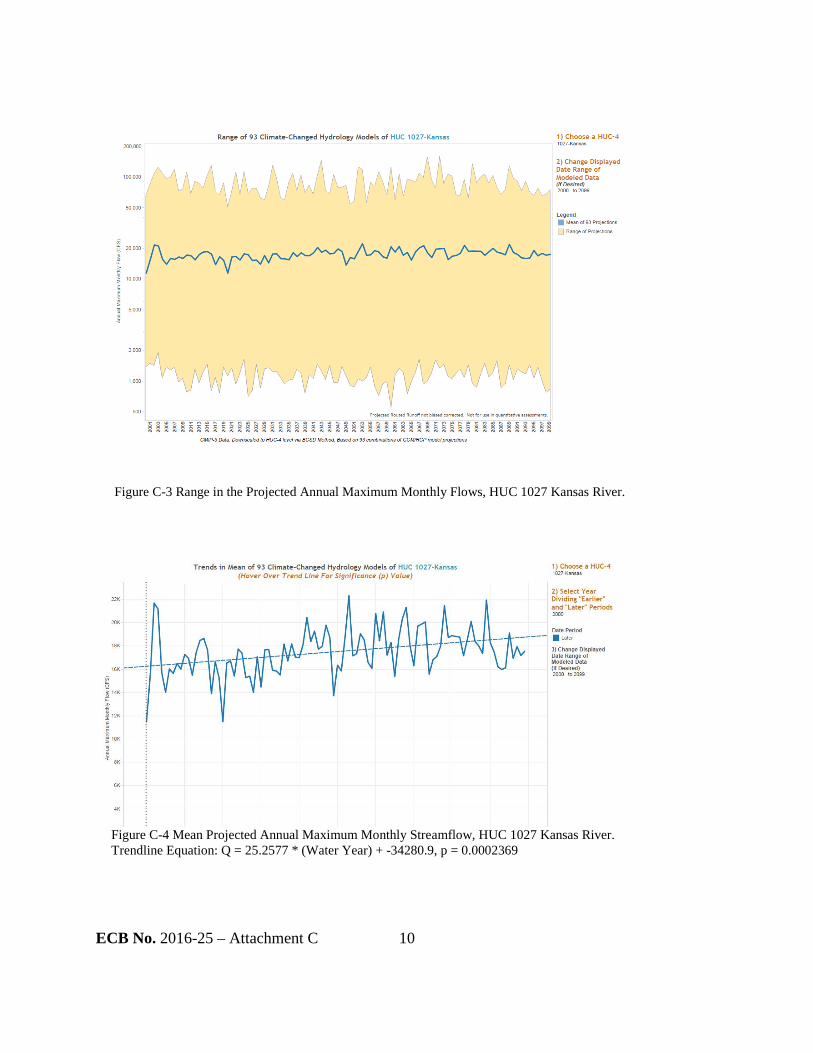
(1) The USACE Climate Hydrology Assessment Tool was used to examine observed and projected trends in watershed hydrology to support the qualitative assessment. As expected for this type of qualitative analysis, there is considerable but consistent
ECB No. 2016-25 – Attachment C 7
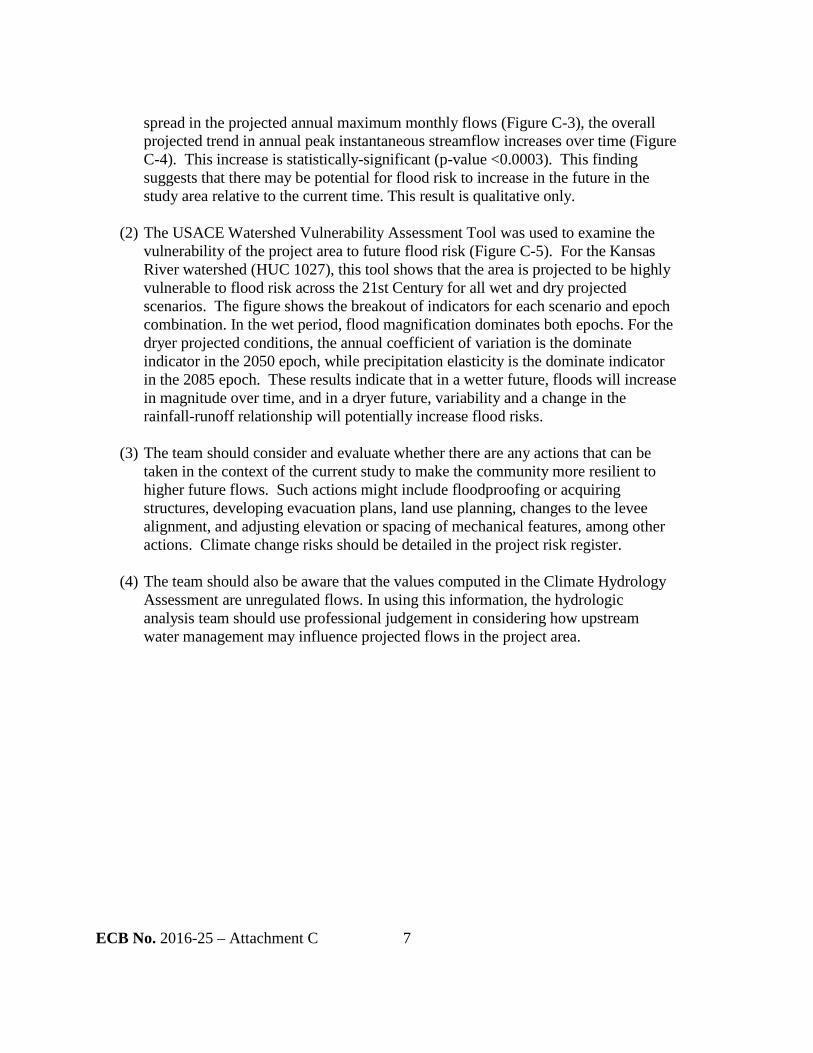
spread in the projected annual maximum monthly flows (Figure C-3), the overall projected trend in annual peak instantaneous streamflow increases over time (Figure C-4). This increase is statistically-significant (p-value <0.0003). This finding suggests that there may be potential for flood risk to increase in the future in the study area relative to the current time. This result is qualitative only.
(2) The USACE Watershed Vulnerability Assessment Tool was used to examine the
vulnerability of the project area to future flood risk (Figure C-5). For the Kansas River watershed (HUC 1027), this tool shows that the area is projected to be highly vulnerable to flood risk across the 21st Century for all wet and dry projected scenarios. The figure shows the breakout of indicators for each scenario and epoch combination. In the wet period, flood magnification dominates both epochs. For the dryer projected conditions, the annual coefficient of variation is the dominate indicator in the 2050 epoch, while precipitation elasticity is the dominate indicator in the 2085 epoch. These results indicate that in a wetter future, floods will increase in magnitude over time, and in a dryer future, variability and a change in the rainfall-runoff relationship will potentially increase flood risks.
(3) The team should consider and evaluate whether there are any actions that can be
taken in the context of the current study to make the community more resilient to higher future flows. Such actions might include floodproofing or acquiring structures, developing evacuation plans, land use planning, changes to the levee alignment, and adjusting elevation or spacing of mechanical features, among other actions. Climate change risks should be detailed in the project risk register.
(4) The team should also be aware that the values computed in the Climate Hydrology
Assessment are unregulated flows. In using this information, the hydrologic analysis team should use professional judgement in considering how upstream water management may influence projected flows in the project area.

ECB No. 2016-25 – Attachment C 8
Figure C-1 Annual Peak Instantaneous Streamflow, Kansas River Near Belvue, Kansas. Trendline Equation: Q = -586.07 * (Water Year) + 1.2103e+06, p = 0.325531.

ECB No. 2016-25 – Attachment C 9
Figure C-2 Nonstationarity Analysis of Maximum Annual Flow, Kansas River near Belvue, Kansas.
ECB No. 2016-25 – Attachment C 10
Figure C-3 Range in the Projected Annual Maximum Monthly Flows, HUC 1027 Kansas River.
Figure C-4 Mean Projected Annual Maximum Monthly Streamflow, HUC 1027 Kansas River. Trendline Equation: Q = 25.2577 * (Water Year) + -34280.9, p = 0.0002369

ECB No. 2016-25 – Attachment C 11
6. Example Qualitative Analysis: Operational assessment in Ohio. USACE projects, programs, missions, and operations have generally proven to be robust enough to accommodate the range of natural climate variability over their operating life spans. However, recent scientific evidence shows that in some places and for some impacts relevant to USACE operations, climate change is shifting the climatological baseline about which that natural climate variability occurs, and may be changing the range of that variability as well. This is relevant to USACE because the assumptions of stationary climatic baselines and a fixed range of natural variability as captured in the historic hydrologic record may no longer be appropriate for long-term projections of the climatologic parameters, which are important in hydrologic assessments for water control operations in watersheds, such as the Green River Basin, which serves as an example here.
a. Phase I: Relevant Current Climate and Climate Change. (1) Literature Review. A January 2015 report conducted by the USACE Institute for
Water Resources (USACE 2015b) summarizes the available literature for the Ohio Region, which includes the Green River Basin. The report focuses on both observed climatic trends, as well as projected future findings. While the observed trends may prove to be of some importance, it is the projected findings which are of
Figure C-5 Projected Vulnerability for the Kansas River (HUC 1027) with Respect to Flood Risk.

ECB No. 2016-25 – Attachment C 12
the most significance. The report finds a strong consensus supporting trends of increasing air temperatures. Average minimum temperatures are expected to experience a small increase, while temperature maximums are predicted to undergo a large increase. Projected increases of mean annual air temperature range from 0 to 8ºC by the latter half of the 21st century. Projections regarding precipitation and hydrologic streamflow trends are less certain, with some studies calling for increases whereas others call for decreases.
(2) Historic hydrologic trends were analyzed using the USACE Climate Hydrology
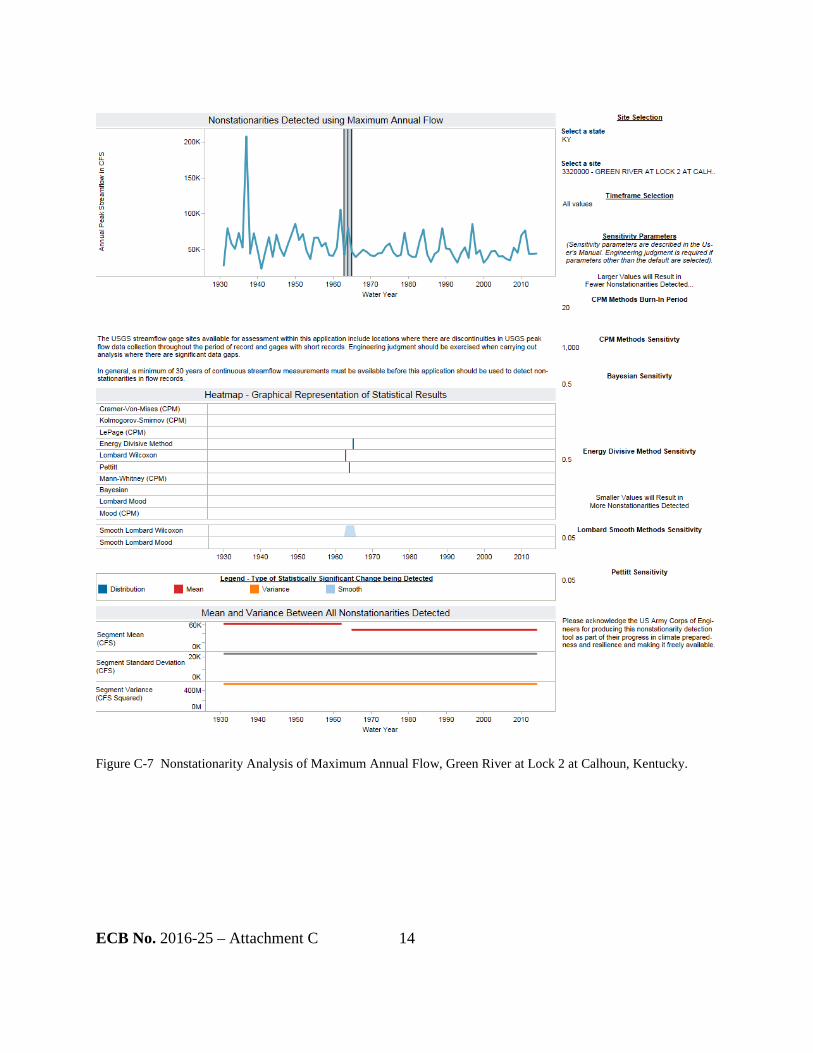
Assessment Tool and the Nonstationarity Detection Tool. For this example, these analyses were conducted using data from the Green River at Lock 2 at Calhoun, Kentucky (0332000) gage located within the Green River Basin. Using the Climate Hydrology Assessment Tool, a linear regression of the annual maximum daily discharge (Figure C-6). Note that in Figure C-6, p-value is equal to 0.999, which indicates that the trend is not statistically significant slope and no changes in mean annual peak flows are evident for the historic period. The Nonstationarity Tool correctly identified changes to stream flows due to construction of four upstream dams between 1959 and 1969 (Figure C-7). Changes to the mean, variance and trend (not shown) were all detected. For comparison purposes, the period of record was limited to 1970 – 2014 in an effort to avoid the statistical changes imposed on the stream by the construction of the four dams. An evaluation of the nonstationarity of unregulated flow could be conducted for a more rigorous study. However, that level of effort is not required under this ECB.
b. Phase II: Projected Changes to Watershed Hydrology and Assessment of Vulnerability to
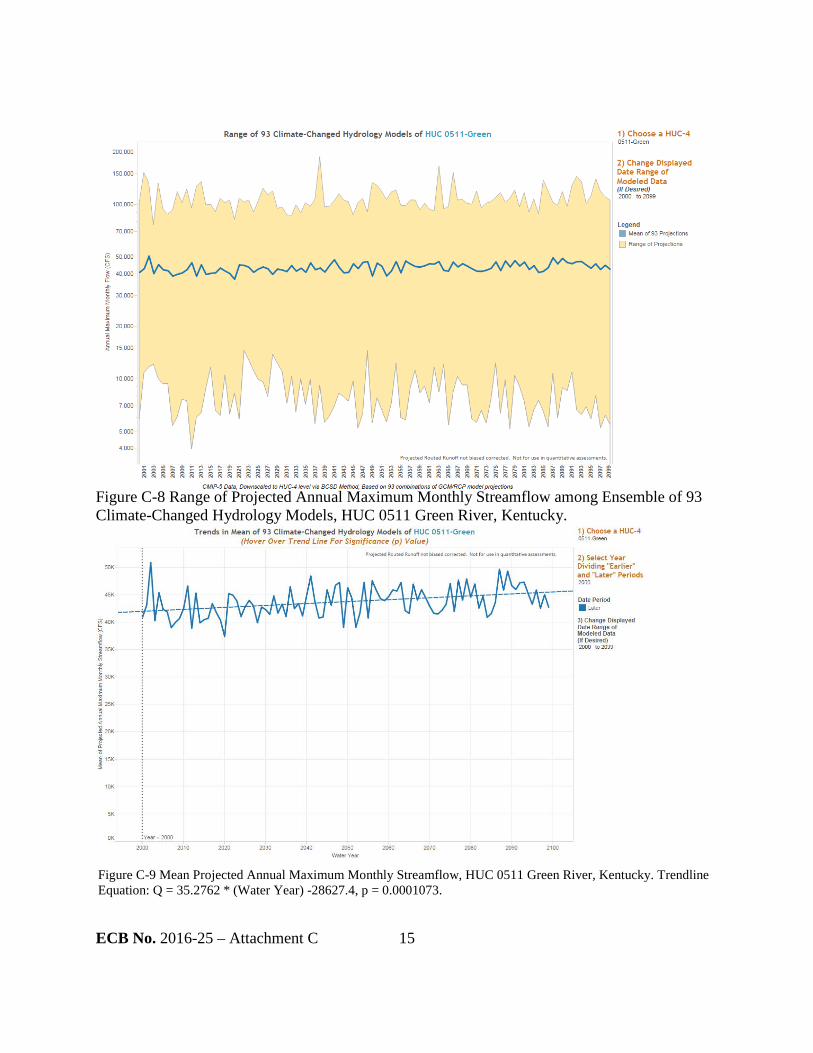
Climate Change. The USACE Climate Hydrology Assessment Tool was used to investigate potential future changes to flood flows in the region. Figure C-8 displays the range of the forecast annual peak instantaneous monthly streamflows computed by 93 different hydrologic climate models for a period of 2000 – 2099. These forecast flows display trends consistent with that of observed data as well as available literature. Looking closer at the trend of mean projected annual maximum monthly streamflows, a statistically-significant, positive trend is observed (Figure C-9). The USACE Watershed Climate Vulnerability Assessment Tool (Error! Reference source not found.) shows that flood risk vulnerability is not significant in the region in the future.
(1) Conclusions. Overall, no strong signal exists within the qualitative analysis in this example to indicate what definitive impacts climate change will hold for the project hydrology. While the literature indicates a slight increase in observed precipitation, there seems to be no substantial increase in observed streamflow. The literature is also conflicted as to projected streamflow, indicating flow magnitude and occurrence do not exhibit any apparent trends. The strongest consensus amongst the literature supports the trend of increasing temperatures.

ECB No. 2016-25 – Attachment C 13
(2) Based on this assessment, which shows no significant signals, the recommendation is to treat the potential effects of climate change as occurring within the uncertainty range calculated for the current hydrologic analysis. There may be other indicators of climate change, such as changes in biotic communities, but this analysis is focused on changes in climate hydrology. Methods of translating climate change impact uncertainty for an engineering-based analysis do not currently exist. In this example addressing potential operational changes, no compelling evidence exists to alter the operation of the project to incorporate climate change.
Figure C-6: Annual Peak Instantaneous Streamflow, Green River at Lock 2 at Calhoun, Kentucky. Trendline Equation: Q = -0.158103 * (Water Year) + 49070.5, p = 0.999178.
ECB No. 2016-25 – Attachment C 14
Figure C-7 Nonstationarity Analysis of Maximum Annual Flow, Green River at Lock 2 at Calhoun, Kentucky.
ECB No. 2016-25 – Attachment C 15
Figure C-8 Range of Projected Annual Maximum Monthly Streamflow among Ensemble of 93 Climate-Changed Hydrology Models, HUC 0511 Green River, Kentucky.
Figure C-9 Mean Projected Annual Maximum Monthly Streamflow, HUC 0511 Green River, Kentucky. Trendline Equation: Q = 35.2762 * (Water Year) -28627.4, p = 0.0001073.

ECB No. 2016-25 – Attachment C 16
Figure C-10 USACE Watershed Climate Vulnerability Assessment for the Project Area.
7. Qualitative Analysis Example For Ungaged Site: Small Flood Risk Management project in Southern New Mexico.
a. Introduction. This example addresses a project that seeks to provide flood risk reduction to a small rural community near the Rio Grande, and north of Las Cruces, New Mexico. The town sits at the mouth of an ephemeral arroyo with a relatively low-elevation watershed of approximately 8 mi2. As is common in the region, the example location is surrounded on all downstream sides by elevated irrigation channels with significant economic importance to southern New Mexico. Therefore, the town site is effectively a bowl that receives inflow from the arroyo when it rains, and holds that water until infiltration and evaporation combine to remove the flood waters. Flooding continued to occur even after a dam was constructed to impound water from the upper 2/3 of the watershed. Although the community sits within the floodplain of the Rio Grande, flood risk from this source is negligible due to proximity to upstream dams and an existing system of levees. There are no stream gages in the watershed.
b. Phase I Relevant Current Climate and Climate Change.
(1) The ephemeral arroyo responsible for flooding in the example study area is ungauged. Flows at the closest gage on the mainstem Rio Grande are heavily

ECB No. 2016-25 – Attachment C 17
regulated and do not reflect natural flow regimes in the area, reflecting instead water exchange between Elephant Butte and Caballo Reservoirs for irrigation and other purposes. Because the example location is assumed to be ungaged, no analysis of current trends is conducted using the USACE Climate Hydrology Assessment Tool or the USACE Nonstationarity Detection Tool.
(2) Southern NM has a warm semi-arid to arid climate. Precipitation in the study area
peaks in July and August in concert with the peak of the monsoon season. Monsoon precipitation comes in the form of convective storms with relatively localized precipitation. Average snowfall peaks at approximately 1 inch each for December and January, while the record snowfall was 10 inches of snow in January 1973 (Western Regional Climate Center, 2014b). Average monthly precipitation has shown no trend in the record since 1900. During the period 1981-2010, statistically-significant decreasing precipitation trends were observed for the example location in some months.
(3) Temperature, both average monthly daytime highs (Tmax) and nighttime lows
(Tmin) have increased since 1900. Increases in Tmax have been significant year-round ranging from 0.10 to 0.29°F/decade in all seasons.
c. Phase II Projected Changes to Watershed Hydrology and Assessment of Vulnerability to
Climate Change.
(1) The USACE Climate Hydrology Assessment Tool for Hydrologic Unit Code (HUC) 1303, Rio Grande-Mimbres Basin, indicates a gradual, but statistically significant upward trend in the mean maximum annual monthly flow, concurrent with a broadening of the range of peak flow variability by century's end (Figure C-11). The increase in the range, especially at the lower end, suggest lower minimum flows, which is consistent with some of the literature referenced. The increase in the mean of the modeled maximum annual monthly flows by the end of the century is approximately 100 cfs, which is about a quarter of the inter-annual variation around the mean of approximately 400 cfs.
(2) HUC 1303 is not among the 20% of HUCs at greatest future flood risk under either
dry or wet climate scenarios according to the USACE Watershed Vulnerability Assessment Tool (Figure C-12). Figure C-12 does indicate that Flood Magnification, both local and cumulative, is anticipated dominate drivers to future climate change.
(3) Temperature. There are no temperature projections specific to the study area.
Surface temperatures in the Southwest are projected to warm substantially over the 21st Century (highly likely), and warming is likely to be higher in summer and fall than in winter and spring (Cayan et al., 2013).

ECB No. 2016-25 – Attachment C 18
(4) Precipitation. Despite recent drought years, no trends have been observed in annual
water year precipitation from 1895/96 through 2010/11 for the six-state Southwest (NOAA, 2013) that includes Colorado and New Mexico, nor in West Texas (Gutzler 2013). In addition, there has been no overall trend in the frequency of extreme precipitation events across the Southwest (NOAA, 2011).
(a) Most climate models project that the Southwest will become drier. Modelers are
highly confident in this result (Melillo et al., 2014). Drying will be driven in large part by increased evaporation due to warmer temperatures, and by changes in precipitation due to changes in global scale atmospheric circulation, such as poleward expansion of the subtropical dry zone (Lu et al., 2007).
(b) Model simulations used in the most recent National Climate Assessment show changes
in precipitation that range from -13% to +10% across all model runs (Cayan et al., 2013). A 10 to 20% decline in precipitation by 2080-2090 primarily in the winter and spring, may result from a poleward shift of midlatitude winter storm tracks (Melillo et al., 2014).
(c) Precipitation may become concentrated in a smaller number of larger-magnitude
precipitation events, continuing the existing trend of increasing frequency and intensity of heavy downpours in the U.S.: in the Southwest from 1958 to 2011, there was a 12% increase in the amount of rainfall falling in very heavy precipitation events (Melillo et al., 2014). Climate models project that the share of precipitation falling in heavy rainfall events will continue to increase. Concomitant increases in drought and large storms are anticipated over time (Gutzler, 2013). Precipitation extremes are expected to become more frequent and intense even if net precipitation stays the same or decreases (Gershunov et al., 2013).
(5) Conclusion. Climate change impacts to flood risk in the example study area are
equivocal with respect to future flood risk. While there is a reasonable chance that some storm events may occasionally deliver large quantities of precipitation to the watershed, the likelihood and magnitude of this change cannot be assessed with the current information. What the literature suggests is that there can be prolonged hot and dry periods with storms that may become more intense in the future. This is also suggested by the dominant indicator in Figure C-12 (Flood Magnification).

ECB No. 2016-25 – Attachment C 19
Figure C-11 Projected Annual Maximum Monthly Flows, HUC 1303 Rio Grande-Mimbres Basin

ECB No. 2016-25 – Attachment C 20
Figure C-12 Watershed Vulnerability Assessment with Respect to Flood Risk for HUC 1303 Rio Grande-Mimbres Basin

ECB No. 2016-25 – Attachment D 1
ATTACHMENT D: Preview of Quantitative Analysis Requirements. 1. Quantitative Climate Change Analysis for Hydrologic Analyses in Planning and Engineering Design Studies. Quantitative assessments can directly alter the numerical calculations and results in the hydrologic analysis and thus are necessarily project-specific. These changes to numerical results can alter calculations of project benefits and costs, thus directly informing the decision process. A quantitative assessment will be described in future additions to this guidance along with new information for considering those climate-related uncertainties in the context of other uncertainties associated with the hydrologic estimates under future conditions.
a. Specific guidance for implementing quantitative analyses will be provided as suitable
climate hydrology information and methods are developed.
(1) Studies involving the Probable Maximum Flood (PMF) determination. At the time of the issuance of this ECB, there is no compelling evidence that would support climate-related changes in PMFs. Only after a substantial body of research has been amassed to facilitate a quantitative understanding of the relationship between climate change and the magnitudes of extreme storms, can USACE begin to develop the tools necessary to facilitate a quantitative assessment of how to incorporate climate change impacts into applied hydrologic analyses supporting PMF magnitudes and/or the uncertainties associated with them.
(2) Exemptions may be considered on a case-by-case basis.
b. The three primary components of any future quantitative guidance will be detection of
trends, attribution of these trends to climate change, and projection of future trends.
(1) Detection. The first step in a quantitative analysis is to attempt to detect changes in
the observed hydrologic record for the metric relevant to the study, such as increases or decreases in variability or magnitude. If no change is detected, no further quantitative analysis of historic time series will be necessary. The USACE Nonstationarity Detection Tool uses a wide range of statistical techniques to identify changes in the mean, variance, and trend of hydrologic time series data, but is not designed to attribute a cause to detected nonstationarities. USACE is developing information and inputs to forthcoming guidance which will supplement this qualitative guidance when it becomes available. This information will be distributed together with the future guidance requirements as described above.
(2) Attribution. If a change is detected through statistical analysis, the next step is to
attempt to attribute the change to one or more causes, primarily by evaluating additional information about changes in the watershed, searching the supporting literature, and in some cases using results from experiments with numerical climate
ECB No. 2016-25 – Attachment D 2
simulation models already performed – no new numerical climate simulations will be required. Professional judgment is needed to identify the cause(s) for each nonstationarity detected, and to determine whether and how to correct the data to create a homogeneous time series for subsequent analysis. Hegerl and Zwiers (2011) provide a review of possible attribution strategies and discuss the difficulties in attributing changes using only observational data. USACE is developing information to support the use of climate attribution in the quantitative analyses to be required in future. This information will be distributed together with the future guidance requirements as described above.
(3) Projection. Finally, projected hydrologic changes can be analyzed using
climatological and hydrological model data sets, such as those available at http://gdo-dcp.ucllnl.org/downscaled_cmip_projections/. This information can be used in concert with hydrologic, hydraulic, or reservoir simulation tools to produce a range of possible watershed responses. Until future guidance is released in the use of projections, the following points are made for consideration:
(a) It is USACE policy to use the hydrologic projections from the full ensemble CMIP5
model outputs to capture the range of potential future hydrologic conditions within a basin, as at this time there is no justification for selecting only a subset of models.
(b) Projected national climatological and hydrological data sets do not include flow
regulation, which can have a significant effect on watershed response to climate change. The results of unregulated flow models can provide a comparison to the unregulated projections. Or, regulation may be incorporated by routing unregulated flows through a reservoir simulation model, such as HEC-ResSim or more simplified methods within the hydrologic model, HEC-HMS. This application of the climatological and hydrological data sets inherit the following observations.
(c) National climatological and hydrological data sets often require bias correction to
account for systematic model errors due to inherently imperfect conceptualization for nation-wide models and spatial averaging from relatively coarse grids used to apply the global climate projection inputs.
(d) Study teams must investigate the limitations of the models being used in a study along
with the magnitude of the bias corrections and the reasonableness of the model outputs for their particular region in the United States.
(e) At the time of issuance of this ECB, climate hydrology projections are not available for
Hawaii and the Pacific Islands, the Caribbean and Alaska, but are being developed with an anticipated release in 2017 or 2018.

ECB No. 2016-25 – Attachment D 3
(f) USACE is developing information to support the use of projected climate hydrology in the quantitative analyses to be required in future. This information will be distributed together with the future guidance requirements as described above.