Embed Size (px)
Citation preview

Engineering 8700 – Civil Project Design of Traverse Brook Bridge
Final Report
Northeast Consultants
Rana Patey
Brett Evans
Mark Harvey
Gary Caul
Date: April 3, 2013
Location: St. John’s, NL
Prepared for:
Mr. Lloyd Osmond, P. Eng Department of Transportation and Works Dr. Steve Bruneau, P. Eng Memorial University of Newfoundland Dr. Amgad Hussein, P. Eng Memorial University of Newfoundland Mr. Justin Skinner, P. Eng Memorial University of Newfoundland

Northeast Consultants Memorial University
EN 2050 P.O. Box 4200 St. John’s, NL
A1B 3X5 L. Osmond, P. Eng Dept of Transportation and Works Confederation Building PO Box 8700 A1B 4J6 April 4, 2013 Subject: Traverse Brook Bridge Replacement Dear Mr. Osmond,
The attached Final Report provides an overview of Northeast Consultants’ procedure for the engineering design and analysis of the of the Traverse Brook Bridge replacement, as required for ENG 8700 – Civil Project.
The Final Report outlines in detail Northeast’s Project requirements, the Project deliverables, the design process for each component of the bridge, as well as our cost estimation strategy. The Appendices are included in a separate document.
Northeast encourages questions or comments regarding the Final Report and looks forward to discussing them with you.
Sincerely,
_______________
Rana Patey
Project Manager
Northeast Consultants
CC: Dr. S. Bruneau, P. Eng Dr. A. Hussein, P. Eng
Mr. J. Skinner, P. Eng
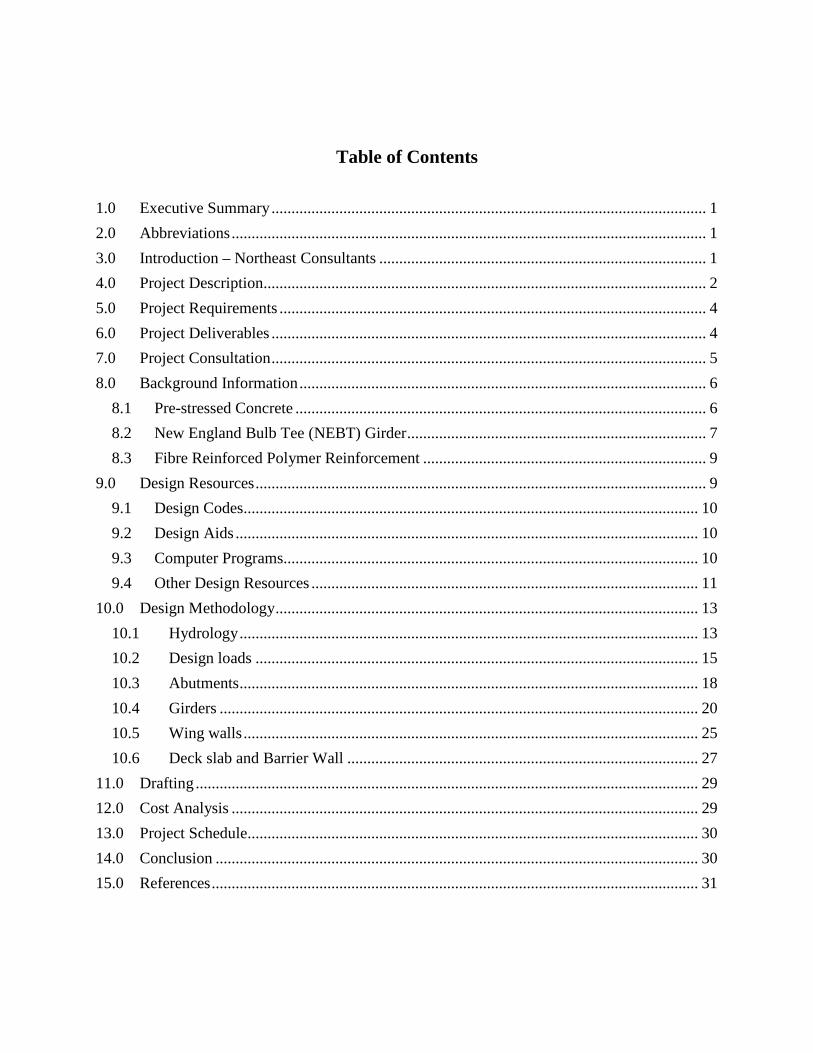
Table of Contents
1.0 Executive Summary ............................................................................................................. 1
2.0 Abbreviations ....................................................................................................................... 1
3.0 Introduction – Northeast Consultants .................................................................................. 1
4.0 Project Description............................................................................................................... 2
5.0 Project Requirements ........................................................................................................... 4
6.0 Project Deliverables ............................................................................................................. 4
7.0 Project Consultation ............................................................................................................. 5
8.0 Background Information ...................................................................................................... 6
8.1 Pre-stressed Concrete ....................................................................................................... 6
8.2 New England Bulb Tee (NEBT) Girder ........................................................................... 7
8.3 Fibre Reinforced Polymer Reinforcement ....................................................................... 9
9.0 Design Resources ................................................................................................................. 9
9.1 Design Codes.................................................................................................................. 10
9.2 Design Aids .................................................................................................................... 10
9.3 Computer Programs........................................................................................................ 10
9.4 Other Design Resources ................................................................................................. 11
10.0 Design Methodology .......................................................................................................... 13
10.1 Hydrology ................................................................................................................... 13
10.2 Design loads ............................................................................................................... 15
10.3 Abutments ................................................................................................................... 18
10.4 Girders ........................................................................................................................ 20
10.5 Wing walls .................................................................................................................. 25
10.6 Deck slab and Barrier Wall ........................................................................................ 27
11.0 Drafting .............................................................................................................................. 29
12.0 Cost Analysis ..................................................................................................................... 29
13.0 Project Schedule................................................................................................................. 30
14.0 Conclusion ......................................................................................................................... 30
15.0 References .......................................................................................................................... 31

1
ENG 8700 – Civil Design Project
Design of Traverse Brook Bridge
1.0 Executive Summary
Northeast Consultants has been selected by the Department of Transportation and Works to design a replacement for Traverse Brook Bridge using pre-stressed, pre-cast New England Bulb Tee girders. The purpose of this design is to assist with a cost comparison between this bridge design and the design already in use. Northeast has designed all components of the bridge.
2.0 Abbreviations
• kg – kilogram • kN – kilonewton • kN/m – kilonewtons per metre (linearly distributed load) • kPa – kilopascal = kN/m2 (area distributed load) • m – metre • FRP – Fibre reinforced polymer • GFRP – Glass fibre reinforced polymer • NEBT – New England Bulb Tee • ULS – Ultimate Limit State • SLS – Serviceability Limit State • DTW – Department of Transportation and Works
3.0 Introduction – Northeast Consultants
Northeast Consultants was formed in January 2013 in order to meet the course requirements of ENG 8700 – Civil Design Project, part of the Civil Engineering curriculum at Memorial University of Newfoundland. Northeast is made up of four members: Rana Patey, Brett Evans, Gary Caul, and Mark Harvey. Since 2011, these individuals have worked together on a variety of academic group work, including laboratory exercises, term projects, and presentations. Through their co-operative education at Memorial, Northeast’s members have a variety of work experience with employers such as H.J. O’Connell Ltd., Pennecon Ltd., Stantec Inc., Strescon, Ltd., Nalcor Energy, and the Government of Newfoundland and Labrador. Each member brings a different area of expertise to Northeast including, but not limited to project management, structural design, drafting, and report writing.

2
ENG 8700 – Civil Design Project
Design of Traverse Brook Bridge
4.0 Project Description
The Department of Transportation of Works (hereby known as DTW) is a branch of the Government of Newfoundland and Labrador, responsible for provincial transportation infrastructure and public works. The Highway Design and Construction Division (hereby known as the Highways Division) has responsibilities which include the design and construction of roadways, bridges, marine terminals, and airstrips.
Northeast Consultants was been selected to analyze and design a pre-stressed New England Bulb Tee girder bridge as a replacement bridge for Traverse Brook Bridge, on Route 320 (AKA J.R. Smallwood Blvd) between the towns of Gambo and Hare Bay. The Project includes the design of a two-lane road bridge with a simply supported, 36.5 metre span. Glass fibre reinforced polymer reinforcement will be used for the design of the concrete deck slab and barrier wall.
The purpose of the Project is to assist the Highways Division with a cost comparison of pre-stressed concrete girders versus traditional reinforced concrete girders. The existing bridge currently consists of six pre-stressed concrete girders, however Northeast's goal was to design a bridge which uses five New England Bulb Tee girders with a cost savings of approximately $50,000. This cost reduction on future, similar bridges will amount to funding for extra projects and/or emergency funds for DTW.

3
ENG 8700 – Civil Design Project
Design of Traverse Brook Bridge
Satellite Photo of Island of Newfoundland (location of Route 320 indicated in red) [2]

4
ENG 8700 – Civil Design Project
Design of Traverse Brook Bridge
Satellite Photo of Route 320 (Traverse Brook Bridge indicated in red) [2]
5.0 Project Requirements
Northeast Consultants has worked under the guidance of the Highways Division to design a replacement for Traverse Brook Bridge. Northeast has determined the geometry of the structure and designed the bridge to meet all relevant codes and guidelines, as outlined in the Methodology section of this report. Design of the roadway is not required. Northeast has designed the following components of the bridge, using reinforced concrete design for all components:
• Abutments
• Wing walls
• Pre-stressed girders
• Deck slab using fibre reinforced polymer (FRP) reinforcement
6.0 Project Deliverables
As stated in the Project Description, Northeast Consultants was required to prepare the following documentation, to be supplied to DTW:
• Detailed set of design drawings

5
ENG 8700 – Civil Design Project
Design of Traverse Brook Bridge
• Complete analysis and design calculations
• Cost estimate
• Final report containing:
o Design methodology
o Cost Estimation Strategy
7.0 Project Consultation
Project Meetings
Northeast regularly held group meetings which did not adhere to a regular schedule. Meetings usually took place on weekends. The frequency and length of these meetings was largely dependent on Northeast's workload and the proximity to Project milestones and deadlines. These meetings were usually held in the Civil Senior Design Laboratory at Memorial University.
Business Meetings
According to ENG 8700 schedule, one hour business meetings are held each Monday at 3:30 PM. During these meetings, all groups present a progress report. These meetings are chaired by Mr. Justin Skinner and are always held in the Civil Senior Design Laboratory.
Instructor Consultation
Each Thursday afternoon at 3:30 PM, informal meetings took place at in the Civil Senior Design Laboratory between Northeast and course instructors Mr. Justin Skinner and Dr. Amgad Hussein. During these meetings, the instructors provided design assistance as well as any other guidance that was required.
Client Meetings
Client meetings were held regularly on Wednesdays at 3:00 PM at the Confederation Building - West Block. During these meetings, Northeast presented work completed since the previous meeting, discussed upcoming work, received advice and guidance, and defined which specific tasks would be completed before the following meeting. Northeast prepared an agenda for each

6
ENG 8700 – Civil Design Project
Design of Traverse Brook Bridge
meeting and meeting minutes are distributed to DTW, Mr. Justin Skinner, and all members of Northeast Consultants.
8.0 Background Information
8.1 Pre-stressed Concrete
Traditional reinforced concrete features reinforcing steel which is not subject to stress until the member deflects. Pre-stressing applies stress to the steel prior to deflection, through post-tensioning or pre-tensioning. Post-tensioning is a process in which stress is applied to the reinforcing steel after the concrete has been placed, as opposed to pre-tensioning in which concrete is poured around steel strands which are already in tension.
The girders used in Northeast’s design of Traverse Brook Bridge are pre-tensioned, pre-cast girders which are fabricated by a manufacturer and shipped to site. These girders contain high-tensile steel strands, which are subject to tension by hydraulic jacks while the concrete is poured and throughout the curing process. Once the concrete has cured, the strands are cut. The strands remain in tension due to their bonding to the concrete.
Pre-stressing induces compression in concrete members, limiting cracking and helping to mitigate concrete’s natural weakness in tension. It can also result in lower construction costs, as less concrete can be used to create a member of similar strength to a traditionally reinforced member.

7
ENG 8700 – Civil Design Project
Design of Traverse Brook Bridge
Pre-stressing plant (Image Source: http://www.inmetkonstrukcje.pl/files/20.jpg)
8.2 New England Bulb Tee (NEBT) Girder
The New England Bulb Tee Girder section was developed by the Precast Concrete Institution (PCI) New England Technical Committee for Bridges in the mid 1990s. The PCI New England Technical Committed was established in 1978 to promote the use of precast concrete products. The committee was comprised of highway officials, pre-cast concrete producers, and consulting engineers from the six New England states (Vermont, Connecticut, Massachusetts, Maine, New Hampshire, and Rhode Island). The committee designed the NEBT section with the goal of creating an adaptable section that would be competitive with steel and capable of meeting constraints unique to New England, such as beam depth and limitation on shipping and erection. The NEBT girder replaced the American Association of State Highway and Transportation Officials (AASHTO) I-girder as the New England Standard. The large radius curves in the NEBT section are aesthetically appealing and discourage nesting birds [11].

8
ENG 8700 – Civil Design Project
Design of Traverse Brook Bridge
Fabrication of NEBT Girder (Image source: http://www.pci.org/view_file.cfm?file=JL-97-NOVEMBER-
DECEMBER-4.pdf)
NEBT girder (Image source: http://www.pci.org/view_file.cfm?file=JL-97-NOVEMBER-DECEMBER-4.pdf)
Construction of highway overpass using NEBT girders
(Image source: http://www.pci.org/view_file.cfm?file=JL-97-NOVEMBER-DECEMBER-4.pdf)

9
ENG 8700 – Civil Design Project
Design of Traverse Brook Bridge
8.3 Fibre Reinforced Polymer Reinforcement
Fibre reinforced polymer (FRP) is a material which is becoming increasingly popular in reinforced concrete design as an alternative to steel reinforcement. FRP is manufactured from high strength glass fibres and vinyl ester resin [8]. FRP reinforcement has the following advantages over steel reinforcement [9]:
• Durability • High strength-weight ratio • Fatigue resistance • Small creep deformation • Non-corrosiveness • Non-magnetic • Low thermal conductivity
FRP Reinforcement (Image source: http://www.pultrall.com/en/vrod.asp)
9.0 Design Resources
Northeast required many resources to complete the Project, including but not limited to computer programs, design handbooks and examples, relevant design codes, maps, and surveys.

10
ENG 8700 – Civil Design Project
Design of Traverse Brook Bridge
9.1 Design Codes
Canadian Highway Bridge Design Code, CSA S6-06
This design code (hereby known as the Bridge Code) is used for the design of all road bridges in Canada. This code was used for load calculations as well as design of all components of the bridge. A digital copy of this code was provided by Faculty of Engineering and Applied Science.
9.2 Design Aids
Handbook of Steel Drainage and Highway Construction Products
This handbook was used by Northeast to obtain value of constant “C” used in Rational Method formula. This resource was provided by Faculty of Engineering and Applied Science.
9.3 Computer Programs
S-FRAME
S-FRAME is a structural analysis program, used by Memorial University. Northeast used S-FRAME to calculate influence lines for the live loads applied to the bridge (truck load, lane load), to determine the location and magnitude of maximum moment and shear. This program was provided to Northeast by the Faculty of Engineering and Applied Science.
AutoCAD
AutoCAD is a computer assisted design program, used by Northeast for the preparation of all design drawings. These drawings are a required component of the Project deliverables, as well as used to perform quantity take off analysis. This software was provided to Northeast by the faculty of Engineering and Applied Science.
Google Sketchup
Google Sketchup was used to create mockups of the bridge components for the purpose of this report and the accompanying final presentation. This software is available online at no cost.

11
ENG 8700 – Civil Design Project
Design of Traverse Brook Bridge
Microsoft Office
Northeast utilized several of Microsoft’s programs in the creation of reports, presentations, spreadsheets, and other documents. This software was owned by members of Northeast prior to the commencement of the Proejct, as well as provided by the Faculty of Engineering and Applied Science.
• Word
Northeast used Microsoft Word for the preparation of our Statement of Qualifications, Project Plan, Final Report, weekly progress reports, as well as all meeting minutes and agendas.
• Excel
Microsoft Excel was used extensively by Northeast throughout the design process. Design spreadsheets were created for all stages of design, including the hydrology work, load determination, and design of the abutments, girders, wing walls, and deck slab. These spreadsheets can be found in Appendix A.
• Project
Northeast used Microsoft Project exclusively for scheduling. Project was used to create and regularly update Northeast’s Project Schedule, the final version of which can be found in Appendix C.
• Powerpoint
Microsoft Powerpoint was used to prepare the final presentation accompanying this report.
Mozilla Firefox
This internet browser was used to perform research on FRP design and pre-stressed concrete, as well as accessing all online resources listed above. This software is available online at no cost.
9.4 Other Design Resources
Initial Documentation
The following documentation was provided to Northeast upon commencement of the Project, at the first client meeting on January 17, 2013. These documents can be found in the Appendix E.

12
ENG 8700 – Civil Design Project
Design of Traverse Brook Bridge
• Survey
A survey of the riverbed and surrounding area was provided to Northeast at the commencement of the Project. This survey was required to determine the geometry of the structure, as the abutments were required to extend to the elevation of the riverbanks. The survey was also used to determine the elevation of the deck
• Geotechnical Report
Included in the initial documentation provided to Northeast by DTW was a geotechnical report, performed by DTW’s Materials Engineering Division. This report states the depth of bedrock on either side of Traverse Brook. These depths were used to determine abutment depths and therefore the geometry of the bridge, as well as bearing pressure limits on the soil.
• Map
Upon commencement of the Project, DTW provided Northeast with a topgraphical map of the region, which was used to delineate the watershed area for Traverse Brook.
Regional Flood Frequency Data and Spreadsheet
This was used to perform regional flood frequency analysis in order to determine design flow depth. Numerous variables particular to Traverse Brook were calculated by Northeast using the information provided in the Regional Flood Frequency Report. These variables were then entered into a spreadsheet, also provided, to determine the 100-year flow, used for calculation of design depth. This resource is available online at no cost. [7]
FRP Material Specifications
A data sheet from FRP reinforcement manufacturer Pulltrall Inc. was provided to Northeast by DTW. This data was required to complete design of the FRP reinforced deck slab. Information required was tensile strength and elastic modulus, as well as section properties of various FRP reinforcing bars. [8]
Hold-down Specifications
Specifications for hold-downs (anchors in pre-cast, pre-stressed beams, used to create strand inclination/harping) were obtained from the Dayton Superior website. Dayton is a supplier of pre-cast girders used by DTW on previous projects. [13]

13
ENG 8700 – Civil Design Project
Design of Traverse Brook Bridge
Preliminary Girder Design Table
OSCO Construction Group is a manufacturer and supplier of pre-cast, pre-stressed beams. From their website, Northeast obtained a preliminary design table, used to determine the girder depth and spacing. [12]
New England Bulb-Tee Dimensions
The dimensions and section properties of New England Bulb-Tee girders were obtained online from the OSCO Construction Group website. [12] This information is available online at no cost.
Tender Prices
DTW provided Northeast with tender prices from six previous projects. These unit prices were used in conjunction with the material quantities obtained from quantity take-off analysis to prepare the detailed cost analysis, one of the Project Deliverables.
10.0 Design Methodology
The following section outlines the design procedures employed by Northeast in the design of Traverse Brook Bridge. These procedures provide an overview of the design processes, but do not provide detailed calculations. Design spreadsheets and detailed design calculations can be found in Appendices A and B, respectively.
10.1 Hydrology
River Cross Sections
Using the survey provided by DTW, Northeast fitted trapezoids to three cross sections of the river, later used to determine water depth and bridge geometry based on the 100-year flow rate.
Delineation of Drainage Basin
Delineating a drainage basin is a method of determining the watershed area for a stream or river using a topographical map. Using the map provided by DTW and AutoCAD, Northeast

14
ENG 8700 – Civil Design Project
Design of Traverse Brook Bridge
delineated the drainage basin. The watershed area was also delineated by hand to simplify the process using AutoCAD. The watershed area determined by Northeast closely matched the area previously determined by DTW using AutoCAD.
Regional Flood Frequency Method
To perform regional flood frequency analysis on Traverse Brook, the following parameters were calculated [7]:
• Watershed area • Fraction of watershed occupied by forest • Fraction of watershed occupied by wetlands • Fraction of watershed occupied by lakes • Fraction of watershed occupied by barrens • Length of main river • Elevation difference • Slope of main channel method 1 • Slope of main channel method 2 • Shape factor • Fraction of watershed occupied by lakes and swamps (L+S) • Fraction of drainage area controlled by lakes and swamps (FACLS) • Lakes and swamps factor (LSF) • Lake attenuation factor (LAF) • Drainage density (DD)
These parameters were entered into the regional flood frequency analysis spreadsheet provided on the website of the Government of Newfoundland and Labrador’s Department of Environment and Conservation. This spreadsheet used these factors to determine the 100-year flow rate.
Rational Method
The rational method formula requires the calculation of the following variables to determine the 100-year flow depth (Q100) used for design:
• i = rainfall intensity • C = runoff coefficient • A = Drainage basin area • K = constant (always the same)
The drainage basin area was determined by delineating the watershed area. The values of C and K were determined using the Handbook of Steel Drainage and Highway Construction Products.

15
ENG 8700 – Civil Design Project
Design of Traverse Brook Bridge
The rainfall intensity, i, was determined using the Intensity Duration Frequency (IDF) Data for Gander [14], the nearest location to Traverse Brook for which data is available. To use this graph, time of concentration (Tc), was required. To determine Tc, the Bransby Williams equation (obtained from DTW) was used. Once these variables were determined, the design flow was calculated. All calculations can be found in Appendix A.
Design Flow Depth
Once, the 100-year flow depth was calculated using both the Rational Method and Regional Flood Frequency Analysis, the larger of the two calculated flow rates was selected for our design. In this case, the flow calculated using Regional Flood Frequency Analysis governed. To determine water depth associated with 100-year maximum flow (Q100), Northeast used the three aforementioned river cross sections. Manning’s formula was used for obtaining the depth associated with a trapezoid for a particular flow rate was found in the Handbook of Steel Drainage and Highway Construction Products. This formula was applied to the three cross sections using Microsoft Excel. Three flow depths were calculated; one for each cross-section. The largest value was selected as the design flow depth. A freeboard of one metre, specified by DTW, was added to determine the elevation of the bridge above the riverbed. The purpose of the freeboard is to ensure ice and debris does not damage the bridge structure.
10.2 Design loads
Dead Loads
The dead loads on the bridge were determined using the bridge dimensions provided by DTW, as well as material unit weights contained in Table 3 of the Bridge Code. The dead loads on the bridge consist of the self-weights of the bridge components, including the asphalt road surface, the concrete deck slab and barrier walls, the bridge girders, wing walls, and abutments. For the purpose of dead load calculations, the self-weight of the barrier walls was assumed to be evenly distributed over the bridge.
Live Loads
Two load cases were considered for the live load on the bridge: the CL-625 Truck Load and the CL-625 Lane Load.
16
ENG 8700 – Civil Design Project
Design of Traverse Brook Bridge
CL-625 Truck Load
The CL-625 Truck Load (Bridge Code Section 3.8.3.2), shown in the figure below, is an idealized five axle truck, with a weight of 625 kN. [3] Northeast Consultants used S-FRAME to determine the location and magnitude of the maximum moment and shear caused by this loading. A dynamic load allowance (Bridge Code Section 3.8.4.5) was also applied.
CL-625 Truck Load [3]
CL-625 Lane Load
The CL-625 Lane Load (Bridge Code Section 3.8.3.3) consists of 80% of the CL-625 truck load, plus a uniformly distributed load of 9 kN/m with a width of 3.0 m. S-FRAME was also used to determine the location and magnitude of maximum moment and shear.

17
ENG 8700 – Civil Design Project
Design of Traverse Brook Bridge
CL-W Lane Load [3]
Other Loads
Wind Load
The wind loads were calculated according to Section 3.10 of Bridge Code. These consisted of a horizontal drag load and a vertical load. Horizontal loading was ignored due to its negligible effect.
Earth Pressure
The earth pressure on the abutments and wing walls was calculated according to section 7.8.4.2 of Bridge Code. This pressure was determined using the unit weight and height of overfill soil over the top of the structure.
Surcharge Load
According to section 6.9.5 of the Bridge Code, the presence of an approach slab eliminates the need to consider a surcharge load in the design of Traverse Brook Bridge.

18
ENG 8700 – Civil Design Project
Design of Traverse Brook Bridge
Surcharge Compaction Load
The compaction surcharge load was calculated according to section 6.9.3 of the Bridge Code. This load is caused by the compaction of structural fill placed above the abutment. The load pattern is in the form of an inverse triangle.
Surcharge Compaction Load [3]
Braking Force
Vehicles apply a horizontal, longitudinal load to a bridge when they are braking. This load was calculated according to section 3.8.6 of the Bridge Code.
Earthquake Effects
The effects of earthquakes on the bridge structure were calculated as per Section 4.4 of Bridge Code.
10.3 Abutments
To begin abutment design, Northeast created a spreadsheet which examines sliding, overturning, and bearing pressure for each of the ULS load cases using Table 3.1 of the Bridge Code.

19
ENG 8700 – Civil Design Project
Design of Traverse Brook Bridge
Bearing pressure was the governing force; this pressure was used to determine the size of the footing. The length of the toe and heel of the footing were required, as the width of the footing was already specified by DTW to be 12 m (0.5 m wider than the bridge deck). The moment due to bearing pressure was then calculated. Factors of safety were checked for sliding and overturning to ensure failure did not occur due to either.
Initial dimensions (width and thickness) of the stem were already determined by DTW and provided to Northeast. The height of the stem was determined based on the bedrock depth given the geotechnical report, as well as the height of the bridge above the riverbed. The abutment on one side of Traverse Brook sits on bedrock; however on the other side the bedrock depth was too deep for practical considerations. On that side, the abutment sits on structural fill, with the bottom elevation one metre below the riverbed.
The moment of resistance (Mr) was calculated for the heel, toe, and stem. This was accomplished by dividing the footing into two cantilever portions and evaluating each separately.
The area of reinforcement required in the toe was calculated using the known values of the resistive moment, material resistance factors (specified in table 8.1 of Bridge Code), depth of reinforcement, and yield strength of steel. Once the area of reinforcement was calculated, the size, number, and spacing of bars were selected.
The required reinforcement in the heel was calculated using the same method used for the toe.
The required reinforcement in the stem was calculated using the same method as the toe and heel; however, the stem was divided into two sections. The lower section is thicker, and the upper section, above the bearing seat, is thinner.
Shear checks were performed for all sections. The factored shear in each section proved to be less than the shear resistance of concrete alone, therefore no shear reinforcement is required in any section of the abutment.
The minimum reinforcement Section (Bridge Code Section 8.8.4.3) was checked for each section of the abutment. This compared minimum reinforcement versus the reinforcement required for Mr. Minimum skin reinforcement was provided for the heel and toe.
The cracking moment (Mcr) was checked for all sections of the abutment, as per sections 8.8.4.4, and 8.4.1.8 of the Bridge Code. This moment was greater than the factored moment on the toe; therefore no cracks should occur. For the heel, the factored moment was greater than the cracking moments, but since more than two metres of fill above the heel, crack widths can be neglected. Crack widths did not need to be calculated for the stem due to its thickness.
Dowels were required to resist half of the factored horizontal force on the abutments. Section 8.16.7.3 of the Bridge code was used to determine the bearing resistance of concrete, using the material resistance factor of concrete, the compressive strength of concrete, and the cross-sectional area of the selected bar size. Section 8.16.6.4.2 was used to calculate the shear

20
ENG 8700 – Civil Design Project
Design of Traverse Brook Bridge
resistance of the dowel. These values were used to determine the number of dowels, spacing, and embedment depth into bedrock.
Mockup of abutment (Image source: Northeast Consultants)
10.4 Girders
Preliminary Design
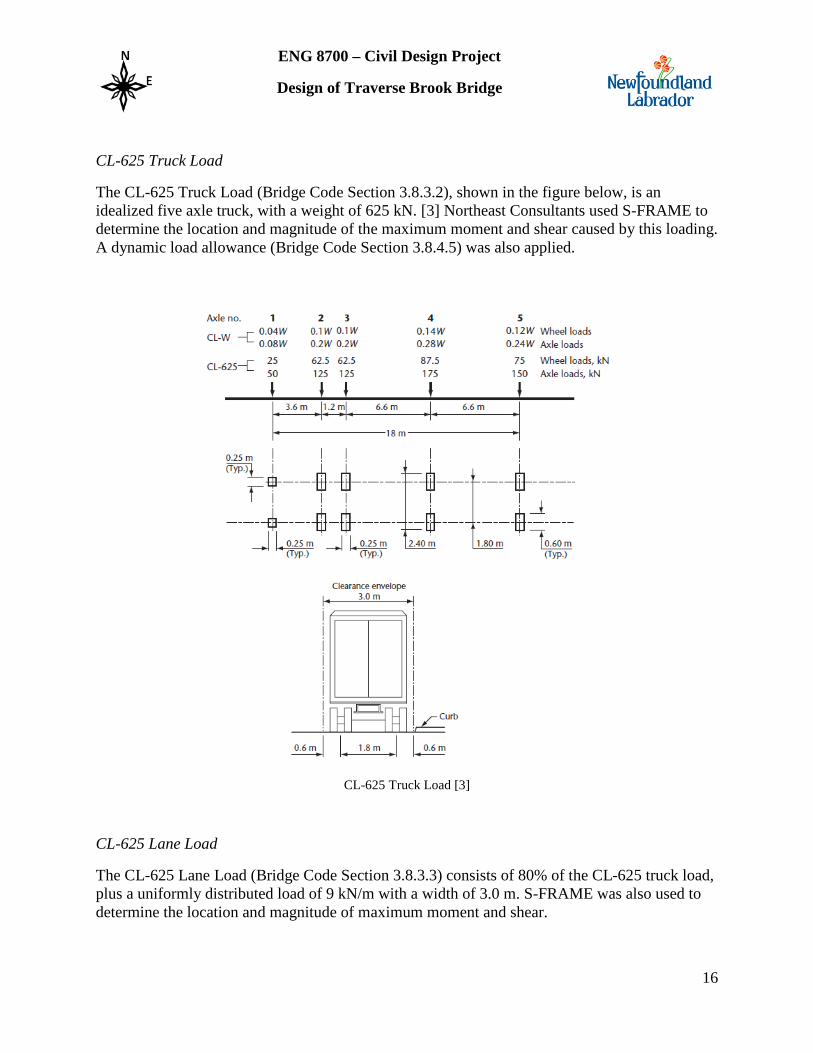
With the required span of 36.5 metres and bridge width of 11.5 metres already determined, an initial guess for the number of girders, girder size and spacing was obtained from the preliminary design chart (see figure 1). A line was drawn from a span of 36.5 metres over to the curve for the NEBT 1800. This gave a preliminary maximum design spacing of 2.5 metres. To space the girders evenly across the 11.5 metre width, a spacing of 2.3 metres was chosen with a 1.15 metre overhang on each side.
21
ENG 8700 – Civil Design Project
Design of Traverse Brook Bridge
Preliminary girder spacing design chart (Image source: http://www.oscoconstructiongroup.com/nebt.aspx)
The properties were determined for the girder, pre-stressing strands, reinforcing bars, concrete slab, bituminous wearing surface, jersey barrier, and , the overall composite section to facilitate further design calculations.
Flexural Design
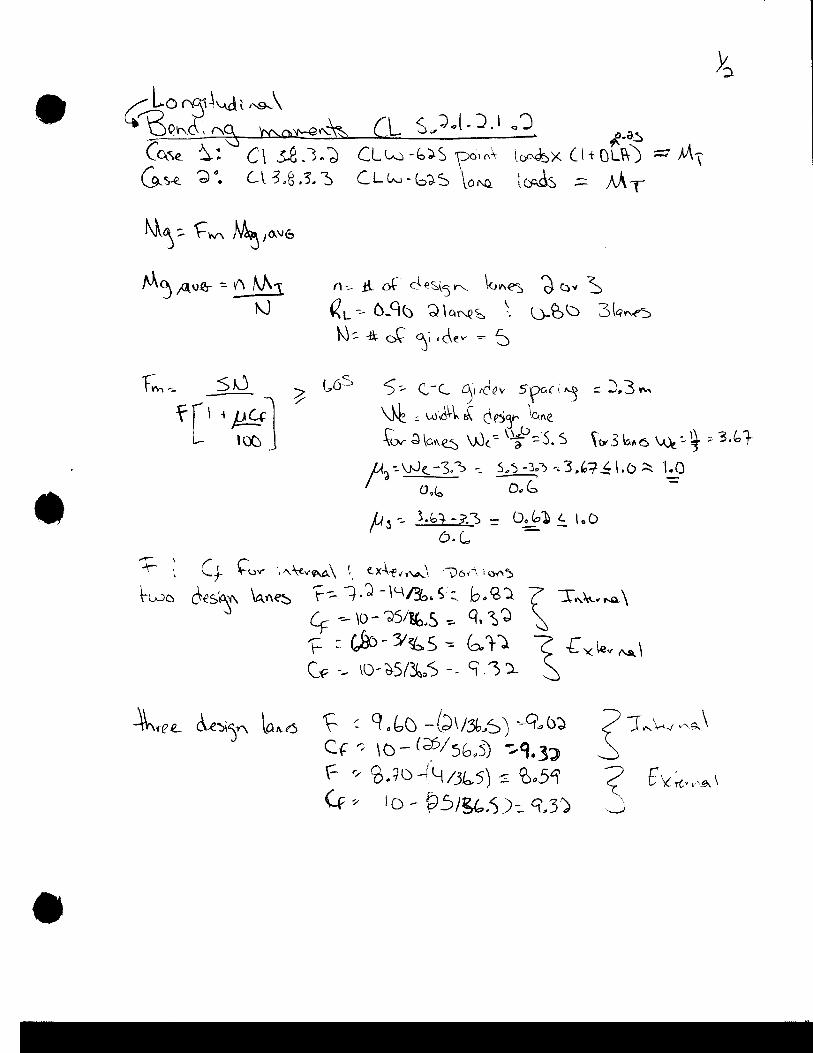
The un-factored dead and live loads were found. The dead loads were obtained based on tributary area and self-weight. The live loads were wind loads that were previously determined, truck load plus dynamic load allowance (DLA), and lane load. From the truck load plus DLA and lane load calculations only one of these methods are used for design based on the one that gives the highest moments and shears obtained from the S-Frame model. For this girder the truck load plus DLA governed, therefore the lane load calculations were not used in any part of the design. Truck and lane load calculations are based on Section 3.8.3.2 and 3.8.3.3. The longitudinal bending moment and shear is distributed to each girder based on Section 5.7.1.2 and 5.7.1.4.
An initial guess for the number of pre-stressing strands was based on serviceability limit state (SLS) design case number 1. The service load stresses on the bottom fiber at mid-span were found based on the girder self-weight and slab self-weight moments divided by the section modulus for the girder plus the moments for barrier self-weight, wearing surface and live load divided by the section modulus of the composite section. The numbers of strands to resist this maximum stress were used as the initial guess assuming a loss of 25 percent in pre-stress due to relaxation, elastic shortening, creep and shrinkage. The initial guess for this design was 50 strands. The 50 strands were placed in the bottom portion of the NEBT at mid-span with minimum spacing to keep the center of gravity of the strands as low as possible for maximum

22
ENG 8700 – Civil Design Project
Design of Traverse Brook Bridge
efficiency. The center strands are harped to rise to the top of the girder at the face to balance the decrease in stress from applied loads. An initial harp point of L/3 was chosen (see drawings)
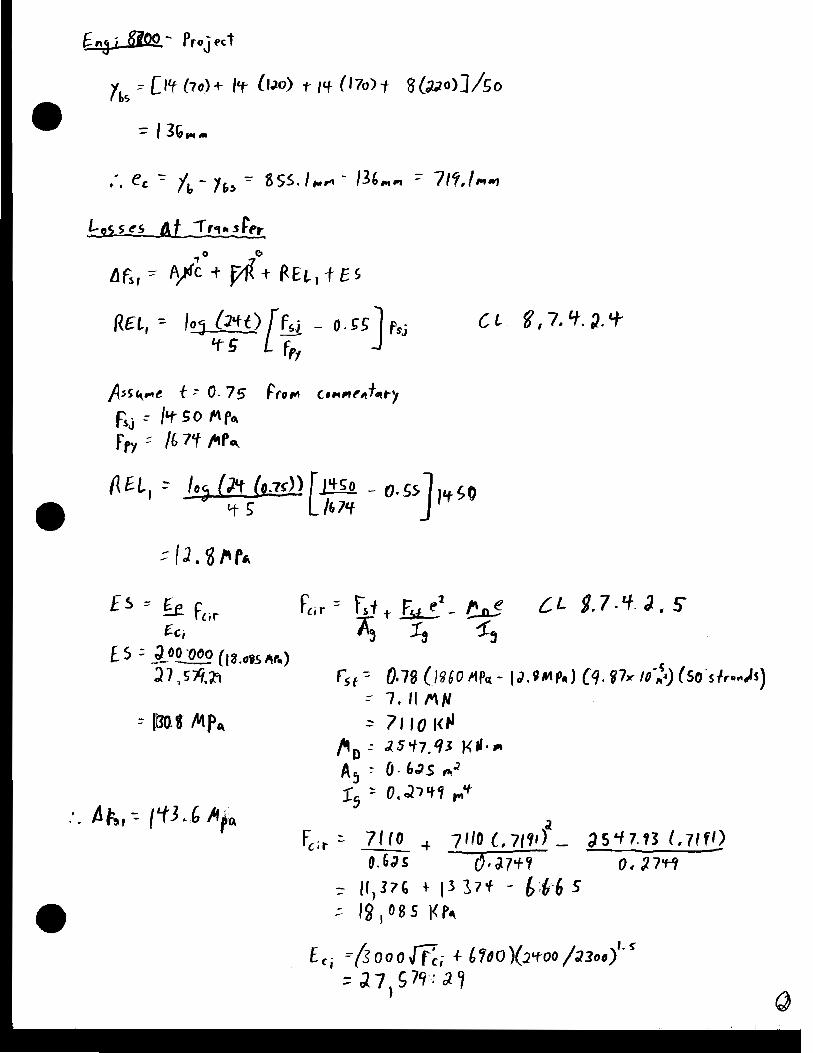
The strands are originally jacked up to a stress of 1450.8 mPa but there are naturally occurring losses. The pre-stressing losses were found at transfer and after transfer based on Section 8.7.4.2 and 8.7.4.3. The losses are as follows:
At Transfer
Relaxation of tendons:
Elastic Shortening:
After Transfer
Creep:
Shrinkage:
Relaxation of tendons:

23
ENG 8700 – Civil Design Project
Design of Traverse Brook Bridge
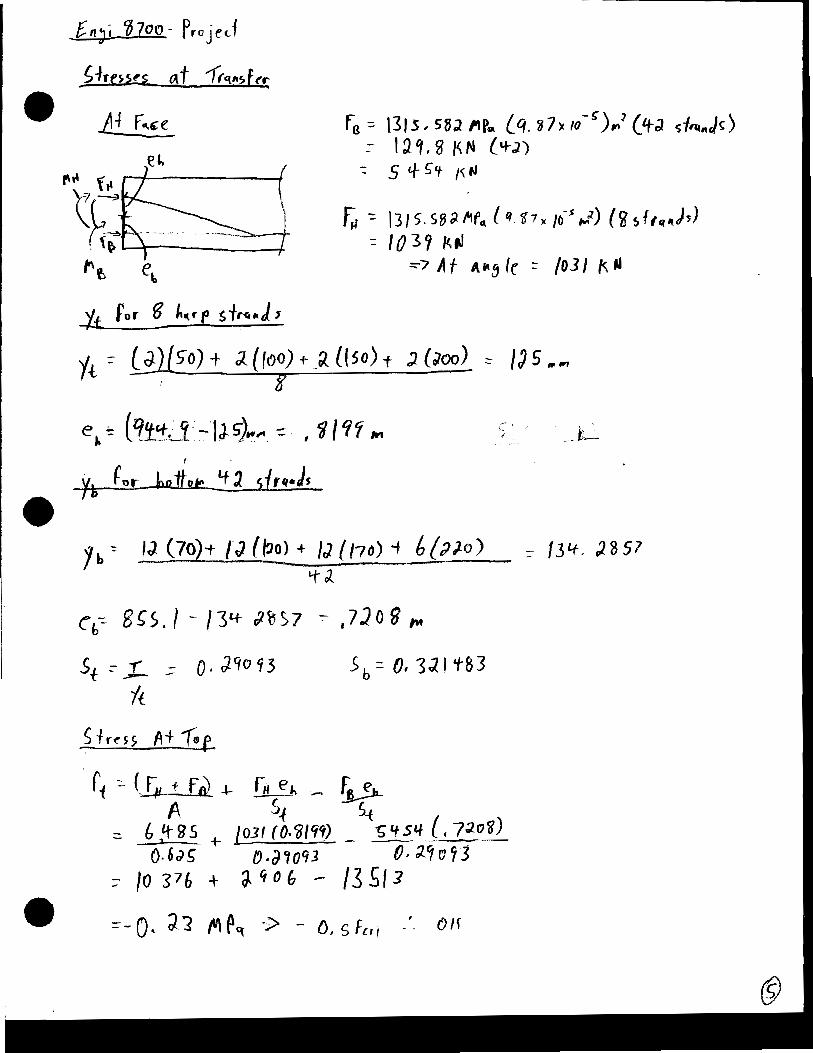
The stresses in the top and bottom fibers of the beam were found at ten points along the girder at transfer, after transfer with wet concrete slab, and after transfer on the composite section with all SLS design loads. The stresses imposed are based on horizontal forces of the strands over the area of girder and the moments induced around the neutral axis of the girder from the loads and pre-stress forces. The pre-stressed concrete stress limitations are outlined in Section 8.8.4.6 for at transfer and after transfer. The stresses were within the limitations; therefore the girder met the requirements of SLS design.
The flexural resistance was checked at ultimate limit states (ULS). After checking the applicable ULS combinations (combinations 1 to 4), it was found that ULS 1 governed for design. The ultimate applied moment was found at ten points on the girder and the ultimate resisting moment was calculated based on Section 8.8.4.2. The equation, fps = fpu (1 – kp c/dp ),was used to find resisting moment based on the method of finding an equivalent rectangular stress block and verifying that the composite section could be approximated as a rectangular section (c < thickness of deck). Resisting moment was found using the following equation:
The ultimate resisting moment was found to be less than one third greater than the ultimate bending moment and therefore as per Section 8.8.4.3 the cracking moment had to be checked. The resisting moment was found to be greater than 1.2 times the cracking moment so this Section was satisfied. The following equation is used to find cracking moment:
Shear Design
Shear design is based on the ULS load combination. Section 8.9.1.5 of the Bridge Code specifies the effective shear depth, dv. The critical section for shear is located at dv from the end of the girder as specified in Section 8.9.3.1. Therefore, the shear force from the applied loads is found at dv. The shear resistance is based on Section 8.9.3.2 to 8.9.3.5 where shear resistance is available from concrete, stirrups and pre-stressing tendons.
Before shear resistance can be determined, the factor to account for shear resistance of cracked concrete and the angle of potential cracks must be determined from Section 8.9.3.7. To find both of these parameters the longitudinal strain and crack spacing must be found. The longitudinal strain is found using Section 8.9.3.8 and the crack spacing is assumed to be 300 mm if Section 8.9.1.3 is satisfied for transverse shear reinforcement.
24
ENG 8700 – Civil Design Project
Design of Traverse Brook Bridge
The factor to account for the shear resistance of cracked concrete is used to determine the shear resistance of the concrete. The angle of the cracks is used in the expression for shear resistance of the stirrups to carry stress across the inclined crack. The shear resistance provided by the pre-stressing strands is simply the vertical component of the force in the harped strands (Therefore no resistance from horizontal strands at the center).
The shear resistance from the concrete and the pre-stressing strands is a set value and the shear resistance provided by the stirrups is adjusted based on spacing so that the total resistance is above the applied shear. The spacing should also be less than or equal to the requirement of Section 8.14.6.
For a distance of .25h and h from the end of the girder there are requirements for spacing to resist the hoop stress of bundled pre-stressing strands specified in Section 8.16.3.2.
For the remainder of the stirrups, the maximum required spacing is 600 mm according to Section 8.14.6. However, to ensure there is no sudden decrease in shear resistance a spacing of 300 mm is provided for 3 metres and then the spacing after that is 600 mm.
The interface shear transfer between the slab and the girder was checked to ensure the number of stirrups were adequate. The shear resistance is defined in Section 8.9.5 and the applied shear is calculated based on shear flow.
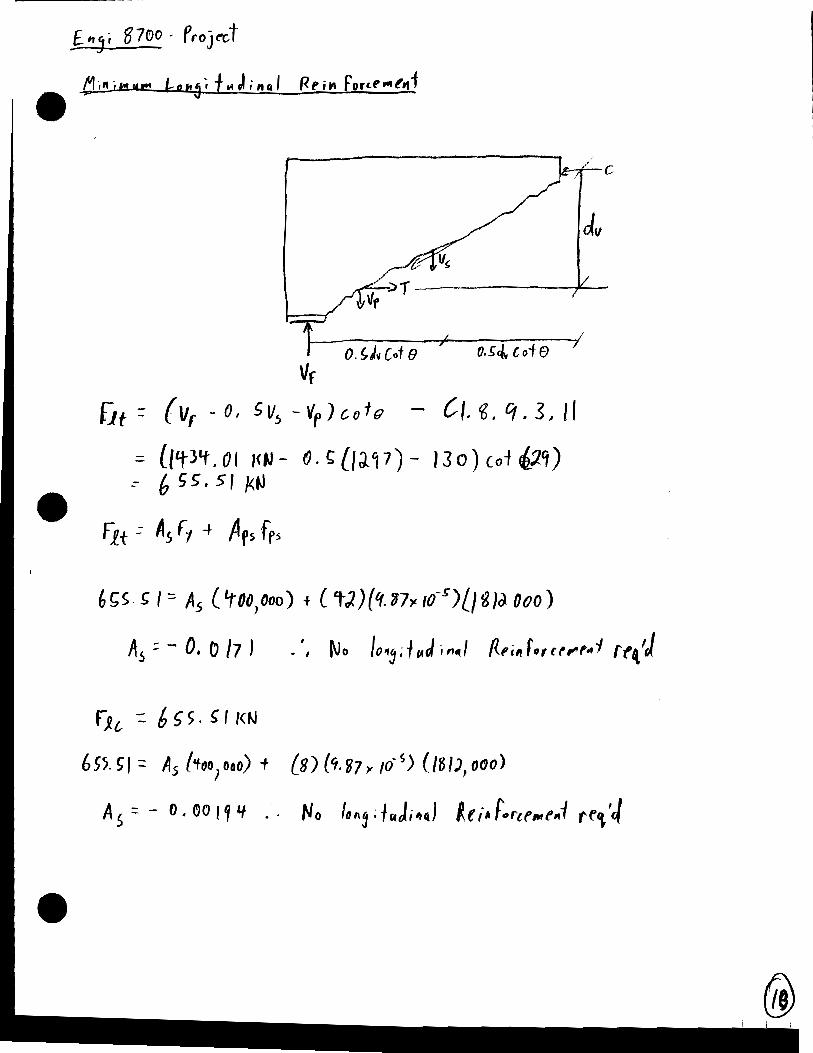
The minimum longitudinal reinforcement was calculated based on Section 8.9.3.11. A negative area of reinforcement is required and no longitudinal reinforcement is needed.
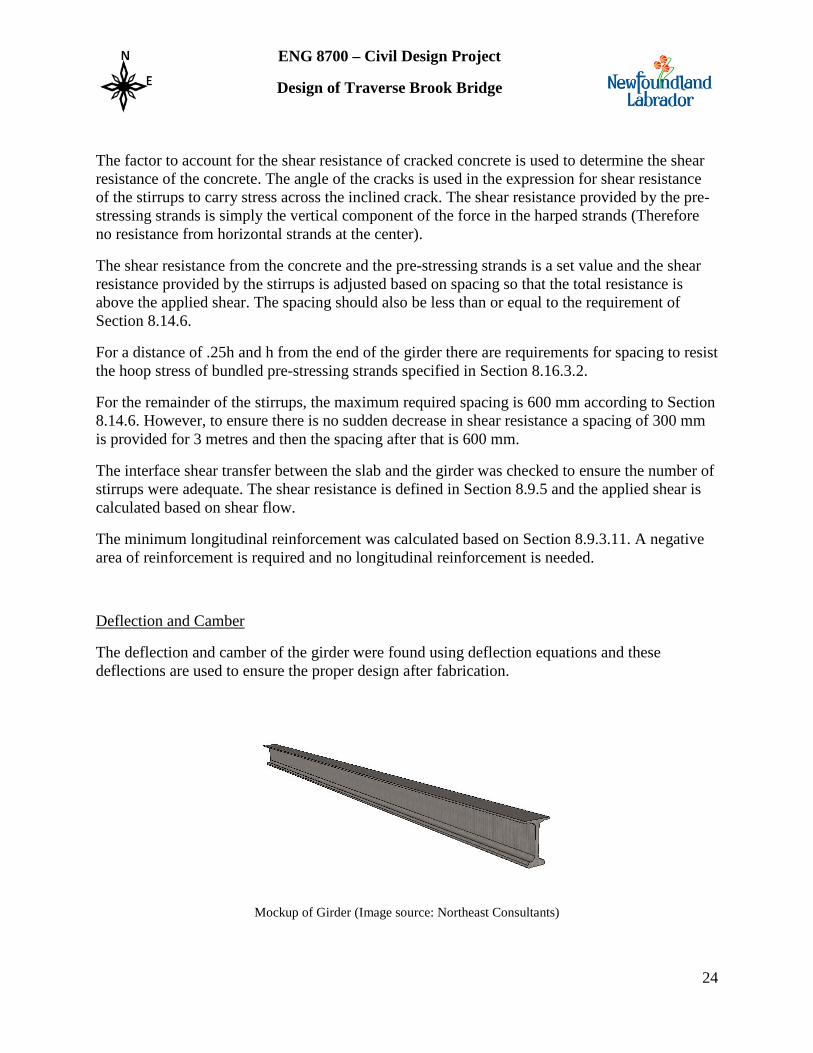
Deflection and Camber
The deflection and camber of the girder were found using deflection equations and these deflections are used to ensure the proper design after fabrication.
Mockup of Girder (Image source: Northeast Consultants)

25
ENG 8700 – Civil Design Project
Design of Traverse Brook Bridge
10.5 Wing walls
Geometry
To determine the geometry of the wing walls, the following process was specified by DTW:
Beginning at the intersection of the midpoint of abutment bearing seat and the intersection of riverbed with the abutment, take an upward slope of 1.5:1 from this point until it reaches the top elevation of the abutment. This line is dropped by 1.5 m to create a vertical face below the slope. The slope continues downward until it reaches the horizontal location of the heel of the abutment, at which point it drops vertically, creating a vertical face of 1.35 m below the slope.
Geometry of Wing Wall (Image Source: Northeast Consultants)
Structural Design
The wing walls were divided into three sections, a diagram of which can be found in Appendix A. The self-weight of each section was determined. The earth pressure and compaction surcharge on each section were also calculated to determine the moment and shear on each section. The greatest moment and shear were selected to govern design.

26
ENG 8700 – Civil Design Project
Design of Traverse Brook Bridge
The reinforcement requirement was calculated using this moment, material resistance factors, yield strength of steel, and the depth of reinforcement. Once the required area of steel was found, this was used to select the bar size, number of bars, and spacing.
The cracking moment was calculated to determine minimum reinforcement requirement. This minimum area of reinforcement was less than the area of reinforcement previously calculated. Minimum skin reinforcement was also applied.
The shear resistance of concrete was calculated, and found to be greater than the factored moments and shear; therefore no shear reinforcement was required in the wing walls.
Crack widths were determined for the wing walls because the factored moment was greater than the cracking moment. Crack widths were within the acceptable range as specified in Section 8.12.3.2 of the Bridge Code.
Mockup of Bridge (Image Source: Northeast Consultants)

27
ENG 8700 – Civil Design Project
Design of Traverse Brook Bridge
10.6 Deck slab and Barrier Wall
The material resistance factor for glass fibre reinforced polymer (GFRP) reinforcement was determined according to section 16.5.3 of the Bridge Code. GFRP is the type of FRP reinforcement specified by DTW. The material properties of GFRP reinforcement were provided by DTW.
Developmental and Splice Lengths
The required developmental length of FRP bars was calculated according to section 16.8.4.1 of the Bridge Code, using the following equation:
The required splice length is specified in section 16.8.4.2 as 1.3 times the calculated developmental length.
Developmental length of the FRP grid used was calculated according to section 16.8.5 of the Bridge Code.
Interior Section
The interior section of the deck slab, bounded by the exterior girders, was designed according to the empirical method specified in section 8.18.4.2 of the Bridge Code, which is the process employed when steel reinforcement is used. For FRP design, several changes are made according to section 16.8.8.1.
The slab height was specified by DTW upon commencement of the Project, and this value was used to determine the depth of reinforcement within the slab. For the direction perpendicular to the road, using the specified reinforcement ratio, the required area and spacing of steel reinforcement for a one-metre wide section of the bridge was determined.
For FRP design, the required area of transverse FRP reinforcement was calculated using the required depth of steel reinforcement, and the elastic modulus of FRP reinforcement. A bar size was then selected. Once the required area of FRP reinforcement was calculated, it was used to determine the required number of bars and their spacing for a one metre section. For longitudinal FRP reinforcement, the area of reinforcement was determined using the specified reinforcement

28
ENG 8700 – Civil Design Project
Design of Traverse Brook Bridge
ratio, the calculated reinforcement depth, and a section width of one metre. This area of FRP reinforcement for a one-metre section was used to determine spacing and number of bars.
Minimum spacing and maximum spacing were checked according to sections 8.14.2.1.2 and 8.14.2.1.5, respectively.
Cantilever Section
For the cantilever section of the bridge deck, which overhangs the exterior girders, impact loads must be considered, according to section 3.8.8 of the Bridge Code. The impact load consists of a vertical load, a longitudinal load, and a transverse load. The transverse load is used to determine anchorage of the barrier walls to the slab, but we were not required by DTW to design that connection.
Section 5.7.1.6.3 and Table 5.3 were used to determine the moment at the end portion. This moment was factored using the factor for live loads.
The vertical impact load was distributed over the width of the bridge to obtain a linear distributed load, which was factored.
The dead load due to self-weights of the wearing surface and slab were determined and factored. These distributed area loads were multiplied by the width of the cantilever section to obtain a linear distributed load.
These loads and moments were required for the calculation of the total factored design moment.
As per section 16.8.8.2 of the Bridge Code, the design was over-reinforced, with a moment of resistance 50% greater than the factored design moment.
The required area of FRP reinforcement for a one-metre section was determined using the required resistive moment, the material resistance factor, the depth of reinforcement, and the tensile strength of reinforcement. Once the area of reinforcement was calculated, using the bar size used in the interior section of the deck, the number of bars and spacing was determined.
Minimum spacing was checked according to section 8.14.2.1.1 of the Bridge Code.
Deformability
Deformability of FRP reinforcement was calculated according to section 16.8.2.1 of the Bridge Code.

29
ENG 8700 – Civil Design Project
Design of Traverse Brook Bridge
Barrier Walls
The Barrier Walls are designed according to a standard section, a detail of which was provided by DTW and can be found in Appendix E.
11.0 Drafting
AutoCAD was used by Northeast to prepare a set of detailed design drawings, as required by DTW. Using the dimensions and reinforcement of all bridge components which were determined throughout the design process, a full set of design drawings was prepared. The following drawings can be found in the Appendix C of this report:
• General arrangement • Bridge cross-section • Bridge profile • Deck slab • Girders • Abutments • Wing walls
12.0 Cost Analysis
The detailed cost analysis, part of the Project Deliverables, was completed by performing quantity take-off analysis using the design drawings and a scale ruler, as well as known dimensions. This analysis provided the precise quantities of materials (concrete, steel reinforcement, FRP reinforcement, rock fill material, and excavated material) required to construct Traverse Brook Bridge. Once these quantities were found, tender prices for previous DTW projects were used to determine the material cost of each component of the bridge, as well as the installation cost.
Cost analysis of the bridge girders did not require quantity take-off analysis. The material and installation cost of the girders was determined from the number of girders used, and the cost of New England Bulb Tee girders from previous projects.

30
ENG 8700 – Civil Design Project
Design of Traverse Brook Bridge
13.0 Project Schedule
Upon commencement of the Project, Northeast prepared a Project Schedule in the form of a Gantt Chart, using Microsoft Project. This schedule was regularly updated to reflect any changes that arose throughout the Project. One particular source of change was Northeast’s tendency to divide tasks among group members, causing different tasks, such as abutment design and girder design, to overlap on the schedule. The initial schedule indicated that each task was entirely finished prior to beginning the following task. Additionally, several tasks, particularly girder design, took more time than expected due to their complexity. Other tasks, such as drafting and cost analysis, took less time than expected; therefore the date of Project completion was not affected. This can be found in Appendix G of this report.
14.0 Conclusion
Northeast Consultants has successfully completed the design of Traverse Brook Bridge, fulfilling the requirements set forth by the Department of Transportation and Works at the commencement of the project. The purpose of the Project was to assist the Department of Transportation and Works in a cost comparison between their current bridge design, and a design using New England Bulb Tee girders. Northeast Consultants is pleased to have assisted the Department of Transportation and Works with their cost comparison and is appreciative of the opportunity to complete the Project.

31
ENG 8700 – Civil Design Project
Design of Traverse Brook Bridge
15.0 References
[1] Government of Newfoundland and Labrador: http://www.tw.gov.nl.ca/department/branches/road_and_air/highway.html, July 22, 2011 [Feb 2, 2013].
[2] Map of Traverse Brook. 2013. Scale undetermined; Mark Harvey; using 'Google Maps'. <https://maps.google.ca/?ll=48.84461,-54.084063&spn=0.039144,0.090895&t=h&z=14> (January 2013)
[3] Canadian Highway Bridge Design Code, CSA S6-06, 2006
[4] Concrete Design Handbook, 3rd Ed., Cement Association of Canada, Ottawa, On., 2006
[5] Handbook of Steel Drainage and Highway Construction Products, 2nd Ed., Corrugated Steel Pipe Institute, Cambridge, On., 2007
[6] Structural Analysis, 8th Ed., R.C. Hibbeler, Pearson Prentice Hall, Upper Saddle River, New Jersey, 2012.
[7] Ken Rollings, P. Eng. “Regional Flood Frequency Analysis for the Island of Newfoundland.” Internet: http://www.env.gov.nl.ca/env/waterres/reports/rffa/index.html#2, December 1999 [January 2013]
[8] Pulltrall Inc. “V-Rod.” Internet: http://www.pultrall.com/en/vrod.asp, 2013 [January 2013]
[9] Ametrano, Dave. “Bond Characteristics of Glass Fibre Reinforced Polymer Bars Embedded in High Performance and Ultra-High Performance Concrete” MASc, Dept. of Engineering and Architectural Science. Ryerson University, Toronto, ON, 2011
[10] Canadian Precast Concrete Institute. “Pre-stressed Girder Bridges.” Internet: http://www.cpci.ca/?sc=bs&pn=prestressedgirderbridges [March 2013]
[11] PCI Journal, Nov-Dec 1997 Design, Construction, and Fabrication of the New England Bulb Tee Girder http://www.pci.org/view_file.cfm?file=JL-97-NOVEMBER-DECEMBER-4.pdf [March 2013]
[12] Osco Construction Group. “New England Bulb Tees.” Internet: http://www.oscoconstructiongroup.com/nebt.aspx, 2007 [January 2013]
[13] Dayton Superior. “Strand Restraining Devices.” Internet: http://www.daytonsuperior.com/artifacts/ds_prestress_hb.pdf, 2012 [March 2013]
[14] Environment Canada. “Gander IDF Curve.” Internet: http://climate.weatheroffice.gc.ca/prods_servs/index_e.html , February 2012 [January 2013]

Engineering 8700 – Civil Project Traverse Brook Bridge Replacement
Final Report - Appendices
Northeast Consultants
Rana Patey
Brett Evans
Mark Harvey
Gary Caul
Date: April 3, 2013
Location: St. John’s, NL
Prepared for:
Mr. Lloyd Osmond, P. Eng Department of Transportation and Works Dr. Steve Bruneau, P. Eng Memorial University of Newfoundland Dr. Amgad Hussein, P. Eng Memorial University of Newfoundland Mr. Justin Skinner, P. Eng Memorial University of Newfoundland

LIST OF APPENDICES
APPENDIX A – Manual Design Calculations
Section 1 – Hydrology
Section 2 - Load Calculations
Section 3 – Abutments
Section 4 – Wing walls
Section 5 – Girders
Section 6 – Deck slab
Section 7 – Crack widths
APPENDIX B – DESIGN SPREADSHEETS
Section 1 – Hydrology
Section 2 - Load Calculations
Section 3 – Abutments
Section 4 – Girders
APPENDIX C – Design Drawings
APPENDIX D – Cost Estimate
APPENDIX E – Initial Documentation
Section 1 – Cross-section width
Section 2 – Horizontal Clearance
Section 3 – Barrier Wall Detail
Section 4 – Typical Cross-section of RCU-80
Section 5 – Geotechnical Report
APPENDIX F – Hydrology
Section 1 – Appendix A of Regional Flood Frequency Analysis Report [7]
Section 2 – Gander IDF Curve [14]
APPENDIX G – Project Schedule
APPENDIX H – Meeting Minutes and Agendas
Section 1 – Client Meeting Agendas
Section 2 – Client Meeting Minutes
Section 3 – Business Meeting Progress Reports

APPENDIX A – Manual Design Calculations

Generated by CamScanner from intsig.com

Generated by CamScanner from intsig.com
Generated by CamScanner from intsig.com
Generated by CamScanner from intsig.com

Generated by CamScanner from intsig.com

Generated by CamScanner from intsig.com

Generated by CamScanner from intsig.com

Generated by CamScanner from intsig.com

Generated by CamScanner from intsig.com

Generated by CamScanner from intsig.com

Generated by CamScanner from intsig.com

Generated by CamScanner from intsig.com

Generated by CamScanner from intsig.com

Generated by CamScanner from intsig.com

Generated by CamScanner from intsig.com

Generated by CamScanner from intsig.com

Generated by CamScanner from intsig.com

Generated by CamScanner from intsig.com

Generated by CamScanner from intsig.com

Generated by CamScanner from intsig.com

Generated by CamScanner from intsig.com


Generated by CamScanner from intsig.com

Generated by CamScanner from intsig.com

Generated by CamScanner from intsig.com

Generated by CamScanner from intsig.com

Generated by CamScanner from intsig.com

Generated by CamScanner from intsig.com

Generated by CamScanner from intsig.com

Generated by CamScanner from intsig.com

Generated by CamScanner from intsig.com

APPENDIX B – Design Spreadsheets

Normal Depth under Bridge
FLOW 1 FLOW 2
Flow 167.88 173.69
mannings number n 0.03
Slope 0.0133
1.2097 1.2347
31.986 31.986
1 1
1 1
40.1568383 41.0176
35.4075483 35.47826
1.13413213 1.156133
167.88 173.6921
1.2174 1.2423
31.108 31.108
1.4 1.4
2 2
40.3903859 41.26909
35.9246833 36.0232
1.12430736 1.145625
167.88 173.6966
1.2433 1.2643
30.352 30.352
1.35 1.35
1.6 1.6
40.0166891 40.73175
34.7866348 34.86154
1.15034666 1.168387
168.89 173.6982
Area
Wetted Perimeter
Hydraulic Radius
Q using estimated y
Wetted Perimeter
z value left (n)
z value right(m)
Area
Hydraulic Radius
Q using estimated y
z value right(m)
Area
z value right(m)
Area
Wetted Perimeter
Hydraulic Radius
Q using estimated y
Wetted Perimeter
Cross section 0+005
Hydraulic Radius
Q using estimated y
Guess y
Bottom width b
z value left (n)
Guess y
Bottom width b
Guess y
Bottom width b
z value left (n)
Guess y
Bottom width b
z value left (n)
Cross section 0+005
Guess y
Bottom width b
z value left (n)
z value right(m)
Guess y
Bottom width b
z value left (n)
z value right(m)
Area
z value right(m)
Area
Wetted Perimeter
Hydraulic Radius
Q using estimated y
Wetted Perimeter
Flow 1 Flow 2
Cross section -0+005 Cross section -0+005
Cross section 0+000Cross section 0+000
Hydraulic Radius
Q using estimated y

Watershed Name:
Region #: 2
(NW=1, NE=2, SE=3, SW=4 or UE=5)
Range in Region:
Parameters: Value Units lowest 2nd lowest 2nd highest highest Remarks:
DA 402.6 km^2 36.70 63.80 2000.00 2150.00
LAF 119.93 (-) 50.00 50.00 307.00 881.00
LSF 1.277 (-) 1.22 1.40 1.89 1.92 Parameter near extreme
FACLS 0.448 (-) 0.44 0.55 0.98 1.00 Parameter near extreme
LAKE 0.112 (-) 0.02 0.03 0.18 0.20
SWAMP 0.1356 (-) 0.06 0.06 0.25 0.48
L+S 0.2476 (-) 0.11 0.13 0.36 0.66
TREE 0.753 (-) 0.11 0.55 0.88 0.91
BAR'N 0 (-) 0.00 0.00 0.15 0.23
SLOPE2 0.466 (%) 0.12 0.16 1.03 1.11
DRAIN 0.567 (1/km) 0.26 0.35 1.09 1.24
SHAPE 1.92 (-) 1.43 1.62 2.12 2.35
Results: Estimate L95%L U95%L
DA+LAF or LSF Q2 = 79.15 46.68 134.20
Q5 = 100.96 56.91 179.08
Q10 = 114.89 63.61 207.52
Q20 = 126.89 70.57 228.15
Q50 = 142.85 74.58 273.60
Q100 = 154.95 78.03 307.69
Q200 = 167.57 81.03 346.54
Results: Estimate L95%L U95%L
DA only Q2 = 87.29 35.56 214.29
Q5 = 112.20 43.69 288.15
Q10 = 127.72 48.62 335.51
Q20 = 141.48 52.66 380.12
Q50 = 160.91 57.76 448.23
Q100 = 173.69 60.69 497.11
Q200 = 187.55 63.20 556.50
Regional Flood Frequency Analysis for the Island of Newfoundland Version 1999
Consult "Regional Flood Frequency Analysis for the Island of Newfoundland -
User's Guide and Electronic Spreadsheet" for instructions on use.
Government of Newfoundland and Labrador
Department of Environment and Labour
Water Resources Management Division
PO Box 8700, St. John's, NF, A1B 4J6
Phone: (709) 729 2563
Fax: (709) 729 0320

Calculated Forces (KN) Moment Arm (m) Min Dead/Earth
Min Max Min Max
Vertical Forces
D(Footing 1) 0.9 1.2 955.69 860.121 1146.828 1.5 1290.18
D(Footing 2) 0.9 1.2 909.072 818.1648 1090.8864 2.15 1759.05
D(Heel) 0.9 1.2 388.8 349.92 466.56 3.3 1154.74
D(Toe) 0.9 1.2 237.6 213.84 285.12 0.55 117.61
D(super Structure) 0.9 1.2 3085 2776.5 3702 1.5 4164.75
E (soil weight) 0.8 1.25 2619.7776 2095.8221 3274.722 3.3 6916.21
Wingwall part 1 0.9 1.2 250.13 225.117 300.156 5.30 1193.12
Wingwall part 2 0.9 1.2 152.83 137.547 183.396 5.20 715.24
Wingwall part 3 0.9 1.2 207.9 187.11 249.48 3.30 617.46
Live Load 1.7 1.7 2922.5 4968.25 4968.25 1.5 7452.38
W(Vertical) 0 0 249.75 0 0 1.5 0.00
Horizontal Forces 0.00
Earthquake 0 0 153.75 0 0 4.148 0.00
Braking Force 1.7 1.7 212.85 361.845 361.845 4.148 1500.93
Earth Pressure 0.8 1.25 1434.74 1147.792 1793.425 2.104 2414.95
Surcharge 1.7 1.7 144 244.8 244.8 5.65 1383.12
Stabalising 25380.75
De-Stablising 5299.01
Stab./De-Stab 4.79
Note: Wind Loads are taken as acting upward
Load Factors Factored Forces (KN)
Overturning Ultimate Limit States 1
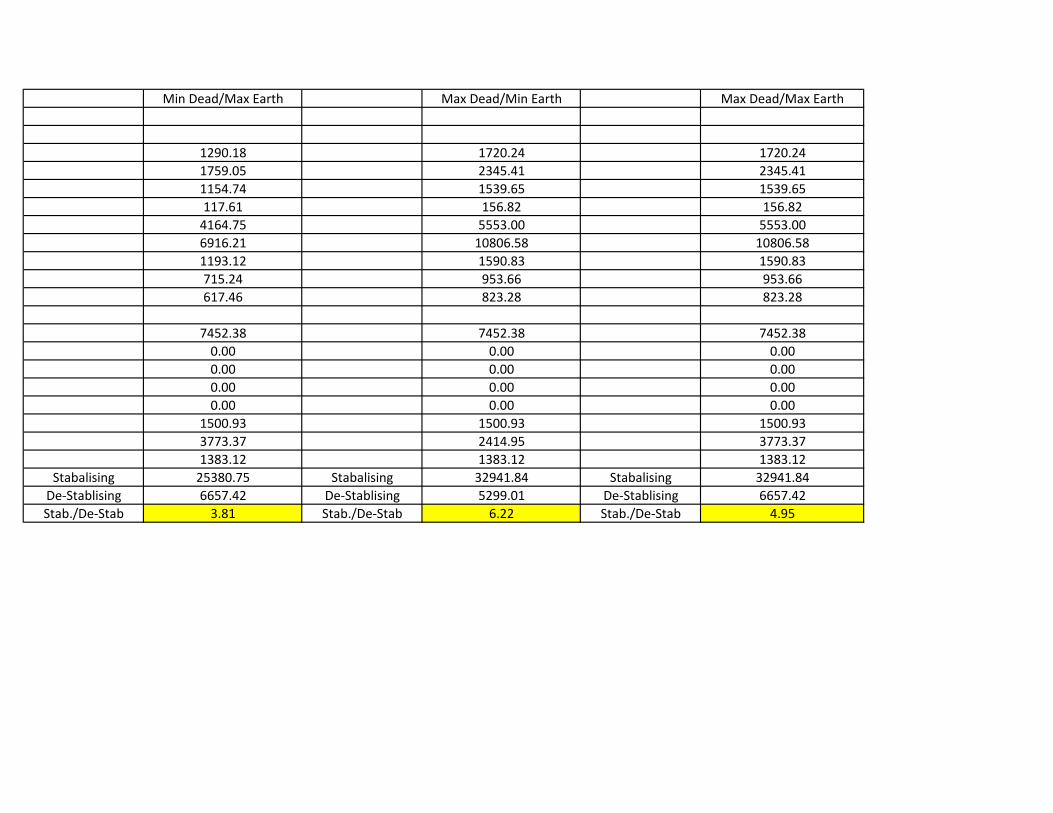
Min Dead/Max Earth Max Dead/Min Earth Max Dead/Max Earth
1290.18 1720.24 1720.24
1759.05 2345.41 2345.41
1154.74 1539.65 1539.65
117.61 156.82 156.82
4164.75 5553.00 5553.00
6916.21 10806.58 10806.58
1193.12 1590.83 1590.83
715.24 953.66 953.66
617.46 823.28 823.28
7452.38 7452.38 7452.38
0.00 0.00 0.00
0.00 0.00 0.00
0.00 0.00 0.00
0.00 0.00 0.00
1500.93 1500.93 1500.93
3773.37 2414.95 3773.37
1383.12 1383.12 1383.12
Stabalising 25380.75 Stabalising 32941.84 Stabalising 32941.84
De-Stablising 6657.42 De-Stablising 5299.01 De-Stablising 6657.42
Stab./De-Stab 3.81 Stab./De-Stab 6.22 Stab./De-Stab 4.95

Calculated Forces (KN) Moment Arm (m) Min Dead/Earth
Min Max Min Max
Vertical Forces
D(Footing 1) 0.9 1.2 955.69 860.121 1146.828 1.5 1290.18
D(Footing 2) 0.9 1.2 909.072 818.1648 1090.8864 2.15 1759.05
D(Heel) 0.9 1.2 388.8 349.92 466.56 3.3 1154.74
D(Toe) 0.9 1.2 237.6 213.84 285.12 0.55 117.61
D(super Structure) 0.9 1.2 3085 2776.5 3702 1.5 4164.75
E (soil weight) 0.8 1.25 2619.7776 2095.8221 3274.722 3.3 6916.21
Wingwall part 1 0.9 1.2 250.13 225.117 300.156 5.30 1193.12
Wingwall part 2 0.9 1.2 152.83 137.547 183.396 5.20 715.24
Wingwall part 3 0.9 1.2 207.9 187.11 249.48 3.30 617.46
Live Load 1.6 1.6 2922.5 4676 4676 1.5 7014.00
W(Vertical) 0 0 249.75 0 0 1.5 0.00
Horizontal Forces 0.00
Earthquake 0 0 153.75 0 0 4.148 0.00
Braking Force 1.6 1.6 212.85 340.56 340.56 4.148 1412.64
Earth Pressure 0.8 1.25 1434.74 1147.792 1793.425 2.104 2414.95
Surcharge 1.6 1.6 144 230.4 230.4 5.65 1301.76
Stabalising 24942.37
De-Stablising 5129.36
Stab./De-Stab 4.86
Note: Wind Loads are taken as acting upward
Load Factors Factored Forces (KN)
Overturning Ultimate Limit States 2
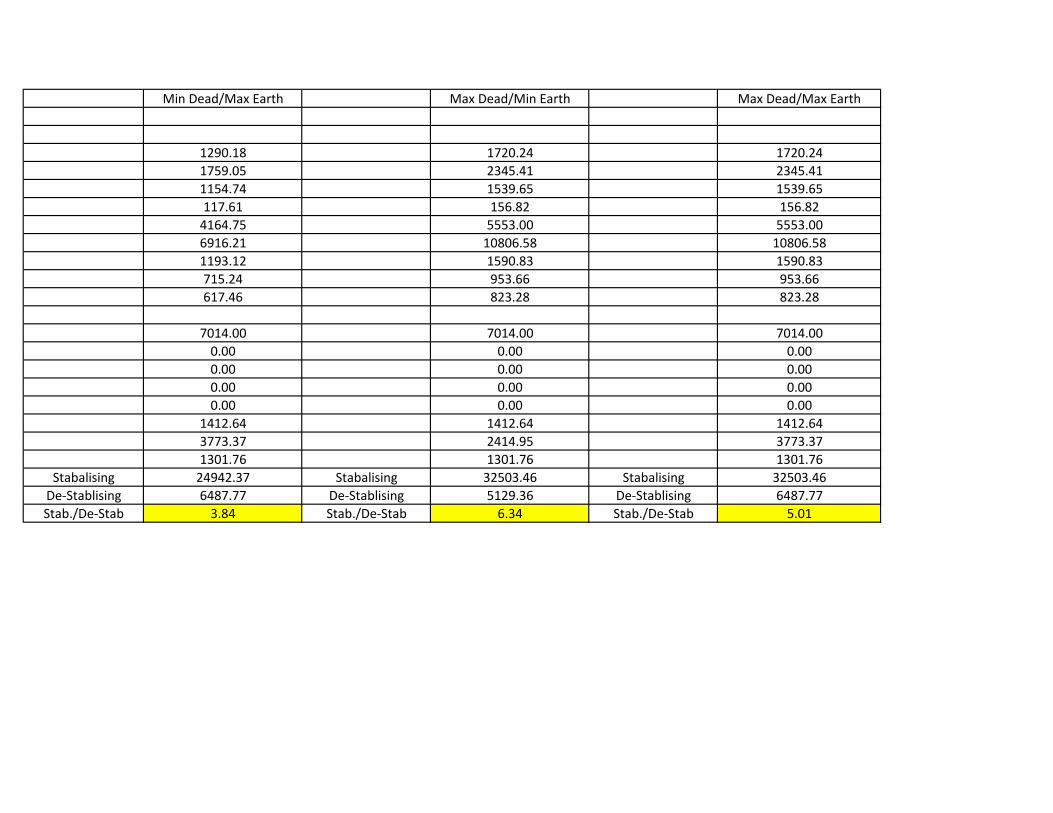
Min Dead/Max Earth Max Dead/Min Earth Max Dead/Max Earth
1290.18 1720.24 1720.24
1759.05 2345.41 2345.41
1154.74 1539.65 1539.65
117.61 156.82 156.82
4164.75 5553.00 5553.00
6916.21 10806.58 10806.58
1193.12 1590.83 1590.83
715.24 953.66 953.66
617.46 823.28 823.28
7014.00 7014.00 7014.00
0.00 0.00 0.00
0.00 0.00 0.00
0.00 0.00 0.00
0.00 0.00 0.00
1412.64 1412.64 1412.64
3773.37 2414.95 3773.37
1301.76 1301.76 1301.76
Stabalising 24942.37 Stabalising 32503.46 Stabalising 32503.46
De-Stablising 6487.77 De-Stablising 5129.36 De-Stablising 6487.77
Stab./De-Stab 3.84 Stab./De-Stab 6.34 Stab./De-Stab 5.01

Calculated Forces (KN) Moment Arm (m) Min Dead/Earth
Min Max Min Max
Vertical Forces
D(Footing 1) 0.9 1.2 955.69 860.121 1146.828 1.5 1290.18
D(Footing 2) 0.9 1.2 909.072 818.1648 1090.8864 2.15 1759.05
D(Heel) 0.9 1.2 388.8 349.92 466.56 3.3 1154.74
D(Toe) 0.9 1.2 237.6 213.84 285.12 0.55 117.61
D(super Structure) 0.9 1.2 3085 2776.5 3702 1.5 4164.75
E (soil weight) 0.8 1.25 2619.7776 2095.82208 3274.722 3.3 6916.21
Wingwall part 1 0.9 1.2 250.13 225.117 300.156 5.30 1193.12
Wingwall part 2 0.9 1.2 152.83 137.547 183.396 5.20 715.24
Wingwall part 3 0.9 1.2 207.9 187.11 249.48 3.30 617.46
Live Load 1.4 1.4 2922.5 4091.5 4091.5 1.5 6137.25
W(Vertical) 0.5 0.5 249.75 124.875 124.875 1.5 187.31
Horizontal Forces 0.00
Earthquake 0 0 153.75 0 0 4.148 0.00
Braking Force 1.4 1.4 212.85 297.99 297.99 4.148 1236.06
Earth Pressure 0.8 1.25 1434.74 1147.792 1793.425 2.104 2414.95
Surcharge 1.4 1.4 144 201.6 201.6 5.65 1139.04
Stabalising 24065.62
De-Stablising 4977.37
Stab./De-Stab 4.84
Note: Wind Loads are taken as acting upward
Load Factors Factored Forces (KN)
Overturning Ultimate Limit States 3

Min Dead/Max Earth Max Dead/Min Earth Max Dead/Max Earth
1290.18 1720.24 1720.24
1759.05 2345.41 2345.41
1154.74 1539.65 1539.65
117.61 156.82 156.82
4164.75 5553.00 5553.00
6916.21 10806.58 10806.58
1193.12 1590.83 1590.83
715.24 953.66 953.66
617.46 823.28 823.28
6137.25 6137.25 6137.25
187.31 187.31 187.31
0.00 0.00 0.00
0.00 0.00 0.00
0.00 0.00 0.00
1236.06 1236.06 1236.06
3773.37 2414.95 3773.37
1139.04 1139.04 1139.04
Stabalising 24065.62 Stabalising 31626.71 Stabalising 31626.71
De-Stablising 6335.78 De-Stablising 4977.37 De-Stablising 6335.78
Stab./De-Stab 3.80 Stab./De-Stab 6.35 Stab./De-Stab 4.99

Calculated Forces (KN) Moment Arm (m) Min Dead/Earth
Min Max Min Max
Vertical Forces
D(Footing 1) 0.9 1.2 955.69 860.121 1146.828 1.5 1290.18
D(Footing 2) 0.9 1.2 909.072 818.1648 1090.8864 2.15 1759.05
D(Heel) 0.9 1.2 388.8 349.92 466.56 3.3 1154.74
D(Toe) 0.9 1.2 237.6 213.84 285.12 0.55 117.61
D(super Structure) 0.9 1.2 3085 2776.5 3702 1.5 4164.75
E (soil weight) 0.8 1.25 2619.7776 2095.8221 3274.722 3.3 6916.21
Wingwall part 1 0.9 1.2 250.13 225.117 300.156 5.30 1193.12
Wingwall part 2 0.9 1.2 152.83 137.547 183.396 5.20 715.24
Wingwall part 3 0.9 1.2 207.9 187.11 249.48 3.30 617.46
Live Load 0 0 2922.5 0 0 1.5 0.00
W(Vertical) 1.65 1.65 249.75 412.0875 412.0875 1.5 618.13
Horizontal Forces 0.00
Earthquake 0 0 153.75 0 0 4.148 0.00
Braking Force 0 0 212.85 0 0 4.148 0.00
Earth Pressure 0.8 1.25 1434.74 1147.792 1793.425 2.104 2414.95
Surcharge 0 0 144 0 0 5.65 0.00
Stabalising 17928.37
De-Stablising 3033.09
Stab./De-Stab 5.91
Note: Wind Loads are taken as acting upward
Load Factors Factored Forces (KN)
Overturning Ultimate Limit States 4

Min Dead/Max Earth Max Dead/Min Earth Max Dead/Max Earth
1290.18 1720.24 1720.24
1759.05 2345.41 2345.41
1154.74 1539.65 1539.65
117.61 156.82 156.82
4164.75 5553.00 5553.00
6916.21 10806.58 10806.58
1193.12 1590.83 1590.83
715.24 953.66 953.66
617.46 823.28 823.28
0.00 0.00 0.00
618.13 618.13 618.13
0.00 0.00 0.00
0.00 0.00 0.00
0.00 0.00 0.00
0.00 0.00 0.00
3773.37 2414.95 3773.37
0.00 0.00 0.00
Stabalising 17928.37 Stabalising 25489.46 Stabalising 25489.46
De-Stablising 4391.50 De-Stablising 3033.09 De-Stablising 4391.50
Stab./De-Stab 4.08 Stab./De-Stab 8.40 Stab./De-Stab 5.80

Calculated Forces (KN) Moment Arm (m) Min Dead/Earth
Min Max Min Max
Vertical Forces
D(Footing 1) 0.8 1.25 955.69 764.552 1194.6125 1.5 1146.83
D(Footing 2) 0.8 1.25 909.072 727.2576 1136.34 2.15 1563.60
D(Heel) 0.8 1.25 388.8 311.04 486 3.3 1026.43
D(Toe) 0.8 1.25 237.6 190.08 297 0.55 104.54
D(super Structure) 0.8 1.25 3085 2468 3856.25 1.5 3702.00
E (soil weight) 0.8 1.25 2619.7776 2095.8221 3274.722 3.3 6916.21
Wingwall part 1 0.8 1.25 250.13 200.104 312.6625 5.30 1060.55
Wingwall part 2 0.8 1.25 152.83 122.264 191.0375 5.20 635.77
Wingwall part 3 0.8 1.25 207.9 166.32 259.875 3.30 548.86
Live Load 0 0 2922.5 0 0 1.5 0.00
W(Vertical) 0 0 249.75 0 0 1.5 0.00
Horizontal Forces 0.00
Earthquake 1 1 153.75 153.75 153.75 4.148 637.76
Braking Force 0 0 212.85 0 0 4.148 0.00
Earth Pressure 0.8 1.25 1434.74 1147.792 1793.425 2.104 2414.95
Surcharge 0 0 144 0 0 5.65 0.00
Stabalising 16704.80
De-Stablising 3052.71
Stab./De-Stab 5.47
Note: Wind Loads are taken as acting upward
Load Factors Factored Forces (KN)
Overturning Ultimate Limit States 5

Min Dead/Max Earth Max Dead/Min Earth Max Dead/Max Earth
1146.83 1791.92 1791.92
1563.60 2443.13 2443.13
1026.43 1603.80 1603.80
104.54 163.35 163.35
3702.00 5784.38 5784.38
6916.21 10806.58 10806.58
1060.55 1657.11 1657.11
635.77 993.40 993.40
548.86 857.59 857.59
0.00 0.00 0.00
0.00 0.00 0.00
0.00 0.00 0.00
0.00 0.00 0.00
637.76 637.76 637.76
0.00 0.00 0.00
3773.37 2414.95 3773.37
0.00 0.00 0.00
Stabalising 16704.80 Stabalising 26101.25 Stabalising 26101.25
De-Stablising 4411.12 De-Stablising 3052.71 De-Stablising 4411.12
Stab./De-Stab 3.79 Stab./De-Stab 8.55 Stab./De-Stab 5.92

Calculated Forces (KN) Moment Arm (m) Min Dead/Earth
Min Max Min Max
Vertical Forces
D(Footing 1) 0.9 1.2 955.69 860.121 1146.828 1.5 1290.18
D(Footing 2) 0.9 1.2 909.072 818.1648 1090.8864 2.15 1759.05
D(Heel) 0.9 1.2 388.8 349.92 466.56 3.3 1154.74
D(Toe) 0.9 1.2 237.6 213.84 285.12 0.55 117.61
D(super Structure) 0.9 1.2 3085 2776.5 3702 1.5 4164.75
E (soil weight) 0.8 1.25 2619.7776 2095.8221 3274.722 3.3 6916.21
Wingwall part 1 0.9 1.2 250.13 225.117 300.156 5.30 1193.12
Wingwall part 2 0.9 1.2 152.83 137.547 183.396 5.20 715.24
Wingwall part 3 0.9 1.2 207.9 187.11 249.48 3.30 617.46
Live Load 0 0 2922.5 0 0 1.5 0.00
W(Vertical) 0.9 0.9 249.75 224.775 224.775 1.5 337.16
Horizontal Forces 0.00
Earthquake 1 1 153.75 153.75 153.75 4.148 637.76
Braking Force 0 0 212.85 0 0 4.148 0.00
Earth Pressure 0.8 1.25 1434.74 1147.792 1793.425 2.104 2414.95
Surcharge 0 0 144 0 0 5.65 0.00
Stabalising 17928.37
De-Stablising 3389.87
Stab./De-Stab 5.29
Note: Wind Loads are taken as acting upward
Load Factors Factored Forces (KN)
Overturning Ultimate Limit States 7

Min Dead/Max Earth Max Dead/Min Earth Max Dead/Max Earth
1290.18 1720.24 1720.24
1759.05 2345.41 2345.41
1154.74 1539.65 1539.65
117.61 156.82 156.82
4164.75 5553.00 5553.00
6916.21 10806.58 10806.58
1193.12 1590.83 1590.83
715.24 953.66 953.66
617.46 823.28 823.28
0.00 0.00 0.00
337.16 337.16 337.16
0.00 0.00 0.00
0.00 0.00 0.00
637.76 637.76 637.76
0.00 0.00 0.00
3773.37 2414.95 3773.37
0.00 0.00 0.00
Stabalising 17928.37 Stabalising 25489.46 Stabalising 25489.46
De-Stablising 4748.28 De-Stablising 3389.87 De-Stablising 4748.28
Stab./De-Stab 3.78 Stab./De-Stab 7.52 Stab./De-Stab 5.37

Calculated Forces (KN) Moment Arm (m) Min Dead/Earth
Min Max Min Max
Vertical Forces
D(Footing 1) 1.35 1.35 955.69 1290.1815 1290.1815 1.5 1935.27
D(Footing 2) 1.35 1.35 909.072 1227.2472 1227.2472 2.15 2638.58
D(Heel) 1.35 1.35 388.8 524.88 524.88 3.3 1732.10
D(Toe) 1.35 1.35 237.6 320.76 320.76 0.55 176.42
D(super Structure) 1.35 1.35 3085 4164.75 4164.75 1.5 6247.13
E (soil weight) 1.35 1.35 2619.7776 3536.6998 3536.69976 3.3 11671.11
Wingwall part 1 1.35 1.35 250.13 337.6755 337.6755 5.30 1789.68
Wingwall part 2 1.35 1.35 152.83 206.3205 206.3205 5.20 1072.87
Wingwall part 3 1.35 1.35 207.9 280.665 280.665 3.30 926.19
Live Load 0 0 2922.5 0 0 1.5 0.00
W(Vertical) 0 0 249.75 0 0 1.5 0.00
Horizontal Forces 0.00
Earthquake 1 1 153.75 153.75 153.75 4.148 637.76
Braking Force 0 0 212.85 0 0 4.148 0.00
Earth Pressure 0.8 1.25 1434.74 1147.792 1793.425 2.104 2414.95
Surcharge 0 0 144 0 0 5.65 0.00
Stabalising 28189.35
De-Stablising 3052.71
Stab./De-Stab 9.23
Note: Wind Loads are taken as acting upward
Load Factors Factored Forces (KN)
Overturning Ultimate Limit States 9

Min Dead/Max Earth Max Dead/Min Earth Max Dead/Max Earth
1935.27 1935.27 1935.27
2638.58 2638.58 2638.58
1732.10 1732.10 1732.10
176.42 176.42 176.42
6247.13 6247.13 6247.13
11671.11 11671.11 11671.11
1789.68 1789.68 1789.68
1072.87 1072.87 1072.87
926.19 926.19 926.19
0.00 0.00 0.00
0.00 0.00 0.00
0.00 0.00 0.00
0.00 0.00 0.00
637.76 637.76 637.76
0.00 0.00 0.00
3773.37 2414.95 3773.37
0.00 0.00 0.00
Stabalising 28189.35 Stabalising 28189.35 Stabalising 28189.35
De-Stablising 4411.12 De-Stablising 3052.71 De-Stablising 4411.12
Stab./De-Stab 6.39 Stab./De-Stab 9.23 Stab./De-Stab 6.39

Calculated Forces (KN) Min Dead/Earth
Min Max Min Max Force
Vertical Forces
D(Footing 1) 0.9 1.2 955.69 860.121 1146.828 860.12
D(Footing 2) 0.9 1.2 909.072 818.1648 1090.8864 818.16
D(Heel) 0.9 1.2 388.8 349.92 466.56 349.92
D(Toe) 0.9 1.2 237.6 213.84 285.12 213.84
D(super Structure) 0.9 1.2 3085 2776.5 3702 2776.50
E (soil weight) 0.8 1.25 2619.7776 2095.82208 3274.722 2095.82
Wingwall part 1 0.9 1.2 250.13 225.117 300.156 225.12
Wingwall part 2 0.9 1.2 152.83 137.547 183.396 137.55
Wingwall part 3 0.9 1.2 207.9 187.11 249.48 187.11
Live Load 1.7 1.7 2922.5 4968.25 4968.25 4968.25
W(Vertical) 0 0 249.75 0 0 0.00
Horizontal Forces
Earthquake 0 0 153.75 0 0 0.00
Braking Force 1.7 1.7 212.85 361.845 361.845 361.85
Earth Pressure 0.8 1.25 1434.74 1147.792 1793.425 1147.79
Surcharge 1.7 1.7 144 244.8 244.8 244.80
Vertical Forces * Friction Factor 6316.20
Horizontal Forces 1754.44
Vert/Hori 3.60
Sliding Ultimate Limit States 1
Load Factors Factored Forces (KN)

Min Dead/Max Earth Max Dead/Min Earth Max Dead/Max Earth
860.12 1146.83 1146.83
818.16 1090.89 1090.89
349.92 466.56 466.56
213.84 285.12 285.12
2776.50 3702.00 3702.00
2095.82 3274.72 3274.72
225.12 300.16 300.16
137.55 183.40 183.40
187.11 249.48 249.48
0.00 0.00 0.00
4968.25 4968.25 4968.25
0.00 0.00 0.00
0.00 0.00 0.00
0.00 0.00 0.00
361.85 361.85 361.85
1793.43 1147.79 1793.43
244.80 244.80 244.80
Vertical Forces * Friction 6316.20 Vertical Forces * Friction 7833.70 Vertical Forces * Friction 7833.70
Horizontal Forces 2400.07 Horizontal Forces 1754.44 Horizontal Forces 2400.07
Vert/Hori 2.63 Vert/Hori 4.47 Vert/Hori 3.26

Calculated Forces (KN) Min Dead/Earth
Min Max Min Max
Vertical Forces
D(Footing 1) 0.9 1.2 955.69 860.121 1146.828 860.12
D(Footing 2) 0.9 1.2 909.072 818.1648 1090.8864 818.16
D(Heel) 0.9 1.2 388.8 349.92 466.56 349.92
D(Toe) 0.9 1.2 237.6 213.84 285.12 213.84
D(super Structure) 0.9 1.2 3085 2776.5 3702 2776.50
E (soil weight) 0.8 1.25 2619.7776 2095.82208 3274.722 2095.82
Wingwall part 1 0.9 1.2 250.13 225.117 300.156 225.12
Wingwall part 2 0.9 1.2 152.83 137.547 183.396 137.55
Wingwall part 3 0.9 1.2 207.9 187.11 249.48 187.11
Live Load 1.6 1.6 2922.5 4676 4676 4676.00
W(Vertical) 0 0 249.75 0 0 0.00
Horizontal Forces
Earthquake 0 0 153.75 0 0 0.00
Braking Force 1.6 1.6 212.85 340.56 340.56 340.56
Earth Pressure 0.8 1.25 1434.74 1147.792 1793.425 1147.79
Surcharge 1.6 1.6 144 230.4 230.4 230.40
Vertical Forces * Friction 6170.07
Horizontal Forces 1718.75
Vert/Hori 3.59
Sliding Ultimate Limit States 2
Load Factors Factored Forces (KN)

Min Dead/Max Earth Max Dead/Min Earth Max Dead/Max Earth
860.12 1146.83 1146.83
818.16 1090.89 1090.89
349.92 466.56 466.56
213.84 285.12 285.12
2776.50 3702.00 3702.00
2095.82 3274.72 3274.72
225.12 300.16 300.16
137.55 183.40 183.40
187.11 249.48 249.48
0.00 0.00 0.00
4676.00 4676.00 4676.00
0.00 0.00 0.00
0.00 0.00 0.00
0.00 0.00 0.00
340.56 340.56 340.56
1793.43 1147.79 1793.43
230.40 230.40 230.40
Vertical Forces * Friction 6170.07 Vertical Forces * Friction 7687.57 Vertical Forces * Friction 7687.57
Horizontal Forces 2364.39 Horizontal Forces 1718.75 Horizontal Forces 2364.39
Vert/Hori 2.61 Vert/Hori 4.47 Vert/Hori 3.25

Calculated Forces (KN) Min Dead/Earth
Min Max Min Max
Vertical Forces
D(Footing 1) 0.9 1.2 955.69 860.121 1146.828 860.12
D(Footing 2) 0.9 1.2 909.072 818.1648 1090.886 818.16
D(Heel) 0.9 1.2 388.8 349.92 466.56 349.92
D(Toe) 0.9 1.2 237.6 213.84 285.12 213.84
D(super Structure) 0.9 1.2 3085 2776.5 3702 2776.50
E (soil weight) 0.8 1.25 2619.7776 2095.82208 3274.722 2095.82
Wingwall part 1 0.9 1.2 250.13 225.117 300.156 225.12
Wingwall part 2 0.9 1.2 152.83 137.547 183.396 137.55
Wingwall part 3 0.9 1.2 207.9 187.11 249.48 187.11
Live Load 1.4 1.4 2922.5 4091.5 4091.5 4091.50
W(Vertical) 0.5 0.5 249.75 124.875 124.875 124.88
Horizontal Forces
Earthquake 0 0 153.75 0 0 0.00
Braking Force 1.4 1.4 212.85 297.99 297.99 297.99
Earth Pressure 0.8 1.25 1434.74 1147.792 1793.425 1147.79
Surcharge 1.4 1.4 144 201.6 201.6 201.60
Vertical Forces * Friction 5940.26
Horizontal Forces 1647.38
Vert/Hori 3.61
Sliding Ultimate Limit States 3
Load Factors Factored Forces (KN)

Min Dead/Max Earth Max Dead/Min Earth Max Dead/Max Earth
860.12 1146.83 1146.83
818.16 1090.89 1090.89
349.92 466.56 466.56
213.84 285.12 285.12
2776.50 3702.00 3702.00
2095.82 3274.72 3274.72
225.12 300.16 300.16
137.55 183.40 183.40
187.11 249.48 249.48
0.00 0.00 0.00
4091.50 4091.50 4091.50
124.88 124.88 124.88
0.00 0.00 0.00
0.00 0.00 0.00
297.99 297.99 297.99
1793.43 1147.79 1793.43
201.60 201.60 201.60
Vertical Forces * Friction 5940.26 Vertical Forces * Friction 7457.76 Vertical Forces * Friction 7457.76
Horizontal Forces 2293.02 Horizontal Forces 1647.38 Horizontal Forces 2293.02
Vert/Hori 2.59 Vert/Hori 4.53 Vert/Hori 3.25

Calculated Forces (KN) Min Dead/Earth
Min Max Min Max
Vertical Forces
D(Footing 1) 0.9 1.2 955.69 860.121 1146.828 860.12
D(Footing 2) 0.9 1.2 909.072 818.1648 1090.8864 818.16
D(Heel) 0.9 1.2 388.8 349.92 466.56 349.92
D(Toe) 0.9 1.2 237.6 213.84 285.12 213.84
D(super Structure) 0.9 1.2 3085 2776.5 3702 2776.50
E (soil weight) 0.8 1.25 2619.7776 2095.82208 3274.722 2095.82
Wingwall part 1 0.9 1.2 250.13 225.117 300.156 225.12
Wingwall part 2 0.9 1.2 152.83 137.547 183.396 137.55
Wingwall part 3 0.9 1.2 207.9 187.11 249.48 187.11
Live Load 0 0 2922.5 0 0 0.00
W(Vertical) 1.65 1.65 249.75 412.0875 412.0875 412.09
Horizontal Forces
Earthquake 0 0 153.75 0 0 0.00
Braking Force 0 0 212.85 0 0 0.00
Earth Pressure 0.8 1.25 1434.74 1147.792 1793.425 1147.79
Surcharge 0 0 144 0 0 0.00
Vertical Forces * Friction 4038.11
Horizontal Forces 1147.79
Vert/Hori 3.52
Sliding Ultimate Limit States 4
Load Factors Factored Forces (KN)

Min Dead/Max Earth Max Dead/Min Earth Max Dead/Max Earth
860.12 1146.83 1146.83
818.16 1090.89 1090.89
349.92 466.56 466.56
213.84 285.12 285.12
2776.50 3702.00 3702.00
2095.82 3274.72 3274.72
225.12 300.16 300.16
137.55 183.40 183.40
187.11 249.48 249.48
0.00 0.00 0.00
0.00 0.00 0.00
412.09 412.09 412.09
0.00 0.00 0.00
0.00 0.00 0.00
0.00 0.00 0.00
1793.43 1147.79 1793.43
0.00 0.00 0.00
Vertical Forces * Friction 4038.11 Vertical Forces * Friction 5555.62 Vertical Forces * Friction 5555.62
Horizontal Forces 1793.43 Horizontal Forces 1147.79 Horizontal Forces 1793.43
Vert/Hori 2.25 Vert/Hori 4.84 Vert/Hori 3.10

Calculated Forces (KN) Min Dead/Earth
Min Max Min Max
Vertical Forces
D(Footing 1) 0.8 1.25 955.69 764.552 1194.6125 764.55
D(Footing 2) 0.8 1.25 909.072 727.2576 1136.34 727.26
D(Heel) 0.8 1.25 388.8 311.04 486 311.04
D(Toe) 0.8 1.25 237.6 190.08 297 190.08
D(super Structure) 0.8 1.25 3085 2468 3856.25 2468.00
E (soil weight) 0.8 1.25 2619.7776 2095.82208 3274.722 2095.82
Wingwall part 1 0.8 1.25 250.13 200.104 312.6625 200.10
Wingwall part 2 0.8 1.25 152.83 122.264 191.0375 122.26
Wingwall part 3 0.8 1.25 207.9 166.32 259.875 166.32
Live Load 0 0 2922.5 0 0 0.00
W(Vertical) 0 0 249.75 0 0 0.00
Horizontal Forces
Earthquake 1 1 153.75 153.75 153.75 153.75
Braking Force 0 0 212.85 0 0 0.00
Earth Pressure 0.8 1.25 1434.74 1147.792 1793.425 1147.79
Surcharge 0 0 144 0 0 0.00
Vertical Forces * Friction 3522.72
Horizontal Forces 1301.54
Vert/Hori 2.71
Sliding Ultimate Limit States 5
Load Factors Factored Forces (KN)

Min Dead/Max Earth Max Dead/Min Earth Max Dead/Max Earth
764.55 1194.61 1194.61
727.26 1136.34 1136.34
311.04 486.00 486.00
190.08 297.00 297.00
2468.00 3856.25 3856.25
2095.82 3274.72 3274.72
200.10 312.66 312.66
122.26 191.04 191.04
166.32 259.88 259.88
0.00 0.00 0.00
0.00 0.00 0.00
0.00 0.00 0.00
0.00 0.00 0.00
153.75 153.75 153.75
0.00 0.00 0.00
1793.43 1147.79 1793.43
0.00 0.00 0.00
Vertical Forces * Friction 3522.72 Vertical Forces * Friction 5504.25 Vertical Forces * Friction 5504.25
Horizontal Forces 1947.18 Horizontal Forces 1301.54 Horizontal Forces 1947.18
Vert/Hori 1.81 Vert/Hori 4.23 Vert/Hori 2.83

Calculated Forces (KN) Min Dead/Earth
Min Max Min Max
Vertical Forces
D(Footing 1) 0.9 1.2 955.69 860.121 1146.828 860.12
D(Footing 2) 0.9 1.2 909.072 818.1648 1090.886 818.16
D(Heel) 0.9 1.2 388.8 349.92 466.56 349.92
D(Toe) 0.9 1.2 237.6 213.84 285.12 213.84
D(super Structure) 0.9 1.2 3085 2776.5 3702 2776.50
E (soil weight) 0.8 1.25 2619.7776 2095.82208 3274.722 2095.82
Wingwall part 1 0.9 1.2 250.13 225.117 300.156 225.12
Wingwall part 2 0.9 1.2 152.83 137.547 183.396 137.55
Wingwall part 3 0.9 1.2 207.9 187.11 249.48 187.11
Live Load 0 0 2922.5 0 0 0.00
W(Vertical) 0.9 0.9 249.75 224.775 224.775 224.78
Horizontal Forces
Earthquake 1 1 153.75 153.75 153.75 153.75
Braking Force 0 0 212.85 0 0 0.00
Earth Pressure 0.8 1.25 1434.74 1147.792 1793.425 1147.79
Surcharge 0 0 144 0 0 0.00
Vertical Forces * Friction 3944.46
Horizontal Forces 1301.54
Vert/Hori 3.03
Sliding Ultimate Limit States 7
Load Factors Factored Forces (KN)

Min Dead/Max Earth Max Dead/Min Earth Max Dead/Max Earth
860.12 1146.83 1146.83
818.16 1090.89 1090.89
349.92 466.56 466.56
213.84 285.12 285.12
2776.50 3702.00 3702.00
2095.82 3274.72 3274.72
225.12 300.16 300.16
137.55 183.40 183.40
187.11 249.48 249.48
0.00 0.00 0.00
0.00 0.00 0.00
224.78 224.78 224.78
0.00 0.00 0.00
153.75 153.75 153.75
0.00 0.00 0.00
1793.43 1147.79 1793.43
0.00 0.00 0.00
Vertical Forces * Friction 3944.46 Vertical Forces * Friction 5461.96 Vertical Forces * Friction 5461.96
Horizontal Forces 1947.18 Horizontal Forces 1301.54 Horizontal Forces 1947.18
Vert/Hori 2.03 Vert/Hori 4.20 Vert/Hori 2.81

Calculated Forces (KN) Min Dead/Earth
Min Max Min Max
Vertical Forces
D(Footing 1) 1.35 1.35 955.69 1290.18 1290.18 1290.18
D(Footing 2) 1.35 1.35 909.072 1227.25 1227.25 1227.25
D(Heel) 1.35 1.35 388.8 524.88 524.88 524.88
D(Toe) 1.35 1.35 237.6 320.76 320.76 320.76
D(super Structure) 1.35 1.35 3085 4164.75 4164.75 4164.75
E (soil weight) 1.35 1.35 2619.7776 3536.70 3536.70 3536.70
Wingwall part 1 1.35 1.35 250.13 337.68 337.68 337.68
Wingwall part 2 1.35 1.35 152.83 206.32 206.32 206.32
Wingwall part 3 1.35 1.35 207.9 280.67 280.67 280.67
Live Load 0 0 2922.5 0.00 0.00 0.00
W(Vertical) 0 0 249.75 0.00 0.00 0.00
Horizontal Forces
Earthquake 1 1 153.75 153.75 153.75 153.75
Braking Force 0 0 212.85 0.00 0.00 0.00
Earth Pressure 0.8 1.25 1434.74 1147.79 1793.43 1147.79
Surcharge 0 0 144 0.00 0.00 0.00
Vertical Forces * Friction 5944.59
Horizontal Forces 1301.54
Vert/Hori 4.57
Sliding Ultimate Limit States 9
Load Factors Factored Forces (KN)

Min Dead/Max Earth Max Dead/Min Earth Max Dead/Max Earth
1290.18 1290.18 1290.18
1227.25 1227.25 1227.25
524.88 524.88 524.88
320.76 320.76 320.76
4164.75 4164.75 4164.75
3536.70 3536.70 3536.70
337.68 337.68 337.68
206.32 206.32 206.32
280.67 280.67 280.67
0.00 0.00 0.00
0.00 0.00 0.00
0.00 0.00 0.00
0.00 0.00 0.00
153.75 153.75 153.75
0.00 0.00 0.00
1793.43 1147.79 1793.43
0.00 0.00 0.00
Vertical Forces * Friction 5944.59 Vertical Forces * Friction 5944.59 Vertical Forces * Friction 5944.59
Horizontal Forces 1947.18 Horizontal Forces 1301.54 Horizontal Forces 1947.18
Vert/Hori 3.05 Vert/Hori 4.57 Vert/Hori 3.05

Calculated Forces (KN) Moment Arm (m)
Min Max Min Max
Vertical Forces
D(Footing 1) 1 1 955.69 955.69 955.69 1.5
D(Footing 2) 1 1 909.072 909.072 909.072 2.15
D(Heel) 1 1 388.8 388.8 388.8 3.3
D(Toe) 1 1 264.33648 264.33648 264.33648 0.55
D(Super Structure) 1 1 3085 3085 3085 1.5
E (soil weight) 1 1 237.6 237.6 237.6 3.3
Wingwall part 1 1 1 250.13 250.13 250.13 5.30
Wingwall part 2 1 1 152.83 152.83 152.83 5.20
Wingwall part 3 1 1 207.9 207.9 207.9 3.30
Live Load 0.9 0.9 2922.5 2630.25 2630.25 1.5
W(Vertical) 0 0 249.75 0 0 1.5
Horizontal Forces
Earthquake 0 0 153.75 0 0 4.148
Breaking Force 1 1 212.85 212.85 212.85 4.148
Earth Pressure 1 1 1434.74 1434.74 1434.74 2.104
Surcharge 1 1 144 144 144 5.65
Bearing Pressure Serviceability Limit States 1
Load Factors Factored Forces (KN)

Force (KN) Moment(KN*m) Force Moment
955.69 1433.54 955.69 1433.54
909.07 1954.50 909.07 1954.50
388.80 1283.04 388.80 1283.04
264.34 145.39 264.34 145.39
3085.00 4627.50 3085.00 4627.50
237.60 784.08 237.60 784.08
250.13 1325.69 250.13 1325.69
152.83 794.72 152.83 794.72
207.90 686.07 207.90 686.07
2630.25 3945.38 2630.25 3945.38
0.00 0.00 0.00 0.00
0.00 0.00
0.00 0.00 0.00 0.00
212.85 882.90 212.85 882.90
1434.74 3018.69 1434.74 3018.69
144.00 813.60 144.00 813.60
Hf 1791.59 Hf 1791.59
Vf 9081.61 Vf 9081.61
M balancing 16979.89 M balancing 16979.89
M overturning 4715.19 M overturning 4715.19
Mb-Mo 12264.70 Mb-Mo 12264.70
P 9081.61 P 9081.61
L/2- (Mb-Mo)/Vf e 0.75 L/2- (Mb-Mo)/Vf e 0.75
B' 2.70 B' 2.70
Area 50.40 Area 50.40
Effective Area 32.41 Effective Area 32.41
Uniform Qf 280.19 Uniform Qf 280.19
Linear Total Area P/A 180.19 Linear P/A 180.19
My/I 192.93 My/I 192.93
Max 373.12 Max 373.12
Min -12.74 Min -12.74
D/B' 0.00 D/B' 0.00
Min Dead/Earth Min Dead/Max Earth

Force Moment Force Moment
955.69 1433.54 955.69 1433.54
909.07 1954.50 909.07 1954.50
388.80 1283.04 388.80 1283.04
264.34 145.39 264.34 145.39
3085.00 4627.50 3085.00 4627.50
237.60 784.08 237.60 784.08
250.13 1325.69 250.13 1325.69
152.83 794.72 152.83 794.72
207.90 686.07
2630.25 3945.38 2630.25 3945.38
0.00 0.00 0.00 0.00
0.00 0.00 0.00 0.00
0.00 0.00 0.00 0.00
212.85 882.90 212.85 882.90
1434.74 3018.69 1434.74 3018.69
144.00 813.60 144.00 813.60
Hf 1791.59 Hf 1791.59
Vf 8873.71 Vf 9081.61
M balancing 16293.82 M balancing 16979.89
M overturning 4715.19 M overturning 4715.19
Mb-Mo 11578.63 Mb-Mo 12264.70
P 8873.71 P 9081.61
L/2- (Mb-Mo)/Vf e 0.80 L/2- (Mb-Mo)/Vf e 0.75
B' 2.61 B' 2.70
Area 50.40 Area 50.40
Effective Area 31.32 Effective Area 32.41
Uniform Qf 283.36 Uniform Qf 280.19
Linear P/A 176.07 Linear P/A 180.19
My/I 200.00 My/I 192.93
Max 376.07 Max Kpa 373.12
Min -23.94 Min Kpa -12.74
D/B' 0.00 D/B' 0.00
Max Dead/Min Earth Max Dead/Max Earth

Concrete Wt. = 24.00 Heel Weight (KN)= 32.40 d=750-100-19.5/2 d=640.25
Heel Length: 1.80 Heel Weight at dv(KN)= 22.03 dv=640.25*0.9 dv=576.22
Toe Length: 1.10 Toe Weight (KN)= 19.80 fcr=0.4Sqrt(f'c) fcr= (0.4)sqrt(40))=2.53
Total Length: 4.20 Toe Weight at dv(KN)= 9.43
Thickness: 0.75 Soil Weight (KN)= 218.31 800 Vc=2.5βφcfcrbvdv
Soil Weight at dv (KN)= 148.43 750 Vc=2.5(0.18)(0.75)(2.53)(1000)(576.22)
Concrete Resistance Vc= 492.02 Vc=492.02
Uniform Pressure
Toe: Heel:
Toe Bearing Force 308.21 Heel Bearing 504.35
Toe Bearing Force at dv 146.76 Heel Bearing Force at dv 220.51
Toe Shear 137.33 Heel Shear 50.06
Toe Moment 158.63 Heel Moment 228.27
Linear Pressure
Heel Pressure: Heel Bearing at dv 108.72
Lower Boundary: 0.00
Upper Boundary: 159.91
Toe Pressure:
Lower Boundary: 275.40 Toe Bearing at dv 326.59
Upper Boundary: 373.12
Shear Calculations:
Heel:
Toe:
Bearing Force 1: 0.00 Bearing Force 1: 302.94
Bearing Force 2: 143.92 Bearing Force 2: 53.75
Factored Moment (Mf)= 139.29 Factored Moment (Mf): 182.11
Factored Shear at dv -103.93 Factored Shear at dv 173.82

Calculated Forces (KN) Moment Arm (m)
Min Max Min Max
Vertical Forces
D(Footing 1) 0.9 1.2 955.69 860.12 1146.83 1.50
D(Footing 2) 0.9 1.2 909.072 818.16 1090.89 2.15
D(Heel) 0.9 1.2 388.8 349.92 466.56 3.30
D(Toe) 0.9 1.2 237.6 213.84 285.12 0.55
D(Super Structure) 0.9 1.2 3085 2776.50 3702.00 1.50
E (soil weight) 0.8 1.25 2619.78 2095.82 3274.72 3.30
Wingwall part 1 0.9 1.2 250.13 225.12 300.16 5.30
Wingwall part 2 0.9 1.2 152.83 137.55 183.40 5.20
Wingwall part 3 0.9 1.2 207.9 187.11 249.48 3.30
Live Load 1.7 1.7 2922.5 4968.25 4968.25 1.50
W(Vertical) 0 0 249.75 0.00 0.00 1.50
Horizontal Forces
Earthquake 0 0 153.75 0.00 0.00 4.15
Breaking Force 1.7 1.7 212.85 361.85 361.85 4.15
Earth Pressure 0.8 1.25 1434.74 1147.79 1793.43 2.10
Surcharge 1.7 1.7 144 244.80 244.80 5.65
Depth of soil 2.9
Bearing pressure allowed (Kpa) 600
D/B' governing 0.86
Reduction factor 0.7238
Maximum allowed uniform pressure 434.28
Max calculated uniform pressure 389.12 < 434.28 ok
Max calcuated linear pressure 498.42
Min calcuated linear pressure 123.30
Material Type D/B'
Min Dead/
Earth Min Dead/ Max Earth
Max Dead/ Min
Earth
Max Dead/ Max
Earth Min Dead/Earth
Min Dead/ Max
Earth
Max Dead/ Min
Earth
Max Dead/Max
Earth
Noncohesive Soil 0.125 0.139 0.190 0.114 0.153 0.660 0.556 0.715 0.629
Noncohesive Soil 0.25 0.139 0.190 0.114 0.153 0.688 0.590 0.739 0.659
Noncohesive Soil 0.5 0.139 0.190 0.114 0.153 0.723 0.636 0.769 0.698
Noncohesive Soil 1 0.139 0.190 0.114 0.153 0.751 0.672 0.793 0.728
Noncohesive Soil 2 0.139 0.190 0.114 0.153 0.792 0.724 0.827 0.772
Load Factors Factored Forces (KN)
x' Ri
Bearing Pressure Ultimate Limit States 1

Force (KN) Moment(KN*m) Force Moment
860.12 1290.18 860.12 1290.18
818.16 1759.05 818.16 1759.05
349.92 1154.74 349.92 1154.74
213.84 117.61 213.84 117.61
2776.50 4164.75 2776.50 4164.75
2095.82 6916.21 2095.82 6916.21
225.12 1193.12 225.12 1193.12
137.55 715.24 137.55 715.24
187.11 617.46 187.11 617.46
4968.25 7452.38 4968.25 7452.38
0.00 0.00 0.00 0.00
0.00 0.00
0.00 0.00 0.00 0.00
361.85 1500.93 361.85 1500.93
1147.79 2414.95 1793.43 3773.37
244.80 1383.12 244.80 1383.12
Hf 1754.44 Hf 2400.07
Vf 12632.39 Vf 12632.39
M balancing 25380.75 M balancing 25380.75
M overturning 5299.01 M overturning 6657.42
Mb-Mo 20081.74 Mb-Mo 18723.33
P 12632.39 P 12632.39
L/2- (Mb-Mo)/Vf e 0.51 L/2- (Mb-Mo)/Vf e 0.62
B' 3.18 B' 2.96
Area 50.40 Area 50.40
Effective Area 38.15 Effective Area 35.57
Uniform Qf 331.10 Uniform Qf 355.12
Linear Total Area P/A 250.64 Linear P/A 250.64
My/I 182.72 My/I 221.22
Max 433.36 Max 471.86
Min 67.92 Min 29.42
D/B' 0.91 D/B' 0.98
Min Dead/Earth Min Dead/Max Earth

Force Moment Force Moment
1146.83 1720.24 1146.83 1720.24
1090.89 2345.41 1090.89 2345.41
466.56 1539.65 466.56 1539.65
285.12 156.82 285.12 156.82
3702.00 5553.00 3702.00 5553.00
3274.72 10806.58 3274.72 10806.58
300.16 1590.83 300.16 1590.83
183.40 953.66 183.40 953.66
249.48 823.28
4968.25 7452.38 4968.25 7452.38
0.00 0.00 0.00 0.00
0.00 0.00 0.00 0.00
0.00 0.00 0.00 0.00
361.85 1500.93 361.85 1500.93
1147.79 2414.95 1793.43 3773.37
244.80 1383.12 244.80 1383.12
Hf 1754.44 Hf 2400.07
Vf 15417.92 Vf 15667.40
M balancing 32118.56 M balancing 32941.84
M overturning 5299.01 M overturning 6657.42
Mb-Mo 26819.55 Mb-Mo 26284.42
P 15417.92 P 15667.40
L/2- (Mb-Mo)/Vf e 0.36 L/2- (Mb-Mo)/Vf e 0.42
B' 3.48 B' 3.36
Area 50.40 Area 50.40
Effective Area 41.75 Effective Area 40.26
Uniform Qf 369.31 Uniform Qf 389.12
Linear P/A 305.91 Linear P/A 310.86
My/I 157.54 My/I 187.56
Max 463.45 Max Kpa 498.42
Min 148.37 Min Kpa 123.30
D/B' 0.83 D/B' 0.86
Max Dead/Max EarthMax Dead/Min Earth

Concrete Wt. = 24.00 Heel Weight (KN)= 32.40 d=750-100-19.5/2=640.25
Heel Length: 1.80 Heel Weight at dv(KN)= 22.03 dv=640.25*0.9=576.22
Toe Length: 1.10 Toe Weight (KN)= 19.80 fcr=0.4Sqrt(f'c)= (0.4)sqrt(40))=2.53
Total Length: 4.20 Toe Weight at dv(KN)= 9.43
Thickness: 0.75 Soil Weight (KN)= 218.31 Vc=2.5βφcfcrbvdv
Soil Weight at dv (KN)= 148.43 Vc=2.5(0.18)(0.75)(2.53)(1000)(576.22)
Concrete Resistance Vc= 492.02 750 Vc=492.02
Uniform Pressure
Toe: Heel:
Toe Bearing Force 428.03 Heel Bearing 700.42
Toe Bearing Force at dv 203.81 Heel Bearing Force at dv 380.43
Toe Shear 194.39 Heel Shear 209.97
Toe Moment 224.53 Heel Moment 404.73
Linear Pressure
Heel Pressure: Heel Bearing at dv 232.60
Lower Boundary: 123.30
Upper Boundary: 284.07
Toe Pressure:
Lower Boundary: 400.18 Toe Bearing at dv 451.64
Upper Boundary: 498.42
Shear Calculations:
Heel:
Toe:
Bearing Force 1: 221.94 Bearing Force 1: 440.19
Bearing Force 2: 144.69 Bearing Force 2: 54.04
Factored Moment (Mf)= 60.92 Factored Moment (Mf): 257.74
Factored Shear at dv 47.32 Factored Shear at dv 239.38

Calculated Forces (KN) Moment Arm (m)
Min Max Min Max
Vertical Forces
D(Footing 1) 0.9 1.2 955.69 860.12 1146.83 1.50
D(Footing 2) 0.9 1.2 909.07 818.16 1090.89 2.15
D(Heel) 0.9 1.2 388.80 349.92 466.56 3.30
D(Toe) 0.9 1.2 237.60 213.84 285.12 0.55
D(super Structure) 0.9 1.2 3085.00 2776.50 3702.00 1.50
E (soil weight) 0.8 1.25 2619.78 2095.82 3274.72 3.30
Wingwall part 1 0.9 1.2 250.13 225.12 300.16 5.30
Wingwall part 2 0.9 1.2 152.83 137.55 183.40 5.20
Wingwall part 3 0.9 1.2 207.90 187.11 249.48 3.30
Live Load 1.6 1.6 2922.50 4676.00 4676.00 1.50
W(Vertical) 0 0 249.75 0.00 0.00 1.50
Horizontal Forces
Earthquake 0 0 153.75 0.00 0.00 4.15
Breaking Force 1.6 1.6 212.85 340.56 340.56 4.15
Earth Pressure 0.8 1.25 1434.74 1147.79 1793.43 2.10
Surcharge 1.6 1.6 144.00 230.40 230.40 5.65
Depth of soil 2.9
Bearing pressure allowed (Kpa) 600
D/B' governing 0.86
Reduction factor 0.7186
Maximum allowed uniform pressure 431.16
Max calculated uniform pressure 378.61 < 431.16 ok
Max calcuated linear pressure 482.84
Min calcuated linear pressure 127.28
Material Type D/B'
Min Dead/
Earth Min Dead/ Max Earth
Max Dead/
Min Earth
Max Dead/
Max Earth Min Dead/Earth
Min Dead/Max
Earth
Max Dead/Min
Earth
Max Dead/Max
Earth
Noncohesive Soil 0.125 0.139 0.192 0.112 0.154 0.659 0.553 0.719 0.628
Noncohesive Soil 0.25 0.139 0.192 0.112 0.154 0.687 0.587 0.743 0.658
Noncohesive Soil 0.5 0.139 0.192 0.112 0.154 0.723 0.634 0.773 0.697
Noncohesive Soil 1 0.139 0.192 0.112 0.154 0.751 0.669 0.796 0.727
Noncohesive Soil 2 0.139 0.192 0.112 0.154 0.791 0.722 0.830 0.772
Bearing Pressure Ultimate Limit States 2
x' Ri
Load Factors Factored Forces (KN)

Force (KN) Moment(KN*m) Force Moment
860.121 1290.18 860.12 1290.18
818.1648 1759.05 818.16 1759.05
349.92 1154.74 349.92 1154.74
213.84 117.61 213.84 117.61
2776.5 4164.75 2776.50 4164.75
2095.82208 6916.21 2095.82 6916.21
225.117 1193.12 225.12 1193.12
137.547 715.24 137.55 715.24
187.11 617.46 187.11 617.46
4676 7014.00 4676.00 7014.00
0 0.00 0.00 0.00
0.00 0.00
0 0.00 0.00 0.00
340.56 1412.64 340.56 1412.64
1147.792 2414.95 1793.43 3773.37
230.4 1301.76 230.40 1301.76
Hf 1718.75 Hf 2364.39
Vf 12340.14 Vf 12340.14
M balancing 24942.37 M balancing 24942.37
M overturning 5129.36 M overturning 6487.77
Mb-Mo 19813.02 Mb-Mo 18454.61
P 12340.14 P 12340.14
L/2- (Mb-Mo)/Vf e 0.49 L/2- (Mb-Mo)/Vf e 0.60
B' 3.21 B' 2.99
Area 50.40 Area 50.40
Effective Area 38.53 Effective Area 35.89
Uniform Qf 320.24 Uniform Qf 343.81
Linear Total Area P/A 244.84 Linear P/A 244.84
My/I 172.94 My/I 211.44
Max 417.78 Max 456.29
Min 71.91 Min 33.40
D/B' 0.90 D/B' 0.97
Min Dead/Earth Min Dead/Max Earth

Concrete Wt. = 24.00
Force Moment Force Moment Heel Length: 1.80
Toe Length: 1.10
1146.83 1720.24 1146.83 1720.24 Total Length: 4.20
1090.89 2345.41 1090.89 2345.41 Thickness: 0.75
466.56 1539.65 466.56 1539.65
285.12 156.82 285.12 156.82
3702.00 5553.00 3702.00 5553.00
3274.72 10806.58 3274.72 10806.58
300.16 1590.83 300.16 1590.83
183.40 953.66 183.40 953.66
249.48 823.28 249.48 823.28
4676.00 7014.00 4676.00 7014.00
0.00 0.00 0.00 0.00
0.00 0.00 0.00 0.00
0.00 0.00 0.00 0.00
340.56 1412.64 340.56 1412.64
1147.79 2414.95 1793.43 3773.37
230.40 1301.76 230.40 1301.76
Hf 1718.75 Hf 2364.39
Vf 15375.15 Vf 15375.15
M balancing 32503.46 M balancing 32503.46
M overturning 5129.36 M overturning 6487.77
Mb-Mo 27374.11 Mb-Mo 26015.70
P 15375.15 P 15375.15
L/2- (Mb-Mo)/Vf e 0.32 L/2- (Mb-Mo)/Vf e 0.41
B' 3.56 B' 3.38
Area 50.40 Area 50.40
Effective Area 42.73 Effective Area 40.61
Uniform Qf 359.82 Uniform Qf 378.61
Linear P/A 305.06 Linear P/A 305.06
My/I 139.28 My/I 177.78
Max 444.34 Max Kpa 482.84
Min 165.79 Min Kpa 127.28
D/B' 0.81 D/B' 0.86
Max Dead/Min Earth Max Dead/Max Earth

Calculated Forces (KN) Moment Arm (m)
Min Max Min Max
Vertical Forces
D(Footing 1) 0.9 1.2 955.69 860.12 1146.83 1.50
D(Footing 2) 0.9 1.2 909.07 818.16 1090.89 2.15
D(Heel) 0.9 1.2 388.80 349.92 466.56 3.30
D(Toe) 0.9 1.2 237.60 213.84 285.12 0.55
D(super Structure) 0.9 1.2 3085.00 2776.50 3702.00 1.50
E (soil weight) 0.8 1.25 2619.78 2095.82 3274.72 3.30
Wingwall part 1 0.9 1.2 250.13 225.12 300.16 5.30
Wingwall part 2 0.9 1.2 152.83 137.55 183.40 5.20
Wingwall part 3 0.9 1.2 207.90 187.11 249.48 3.30
Live Load 1.4 1.4 2922.50 4091.50 4091.50 1.50
W(Vertical) 0.5 0.5 249.75 124.88 124.88 1.50
Horizontal Forces
Earthquake 0 0 153.75 0.00 0.00 4.15
Breaking Force 1.4 1.4 212.85 297.99 297.99 4.15
Earth Pressure 0.8 1.25 1434.74 1147.79 1793.43 2.10
Surcharge 1.4 1.4 144.00 201.60 201.60 5.65
Depth of soil 2.9
Bearing pressure allowed (Kpa) 600
D/B' governing 0.84
Reduction factor 0.718
Maximum allowed uniform pressure 430.8
Max calculated uniform pressure 361.17 < 430.8 ok
Max calcuated linear pressure 456.29
Min calcuated linear pressure 135.60
Material Type D/B'
Min Dead/
Earth Min Dead/ Max Earth
Max Dead/
Min Earth
Max Dead/
Max Earth Min Dead/Earth
Min Dead/Max
Earth
Max Dead/Min
Earth
Max Dead/Max
Earth
Noncohesive Soil 0.125 0.139 0.193 0.110 0.154 0.660 0.550 0.722 0.628
Noncohesive Soil 0.25 0.139 0.193 0.110 0.154 0.688 0.585 0.746 0.658
Noncohesive Soil 0.5 0.139 0.193 0.110 0.154 0.724 0.631 0.775 0.697
Noncohesive Soil 1 0.139 0.193 0.110 0.154 0.752 0.667 0.798 0.728
Noncohesive Soil 2 0.139 0.193 0.110 0.154 0.792 0.720 0.831 0.772
Bearing Pressure Ultimate Limit States 3
x' Ri
Load Factors Factored Forces (KN)

Force (KN) Moment(KN*m) Force Moment
860.121 1290.18 860.12 1290.18
818.1648 1759.05 818.16 1759.05
349.92 1154.74 349.92 1154.74
213.84 117.61 213.84 117.61
2776.5 4164.75 2776.50 4164.75
2095.82208 6916.21 2095.82 6916.21
225.117 1193.12 225.12 1193.12
137.547 715.24 137.55 715.24
187.11 617.46 187.11 617.46
4091.5 6137.25 4091.50 6137.25
124.875 187.31 124.88 187.31
0.00 0.00
0 0.00 0.00 0.00
297.99 1236.06 297.99 1236.06
1147.792 2414.95 1793.43 3773.37
201.6 1139.04 201.60 1139.04
Hf 1647.38 Hf 2293.02
Vf 11880.52 Vf 11880.52
M balancing 24252.94 M balancing 24252.94
M overturning 4790.06 M overturning 6148.47
Mb-Mo 19462.88 Mb-Mo 18104.47
P 11880.52 P 11880.52
L/2- (Mb-Mo)/Vf e 0.46 L/2- (Mb-Mo)/Vf e 0.58
B' 3.28 B' 3.05
Area 50.40 Area 50.40
Effective Area 39.32 Effective Area 36.57
Uniform Qf 302.17 Uniform Qf 324.84
Linear Total Area P/A 235.72 Linear P/A 235.72
My/I 155.50 My/I 194.01
Max 391.23 Max 429.73
Min 80.22 Min 41.72
D/B' 0.89 D/B' 0.95
Min Dead/Earth Min Dead/Max Earth

Concrete Wt. = 24.00
Force Moment Force Moment Heel Length: 1.80
Toe Length: 1.10
1146.83 1720.24 1146.83 1720.24 Total Length: 4.20
1090.89 2345.41 1090.89 2345.41 Thickness: 0.75
466.56 1539.65 466.56 1539.65
285.12 156.82 285.12 156.82
3702.00 5553.00 3702.00 5553.00
3274.72 10806.58 3274.72 10806.58
300.16 1590.83 300.16 1590.83
183.40 953.66 183.40 953.66
249.48 823.28 249.48 823.28
4091.50 6137.25 4091.50 6137.25
124.88 187.31 124.88 187.31
0.00 0.00 0.00 0.00
0.00 0.00 0.00 0.00
297.99 1236.06 297.99 1236.06
1147.79 2414.95 1793.43 3773.37
201.60 1139.04 201.60 1139.04
Hf 1647.38 Hf 2293.02
Vf 14915.52 Vf 14915.52
M balancing 31814.03 M balancing 31814.03
M overturning 4790.06 M overturning 6148.47
Mb-Mo 27023.97 Mb-Mo 25665.56
P 14915.52 P 14915.52
L/2- (Mb-Mo)/Vf e 0.29 L/2- (Mb-Mo)/Vf e 0.38
B' 3.62 B' 3.44
Area 50.40 Area 50.40
Effective Area 43.48 Effective Area 41.30
Uniform Qf 343.02 Uniform Qf 361.17
Linear P/A 295.94 Linear P/A 295.94
My/I 121.84 My/I 160.35
Max 417.79 Max Kpa 456.29
Min 174.10 Min Kpa 135.60
D/B' 0.80 D/B' 0.84
Max Dead/Min Earth Max Dead/Max Earth

Calculated Forces (KN) Moment Arm (m)
Min Max Min Max
Vertical Forces
D(Footing 1) 0.9 1.2 955.69 860.12 1146.83 1.50
D(Footing 2) 0.9 1.2 909.07 818.16 1090.89 2.15
D(Heel) 0.9 1.2 388.80 349.92 466.56 3.30
D(Toe) 0.9 1.2 237.60 213.84 285.12 0.55
D(super Structure) 0.9 1.2 3085.00 2776.50 3702.00 1.50
E (soil weight) 0.8 1.25 2619.78 2095.82 3274.72 3.30
Wingwall part 1 0.9 1.2 250.13 225.12 300.16 5.30
Wingwall part 2 0.9 1.2 152.83 137.55 183.40 5.20
Wingwall part 3 0.9 1.2 207.90 187.11 249.48 3.30
Live Load 0 0 2922.50 0.00 0.00 1.50
W(Vertical) 1.65 1.65 249.75 412.09 412.09 1.50
Horizontal Forces
Earthquake 0 0 153.75 0.00 0.00 4.15
Breaking Force 0 0 212.85 0.00 0.00 4.15
Earth Pressure 0.8 1.25 1434.74 1147.79 1793.43 2.10
Surcharge 0 0 144.00 0.00 0.00 5.65
Depth of soil 2.9
Bearing pressure allowed (Kpa) 600
D/B' governing 0.72
Reduction factor 0.698
Maximum allowed uniform pressure 418.8
Max calculated uniform pressure 230.33 < 418.8 ok
Max calcuated linear pressure 248.79
Min calcuated linear pressure 192.13
Material Type D/B'
Min Dead/
Earth Min Dead/ Max Earth
Max Dead/ Min
Earth
Max Dead/
Max Earth Min Dead/Earth
Min Dead/Max
Earth Max Dead/Min Earth
Max Dead/Max
Earth
Noncohesive Soil 0.125 0.142 0.222 0.103 0.161 0.653 0.497 0.739 0.612
Noncohesive Soil 0.25 0.142 0.222 0.103 0.161 0.681 0.534 0.761 0.643
Noncohesive Soil 0.5 0.142 0.222 0.103 0.161 0.718 0.585 0.789 0.684
Noncohesive Soil 1 0.142 0.222 0.103 0.161 0.746 0.625 0.811 0.715
Noncohesive Soil 2 0.142 0.222 0.103 0.161 0.787 0.684 0.842 0.761
Bearing Pressure Ultimate Limit States 4
x' Ri
Load Factors Factored Forces (KN)

Force (KN) Moment(KN*m) Force Moment
860.121 1290.18 860.12 1290.18
818.1648 1759.05 818.16 1759.05
349.92 1154.74 349.92 1154.74
213.84 117.61 213.84 117.61
2776.5 4164.75 2776.50 4164.75
2095.82208 6916.21 2095.82 6916.21
225.117 1193.12 225.12 1193.12
137.547 715.24 137.55 715.24
187.11 617.46 187.11 617.46
0 0.00 0.00 0.00
412.0875 618.13 412.09 618.13
0.00 0.00
0 0.00 0.00 0.00
0 0.00 0.00 0.00
1147.792 2414.95 1793.43 3773.37
0 0.00 0.00 0.00
Hf 1147.79 Hf 1793.43
Vf 8076.23 Vf 8076.23
M balancing 18546.51 M balancing 18546.51
M overturning 2414.95 M overturning 3773.37
Mb-Mo 16131.55 Mb-Mo 14773.14
P 8076.23 P 8076.23
L/2- (Mb-Mo)/Vf e 0.10 L/2- (Mb-Mo)/Vf e 0.27
B' 3.99 B' 3.66
Area 50.40 Area 50.40
Effective Area 47.94 Effective Area 43.90
Uniform Qf 168.47 Uniform Qf 183.96
Linear Total Area P/A 160.24 Linear P/A 160.24
My/I 23.48 My/I 61.99
Max 183.73 Max 222.23
Min 136.76 Min 98.25
D/B' 0.73 D/B' 0.79
Min Dead/Earth Min Dead/Max Earth

Concrete Wt. = 24.00
Force Moment Force Moment Heel Length: 1.80
Toe Length: 1.10
1146.83 1720.24 1146.83 1720.24 Total Length: 4.20
1090.89 2345.41 1090.89 2345.41 Thickness: 0.75
466.56 1539.65 466.56 1539.65
285.12 156.82 285.12 156.82
3702.00 5553.00 3702.00 5553.00
3274.72 10806.58 3274.72 10806.58
300.16 1590.83 300.16 1590.83
183.40 953.66 183.40 953.66
249.48 823.28 249.48 823.28
0.00 0.00 0.00 0.00
412.09 618.13 412.09 618.13
0.00 0.00 0.00 0.00
0.00 0.00 0.00 0.00
0.00 0.00 0.00 0.00
1147.79 2414.95 1793.43 3773.37
0.00 0.00 0.00 0.00
Hf 1147.79 Hf 1793.43
Vf 11111.24 Vf 11111.24
M balancing 26107.60 M balancing 26107.60
M overturning 2414.95 M overturning 3773.37
Mb-Mo 23692.64 Mb-Mo 22334.23
P 11111.24 P 11111.24
L/2- (Mb-Mo)/Vf e -0.03 L/2- (Mb-Mo)/Vf e 0.09
B' 4.26 B' 4.02
Area 50.40 Area 50.40
Effective Area 51.18 Effective Area 48.24
Uniform Qf 217.12 Uniform Qf 230.33
Linear P/A 220.46 Linear P/A 220.46
My/I -10.18 My/I 28.33
Max 210.28 Max Kpa 248.79
Min 230.64 Min Kpa 192.13
D/B' 0.68 D/B' 0.72
Max Dead/Max EarthMax Dead/Min Earth

Calculated Forces (KN) Moment Arm (m)
Min Max Min Max
Vertical Forces
D(Footing 1) 0.8 1.25 955.69 764.55 1194.61 1.50
D(Footing 2) 0.8 1.25 909.07 727.26 1136.34 2.15
D(Heel) 0.8 1.25 388.80 311.04 486.00 3.30
D(Toe) 0.8 1.25 237.60 190.08 297.00 0.55
D(super Structure) 0.8 1.25 3085.00 2468.00 3856.25 1.50
E (soil weight) 0.8 1.25 2619.78 2095.82 3274.72 3.30
Wingwall part 1 0.8 1.25 250.13 200.10 312.66 5.30
Wingwall part 2 0.8 1.25 152.83 122.26 191.04 5.20
Wingwall part 3 0.8 1.25 207.90 166.32 259.88 3.30
Live Load 0 0 2922.50 0.00 0.00 1.50
W(Vertical) 0 0 249.75 0.00 0.00 1.50
Horizontal Forces
Earthquake 1 1 153.75 153.75 153.75 4.15
Breaking Force 0 0 212.85 0.00 0.00 4.15
Earth Pressure 0.8 1.25 1434.74 1147.79 1793.43 2.10
Surcharge 0 0 144.00 0.00 0.00 5.65
Depth of soil 2.9
Bearing pressure allowed (Kpa) 600
D/B' governing 0.74
Reduction factor 0.673
Maximum allowed uniform pressure 403.8
Max calculated uniform pressure 232.80 < 403.8 ok
Max calcuated linear pressure 258.89
Min calcuated linear pressure 177.95
Material Type D/B'
Min Dead/
Earth Min Dead/ Max Earth
Max Dead/
Min Earth
Max Dead/ Max
Earth Min Dead/Earth
Min Dead/Max
Earth Max Dead/Min Earth
Max Dead/Max
Earth
Noncohesive Soil 0.125 0.185 0.276 0.118 0.177 0.566 0.407 0.705 0.581
Noncohesive Soil 0.25 0.185 0.276 0.118 0.177 0.600 0.447 0.730 0.614
Noncohesive Soil 0.5 0.185 0.276 0.118 0.177 0.645 0.507 0.761 0.658
Noncohesive Soil 1 0.185 0.276 0.118 0.177 0.680 0.551 0.785 0.691
Noncohesive Soil 2 0.185 0.276 0.118 0.177 0.731 0.621 0.820 0.741
Bearing Pressure Ultimate Limit States 5
x' Ri
Load Factors Factored Forces (KN)

Force (KN) Moment(KN*m) Force Moment
764.552 1146.83 764.55 1146.83
727.2576 1563.60 727.26 1563.60
311.04 1026.43 311.04 1026.43
190.08 104.54 190.08 104.54
2468 3702.00 2468.00 3702.00
2095.82208 6916.21 2095.82 6916.21
200.104 1060.55 200.10 1060.55
122.264 635.77 122.26 635.77
166.32 548.86 166.32 548.86
0 0.00 0.00 0.00
0 0.00 0.00 0.00
0.00 0.00
153.75 637.76 153.75 637.76
0 0.00 0.00 0.00
1147.792 2414.95 1793.43 3773.37
0 0.00 0.00 0.00
Hf 1301.54 Hf 1947.18
Vf 7045.44 Vf 7045.44
M balancing 16704.80 M balancing 16704.80
M overturning 3052.71 M overturning 4411.12
Mb-Mo 13652.09 Mb-Mo 12293.68
P 7045.44 P 7045.44
L/2- (Mb-Mo)/Vf e 0.16 L/2- (Mb-Mo)/Vf e 0.36
B' 3.88 B' 3.49
Area 50.40 Area 50.40
Effective Area 46.51 Effective Area 41.88
Uniform Qf 151.50 Uniform Qf 168.24
Linear Total Area P/A 139.79 Linear P/A 139.79
My/I 32.41 My/I 70.91
Max 172.20 Max 210.70
Min 107.38 Min 68.88
D/B' 0.75 D/B' 0.83
Min Dead/Earth Min Dead/Max Earth

Concrete Wt. = 24.00
Force Moment Force Moment Heel Length: 1.80
Toe Length: 1.10
1194.61 1791.92 1194.61 1791.92 Total Length: 4.20
1136.34 2443.13 1136.34 2443.13 Thickness: 0.75
486.00 1603.80 486.00 1603.80
297.00 163.35 297.00 163.35
3856.25 5784.38 3856.25 5784.38
3274.72 10806.58 3274.72 10806.58
312.66 1657.11 312.66 1657.11
191.04 993.40 191.04 993.40
259.88 857.59 259.88 857.59
0.00 0.00 0.00 0.00
0.00 0.00 0.00 0.00
0.00 0.00 0.00 0.00
153.75 637.76 153.75 637.76
0.00 0.00 0.00 0.00
1147.79 2414.95 1793.43 3773.37
0.00 0.00 0.00 0.00
Hf 1301.54 Hf 1947.18
Vf 11008.50 Vf 11008.50
M balancing 26101.25 M balancing 26101.25
M overturning 3052.71 M overturning 4411.12
Mb-Mo 23048.54 Mb-Mo 21690.13
P 11008.50 P 11008.50
L/2- (Mb-Mo)/Vf e 0.01 L/2- (Mb-Mo)/Vf e 0.13
B' 4.19 B' 3.94
Area 50.40 Area 50.40
Effective Area 50.25 Effective Area 47.29
Uniform Qf 219.08 Uniform Qf 232.80
Linear P/A 218.42 Linear P/A 218.42
My/I 1.96 My/I 40.47
Max 220.39 Max Kpa 258.89
Min 216.46 Min Kpa 177.95
D/B' 0.69 D/B' 0.74
Max Dead/Max EarthMax Dead/Min Earth

Calculated Forces (KN) Moment Arm (m)
Min Max Min Max
Vertical Forces
D(Footing 1) 0.9 1.2 955.69 860.12 1146.83 1.50
D(Footing 2) 0.9 1.2 909.07 818.16 1090.89 2.15
D(Heel) 0.9 1.2 388.80 349.92 466.56 3.30
D(Toe) 0.9 1.2 237.60 213.84 285.12 0.55
D(super Structure) 0.9 1.2 3085.00 2776.50 3702.00 1.50
E (soil weight) 0.8 1.25 2619.78 2095.82 3274.72 3.30
Wingwall part 1 0.9 1.2 250.13 225.12 300.16 5.30
Wingwall part 2 0.9 1.2 152.83 137.55 183.40 5.20
Wingwall part 3 0.9 1.2 207.90 187.11 249.48 3.30
Live Load 0 0 2922.50 0.00 0.00 1.50
W(Vertical) 0.9 0.9 249.75 224.78 224.78 1.50
Horizontal Forces
Earthquake 1 1 153.75 153.75 153.75 4.15
Breaking Force 0 0 212.85 0.00 0.00 4.15
Earth Pressure 0.8 1.25 1434.74 1147.79 1793.43 2.10
Surcharge 0 0 144.00 0.00 0.00 5.65
Depth of soil 2.9
Bearing pressure allowed (Kpa) 600
D/B' governing 0.74
Reduction factor 0.672
Maximum allowed uniform pressure 403.2
Max calculated uniform pressure 232.18 < 403.2ok
Max calcuated linear pressure 259.96
Min calcuated linear pressure 173.53
Material Type D/B'
Min Dead/
Earth Min Dead/ Max Earth
Max Dead/
Min Earth
Max Dead/ Max
Earth Min Dead/Earth
Min Dead/Max
Earth Max Dead/Min Earth
Max Dead/Max
Earth
Noncohesive Soil 0.125 0.165 0.247 0.119 0.178 0.605 0.454 0.703 0.579
Noncohesive Soil 0.25 0.165 0.247 0.119 0.178 0.637 0.493 0.728 0.612
Noncohesive Soil 0.5 0.165 0.247 0.119 0.178 0.678 0.548 0.759 0.656
Noncohesive Soil 1 0.165 0.247 0.119 0.178 0.710 0.591 0.784 0.689
Noncohesive Soil 2 0.165 0.247 0.119 0.178 0.757 0.655 0.819 0.739
Bearing Pressure Ultimate Limit States 7
x' Ri
Load Factors Factored Forces (KN)

Force (KN) Moment(KN*m) Force Moment
860.121 1290.18 860.12 1290.18
818.1648 1759.05 818.16 1759.05
349.92 1154.74 349.92 1154.74
213.84 117.61 213.84 117.61
2776.5 4164.75 2776.50 4164.75
2095.82208 6916.21 2095.82 6916.21
225.117 1193.12 225.12 1193.12
137.547 715.24 137.55 715.24
187.11 617.46 187.11 617.46
0.00
0 0.00 0.00 0.00
224.775 337.16 224.78 337.16
0.00 0.00
153.75 637.76 153.75 637.76
0 0.00 0.00 0.00
1147.792 2414.95 1793.43 3773.37
0 0.00 0.00 0.00
Hf 1301.54 Hf 1947.18
Vf 7888.92 Vf 7888.92
M balancing 18265.54 M balancing 18265.54
M overturning 3052.71 M overturning 4411.12
Mb-Mo 15212.83 Mb-Mo 13854.42
P 7888.92 P 7888.92
L/2- (Mb-Mo)/Vf e 0.17 L/2- (Mb-Mo)/Vf e 0.34
B' 3.86 B' 3.51
Area 50.40 Area 50.40
Effective Area 46.28 Effective Area 42.15
Uniform Qf 170.46 Uniform Qf 187.17
Linear Total Area P/A 156.53 Linear P/A 156.53
My/I 38.38 My/I 76.88
Max 194.90 Max 233.41
Min 118.15 Min 79.65
D/B' 0.75 D/B' 0.83
Min Dead/Earth Min Dead/Max Earth

Concrete Wt. = 24.00
Force Moment Force Moment Heel Length: 1.80
Toe Length: 1.10
1146.83 1720.24 1146.83 1720.24 Total Length: 4.20
1090.89 2345.41 1090.89 2345.41 Thickness: 0.75
466.56 1539.65 466.56 1539.65
285.12 156.82 285.12 156.82
3702.00 5553.00 3702.00 5553.00
3274.72 10806.58 3274.72 10806.58
300.16 1590.83 300.16 1590.83
183.40 953.66 183.40 953.66
249.48 823.28 249.48 823.28
0.00 0.00
0.00 0.00 0.00 0.00
224.78 337.16 224.78 337.16
0.00 0.00 0.00 0.00
153.75 637.76 153.75 637.76
0.00 0.00 0.00 0.00
1147.79 2414.95 1793.43 3773.37
0.00 0.00 0.00 0.00
Hf 1301.54 Hf 1947.18
Vf 10923.92 Vf 10923.92
M balancing 25826.63 M balancing 25826.63
M overturning 3052.71 M overturning 4411.12
Mb-Mo 22773.92 Mb-Mo 21415.51
P 10923.92 P 10923.92
L/2- (Mb-Mo)/Vf e 0.02 L/2- (Mb-Mo)/Vf e 0.14
B' 4.17 B' 3.92
Area 50.40 Area 50.40
Effective Area 50.03 Effective Area 47.05
Uniform Qf 218.33 Uniform Qf 232.18
Linear P/A 216.74 Linear P/A 216.74
My/I 4.71 My/I 43.22
Max 221.46 Max Kpa 259.96
Min 212.03 Min Kpa 173.53
D/B' 0.70 D/B' 0.74
Max Dead/Max EarthMax Dead/Min Earth
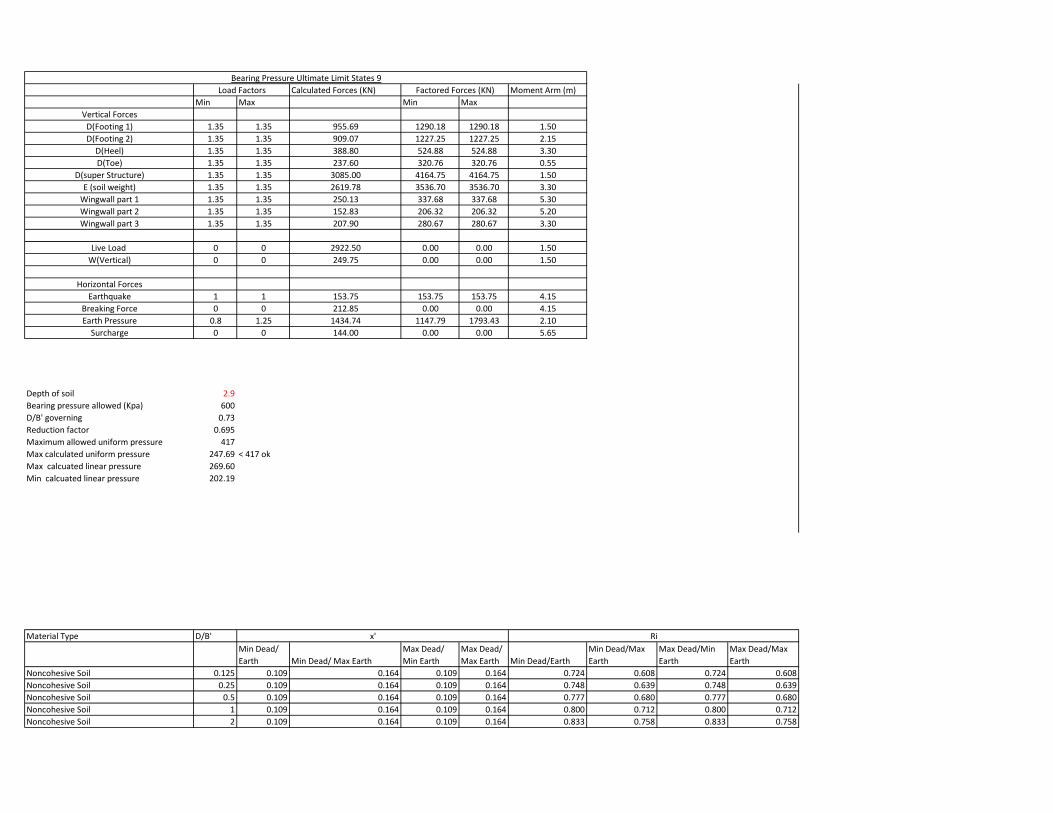
Calculated Forces (KN) Moment Arm (m)
Min Max Min Max
Vertical Forces
D(Footing 1) 1.35 1.35 955.69 1290.18 1290.18 1.50
D(Footing 2) 1.35 1.35 909.07 1227.25 1227.25 2.15
D(Heel) 1.35 1.35 388.80 524.88 524.88 3.30
D(Toe) 1.35 1.35 237.60 320.76 320.76 0.55
D(super Structure) 1.35 1.35 3085.00 4164.75 4164.75 1.50
E (soil weight) 1.35 1.35 2619.78 3536.70 3536.70 3.30
Wingwall part 1 1.35 1.35 250.13 337.68 337.68 5.30
Wingwall part 2 1.35 1.35 152.83 206.32 206.32 5.20
Wingwall part 3 1.35 1.35 207.90 280.67 280.67 3.30
Live Load 0 0 2922.50 0.00 0.00 1.50
W(Vertical) 0 0 249.75 0.00 0.00 1.50
Horizontal Forces
Earthquake 1 1 153.75 153.75 153.75 4.15
Breaking Force 0 0 212.85 0.00 0.00 4.15
Earth Pressure 0.8 1.25 1434.74 1147.79 1793.43 2.10
Surcharge 0 0 144.00 0.00 0.00 5.65
Depth of soil 2.9
Bearing pressure allowed (Kpa) 600
D/B' governing 0.73
Reduction factor 0.695
Maximum allowed uniform pressure 417
Max calculated uniform pressure 247.69 < 417 ok
Max calcuated linear pressure 269.60
Min calcuated linear pressure 202.19
Material Type D/B'
Min Dead/
Earth Min Dead/ Max Earth
Max Dead/
Min Earth
Max Dead/
Max Earth Min Dead/Earth
Min Dead/Max
Earth
Max Dead/Min
Earth
Max Dead/Max
Earth
Noncohesive Soil 0.125 0.109 0.164 0.109 0.164 0.724 0.608 0.724 0.608
Noncohesive Soil 0.25 0.109 0.164 0.109 0.164 0.748 0.639 0.748 0.639
Noncohesive Soil 0.5 0.109 0.164 0.109 0.164 0.777 0.680 0.777 0.680
Noncohesive Soil 1 0.109 0.164 0.109 0.164 0.800 0.712 0.800 0.712
Noncohesive Soil 2 0.109 0.164 0.109 0.164 0.833 0.758 0.833 0.758
Bearing Pressure Ultimate Limit States 9
x' Ri
Load Factors Factored Forces (KN)

Force (KN) Moment(KN*m) Force Moment
1290.1815 1935.27 1290.18 1935.27
1227.2472 2638.58 1227.25 2638.58
524.88 1732.10 524.88 1732.10
320.76 176.42 320.76 176.42
4164.75 6247.13 4164.75 6247.13
3536.69976 11671.11 3536.70 11671.11
337.6755 1789.68 337.68 1789.68
206.3205 1072.87 206.32 1072.87
280.665 926.19 280.67 926.19
0 0.00 0.00 0.00
0 0.00 0.00 0.00
0.00 0.00
153.75 637.76 153.75 637.76
0 0.00 0.00 0.00
1147.792 2414.95 1793.43 3773.37
0 0.00 0.00 0.00
Hf 1301.54 Hf 1947.18
Vf 11889.18 Vf 11889.18
M balancing 28189.35 M balancing 28189.35
M overturning 3052.71 M overturning 4411.12
Mb-Mo 25136.64 Mb-Mo 23778.23
P 11889.18 P 11889.18
L/2- (Mb-Mo)/Vf e -0.01 L/2- (Mb-Mo)/Vf e 0.10
B' 4.23 B' 4.00
Area 50.40 Area 50.40
Effective Area 50.74 Effective Area 48.00
Uniform Qf 234.31 Uniform Qf 247.69
Linear Total Area P/A 235.90 Linear P/A 235.90
My/I -4.80 My/I 33.70
Max 231.10 Max 269.60
Min 240.70 Min 202.19
D/B' 0.69 D/B' 0.73
Min Dead/Max EarthMin Dead/Earth

Concrete Wt. = 24.00
Force Moment Force Moment Heel Length: 1.80
Toe Length: 1.10
1290.18 1935.27 1290.18 1935.27 Total Length: 4.20
1227.25 2638.58 1227.25 2638.58 Thickness: 0.75
524.88 1732.10 524.88 1732.10
320.76 176.42 320.76 176.42
4164.75 6247.13 4164.75 6247.13
3536.70 11671.11 3536.70 11671.11
337.68 1789.68 337.68 1789.68
206.32 1072.87 206.32 1072.87
280.67 926.19 280.67 926.19
0.00 0.00 0.00 0.00
0.00 0.00 0.00 0.00
0.00 0.00 0.00 0.00
153.75 637.76 153.75 637.76
0.00 0.00 0.00 0.00
1147.79 2414.95 1793.43 3773.37
0.00 0.00 0.00 0.00
Hf 1301.54 Hf 1947.18
Vf 11889.18 Vf 11889.18
M balancing 28189.35 M balancing 28189.35
M overturning 3052.71 M overturning 4411.12
Mb-Mo 25136.64 Mb-Mo 23778.23
P 11889.18 P 11889.18
L/2- (Mb-Mo)/Vf e -0.01 L/2- (Mb-Mo)/Vf e 0.10
B' 4.23 B' 4.00
Area 50.40 Area 50.40
Effective Area 50.74 Effective Area 48.00
Uniform Qf 234.31 Uniform Qf 247.69
Linear P/A 235.90 Linear P/A 235.90
My/I -4.80 My/I 33.70
Max 231.10 Max Kpa 269.60
Min 240.70 Min Kpa 202.19
D/B' 0.69 D/B' 0.73
Max Dead/Max EarthMax Dead/Min Earth
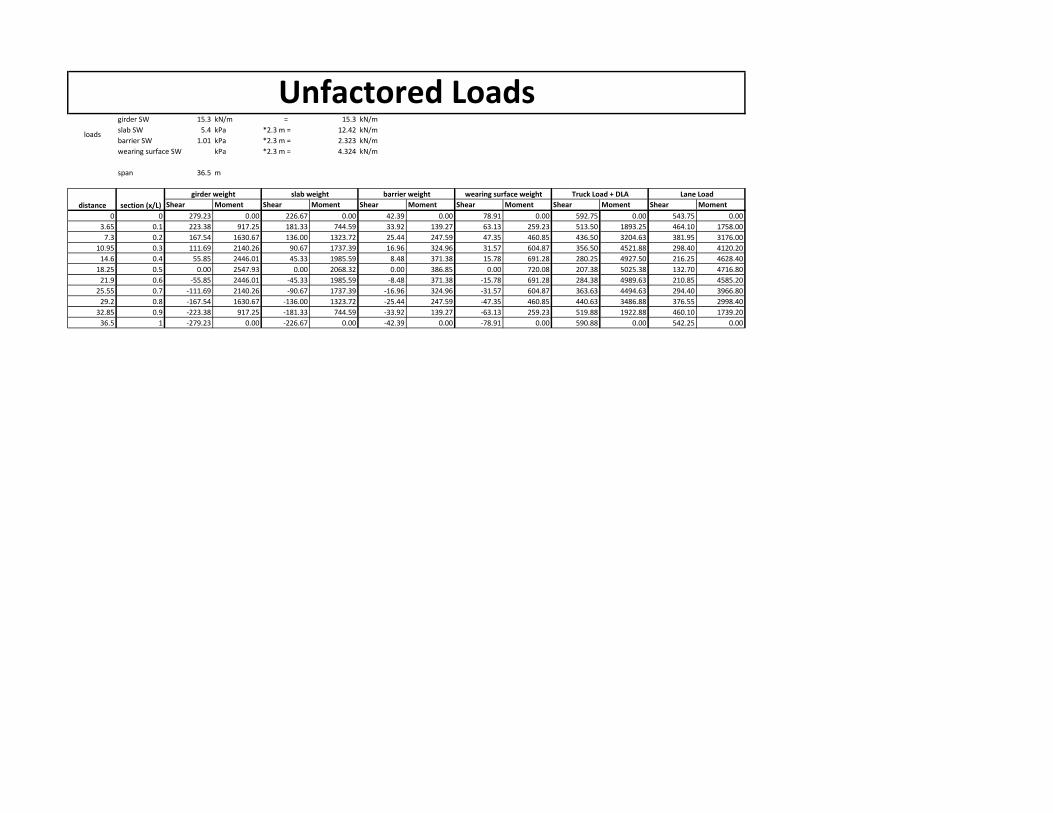
girder SW 15.3 kN/m = 15.3 kN/m
slab SW 5.4 kPa *2.3 m = 12.42 kN/m
barrier SW 1.01 kPa *2.3 m = 2.323 kN/m
wearing surface SW kPa *2.3 m = 4.324 kN/m
span 36.5 m
Shear Moment Shear Moment Shear Moment Shear Moment Shear Moment Shear Moment
0 0 279.23 0.00 226.67 0.00 42.39 0.00 78.91 0.00 592.75 0.00 543.75 0.00
3.65 0.1 223.38 917.25 181.33 744.59 33.92 139.27 63.13 259.23 513.50 1893.25 464.10 1758.00
7.3 0.2 167.54 1630.67 136.00 1323.72 25.44 247.59 47.35 460.85 436.50 3204.63 381.95 3176.00
10.95 0.3 111.69 2140.26 90.67 1737.39 16.96 324.96 31.57 604.87 356.50 4521.88 298.40 4120.20
14.6 0.4 55.85 2446.01 45.33 1985.59 8.48 371.38 15.78 691.28 280.25 4927.50 216.25 4628.40
18.25 0.5 0.00 2547.93 0.00 2068.32 0.00 386.85 0.00 720.08 207.38 5025.38 132.70 4716.80
21.9 0.6 -55.85 2446.01 -45.33 1985.59 -8.48 371.38 -15.78 691.28 284.38 4989.63 210.85 4585.20
25.55 0.7 -111.69 2140.26 -90.67 1737.39 -16.96 324.96 -31.57 604.87 363.63 4494.63 294.40 3966.80
29.2 0.8 -167.54 1630.67 -136.00 1323.72 -25.44 247.59 -47.35 460.85 440.63 3486.88 376.55 2998.40
32.85 0.9 -223.38 917.25 -181.33 744.59 -33.92 139.27 -63.13 259.23 519.88 1922.88 460.10 1739.20
36.5 1 -279.23 0.00 -226.67 0.00 -42.39 0.00 -78.91 0.00 590.88 0.00 542.25 0.00
Unfactored Loads
Truck Load + DLA Lane Load
loads
girder weight slab weight barrier weight wearing surface weight
distance section (x/L)
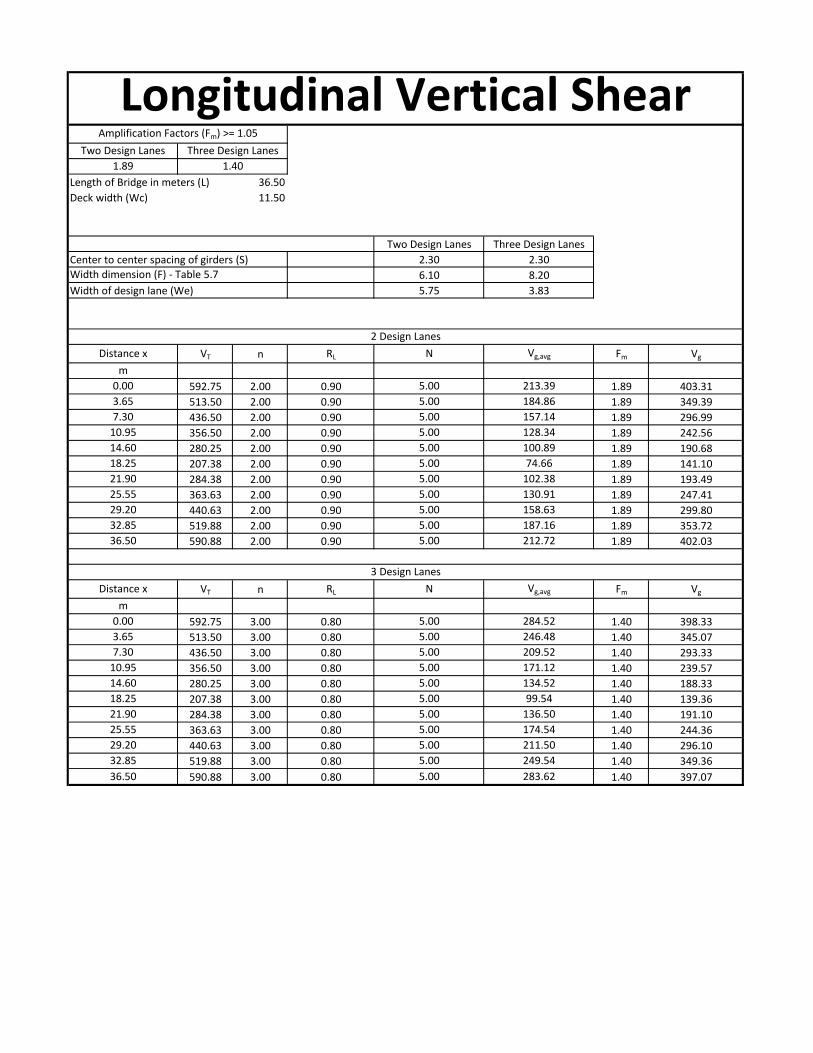
Length of Bridge in meters (L) 36.50
Deck width (Wc) 11.50
Center to center spacing of girders (S)
VT n RL Fm Vg
592.75 2.00 0.90 1.89 403.31
513.50 2.00 0.90 1.89 349.39
436.50 2.00 0.90 1.89 296.99
356.50 2.00 0.90 1.89 242.56
280.25 2.00 0.90 1.89 190.68
207.38 2.00 0.90 1.89 141.10
284.38 2.00 0.90 1.89 193.49
363.63 2.00 0.90 1.89 247.41
440.63 2.00 0.90 1.89 299.80
519.88 2.00 0.90 1.89 353.72
590.88 2.00 0.90 1.89 402.03
VT n RL Fm Vg
592.75 3.00 0.80 1.40 398.33
513.50 3.00 0.80 1.40 345.07
436.50 3.00 0.80 1.40 293.33
356.50 3.00 0.80 1.40 239.57
280.25 3.00 0.80 1.40 188.33
207.38 3.00 0.80 1.40 139.36
284.38 3.00 0.80 1.40 191.10
363.63 3.00 0.80 1.40 244.36
440.63 3.00 0.80 1.40 296.10
519.88 3.00 0.80 1.40 349.36
590.88 3.00 0.80 1.40 397.07
Longitudinal Vertical Shear1.89 1.40
32.85 5.00 249.54
36.50 5.00 283.62
25.55 5.00 174.54
29.20 5.00 211.50
18.25 5.00 99.54
21.90 5.00 136.50
10.95 5.00 171.12
14.60 5.00 134.52
3.65 5.00 246.48
7.30 5.00 209.52
m
0.00 5.00 284.52
3 Design Lanes
Distance x N Vg,avg
32.85 5.00 187.16
36.50 5.00 212.72
25.55 5.00 130.91
29.20 5.00 158.63
18.25 5.00 74.66
21.90 5.00 102.38
10.95 5.00 128.34
14.60 5.00 100.89
3.65 5.00 184.86
7.30 5.00 157.14
m
0.00 5.00 213.39
2 Design Lanes
Distance x N Vg,avg
Width of design lane (We) 5.75 3.83
2.30 2.30
Width dimension (F) - Table 5.7 6.10 8.20
Amplification Factors (Fm) >= 1.05
Two Design Lanes Three Design Lanes
Two Design Lanes Three Design Lanes

Internal External Internal External
1.54 1.57 1.18 1.24
Length of Bridge in meters (L)= 36.50
Deck width (Wc) 11.50
Center to center spacing of girders (S)
Internal Beams
External Beams
Internal Beams
External Beams
u for lane width correction factor
Internal Beams
External Beams
MT n RL Fm Mg
0.00 2.00 0.90 1.57 0.00
1893.25 2.00 0.90 1.57 1070.06
3204.63 2.00 0.90 1.57 1811.25
4521.88 2.00 0.90 1.57 2555.76
4927.50 2.00 0.90 1.57 2785.02
5025.38 2.00 0.90 1.57 2840.34
4989.63 2.00 0.90 1.57 2820.14
4494.63 2.00 0.90 1.57 2540.36
3486.88 2.00 0.90 1.57 1970.78
1922.88 2.00 0.90 1.57 1086.81
0.00 2.00 0.90 1.57 0.00
MT n RL Fm Mg
0.00 3.00 0.80 1.24 0.00
1893.25 3.00 0.80 1.24 1126.86
3204.63 3.00 0.80 1.24 1907.39
4521.88 3.00 0.80 1.24 2691.42
4927.50 3.00 0.80 1.24 2932.85
5025.38 3.00 0.80 1.24 2991.10
4989.63 3.00 0.80 1.24 2969.82
4494.63 3.00 0.80 1.24 2675.20
3486.88 3.00 0.80 1.24 2075.39
1922.88 3.00 0.80 1.24 1144.50
0.00 3.00 0.80 1.24 0.00
Longitudinal Bending Moments
8.59
2.30
Width dimension (F) - Table 5.3
Percentage correction factor (Cf)
Distance x
m
3.65
lane width correction factor
Two Design Lanes
2.30
6.82
6.72
Width of design lane (We)
Three Design Lanes
9.02
1153.67
5.75 3.83
9.32
9.32
0.89
1.08
N
5.00
1.08
Mg,avg
681.57
2395.02
2157.42
1673.70
922.98
0.00
1627.88
1773.90
1809.14
1796.27
1618.07
1255.28
692.24
0.00
Mg,avg
9.32
9.32
1.00
1.09
1.09
5.00
5.00
5.00
5.00
5.00
5.00
5.00
5.00
0.00
908.76
1538.22
Two Design Lanes Three Design Lanes
Amplification Factors (Fm) >= 1.05
5.00
5.00
5.00
5.00
N
5.00
5.00
5.00
5.00
7.30
10.95
14.60
0.00 5.00 0.00
2 Design Lanes
18.25
21.90
25.55
29.20
32.85
36.50
3 Design Lanes
Distance x
5.00
5.00
5.00
5.00
2170.50
2365.20
2412.1818.25
21.90
25.55
29.20
32.85
36.50
m
0.00
3.65
7.30
10.95
14.60

SLS Combonation 1 Load Factors
1
1
1
1
0.9
girder SW 15.3 kN/m = 15.3 kN/m
slab SW 5.4 kPa *2.3 m = 12.42 kN/m
barrier SW 1.01 kPa *2.3 m = 2.323 kN/m
wearing surface SW 2.59 kPa *2.3 m = 5.957 kN/m
span 36.5 m
Shear Moment Shear Moment Shear Moment Shear Moment Shear Moment Shear Moment
0 0 279.23 0.00 226.67 0.00 42.39 0.00 108.72 0.00 533.48 0.00 489.38 0.00
3.65 0.1 223.38 917.25 181.33 744.59 33.92 139.27 86.97 357.13 462.15 1703.93 417.69 1582.20
7.3 0.2 167.54 1630.67 136.00 1323.72 25.44 247.59 65.23 634.90 392.85 2884.16 343.76 2858.40
10.95 0.3 111.69 2140.26 90.67 1737.39 16.96 324.96 43.49 833.30 320.85 4069.69 268.56 3708.18
14.6 0.4 55.85 2446.01 45.33 1985.59 8.48 371.38 21.74 952.35 252.23 4434.75 194.63 4165.56
18.25 0.5 0.00 2547.93 0.00 2068.32 0.00 386.85 0.00 992.03 186.64 4522.84 119.43 4245.12
21.9 0.6 -55.85 2446.01 -45.33 1985.59 -8.48 371.38 -21.74 952.35 255.94 4490.66 189.77 4126.68
25.55 0.7 -111.69 2140.26 -90.67 1737.39 -16.96 324.96 -43.49 833.30 327.26 4045.16 264.96 3570.12
29.2 0.8 -167.54 1630.67 -136.00 1323.72 -25.44 247.59 -65.23 634.90 396.56 3138.19 338.90 2698.56
32.85 0.9 -223.38 917.25 -181.33 744.59 -33.92 139.27 -86.97 357.13 467.89 1730.59 414.09 1565.28
36.5 1 -279.23 0.00 -226.67 0.00 -42.39 0.00 -108.72 0.00 531.79 0.00 488.03 0.00
At Transfer (Beam SW +Prestressing forces)
fsj 1450 MPa
fst 1376 MPa
Truck Load + DLA Lane Load
loads
distance section (x/L)
girder weight slab weight wearing surface weightbarrier weight
Live Load
SLS DesignGirder DL
Slab DL
Barrier DL
Pavement DL

self weight: 15.3 kN/m
span: 36.5 m
support reactions: 279.225 kN
y = 855.1 mm = 0.8551 m
A = 625000 mm2 = 0.625 m2
I = 2.75E+11 mm4 = 0.2749 m4
h = 1800 mm = 1.8 m
yc = 1334.053611 mm = 1.334054 m
A = 1142500 mm2 = 1.1425 m2
Ic = 5.94E+11 mm4 = 0.593612 m4
modular ratio between slab and girder
n = Ec(slab)/Ec(beam)
n = 30951/30951
n = 1
transformed flange width
= n*tributary width = 2.3
A yb A*yb A(ybc-yb)2
I I+A(ybc-yb)2
beam 0.625 0.8551 0.534438 0.14337285 0.2749 0.418272851
deck 0.5175 1.9125 0.989719 0.17315562 0.002183 0.17533882
Ʃ 1.1425 1.524156 0.59361167
= 1.334054 m
= 0.593612 m4
Section Properties
composite section properties
yc = Ʃ(A*yb) / Ʃ(A)
Ic = Ʃ(I+A(ybc-yb)2)
section properties
girder properties

=
ANC=0 FR=0 fpu 1860 MPa e 0.7191 *Adjusted based on design
fsj 1450.8 MPa # of Strands 50
fpy 1674 MPa Area of each Strand 9.87E-05
t 0.75 days Total Force in all strands 7096.45353 KN
Ag 0.625
REL1 12.8155 Mpa Ig 0.2749
New Fst at transfer 1437.985 Mpa
Ep 200000 Mpa
Eci 27579.29 Mpa *Adjusted based on design
fci 40 MPa *Assumed for now. Can specify new value to balance stresses
ES 130.8097 Mpa fcir 18.03819 MPa *Adjusted based on design
143.6252 Mpa Fp at transfer 1307.175 Mpa
=
f`c 45 Moments of dead loads for calculation of fcds
RH 90 %
Kcr 2 Mbarrier 386.85
Ep 200000 MPa Mslab 2068.32 *Use I for beam not composite section for this moment
CR 116.97 Mpa Ec 28806.11 Mwearing surface 720.08
fcir 18.03819 Ig 0.2749
SH= fcds 6.751368 Ic 0.593612
SH 22.5 Mpa
New after losses fst= 1307.17
REL2= 27.63784 or 3.72 * which ever is higher
REL2 27.63784 Mpa
167.10 Mpa Total Loss = 310.73 Mpa Fp after transfer = 1140.07 Mpa
Losses at Transfer
Losses After Transfer
Losses

Ep 200000 Harp Strands At L/3 12166.66667 mm Slope= 0.125753
Eci 27579.28962 Per strand 129.02 KN Angle 7.17 0.125096759
Ec 28806.10721 For 8 strands 1032.145226 KN yt (for 8 harp strands) 125 e 0.8199 m
St 0.290930257 at angle 1024.079629 KN yb 1675
Sb 0.321482868 yt (for 8 harp strands) 1655 e 0.7101 m
yb 145
# of strands yb e Force
42 134.2857143 0.720814286 5418.762435
(m) (m) (KN) (Kpa) (Kpa) (Kpa) (Kpa) (Mpa)
0 0 0.8199 1024.079629 2886.06244 -13425.62789 10308.5473 0.00 -0.23
3.65 0.1 0.3609 1024.079629 1270.374356 -13425.62789 10308.5473 3152.83 1.31
7.3 0.2 -0.0981 1024.079629 -345.3137277 -13425.62789 10308.5473 5605.03 2.14
10.95 0.3 -0.5571 1024.079629 -1961.001812 -13425.62789 10308.5473 7356.61 2.28
14.6 0.4 -0.7101 1032.145226 -2519.250943 -13425.62789 10321.45226 8407.55 2.78
18.25 0.5 -0.7101 1032.145226 -2519.250943 -13425.62789 10321.45226 8757.87 3.13
21.9 0.6 -0.7101 1032.145226 -2519.250943 -13425.62789 10321.45226 8407.55 2.78
25.55 0.7 -0.5571 1024.079629 -1961.001812 -13425.62789 10308.5473 7356.61 2.28
29.2 0.8 -0.0981 1024.079629 -345.3137277 -13425.62789 10308.5473 5605.03 2.14
32.85 0.9 0.3609 1024.079629 1270.374356 -13425.62789 10308.5473 3152.83 1.31
36.5 1 0.8199 1024.079629 2886.06244 -13425.62789 10308.5473 0.00 -0.23
(m) (m) (KN) (Kpa) (Kpa) (Kpa) (Kpa) (Mpa)
0 0 0.8199 1024.079629 -2611.781133 12149.70304 10308.5473 0.00 19.85
3.65 0.1 0.3609 1024.079629 -1149.642409 12149.70304 10308.5473 -2853.20 18.46
7.3 0.2 -0.0981 1024.079629 312.4963156 12149.70304 10308.5473 -5072.35 17.70
10.95 0.3 -0.5571 1024.079629 1774.63504 12149.70304 10308.5473 -6657.46 17.58
14.6 0.4 -0.7101 1032.145226 2279.830121 12149.70304 10321.45226 -7608.53 17.14
18.25 0.5 -0.7101 1032.145226 2279.830121 12149.70304 10321.45226 -7925.55 16.83
21.9 0.6 -0.7101 1032.145226 2279.830121 12149.70304 10321.45226 -7608.53 17.14
25.55 0.7 -0.5571 1024.079629 1774.63504 12149.70304 10308.5473 -6657.46 17.58
29.2 0.8 -0.0981 1024.079629 312.4963156 12149.70304 10308.5473 -5072.35 17.70
32.85 0.9 0.3609 1024.079629 -1149.642409 12149.70304 10308.5473 -2853.20 18.46
36.5 1 0.8199 1024.079629 -2611.781133 12149.70304 10308.5473 0.00 19.85
Stresses at Transfer
Top stress from
bottom strand
moment
distance section (x/L)e for harp
strands
Force in ten
strands
Top stress from
Harp strands
moment
Bot stress from
force in all
strands
Bot stress
from girder
Self weight
Total Bot
Stress
Force in strands at transfer
Bottom
Strands
At face
At center
Top stress from
force in all
strands
Top stress
from girder
Self weight
Total Top
Stress
distance section (x/L)e for harp
strands
Force in ten
strands
Bot stress from
Harp strands
moment
Bot stress from
bottom strand
moment

Ep 200000 Harp Strands At L/3 12166.66667 mm Slope= 0.125753
Eci 27579.28962 Per strand 129.0181532 KN Angle 7.17 0.125096759
Ec 28806.10721 For 8 strands 1032.145226 KN yt (for 8 harp strands) 125 e 0.8199 m
St 0.290930257 at angle 1024.079629 KN yb 1675
Sb 0.321482868 yt (for 8 harp strands) 1655 e 0.7101 m
yb 145
# of strands yb e Force
42 134.2857143 0.720814286 5418.762435
(m) (m) (KN) (Kpa) (Kpa) (Kpa) (Kpa) (Kpa) (Mpa)
0 0 0.8199 1024.079629 2886.06244 -13425.62789 10308.5473 0.00 0.00 -0.23
3.65 0.1 0.3609 1024.079629 1270.374356 -13425.62789 10308.5473 3152.83 2559.36 3.87
7.3 0.2 -0.0981 1024.079629 -345.3137277 -13425.62789 10308.5473 5605.03 4549.97 6.69
10.95 0.3 -0.5571 1024.079629 -1961.001812 -13425.62789 10308.5473 7356.61 5971.83 8.25
14.6 0.4 -0.7101 1032.145226 -2519.250943 -13425.62789 10321.45226 8407.55 6824.95 9.61
18.25 0.5 -0.7101 1032.145226 -2519.250943 -13425.62789 10321.45226 8757.87 7109.33 10.24
21.9 0.6 -0.7101 1032.145226 -2519.250943 -13425.62789 10321.45226 8407.55 6824.95 9.61
25.55 0.7 -0.5571 1024.079629 -1961.001812 -13425.62789 10308.5473 7356.61 5971.83 8.25
29.2 0.8 -0.0981 1024.079629 -345.3137277 -13425.62789 10308.5473 5605.03 4549.97 6.69
32.85 0.9 0.3609 1024.079629 1270.374356 -13425.62789 10308.5473 3152.83 2559.36 3.87
36.5 1 0.8199 1024.079629 2886.06244 -13425.62789 10308.5473 0.00 0.00 -0.23
(m) (m) (KN) (Kpa) (Kpa) (Kpa) (Kpa) (Kpa) (Mpa)
0 0 0.8199 1024.079629 -2611.781133 12149.70304 10308.5473 0.00 0.00 19.85
3.65 0.1 0.3609 1024.079629 -1149.642409 12149.70304 10308.5473 -2853.20 -2316.13 16.14
7.3 0.2 -0.0981 1024.079629 312.4963156 12149.70304 10308.5473 -5072.35 -4117.56 13.58
10.95 0.3 -0.5571 1024.079629 1774.63504 12149.70304 10308.5473 -6657.46 -5404.29 12.17
14.6 0.4 -0.7101 1032.145226 2279.830121 12149.70304 10321.45226 -7608.53 -6176.33 10.97
18.25 0.5 -0.7101 1032.145226 2279.830121 12149.70304 10321.45226 -7925.55 -6433.68 10.39
21.9 0.6 -0.7101 1032.145226 2279.830121 12149.70304 10321.45226 -7608.53 -6176.33 10.97
25.55 0.7 -0.5571 1024.079629 1774.63504 12149.70304 10308.5473 -6657.46 -5404.29 12.17
29.2 0.8 -0.0981 1024.079629 312.4963156 12149.70304 10308.5473 -5072.35 -4117.56 13.58
32.85 0.9 0.3609 1024.079629 -1149.642409 12149.70304 10308.5473 -2853.20 -2316.13 16.14
36.5 1 0.8199 1024.079629 -2611.781133 12149.70304 10308.5473 0.00 0.00 19.85
Stresses After Transfer (Wet Slab)
Top stress from
bottom strand
moment
Total Bot
Stress
Top stress
from slab self
weight
Bot stress
from slab self
weight
Top stress from
force in all
strands
Top stress
from girder
Self weight
Total Top
Stress
Bot stress from
force in all
strands
Force in strands at transfer
At face
At center
Bottom
Strands
Bot stress
from girder
Self weight
distance section (x/L)e for harp
strands
Force in eight
strands
Bot stress from
Harp strands
moment
Bot stress from
bottom strand
moment
distance
from
face
section (x/L)e for harp
strands
Force in eight
strands
Top stress from
Harp strands
moment

Girder Composite
Ep 200000 Harp Strands At L/3 12166.66667 mm Slope= 0.125753425
Eci 27579.28962 Per strand 112.524977 KN Angle 7.17 0.125096759
Ec 28806.10721 For 8 strands 900.199817 KN yt (for 8 harp strands) 125 e 0.8199 m
St 0.290930257 0.859128406 at angle 893.165295 KN yb 1675
Sb 0.321482868 0.444968377 yt (for 8 harp strands) 1655 e 0.7101 m
yb 145
# of strands yb e Force
42 134.2857143 0.72081429 4726.04904
(m) (m) (KN) (Kpa) (Kpa) (Kpa) (Kpa) (Kpa) (Kpa) (Kpa) (Kpa) (Mpa)
0 0 0.8199 893.165295 2517.11951 -11709.34813 8990.742935 0.00 0.00 0.00 0.00 0.00 -0.20
3.65 0.1 0.3609 893.165295 1107.97467 -11709.34813 8990.742935 3152.83 2559.36 162.10 301.74 1311.63 5.88
7.3 0.2 -0.0981 893.165295 -301.170171 -11709.34813 8990.742935 5605.03 4549.97 288.18 536.42 2220.15 10.18
10.95 0.3 -0.5571 893.165295 -1710.31501 -11709.34813 8990.742935 7356.61 5971.83 378.24 704.05 3132.73 13.11
14.6 0.4 -0.7101 900.199817 -2197.19976 -11709.34813 9001.998171 8407.55 6824.95 432.27 804.63 3413.75 14.98
18.25 0.5 -0.7101 900.199817 -2197.19976 -11709.34813 9001.998171 8757.87 7109.33 450.28 838.15 3481.56 15.73
21.9 0.6 -0.7101 900.199817 -2197.19976 -11709.34813 9001.998171 8407.55 6824.95 432.27 804.63 3456.79 15.02
25.55 0.7 -0.5571 893.165295 -1710.31501 -11709.34813 8990.742935 7356.61 5971.83 378.24 704.05 3113.85 13.10
29.2 0.8 -0.0981 893.165295 -301.170171 -11709.34813 8990.742935 5605.03 4549.97 288.18 536.42 2415.69 10.38
32.85 0.9 0.3609 893.165295 1107.97467 -11709.34813 8990.742935 3152.83 2559.36 162.10 301.74 1332.16 5.90
36.5 1 0.8199 893.165295 2517.11951 -11709.34813 8990.742935 0.00 0.00 0.00 0.00 0.00 -0.20
(m) (m) (KN) (Kpa) (Kpa) (Kpa) (Kpa) (Kpa) (Kpa) (Kpa) (Kpa) (Mpa)
0 0 0.8199 893.165295 -2277.90125 10596.53253 8990.742935 0.00 0.00 0.00 0.00 0.00 17.31
3.65 0.1 0.3609 893.165295 -1002.67662 10596.53253 8990.742935 -2853.20 -2316.13 -312.98 -582.58 -2532.46 9.99
7.3 0.2 -0.0981 893.165295 272.548009 10596.53253 8990.742935 -5072.35 -4117.56 -556.41 -1035.70 -4286.58 4.79
10.95 0.3 -0.5571 893.165295 1547.77264 10596.53253 8990.742935 -6657.46 -5404.29 -730.29 -1359.35 -6048.56 0.94
14.6 0.4 -0.7101 900.199817 1988.38556 10596.53253 9001.998171 -7608.53 -6176.33 -834.62 -1553.54 -6591.14 -1.18
18.25 0.5 -0.7101 900.199817 1988.38556 10596.53253 9001.998171 -7925.55 -6433.68 -869.39 -1618.27 -6722.06 -1.98
21.9 0.6 -0.7101 900.199817 1988.38556 10596.53253 9001.998171 -7608.53 -6176.33 -834.62 -1553.54 -6674.24 -1.26
25.55 0.7 -0.5571 893.165295 1547.77264 10596.53253 8990.742935 -6657.46 -5404.29 -730.29 -1359.35 -6012.11 0.97
29.2 0.8 -0.0981 893.165295 272.548009 10596.53253 8990.742935 -5072.35 -4117.56 -556.41 -1035.70 -4664.12 4.41
32.85 0.9 0.3609 893.165295 -1002.67662 10596.53253 8990.742935 -2853.20 -2316.13 -312.98 -582.58 -2572.08 9.95
36.5 1 0.8199 893.165295 -2277.90125 10596.53253 8990.742935 0.00 0.00 0.00 0.00 0.00 17.31
Stresses After Transfer (Composite)
Bot stress from
girder Self weight
Bot stress
from slab self
weight
Total Bot
Stress
Top stress from
girder Self weight
Top stress
from slab self
weight
Total Top
Stress
Top Stress
from Jersey
Barrier
Top Stress
from Asphalt
Top Stress
from LL
Top Stress
from LL
Top Stress
from Asphalt
Top Stress
from Jersey
Barrier
distance section (x/L)e for harp
strands
Force in
eight strands
Bot stress
from Harp
strands
Bot stress from
bottom strand
moment
Bot stress from
force in all strands
Force in strands at transfer
At face
At center
Top stress
from Harp
strands
Top stress from
bottom strand
moment
Top stress from
force in all strands
Bottom
Strands
distance
from
face
section (x/L)e for harp
strands
Force in
eight strands

DL factors LL Factor
girder SW 15.3 kN/m = 15.3 kN/m 1.1 16.83 kN/m 1.7
slab SW 5.4 kPa *2.3 m = 12.42 kN/m 1.2 14.904 kN/m
barrier SW 1.01 kPa *2.3 m = 2.323 kN/m 1.2 2.7876 kN/m
wearing surface SW *2.3 m = 4.324 kN/m 1.5 6.486 kN/m
span 36.5 m
Shear Moment Shear Moment Shear Moment Shear Moment Shear Moment Shear Moment
0 0 307.15 0.00 272.00 0.00 50.87 0.00 118.37 0.00 685.62 0.00 1434.01 0.00
3.65 0.1 245.72 1008.98 217.60 893.51 40.70 167.12 94.70 388.84 593.96 1915.67 1192.67 4374.12
7.3 0.2 184.29 1793.74 163.20 1588.47 30.52 297.10 71.02 691.28 504.89 3242.57 953.92 7613.16
10.95 0.3 122.86 2354.29 108.80 2084.86 20.35 389.95 47.35 907.30 412.36 4575.41 711.71 10311.81
14.6 0.4 61.43 2690.61 54.40 2382.70 10.17 445.65 23.67 1036.92 324.16 4985.84 473.84 11541.73
18.25 0.5 0.00 2802.72 0.00 2481.98 0.00 464.22 0.00 1080.12 239.87 5084.88 239.87 11913.92
21.9 0.6 -61.43 2690.61 -54.40 2382.70 -10.17 445.65 -23.67 1036.92 -328.93 5048.70 -478.61 11604.59
25.55 0.7 -122.86 2354.29 -108.80 2084.86 -20.35 389.95 -47.35 907.30 -420.60 4547.84 -719.95 10284.24
29.2 0.8 -184.29 1793.74 -163.20 1588.47 -30.52 297.10 -71.02 691.28 -509.66 3528.16 -958.70 7898.75
32.85 0.9 -245.72 1008.98 -217.60 893.51 -40.70 167.12 -94.70 388.84 -601.33 1945.64 -1200.04 4404.10
36.5 1 -307.15 0.00 -272.00 0.00 -50.87 0.00 -118.37 0.00 -683.45 0.00 -1431.84 0.00
фp 0.95 α1 0.7825 K 0.3
Aps 0.004935 m2фc 0.75
fpu 1860 Mpa β1 0.8575
f'c 45 Mpa
b 2.3 m
0 0 380.8 1644.2 0.162 1804.9 0.139 13323.29
3.65 0.1 307.36 1717.64 0.163 1807.2 0.139 13961.66
7.3 0.2 233.92 1791.08 0.163 1809.3 0.140 14600.19
10.95 0.3 160.48 1864.52 0.163 1811.2 0.140 15238.87
14.6 0.4 136 1889 0.163 1811.8 0.140 15451.79
18.25 0.5 136 1889 0.163 1811.8 0.140 15451.79
21.9 0.6 136 1889 0.163 1811.8 0.140 15451.79
25.55 0.7 160.48 1864.52 0.163 1811.2 0.140 15238.87
29.2 0.8 233.92 1791.08 0.163 1809.3 0.140 14600.19
32.85 0.9 307.36 1717.64 0.163 1807.2 0.139 13961.66
36.5 1 380.8 1644.2 0.162 1804.9 0.139 13323.29
fps Mradistance section (x/L) yb dp c
ULS Design
ULS Factored Moments and Shears
wearing surface weight Total
Factored Loads
Truck Load + DLA
loads
distance section (x/L)
girder weight slab weight barrier weight

DL factors LL Factor
girder SW 15.3 kN/m = 15.3 kN/m 1.1 16.83 kN/m 1.6
slab SW 5.4 kPa *2.3 m = 12.42 kN/m 1.2 14.904 kN/m
barrier SW 1.01 kPa *2.3 m = 2.323 kN/m 1.2 2.7876 kN/m
wearing surface SW *2.3 m = 4.324 kN/m 1.5 6.486 kN/m
span 36.5 m
Shear Moment Shear Moment Shear Moment Shear Moment Shear Moment Shear Moment
0 0 307.15 0.00 272.00 0.00 50.87 0.00 118.37 0.00 645.29 0.00 1393.68 0.00
3.65 0.1 245.72 1008.98 217.60 893.51 40.70 167.12 94.70 388.84 559.02 1802.98 1157.73 4261.44
7.3 0.2 184.29 1793.74 163.20 1588.47 30.52 297.10 71.02 691.28 475.19 3051.83 924.22 7422.42
10.95 0.3 122.86 2354.29 108.80 2084.86 20.35 389.95 47.35 907.30 388.10 4306.27 687.46 10042.67
14.6 0.4 61.43 2690.61 54.40 2382.70 10.17 445.65 23.67 1036.92 305.09 4692.56 454.77 11248.44
18.25 0.5 0.00 2802.72 0.00 2481.98 0.00 464.22 0.00 1080.12 225.76 4785.77 225.76 11614.81
21.9 0.6 -61.43 2690.61 -54.40 2382.70 -10.17 445.65 -23.67 1036.92 -309.58 4751.72 -459.26 11307.60
25.55 0.7 -122.86 2354.29 -108.80 2084.86 -20.35 389.95 -47.35 907.30 -395.86 4280.32 -695.21 10016.72
29.2 0.8 -184.29 1793.74 -163.20 1588.47 -30.52 297.10 -71.02 691.28 -479.68 3320.62 -928.72 7691.21
32.85 0.9 -245.72 1008.98 -217.60 893.51 -40.70 167.12 -94.70 388.84 -565.96 1831.19 -1164.67 4289.65
36.5 1 -307.15 0.00 -272.00 0.00 -50.87 0.00 -118.37 0.00 -643.25 0.00 -1391.64 0.00
loads
ULS 2Factored Loads
ULS Factored Moments and Shears
distance section (x/L)
girder weight slab weight barrier weight wearing surface weight Truck Load + DLA Total

DL factors LL Factor
girder SW 15.3 kN/m = 15.3 kN/m 1.1 16.83 kN/m 1.4
slab SW 5.4 kPa *2.3 m = 12.42 kN/m 1.2 14.904 kN/m
barrier SW 1.01 kPa *2.3 m = 2.323 kN/m 1.2 2.7876 kN/m
wearing surface SW *2.3 m = 4.324 kN/m 1.5 6.486 kN/m
wind load 1.19 kN/m 0.5 0.595 kN/m
span 36.5 m
Shear Moment Shear Moment Shear Moment Shear Moment Shear Moment Shear Moment Shear Moment
0 0 307.15 0.00 272.00 0.00 50.87 0.00 118.37 0.00 564.63 0.00 10.86 0.00 1323.88 0.00
3.65 0.1 245.72 1008.98 217.60 893.51 40.70 167.12 94.70 388.84 489.14 1577.61 8.69 35.67 1096.54 4071.74
7.3 0.2 184.29 1793.74 163.20 1588.47 30.52 297.10 71.02 691.28 415.79 2670.35 6.52 63.42 871.34 7104.36
10.95 0.3 122.86 2354.29 108.80 2084.86 20.35 389.95 47.35 907.30 339.59 3767.99 4.34 83.23 643.29 9587.62
14.6 0.4 61.43 2690.61 54.40 2382.70 10.17 445.65 23.67 1036.92 266.95 4105.99 2.17 95.12 418.80 10756.99
18.25 0.5 0.00 2802.72 0.00 2481.98 0.00 464.22 0.00 1080.12 197.54 4187.54 0.00 99.09 197.54 11115.68
21.9 0.6 -61.43 2690.61 -54.40 2382.70 -10.17 445.65 -23.67 1036.92 -270.88 4157.75 -2.17 95.12 -422.73 10808.76
25.55 0.7 -122.86 2354.29 -108.80 2084.86 -20.35 389.95 -47.35 907.30 -346.37 3745.28 -4.34 83.23 -650.07 9564.91
29.2 0.8 -184.29 1793.74 -163.20 1588.47 -30.52 297.10 -71.02 691.28 -419.72 2905.54 -6.52 63.42 -875.27 7339.55
32.85 0.9 -245.72 1008.98 -217.60 893.51 -40.70 167.12 -94.70 388.84 -495.21 1602.29 -8.69 35.67 -1102.61 4096.42
36.5 1 -307.15 0.00 -272.00 0.00 -50.87 0.00 -118.37 0.00 -562.84 0.00 -10.86 0.00 -1322.09 0.00
Truck Load + DLA TotalWind Load
ULS 3Factored Loads
loads
ULS Factored Moments and Shears
distance section (x/L)
girder weight slab weight barrier weight wearing surface weight

DL factors LL Factor
girder SW 15.3 kN/m = 15.3 kN/m 1.1 16.83 kN/m 0
slab SW 5.4 kPa *2.3 m = 12.42 kN/m 1.2 14.904 kN/m
barrier SW 1.01 kPa *2.3 m = 2.323 kN/m 1.2 2.7876 kN/m
wearing surface SW *2.3 m = 4.324 kN/m 1.5 6.486 kN/m
wind load 1.19 kN/m 1.65 1.9635 kN/m
span 36.5 m
Shear Moment Shear Moment Shear Moment Shear Moment Shear Moment Shear Moment Shear Moment
0 0 307.15 0.00 272.00 0.00 50.87 0.00 118.37 0.00 0.00 0.00 35.83 0.00 784.22 0.00
3.65 0.1 245.72 1008.98 217.60 893.51 40.70 167.12 94.70 388.84 0.00 0.00 28.67 117.71 627.38 2576.17
7.3 0.2 184.29 1793.74 163.20 1588.47 30.52 297.10 71.02 691.28 0.00 0.00 21.50 209.27 470.53 4579.86
10.95 0.3 122.86 2354.29 108.80 2084.86 20.35 389.95 47.35 907.30 0.00 0.00 14.33 274.67 313.69 6011.07
14.6 0.4 61.43 2690.61 54.40 2382.70 10.17 445.65 23.67 1036.92 0.00 0.00 7.17 313.90 156.84 6869.79
18.25 0.5 0.00 2802.72 0.00 2481.98 0.00 464.22 0.00 1080.12 0.00 0.00 0.00 326.98 0.00 7156.03
21.9 0.6 -61.43 2690.61 -54.40 2382.70 -10.17 445.65 -23.67 1036.92 0.00 0.00 -7.17 313.90 -156.84 6869.79
25.55 0.7 -122.86 2354.29 -108.80 2084.86 -20.35 389.95 -47.35 907.30 0.00 0.00 -14.33 274.67 -313.69 6011.07
29.2 0.8 -184.29 1793.74 -163.20 1588.47 -30.52 297.10 -71.02 691.28 0.00 0.00 -21.50 209.27 -470.53 4579.86
32.85 0.9 -245.72 1008.98 -217.60 893.51 -40.70 167.12 -94.70 388.84 0.00 0.00 -28.67 117.71 -627.38 2576.17
36.5 1 -307.15 0.00 -272.00 0.00 -50.87 0.00 -118.37 0.00 0.00 0.00 -35.83 0.00 -784.22 0.00
Truck Load + DLA Wind Load Total
ULS 4Factored Loads
loads
ULS Factored Moments and Shears
distance section (x/L)
girder weight slab weight barrier weight wearing surface weight

Pi 6451 KN ∆p 96.76 mm
Eci 27579 Mpa ∆g 46.64 mm
Ec 28806 Mpa ∆s 36.25 mm
ybc 136 mm ∆b+ws 8.98 mm
ec 0.7191 m
ybe 381 mm
ee 0.4743 m
e' 0.2448 m
a 12.17 m
L 36.5 m
Ig 0.2749 m4
Ic 0.5936 m4
Deflections at midspan

APPENDIX C – Design Drawings

1
1.5
1
1.5
C
L
4671.7 18800.0 18800.0 5794.8
To GamboTo Hare Bay
Flow
V= 0.6 m/s
1
1
Plan View
Profile
Traverse Brook Bridge
General Arrangement
March 28th, 2013
Drawn by: B. Evans
Details:
1.Structural fill pad to be constructed with a
minimum thickness of 600m and should
extend a minimum of 1.0m beyond the edges
of the foundation.
2. #25 M Dowels must be installed at the
centerline of the west abutment. The dowels
will be embedded into the concrete 375mm
and into the bedrock 310mm. The dowels will
have center to center spacing of 1.3m.
3 .All excavations should be constructed with
slopes of 1.5:1
4. East footing sits on bedrock.
600 mm Thick structural fill pad.
100 mm base plate
El: 5.835m
El: 6.50m
or until bedrock is reached
See notes for dowel details.
1
1.5
Limits of foundation
excavation .
El: 6.79
Finished elevation 12.13
(top of asphalt)
C
L
C
L
Bearing East El: 9.9m
Bearing East El: 9.9 m
PL2 Jersey Barrier

Traverse Brook Bridge
Profile View
Date: March 31st, 2013
Details:
17+600 17+650 17+700 17+750 17+800 17+850 17+900 17+950 18+00017+550
12
11
10
9.0
8.0
7.0
6.0
5.0
4.0
3.0
1. Elevation at the bottom of
the river bed is 6.79m
Drawn by: B. Evans

225mm deck and 80mm asphalt
-2% -2%
4000.004000.00
11500.00
50mm Edge
Section View
1750.001750.0
NEBT 1800 Girders see Girder design sheet for details.
225mm Deck and
80mm Asphalt
2300.0 1150.0
Traverse Brook Bridge
Cross Section 1-1
March 28th, 2013
Drawn by: B. Evans

500.0
2200.0
2644.6
750.0
4200.0
C
L
1100.01800.0
500.0
2200.0
3314.6
750.0
4200.0
1100.0 1800.0
Traverse Brook Bridge
Abutment Details
Date: March 29th, 2013
Details:
1. Reinforcement on east wing wall and
abutment area the same for the west wing
wall and abutment.
2. Concrete Cover for Abutment and Wing
Walls is 100+/- 10mm
3. Developmental length for 90 Degree hook
& L-Bar:
15 M bar 195mm
20M bar 240mm
4. Transverse toe and heel reinforcement
should end in 90 degree hooks.
Drawn by: B. Evans
15 M @ 300 mm
20M @125mm
15 M @ 300mm
20 M @ 280mm
20M @ 140mm
20 M 90 Degree
hooks @ 140 mm
15 M @ 300mm
U-Bar 15M @ 300mm
20 M 90 Degree
hooks @ 280 mm
15M L Bar at 300mm

Deck Reinforcement Plan
11500.0
#19 FRP @ 160mm
#19 GFRP @ 325mm
#19 GFRP
@140mm
125.0
Top Mat#19 GFRP @ 160mm
Bottom Mat #19 GFRP @ 140mm
Top & Bottom Mat #19 GFRP @ 325mm
Traverse Brook Bridge
Deck Reinforcement
Date: March 29th, 2013
Details:
Drawn by: B. Evans
1. Cover: 50 +/- 10mm
2. Max. rebar length: 15m with
splice of 690 mm for GFRP.
3. Bearing Seats 600x100mm
1150.0
Deck Reinforcement Cross Section

Strands at Hold Down
Strands at End
75.0 150.0 300.0 600.0
Remainder 15M Spacing @ 600mm
10 - 15M Spacing @ 300mm
9 - 15M Spacing @ 150mm
7 - 15M Spacing @ 75mm
6083.3
1710.0
C
L
1200.0
85.0
180.0
315.0
200mm Radius
200mm Radius
20mm Radius
100mm Radius
810.0
220.0
1200.0 1200.0
125.0
180.0
1800.0
1800.0
810.0
50.0 Typ.
70.0
Confinement reinforcing spacing to vary
such that contact with harped strands is
avoided where required.
125.0
180.0
50.0 Typ.
810.0
70.0
50.0 Typ
1800.0
Total Finished Length 36,500mm
Traverse Brook Bridge
Pre Cast Pre Tensioned
Date: March, 29th, 2013
Details:
Girder
Typical Section
Half Elevation of Girder
New England Bulb Tee
Drawn by: B. Evans

Traverse Brook Bridge
Wing Wall Details
Date: March 29th, 2013
Details:
1. Reinforcement on east wing wall and
abutment area the same for the west wing
wall and abutment.
2. Concrete Cover for Abutment and Wing
Walls is 100+/- 10mm
3. Developmental length for 90 Degree hook:
15 M bar 195mm
20M bar 240mm
Drawn by: B. Evans
East Abutment
West Abutment
C
L
1500.0
4671.7
5794.8
1500.0
1.5
1
1
1.5
El: 5.835m
El: 6.5m
20M @ 80mm
15M @ 300mm
12000.012000.0
600.0
600.0
20M @ 80mm
15M @ 300
20M @ 80mm
15M @ 300
20M @ 140mm20M @ 280
All other bars in
abutment are
15M @ 300mm
Both bars should
extend into the
abutment stem
and terminate in
90 degree hook.

APPENDIX D – Cost Estimate

Title/Job Number Unit Estimated Quantity Unit Price Estimated Cost
Traverse Brook Bridge
Prestressed Girders
Supply Each 5 $28,000.00 $140,000.00
Install Each 5 $10,000.00 $50,000.00
Prestressing Steel & Accessories Lump Sum 1 $50,000.00 $50,000.00
Supply & Install Bearings (excluding peirs) Each 10 $1,000.00 $10,000.00
Concrete in Superstructure m3
208.4 $900.00 $187,560.00
Concrete in Substructure
Abutments m3
195 $600.00 $117,000.00
Wingwalls m3
44.4 $900.00 $39,960.00
Supply and Install Reinforcing Steel tonne 14 $3,000.00 $42,000.00
Supply and Install GFRP Reinforcement
GFRP #D401 m 8223.05 $10.20 $83,875.11
Excvation for Foundations
Excavation of OM for Foundation m3
1520 $15.00 $22,800.00
Extra Backfill Placed (150mm Minus)
Structural Fill Pad m3
50 $40.00 $2,000.00
Selected Blasted Rockfill m3
1600 $40.00 $64,000.00
Unwatering Lump Sum 1 $100,000.00 $100,000.00
Total $909,195.11

APPENDIX E – Initial Documentation


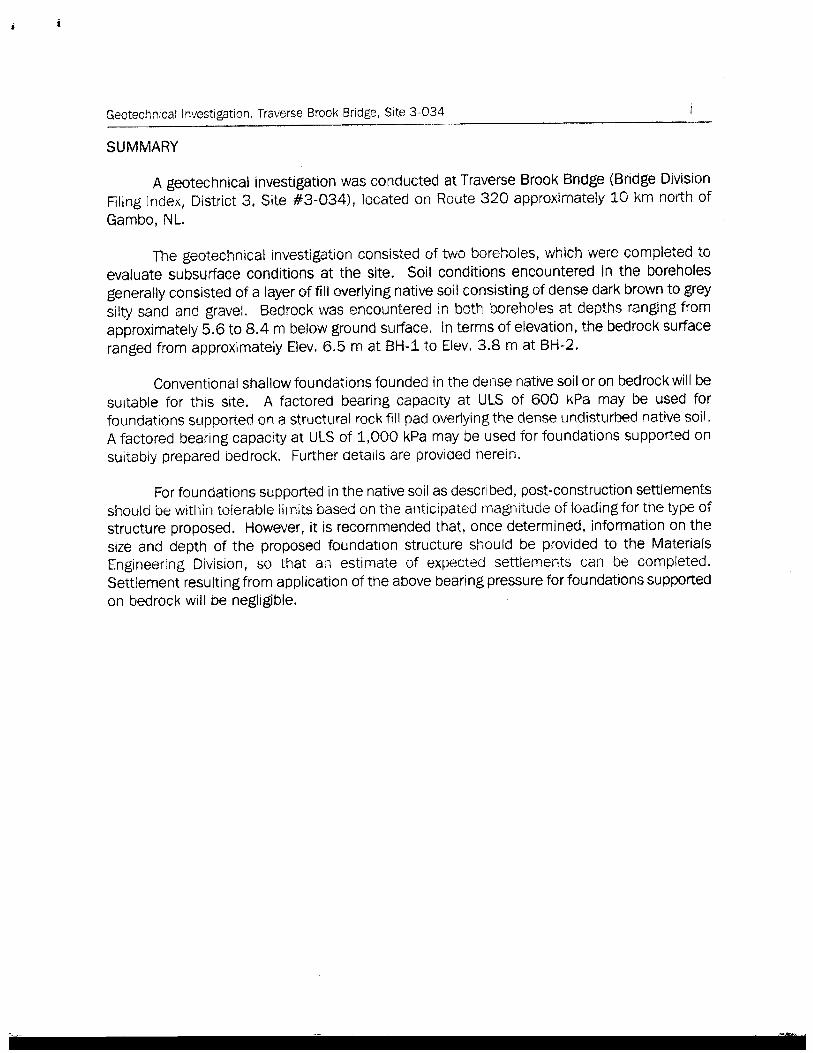


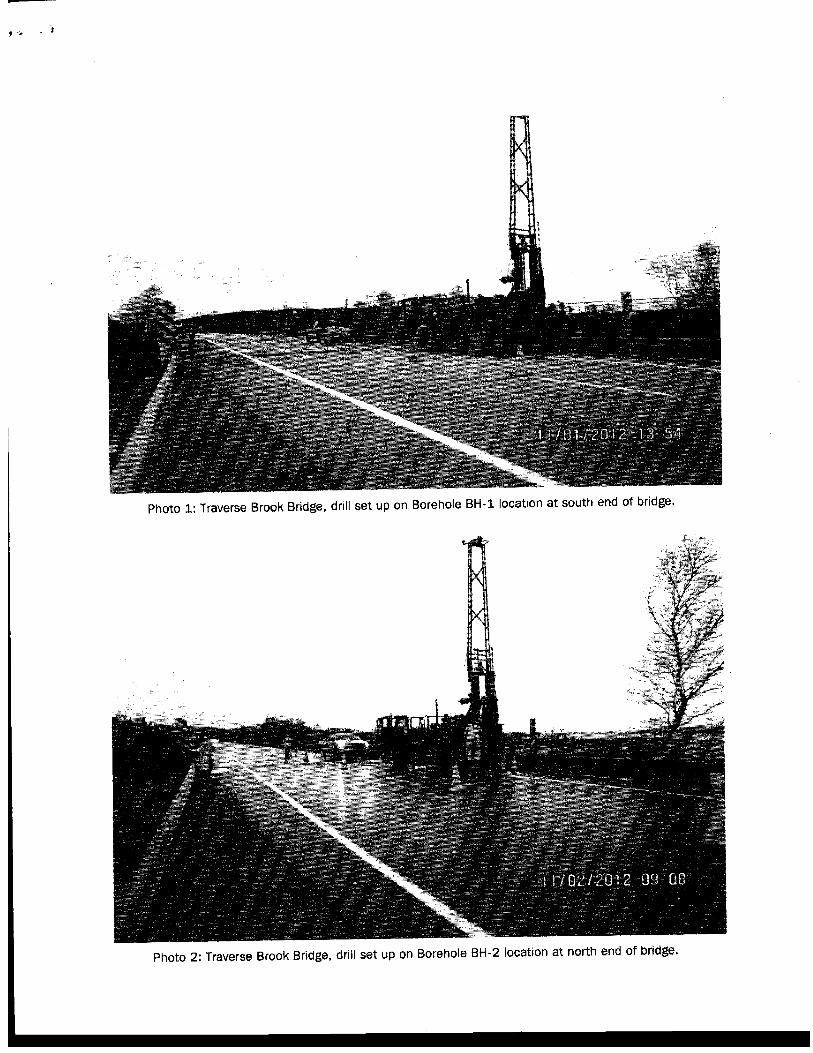

APPENDIX F – Hydrology

Short Duration Rainfall Intensity−Duration−Frequency Data
Données sur I’intensité, la durée et la fréquence des chutes de pluie de courte durée
5 10 15 30 60 2 6 12 24
Minutes Duration/Durée Hours/Heures
Inte
nsity
(mm
/h)
/ Int
ensi
té(m
m/h
)
1
2
3
4
56789
10
20
30
40
5060708090
100
200
300
400
500600
2
510
2550
100
GANDER AIRPORT CSNL8401705
1939 − 200965 years / ans
Latitude48o 57’NLongitude54o 34’W
Elevation / Altitude151 m
Return Periods/Périodes de retourYears / ans
2012/02/09

� � � � � � � � � � � � � � � � � � � � � � � � � � � � � � � � � � � � � � � � � � � � � � � � � � � � � � � � � � � � � � � � � � � � � � � � �� � � � � � � � � � � � � � � � � � � � � � � � � � � � � � � � � � � � � � � � � � � � � � � �� � � � � � � � � � � � � � � � � � � � � � � � � � � � � � � � � � � � � � � � � � � � � � � � � �� � � � � � � � � � � � ! � � � � � � � � � � � � � � � � � � � � � � � � � � � � � � � � � � � � � � � � � � � � � �� � " # � $ % � � $ � � � � � � � � � � � � � � � � � � � � � � � � � � � � � � � � � � � � � � � � � � � � � � � � � � &� � � ' ( ) ( � * � ( � + $ � � � � � � � � � � � � � � � � � � � � � � � � � � � � � � � � � � � � � � � � � � � � � � � �, � � � � - � � � � � � � � � � � � � . � � � � � � � � � � � � � � � � � � � � � � � � � � � � � � � � � � �/ � � 0 1 � 2 � � % 1 � � � � � � � � � � � � � � � � � � � � � � � � � � � � � � � � � � � � � � � � � � � � � � � � � �/ � " 3 4 * ) 5 � � $ � � � � � � � � � � � � � � � � � � � � � � � � � � � � � � � � � � � � � � � � � � � � � � � " "/ � " � � 6 � % � � 7 � $ � 8 1 � � 9 + � * 1 ' � 7 ( $ 5 � 1 � � � � � � � � � � � � � � � � � � � � � � � � " "/ � " � " # � $ � 8 � * + 2 � � 8 1 � � 9 + � * 1 # � $ � 8 � * + 2 � � � � � � � � � � � � � � � � � � � � " �: � � � � � � � � � � ; � � � < � � � � � � � � � � � � � � � � � � � � � � � � � � � � � � � � � � � � � => � � � � � � � � � � � � � � � � � � � � � � � � � � � � � � � � � � � � � � � � � � � � � � � � � � � � � � � � ?� ; ; � � � � � � @ 0 � ! $ ( � 1 * 5 � ( 2 0 * 1 * ) � � � 1 $ A B � $ 2 1 ( 5 � ( � + * + � @ C $ � 1 * 2 � ( � + � � � � � � � � � � � � � � � � � � � �8 6 ( + � � 6 � * � ( � + D � � � � D 1 � E % � + 2 ! @ + * � ! $ ( $ 3 $ � ( ) * � � F � 1 $ % $# � ( � + * � D � � � � D 1 � E % � + 2 ! @ + * � ! $ ( $ 3 $ � ( ) * � � � � � � � � � � � � � � � � � � � � � � � � � � � � / ?G 6 ( + � � 6 � * � ( � + D � � � � D 1 � E % � + 2 ! @ + * � ! $ ( $ H 6 � % � � 7 � $ � 8 1 � � 9 + � * 1 ' � 7 ( $ 5 � 1 � � � = �

� � � � � � � � � � I * C � � " � � B * � * 8 * $ � J � 1 6 ( + � � 6 � * � ( � + D 1 � E % � + 2 ! @ + * � ! $ ( $ � � � � � � � � � � � � � � � � � � /I * C � � " � " 6 ( + � � 6 � * � ( � + D � � � � D 1 � E % � + 2 ! @ + * � ! $ ( $ # � $ % � � $ � � � � � � � � � � � � � � � � � � ?I * C � � " � � K ( + � � ! H J ( F � 0 � 1 2 � + � L � = M N G � + J ( � � + 2 � O + � � 1 F * � * $ * 0 � 1 2 � + � * � � J� � � ' K � # � � % 1 + 0 � 1 ( � � D � � 7 $ � � � � � � � � � � � � � � � � � � � � � � � � � � � � � � � � � PI * C � � � � � 0 � ! $ ( � 1 * 5 � ( 2 B * � * C * $ � � � � � � � � � � � � � � � � � � � � � � � � � � � � � � � � � � � � � � =I * C � � � � " L * N # � 1 � $ $ ( � + G � � J J ( 2 ( � + � $ J � 1 � � � K � 1 � � H 7 � $ � # � ( � + � � � � � � � � � � � � � � � � � QI * C � � � � " L C N # � 1 � $ $ ( � + G � � J J ( 2 ( � + � $ J � 1 � � � K � 1 � � H � * $ � # � ( � + � � � � � � � � � � � � � � � � � QI * C � � � � " L 2 N # � 1 � $ $ ( � + G � � J J ( 2 ( � + � $ J � 1 � � � 6 � % � � H � * $ � # � ( � + � � � � � � � � � � � � � � � � � QI * C � � � � " L � N # � 1 � $ $ ( � + G � � J J ( 2 ( � + � $ J � 1 � � � 6 � % � � H 7 � $ � # � ( � + � � � � � � � � � � � � � � � � � ?I * C � � � � � # � 1 � $ $ ( � + G � � J J ( 2 ( � + � $ J � 1 � � � 6 � % � � H 7 � $ � R 5 5 � 1 3 + F � � � 5 � G % 1 F � � � � � � ?I * C � � � � / 3 4 � 1 � ) � $ � J S * � � 1 $ � � � 0 � ! $ ( � 1 * 5 � ! C ! # � ( � + � � � � � � � � � � � � � � � � � � PI * C � � / � � � ( + ( ) % ) K % ) C � 1 � J 0 � * 9 D � � 7 $ # � E % ( 1 � � J � 16 ( + � � 6 � * � ( � + D � � � � D 1 � E % � + 2 ! @ + * � ! $ ( $ � � � � � � � � � � � � � � � � � � � � � � � " �I * C � � / � " � A " & T � * 1 6 ( + � � 6 � * � ( � + D � � � � D 1 � E % � + 2 ! 3 $ � ( ) * � � $ J � 16 � % � � 7 � $ � 8 1 � � 9 + � * 1 ' � 7 ( $ 5 � 1 � � � � � � � � � � � � � � � � � � � � � � � � � � � � � � " =I * C � � 8 � � ( + ( ) % ) K % ) C � 1 � J 0 � * 9 D � � 7 $ # � E % ( 1 � � J � 16 ( + � � 6 � * � ( � + D � � � � D 1 � E % � + 2 ! @ + * � ! $ ( $ � � � � � � � � � � � � � � � � � � � � � � � = &I * C � � G � D � � � � B * � * J � 1 6 � % � � 7 � $ � 8 1 � � 9 + � * 1 ' � 7 ( $ 5 � 1 � � � � � � � � � � � � � � � � � � = =I * C � � G " � A " & T � * 1 6 ( + � � 6 � * � ( � + D � � � � D 1 � E % � + 2 ! 3 $ � ( ) * � � $ J � 16 � % � � 7 � $ � 8 1 � � 9 + � * 1 ' � 7 ( $ 5 � 1 � � � � � � � � � � � � � � � � � � � � � � � � � � � � � � = =� � � � � � � � � � D ( % 1 � " � � ' � 2 * � ( � + $ � J 6 � 1 � * ) J � � 7 U * % ( + 6 � * � ( � + $ � � � � � � � � � � � � � � � � � � � � � � � =D ( % 1 � � � � V ! � 1 � � � ( 2 * � # � ( � + $ � � � � � � � � � � � � � � � � � � � � � � � � � � � � � � � � � � � � � � � �D ( % 1 � / � � 6 � % � � 7 � $ � 8 1 � � 9 * � ' � 7 ( $ 5 � 1 � � � � � � � � � � � � � � � � � � � � � � � � � � � � � � � � " ?D ( % 1 � / � " # � $ � 8 � * + 2 � � 8 1 � � 9 + � * 1 # � $ � 8 � * + 2 � � � � � � � � � � � � � � � � � � � � � � � � � � �D ( % 1 � = � � 6 5 1 � * � $ � � � � W % � 5 % � � � � � � � � � � � � � � � � � � � � � � � � � � � � � � � � � � � � � � � � � QD ( % 1 � @ � 0 � 1 2 � + � * � � J 8 * $ ( + @ 1 � * G � + � 1 � � � � � C ! ' * 9 � * + � 6 7 * ) 5L @ G ' 6 N H B � J ( + ( � ( � + � � � � � � � � � � � � � � � � � � � � � � � � � � � � � � � � � � � � � � � / /D ( % 1 � @ " ' * 9 � @ � � � + % * � ( � + D * 2 � � 1 L ' @ D N H B � J ( + ( � ( � + � � � � � � � � � � � � � � � � � � � � � / =D ( % 1 � 8 � 6 3 3 X Y " J � 1 O + � ( F ( � % * � 6 � * � ( � + $ � � � � � � � � � � � � � � � � � � � � � � � � � � � � � = �D ( % 1 � 8 " 6 3 3 X Y " & J � 1 O + � ( F ( � % * � 6 � * � ( � + $ � � � � � � � � � � � � � � � � � � � � � � � � � � � � = �D ( % 1 � 8 � 6 3 3 X Y � & & J � 1 O + � ( F ( � % * � 6 � * � ( � + $ � � � � � � � � � � � � � � � � � � � � � � � � � � � = �D ( % 1 � G � D 1 � E % � + 2 ! @ + * � ! $ ( $ H & " T W & � " H I � 1 � � 0 * 1 * ) � � � 1 ' � + � 1 ) * � � � � � � � � = ?D ( % 1 � G " D 1 � E % � + 2 ! @ + * � ! $ ( $ H & " T W & � " H U � + � 1 * � ( Z � � 3 4 � 1 � ) � [ * � % � � � � � � � � � = P

� � � � � � � � � � � �I � ( $ R $ � 1 $ \ U % ( � � * + � 3 � � 2 � 1 � + ( 2 6 5 1 � * � $ � � � � L � ( $ 9 ( + C * 2 9 2 � F � 1 N ( $ * 2 � ) 5 * + ( � +1 � 5 � 1 � � � A ] ^ _ ` a b c d e d a a f e g ^ h i ^ b j k l b c d k m ` m n a g o p ^ q m d c b f a n r ^ s n a i b f d c b f L � � � � N � I � �� C t � 2 � ( F � � J � � * � $ � % � ! 7 * $ � � � � F � � � 5 * $ � � � J � E % * � ( � + $ � � � $ � ( ) * � � 1 � � % 1 + 5 � 1 ( � � J � � � � J � � 7 $� + % + * % � � 7 * � � 1 $ � � � $ � D � � � � J � � 7 � $ � ( ) * � � $ * 1 � 1 � E % ( 1 � � J � 1 � � � � ! � 1 * % � ( 2 � � $ ( + � J( + $ � 1 � * ) $ � 1 % 2 � % 1 � $ * + � J � 1 J � � � � 5 � * ( + ) * + * � ) � + � � I � ( $ % $ � 1 $ \ % ( � � 7 * $ � � $ ( + � � � � * $ $ ( $ �� + ( + � � 1 $ ( + � � � * 5 5 � ( 2 * � ( � + � J � � � $ � � E % * � ( � + $ � I � � � � � 2 � 1 � + ( 2 $ 5 1 � * � $ � � � � * % � � ) * � � $ � � �2 * � 2 % � * � ( � + $ � I � � � � � � 1 � ( � + * � J � � � � J 1 � E % � + 2 ! * + * � ! $ ( $ 5 1 � F ( � � $ � + � ) � � � � � � � � $ � ( ) * � �J � � � � J � � 7 $ � O � ( $ * � F ( $ * C � � � � % $ � $ � F � 1 * � ) � � � � � $ � � � $ � ( ) * � � � � $ ( + J � � � � $ � 0 1 � F ( � % $1 � ( � + * � J � � � � J 1 � E % � + 2 ! * + * � ! $ ( $ ( + � � P / * + � � � � & 2 * + C � % $ � � * $ 2 � � 2 9 $ �6 ( ) ( � * 1 1 � ( � + * � J � � � � J 1 � E % � + 2 ! * + * � ! $ � $ � * F � C � � + 2 � + � % 2 � � � ( + � � � 5 * $ � A 8 � � 1 $ ( + L � � � & N u 0 * + % � � * � L � � P / N * + � 0 � % � ( + L � � ? � N � # � % � * 1 % 5 � * � � $ � J � � � 1 � ( � + * � J � � � � J 1 � E % � + 2 !* + * � ! $ ( $ * 1 � t % $ � ( J ( � � � + � � � C * $ ( $ � J * � � ( � ( � + * � � * � * u � � � 2 * 5 ( � * � 2 � $ � $ � J ( + $ � 1 � * ) $ � 1 % 2 � % 1 � $ u* + � � � � * + + % * � 2 � $ � � J J � � � � ( + � I � � � � � � $ � % � ! % $ � � J � � � � * + � 5 � ! $ ( � 1 * 5 � ( 2 � * � * J 1 � ) = & * % � � 7 * � � 1 $ � � � $ ( + / 1 � ( � + $ � � � � F � � � 5 * $ � � � J � E % * � ( � + $ � � � $ � ( ) * � � 1 � � % 1 + 5 � 1 ( � � J � � � �J � � 7 $ u � � � � � � & $ � % � ! % $ � � � � 7 * � � 1 $ � � � $ ( + / 1 � ( � + $ u � � � � � P / $ � % � ! % $ � � " � 7 * � � 1 $ � � � $( + " 1 � ( � + $ u * + � � � � � � ? � $ � % � ! % $ � � � ? 7 * � � 1 $ � � � $ ( + � + � 1 � ( � + � I � � � � � � $ � % � ! $ � � 7 � �� � * � $ % 2 2 � $ $ ( F � $ � % � ! ( ) 5 1 � F � � � � � * 2 2 % 1 * 2 ! � J J � � � � � $ � ( ) * � � $ �R $ � 1 $ \ U % ( � � $ 7 � 1 � 5 1 � 5 * 1 � � J � 1 � � � � � � & $ � % � ! L 8 � � 1 $ ( + � � � & N * + � � � � � � P / $ � % � !L 0 * + % � � * � � � P Q N � 8 � � 1 $ ( + * � $ � 5 1 � 5 * 1 � � A ] ^ _ ` a b c d e d a a f v m o ` w c o ` a b n a g o p ^ q m d c b f a nr ^ s n a i b f d c b f i m ` b _ x a o i m y z { z | } ( + � � � & � I � � * � F * + � * � $ � J 2 * � 2 % � * � ( � + � + * + � � � 2 � 1 � + ( 2$ 5 1 � * � $ � � � � ( + 2 � % � � A 2 � � 2 9 ( + � � � $ � + $ ( � ( F ( � ! � J � � � � $ � ( ) * � � � J � � � � J � � 7 � � 2 � * + � $ ( +5 � ! $ ( � 1 * 5 � ( 2 5 * 1 * ) � � � 1 $ u * F � ( � ( + * 1 ( � � ) � � ( 2 * + � 2 � � J J ( 2 ( � + � $ � � � 2 � ( � + � 1 1 � 1 $ u E % ( 2 92 * � 2 % � * � ( � + � J 5 � * 9 J � � 7 $ * + � � � � ( 1 2 � + J ( � � + 2 � � ( ) ( � $ u * + � 5 1 ( + � ( + � J 1 � $ % � � $ �I � � 1 � $ % � � $ � J � � � $ ( + � � $ � * � ( � + J 1 � E % � + 2 ! * + * � ! $ ( $ * 1 � 5 1 � $ � + � � � ( + � � � + � 4 � $ � 2 � ( � + �I � � $ � � * � * * 1 � � � � 1 � � % 1 + 5 � 1 ( � � J � � � � � $ � ( ) * � � $ 7 � ( 2 � 7 � 1 � 2 * � 2 % � * � � � J 1 � ) � � � J � � � � � * � * �

-2-6 � ) � � ( ) � $ J � � � � � $ � ( ) * � � $ * 1 � 1 � E % ( 1 � � � + * 1 ( F � 1 + � * 1 * + � 4 ( $ � ( + * % ( + $ � * � ( � + � O J � � �$ � 1 � * ) J � � 7 1 � 2 � 1 � $ * 1 � � � + u � � � 1 � $ % � � $ � J � � � $ ( + � � $ � * � ( � + J 1 � E % � + 2 ! * + * � ! $ ( $ 2 * + C � * 5 5 � ( � � �O + ) � $ � 2 * $ � $ u J � � � � � $ � ( ) * � � $ * 1 � 1 � E % ( 1 � � � + % + * % � � 7 * � � 1 $ � � � $ * + � � � � 1 � J � 1 � 1 � � ! � +1 � ( � + * � J � � � � J 1 � E % � + 2 ! * + * � ! $ ( $ � E % * � ( � + $ J � 1 J � � � � � $ � ( ) * � ( � + � I � � $ � � E % * � ( � + $ � * F �� ( ) ( � * � ( � + $ � @ % ( � � � ( + � J � 1 J � � � � � $ � ( ) * � ( � + % $ ( + $ ( + � � $ � * � ( � + J 1 � E % � + 2 ! * + * � ! $ ( $ * + �1 � ( � + * � J � � � � J 1 � E % � + 2 ! * + * � ! $ ( $ ( $ 5 1 � F ( � � � * $ 7 � � � * $ 7 � 1 9 � � � 4 * ) 5 � � $ � I � � J ( + * � $ � 2 � ( � +� J � � ( $ 1 � 5 � 1 � 5 1 � F ( � � $ � � 2 % ) � + � * � ( � + � + � � � � � � 2 � 1 � + ( 2 $ 5 1 � * � $ � � � � # D D @ � � � # D D @ � �* % � � ) * � � $ � � � 2 * � 2 % � * � ( � + � J 1 � � % 1 + 5 � 1 ( � � J � � � � J � � 7 $ C * $ � � � + 1 � ( � + * � J � � � � J 1 � E % � + 2 !* + * � ! $ ( $ � # D D @ � � ( $ 5 1 � F ( � � � � + � ( $ 9 ( + � � � C * 2 9 2 � F � 1 � J � � ( $ 1 � 5 � 1 � � # D D @ � � 7 * $� � F � � � 5 � � ( + ' � � % $ [ � 1 $ ( � + = u * + � ( $ 5 1 � F ( � � � ( + ' � � % $ [ � 1 $ ( � + = * + � 3 4 2 � � [ � 1 $ ( � + � ? �

-3-� � � � � � � � � � � � � � � � � � � � � � � � � � � � � � � � I � � � * � * C * $ � J � 1 $ ( + � � $ � * � ( � + J � � � � J 1 � E % � + 2 ! * + * � ! $ ( $ 2 � + $ ( $ � � � � J * � � J � � � � � * � * � �� � � Q J � 1 Q = * % � � 7 * � � 1 $ � � � $ � + � � � ( $ � * + � � J K � 7 J � % + � � * + � * $ � ( $ � � � ( + I * C � � " � � � I � � $ �7 * � � 1 $ � � � $ 7 � 1 � + � � * J J � 2 � � � C ! 1 � % � * � ( � + u � * � * � � � * $ � � & ! � * 1 $ � J J � � � � � * � * u 7 � 1 � + � �% 1 C * + ( Z ( + u * + � 5 * $ $ � � * � � 5 1 � 1 � E % ( $ ( � � $ � * � ( $ � ( 2 * � � � $ � $ J � 1 J 1 � E % � + 2 ! * + * � ! $ ( $ � I � � � � 2 * � ( � + $� J � � � � ! � 1 � ) � � 1 ( 2 $ � * � ( � + $ * 1 � $ � � 7 + ( + D ( % 1 � " � � �I � � 2 � ) 5 % � � 1 5 1 � 1 * ) G D @ P P 7 * $ % $ � � J � 1 $ ( + � � $ � * � ( � + J 1 � E % � + 2 ! * + * � ! $ ( $ � I � �U � + � 1 * � ( Z � � 3 4 � 1 � ) � [ * � % � L U 3 [ N * + � � � � I � 1 � � 0 * 1 * ) � � � 1 ' � H + � 1 ) * � L ' K � N 5 1 � C * C ( � ( � !� ( $ � 1 ( C % � ( � + $ 7 � 1 � 2 � + $ ( � � 1 � � J � 1 J 1 � E % � + 2 ! * + * � ! $ ( $ � I � � 2 � � ( 2 � C � � 7 � � + � � � U 3 [ � 1 � � �' K � � ( $ � 1 ( C % � ( � + 7 * $ C * $ � � � + � � � ) � * + * C $ � � % � � � � F ( * � ( � + C � � 7 � � + � � � � � � � 1 � � ( 2 * � * + �� ) 5 ( 1 ( 2 * � 5 1 � C * C ( � ( � ( � $ � J � � � % 5 5 � 1 � * � J � J � � � � * � * $ � � � W + � ! � � � % 5 5 � 1 � * � J � J � � � � * � * $ � �7 * $ % $ � � C � 2 * % $ � ( � ( $ � � ( $ 5 � 1 � ( � + � J � � � 2 % 1 F � 7 ( � � 7 � ( 2 � 7 � � * F � � � � ) � $ � ( + � � 1 � $ � A � � � " H! � * 1 1 � � % 1 + 5 � 1 ( � � * + � * C � F � � I � � ' K � � ( $ � 1 ( C % � ( � + 7 * $ � � � C � � � � 1 J ( � � ( + � ( $ � 1 ( C % � ( � + � + / "L Q P M N � J � � � Q = 7 * � � 1 $ � � � $ �I � � � $ � ( ) * � � � J � � � � J � � 7 1 * � � $ J � 1 � � � " H u = H u � & H u " & H u = & H u � & & H u * + � " & & H ! � * 1 1 � � % 1 +5 � 1 ( � � $ * 1 � � ( $ � � � ( + I * C � � " � " � U � + � 1 * � � ! u � � � 2 � + J ( � � + 2 � ( + � � � � $ � ( ) * � � J � 1 � � + 1 � � % 1 +5 � 1 ( � � $ ( $ � � 7 7 � � + � � � $ * ) 5 � � $ ( Z � ( $ $ ) * � � � # � � % 1 + 5 � 1 ( � � J � � 7 $ 7 � 1 � E % * � ( J ( � � C !2 * � 2 % � * � ( + � � � � = M 2 � + J ( � � + 2 � ( + � � 1 F * � * 1 � % + � � � � � $ � ( ) * � � $ � J � � � " H u " & H * + � � & & H ! � * 11 � � % 1 + 5 � 1 ( � � J � � 7 $ � I � � 2 � + J ( � � + 2 � ( + � � 1 F * � $ 7 � 1 � 2 * � 2 % � * � � � * $ $ % ) ( + * ' K � � ( $ � 1 ( C % � ( � +( + * � � 2 * $ � $ � I � � 2 � + J ( � � + 2 � ( + � � 1 F * � $ ( + I * C � � " � � * 1 � ( F � + * $ * 5 � 1 2 � + � * � � J � � � ' K � 1 � � % 1 +5 � 1 ( � � J � � 7 $ � I ! 5 ( 2 * � % 5 5 � 1 * + � � � 7 � 1 � = M 2 � + J ( � � + 2 � ( + � � 1 F * � $ * 1 � ( + � ( 2 * � � � ( + I * C � � " � �* $ � � � ) � � ( * + $ � J � � � % 5 5 � 1 * + � � � 7 � 1 � = M 2 � + J ( � � + 2 � ( + � � 1 F * � $ � J � * 2 � 1 � � % 1 + 5 � 1 ( � � � U ( F � +� � � ) * + ( � % � � � J $ � ) � � J � � � 2 � + J ( � � + 2 � ( + � � 1 F * � $ * � � ( � 1 � � % 1 + 5 � 1 ( � � $ u ( � ( $ 2 � � * 1 � � * � � ( �1 � � % 1 + 5 � 1 ( � � J � � 7 $ $ � � % � � + � � C � % $ � � J � 1 $ � ) � $ � * � ( � + $ 7 ( � � $ ) * � � $ * ) 5 � � $ ( Z � $ �

-0+030.00
-20
-10
0
10
20
30
-20
-10
0
10
20
30
-20 -10 0 10 20
-0+025.00
-20
-10
0
10
20
30
-20
-10
0
10
20
30
-20 -10 0 10 20
-0+020.00
-20
-10
0
10
20
30
-20
-10
0
10
20
30
-20 -10 0 10 20
-0+015.00
-20
-10
0
10
20
30
-20
-10
0
10
20
30
-20 -10 0 10 20
-0+010.00
-20
-10
0
10
20
30
40
-20
-10
0
10
20
30
40
-20 -10 0 10 20
-0+005.00
-20
-10
0
10
20
30
40
-20
-10
0
10
20
30
40
-20 -10 0 10 20
0+000.00
-20
-10
0
10
20
30
40
-20
-10
0
10
20
30
40
-20 -10 0 10 20
0+005.00
-20
-10
0
10
20
30
40
-20
-10
0
10
20
30
40
-20 -10 0 10 20
0+010.00
-20
-10
0
10
20
30
40
-20
-10
0
10
20
30
40
-20 -10 0 10 20
0+015.00
-20
-10
0
10
20
30
-20
-10
0
10
20
30
-20 -10 0 10 20
0+020.00
-20
-10
0
10
20
30
-20
-10
0
10
20
30
-20 -10 0 10 20
0+025.00
-20
-10
0
10
20
30
-20
-10
0
10
20
30
-20 -10 0 10 20
0+030.00
-20
-10
0
10
20
30
-20
-10
0
10
20
30
-20 -10 0 10 20
0+035.00
-20
-10
0
10
20
30
-20
-10
0
10
20
30
-20 -10 0 10 20
0+040.00
-20
-10
0
10
20
30
-20
-10
0
10
20
30
-20 -10 0 10 20
0+045.00
-20
-10
0
10
20
30
-20
-10
0
10
20
30
-20 -10 0 10 20
0+050.00
-20
-10
0
10
20
30
-20
-10
0
10
20
30
-20 -10 0 10 20
0+055.00
-20
-10
0
10
20
30
-20
-10
0
10
20
30
-20 -10 0 10 20