Embed Size (px)
Citation preview

Engineered multiwavelength conversion using nonperiodic optical superlattice optimized by
genetic algorithm
Jui-Yu Lai,1 Yi-Jhen Liu,
1 Hung-Yu Wu,
2 Yen-Hung Chen,
2 and Shang-Da Yang
1*
1Institute of Photonics Technologies, National Tsing Hua University, Hsinchu 30013, Taiwan 2Department of Optics and Photonics, National Central University, Jhongli 320, Taiwan
Abstract: We propose and experimentally demonstrate a new scheme for flexible multiwavelength conversion that uses the genetic algorithm with two target functions to optimize the nonperiodic optical superlattice (NOS). Compared to the widely used aperiodic optical superlattice approach, our scheme can achieve ~15% higher overall conversion efficiency, better spectral fidelity, and allows for further improvement of the performances if a larger genetic pool is used. Numerical analysis also shows that the resulting conversion efficiency spectrum is rather insensitive to typical fabrication errors, and is distorted under pump depletion in a similar scale as that of a periodic quasi-phase matching grating. Experimentally measured conversion efficiency spectra of the two fabricated NOS devices are in good agreement with the target curves.
©2010 Optical Society of America
OCIS codes: (230.7405) Wavelength conversion devices; (230.4320) Nonlinear optical devices; (160.3730) lithium niobate;
References and links
1. D. S. Hum, and M. M. Fejer, “Quasi-phasematching,” C. R. Phys. 8(2), 180–198 (2007). 2. J. Liao, J. L. He, H. Liu, J. Du, F. Xu, H. T. Wang, S. N. Zhu, Y. Y. Zhu, and N. B. Ming, “Red, yellow, green
and blue four-color light from a single, aperiodically poled LiTaO3 crystal,” Appl. Phys. B 78(3-4), 265–267 (2004).
3. W.-C. Hsu, Y.-Y. Lai, C.-J. Lai, L.-H. Peng, C.-L. Pan, and A. H. Kung, “Generation of multi-octave-spanning laser harmonics by cascaded quasi-phase matching in a monolithic ferroelectric crystal,” Opt. Lett. 34(22), 3496–3498 (2009).
4. M. Asobe, O. Tadanaga, H. Miyazawa, Y. Nishida, and H. Suzuki, “Multiple quasi-phase- matched device using continuous phase modulation of χ(2) grating and its application to variable wavelength conversion,” IEEE J. Quantum Electron. 41(12), 1540–1547 (2005).
5. Y. Qin, C. Zhang, D. Zhu, Y. Zhu, H. Guo, G. You, and S. Tang, “Engineered nonlinear photonic quasicrystals for multi-frequency terahertz manipulation,” Opt. Express 17(14), 11558–11564 (2009).
6. H. Liu, Y. Y. Zhu, S. N. Zhu, C. Zhang, and N. B. Ming, “Aperiodic optical superlattices engineered for optical frequency conversion,” Appl. Phys. Lett. 79(6), 728–730 (2001).
7. M. H. Chou, K. R. Parameswaran, M. M. Fejer, and I. Brener, “Multiple-channel wavelength conversion by use of engineered quasi-phase-matching structures in LiNbO(3) waveguides,” Opt. Lett. 24(16), 1157–1159 (1999).
8. C. R. Fernández-Pousa, and J. Capmany, “Dammann Grating Design of Domain-Engineered Lithium niobate for equalized wavelength conversion grids,” IEEE Photon. Technol. Lett. 17(5), 1037–1039 (2005).
9. M. Asobe, O. Tadanaga, T. Umeki, T. Yanagawa, Y. Nishida, K. Magari, and H. Suzuki, “Unequally spaced multiple mid-infrared wavelength generation using an engineered quasi-phase-matching device,” Opt. Lett. 32(23), 3388–3390 (2007).
10. Y. W. Lee, F. C. Fan, Y. C. Huang, B. Y. Gu, B. Z. Dong, and M. H. Chou, “Nonlinear multiwavelength conversion based on an aperiodic optical superlattice in lithium niobate,” Opt. Lett. 27(24), 2191–2193 (2002).
11. X. Chen, F. Wu, X. Zeng, Y. Chen, Y. Xia, and Y. Chen, “Multiple quasi–phase-matching in a nonperiodic domain-inverted optical superlattice,” Phys. Rev. A 69(1), 013818 (2004).
12. R. L. Haupt, and S. E. Haupt, Practical Genetic Algorithms, 2nd edition, WILEY, (New-York, 2004). 13. R. C. Eckardt, and J. Reintjes, “Phase matching limitations of high efficiency second harmonic generation,”
IEEE J. Quantum Electron. 20(10), 1178–1187 (1984). 14. G. Cormier, R. Boudreau, and S. Theriault, “Real-coded genetic algorithm for Bragg grating parameter
synthesis,” J. Opt. Soc. Am. B 18(12), 1771–1776 (2001).
(C) 2010 OSA 1 March 2010 / Vol. 18, No. 5 / OPTICS EXPRESS 5328#122924 - $15.00 USD Received 19 Jan 2010; revised 24 Feb 2010; accepted 24 Feb 2010; published 26 Feb 2010
1. Introduction:
Quasi-phase-matching (QPM) implemented by microstructured ferroelectrics and semiconductors has enabled a wide variety of wavelength conversion processes that are unachievable by conventional birefringence-phase-matching [1]. For example, four-color (red, yellow, green, and blue) light generation has been realized by second-harmonic generation (SHG) and sum-frequency generation (SFG) processes in single aperiodically poled LiTaO3 crystal pumped by a dual-wavelength laser [2]. Cascaded SHG/SFG processes in a monolithic LiTaO3 crystal with four different poling periods in sequence was recently used to generate multi-octave-spanning laser harmonics, which will permit the synthesis of carrier-envelope phase stabilized subfemtosecond pulse train [3]. Simultaneous wavelength switching (packet routing) of 40 Gb/s four-channel signals using a SHG/difference-frequency generation cascading scheme in a multiple-QPM LiNbO3 waveguide has been reported [4]. Optical rectification in a quasiperiodic LiTaO3 crystal pumped by 70 fs Ti/S laser pulses was demonstrated to produce multi-frequency terahertz radiation [5]. In general, multiple phase-matching (PM) spectral peaks (i.e., reciprocal vectors) with arbitrarily specified distributions of spacing and relative strength are desired in these multiple parametric processes, which cannot be accomplished by some of the existing design methods [4,6–8]. Periodic continuous phase modulation with suppression of undesired PM peaks [9] can meet the aforementioned requirements, however, the spacing between PM spectral peaks is limited by integral multiples of some unit value (determined by the phase modulation period), and is unsuitable in designing PM spectra with a small number of well-separated peaks [2,3,6]. Aperiodic optical superlattice (AOS) optimized by simulated annealing (SA) [10] also allows for great design flexibility, but the domain size is limited to integral multiples of some unit block length. In contrast, nonperiodic optical superlattice (NOS) [11] removes the domain size restriction, and is expected to achieve better conversion efficiency and design fidelity. However, the NOS in Reference [11] can only achieve PM peaks of equal height and has to be optimized by the combination of SA and genetic algorithm (GA) [12]. In this work, we numerically and experimentally demonstrate NOS devices optimized by GA to achieve PM peaks of unequal spacing and different heights. Our simulations show that using a second target function in GA to minimize the discrepancy between the achieved and the “damped” target efficiencies allows for better overall efficiency and spectral fidelity, especially when the target PM peaks have different heights. Compared to the state-of-the-art AOS approach, our scheme permits ~15% higher overall efficiency and better spectral fidelity. Moreover, the performances of NOS scheme can be further improved by employing a larger genetic pool, while the AOS approach is subject to tradeoff between efficiency and fidelity. Numerical analysis also shows that the performances of NOS devices, as those of a periodic QPM grating [1] and AOS devices [10], are rather insensitive to typical fabrication errors. The distortion of conversion efficiency spectrum of a NOS device in the presence of pump depletion is found comparable to that of a periodic QPM grating [13]. Two NOS devices were fabricated using the standard electric-field poling technique and congruent LiNbO3 bulk crystals. The experimentally measured conversion efficiency spectra are in good agreement with the target curves, proving the feasibility of our scheme.
2. Theory:
Without loss of generality, we demonstrate the NOS scheme by investigating SHG in a congruent LiNbO3 bulk of length L. The crystal is divided into N blocks with different lengths (to be optimized) and alternating domain orientations. If the pump is non-depleted, the conversion efficiency at fundamental wavelength λ is given by [7]:
2 ( )
0
1( ) ( ) ( ), ( ) ( )
Li k x
norm eff effP d d d x e dxL
λωη λ η λ λ λ ∆ ⋅= = ∫ ɶ (1)
(C) 2010 OSA 1 March 2010 / Vol. 18, No. 5 / OPTICS EXPRESS 5329#122924 - $15.00 USD Received 19 Jan 2010; revised 24 Feb 2010; accepted 24 Feb 2010; published 26 Feb 2010

where norm
η is the normalized efficiency (determined by the material characteristics and
operating wavelengths) in units of percent per watt, ω
P is the fundamental power, eff
d is the
effective nonlinear coefficient depending on the NOS design, ∆k is the wave vector mismatch
between the fundamental and second-harmonic waves, and ( )d xɶ (taking binary values of 1 or
-1) represents the spatial distribution of domain orientation. For a periodic QPM grating of
length L and 50% duty cycle, ( )η λ is roughly a sinc2 function with a peak value of
refη = ( )2
0( ) 2
normPωη λ π⋅ ⋅ at the central PM wavelength
0λ . To quantitatively measure the
performance of the engineered QPM devices, we will illustrate the conversion efficiency
spectra normalized to ref
η , i.e. ( )η λɶ ( )ref
η λ η= . A general target PM spectrum consists of M
phase-matching peaks with specified relative efficiencies (0)
αη (normalized such that
(0)
1
1M
αα
η=
=∑ ) occurring at central (fundamental) wavelengths { }αλ , α =1, 2, …, M. To
optimize the domain distribution function ( )d xɶ by GA, we randomly generate a genetic pool
of Np individuals to represent the Np initial candidates of ( )d xɶ . For each individual ( )d xɶ , we
can evaluate the conversion efficiency spectrum by Eq. (1) and the corresponding M
conversion efficiencies (normalized to ref
η ) αη ( )αη λ= ɶ . The fitness of each individual can
be quantitatively measured by the value of some target function, from which the “evolution” of the genetic pool (including steps of selection, crossover, mutation and migration) can be
performed numerically in search of an optimal solution of ( )d xɶ . In our NOS design, the
target function 1
T is used in the first 1
N generations(iterations) of the evolution to obtain
some intermediate solution:
2
(0)
1
1
M
T α αα
η η=
= − ∑ (2)
As will be evidenced in Section 3, minimizing 1
T can only suppress nonlinear conversion
at undesired wavelengths (λ∉{ }αλ ) while the resulting spectral shape could be unsatisfactory.
This problem can be solved by preserving the elite individuals identified by 1
T and
subsequently using a second target function 2
T in the subsequent 2
N generations of the
evolution:
(0)
2 1
1
ˆM
T T α αα
η η=
= + −∑ (3)
where (0) (0)ˆtotα αη η η= ⋅ (
1
M
tot αα
η η=
= ∑ means the achieved overall efficiency) denote the
“damped” target efficiencies. Here the factor tot
η is used to dynamically damp the original
target conversion efficiencies (0)
αη without distorting the distribution of the relative strength,
by which the evolution power of GA can contribute to improving the spectral shape. In our
simulations, the numbers of generations 1
N and2
N were properly specified such that the
fitness values of 1
T and 2
T could converge. Our experiences show that 1
N is typically much
larger than 2
N , for the first phase of evolution (using 1
T ) has to suppress nonlinear
conversion at all the undesired wavelengths, while the second phase (using 2
T ) only adjusts
the conversion efficiencies at a limited number of desired wavelengths.
(C) 2010 OSA 1 March 2010 / Vol. 18, No. 5 / OPTICS EXPRESS 5330#122924 - $15.00 USD Received 19 Jan 2010; revised 24 Feb 2010; accepted 24 Feb 2010; published 26 Feb 2010

3. Simulations
We consider two different conversion efficiency spectra S1 and S2 in our simulations and experiments. The target spectrum S1 [Fig. 1(a)] consists of three discrete peaks with unequal spacing and a common height, while the target spectrum S2 [Fig. 1(b)] is composed of five discrete peaks distributed in a V-shape. The genetic pool used in most of our NOS designs consists of 8 subpopulations with 150 individuals each (Np =1200). The individuals of one subpopulation can evolve independently or migrate to another subpopulation to improve the diversity of the genetic pool. Each individual consists of 2000 ferroelectric domains, and the minimum domain length is set as 4.5 µm in view of the typical limitations of high-quality
electric-field poling. The numbers of generations are set as 1
5000N = and 2
300N = for
target functions T1 and T2, respectively.
Fig. 1. The target conversion efficiency spectra with (a) three discrete peaks with unequal spacing and a common height, and (b) five discrete peaks distributed in a V-shape, respectively.
Several parameters are used to quantitatively measure the performances of different
designs. The overall efficiency 1
M
tot αα
η η=
= ∑ and the average spectral shape error
(0)
1
ˆM
totα αα
η η η η=
∆ = −∑ are useful for well-behaved spectra, for they only take the conversion
efficiencies at targeted wavelengths { }αλ into account. In the presence of a small number of
noticeable ghost peaks at undesired wavelengths, we can use the design fidelity F, defined as
the ratio of the average efficiency of the M target peaks tot
Mη to the largest ghost efficiency
ghostη , to estimate the quality of the achieved spectral shape. When the conversion efficiency
spectrum is seriously deviated from the target one and has many noticeable ghost peaks, it is
more appropriate to evaluate the performance by examining the “continuous” spectrum ( )η λ ,
instead of the discrete peak efficiencies. We will use the effective power ratio
argeff t et totr A A= as the quantitative measure under the circumstances, where
targetA and
totA
represent the summation of the areas of the M target main lobes and the total area of the conversion efficiency spectrum.
3.1 Usefulness of the second target function
Table 1 summarizes the design parameters and the simulation results when designing the target spectrum S1 by using target function(s) T1, T2, T1&T2 in the NOS scheme, and by using the AOS approach, respectively. For this relatively simple target spectrum, the performances of different design approaches are very similar.
(C) 2010 OSA 1 March 2010 / Vol. 18, No. 5 / OPTICS EXPRESS 5331#122924 - $15.00 USD Received 19 Jan 2010; revised 24 Feb 2010; accepted 24 Feb 2010; published 26 Feb 2010

Table 1. Simulation results when designing the PM spectrum S1 consisting of three discrete peaks with unequal spacing and equal height using NOS (columns 3-5) and AOS
(column 6) schemes.
αλ (nm)
(0)
αη
αη
(T1)
αη
(T2)
αη
(T1 &T2)
αη
(AOS)
1538 0.3333 0.2579 0.2390 0.2589 0.2320
1546 0.3333 0.2604 0.2393 0.2589 0.2297
1559 0.3333 0.2592 0.2378 0.2589 0.2255
totη 1 0.7775 0.7161 0.7767 0.6876
η∆ 0 0.33% 0.25% 51.7 10−× 0.96%
The usefulness of using a second target function T2 in the NOS scheme becomes evident when a more complicated target spectrum S2 is taken into account. As shown in Table 2 and Fig. 2, using T1 or T2 alone suffers from worse spectral shape fidelity, where (i) the ∆η values are 12-13 times higher than that of using T1&T2, and (ii) the range of the relative efficiency
errors of the five individual peaks (defined as ( )(0) (0)ˆ ˆα α αη η η− ) is greatly suppressed from -
19.6%−4.54% (only using T1) to -0.25%−0.91% (using T1&T2). The overall conversion
efficiency is significantly lower if only T2 is used (tot
η = 0.45, versus 0.86 when using T1&T2).
These results indicate that (i) using T1 can boost the overall efficiency by suppressing the nonlinear conversion at all the undesired wavelengths, and (ii) subsequent employment of T2 can improve the spectral fidelity by minimizing the discrepancy between the achieved and the dynamically damped conversion efficiency spectra.
Table 2. Simulation results when designing the PM spectrum S2 consisting of five discrete peaks distributed in a V-shape using NOS (columns 3-5) and AOS (column 6) schemes.
αλ (nm) (0)
αη
αη
(T1)
αη
(T2)
αη
(T1 &T2)
αη
(AOS)
1540 0.2667 0.2333 0.1137 0.2302 0.2036
1545 0.1833 0.1548 0.0858 0.1594 0.1378
1550 0.1000 0.0678 0.0453 0.0864 0.0756
1555 0.1833 0.1523 0.0793 0.1576 0.1350
1560 0.2667 0.2355 0.1251 0.2299 0.1984
totη 1 0.8437 0.4492 0.8635 0.7504
η∆ 0 4.43% 4.05% 0.33% 1.15%
Fig. 2. Normalized conversion efficiency spectra of NOS for target spectrum S2. Using target function(s) T1(dash-dot), T2(dotted) and T1&T2(solid).
(C) 2010 OSA 1 March 2010 / Vol. 18, No. 5 / OPTICS EXPRESS 5332#122924 - $15.00 USD Received 19 Jan 2010; revised 24 Feb 2010; accepted 24 Feb 2010; published 26 Feb 2010

3.2 Comparison between the NOS and AOS schemes
To highlight the advantages of the NOS scheme, we design two AOS devices for the two target spectra S1, S2 discussed in Section 3.1 for comparison. The total length L and unit block
size dx of each AOS device were made equal to the total length (18.9 mm) and the minimum
domain length (4.40 µm and 4.82 µm in designing target spectra S1 and S2, respectively) of the corresponding NOS device, such that the differences of performance solely arise from the domain length restriction. The AOS device designed for the target spectrum S1 [Fig. 3(a),
dashed] achieves an overall efficiency of tot
η = 0.69 and an average spectral shape error of
η∆ = 0.96% (compared with 0.78tot
η = and 51.7 10η −∆ = × of the NOS counterpart, see
Table 1). When designing the target spectrum S2, the AOS device [Fig. 3(b), dashed] produces
totη = 0.75 and η∆ = 1.15% (compared with
totη = 0.87 and η∆ = 0.33% of the NOS
counterpart, see Table 2). These results show that, in the absence of domain size restriction, the NOS scheme can achieve better spectral shape fidelity and increase the overall conversion efficiency by ~15% over the corresponding AOS design.
Fig. 3. Normalized conversion efficiency spectra of the NOS (solid) and AOS (dashed) devices designed for the target spectra (a) S1, and (b) S2, respectively.
Another major advantage of the NOS scheme is the potential to improve the performances by increasing the size of genetic pool (i.e. the number of individuals Np) at the expense of longer computation time, while AOS method is subject to the tradeoff between the overall efficiency and spectral fidelity. Table 3 summarizes the dependences of the overall conversion
efficiencytot
η , the efficiency of the highest ghost peakghost
η , and the design fidelity F
( 3tot ghost
η η= in this case) on the size of genetic pool Np when designing an NOS device to
achieve the target spectrum S1. Here we use the design fidelity F in place of the average
spectral shape error η∆ because the heights of the three PM peaks are nearly identical in all
design cases, making all the η∆ values negligibly small and can hardly be distinguished from
one another. As the size of genetic pool increases, the overall efficiency is enhanced while the ghost efficiency is suppressed, resulting in constant improvement on the design fidelity. Note that the size of genetic pool is usually chosen to be at least six times of the number of variables (2000 domains in this example) to get satisfactory results [14]. As a result, better performances could be achieved by the NOS scheme if we use a PC cluster to perform simulation with a genetic pool containing more than 12000 individuals until limited by (i) the
minimum domain size that can be properly poled and (ii) the restriction that ( )d xɶ can only
take binary values. In contrast, the total degree of freedom of an AOS device is fixed given the unit block size and the total device length are specified. One can tune the internal weighting factors of the SA objective function to achieve higher overall efficiency at the expense of deteriorated fidelity or vice versa (Table 4). Figures 4(a) and 4(b) illustrate that the
(C) 2010 OSA 1 March 2010 / Vol. 18, No. 5 / OPTICS EXPRESS 5333#122924 - $15.00 USD Received 19 Jan 2010; revised 24 Feb 2010; accepted 24 Feb 2010; published 26 Feb 2010

tradeoff between the efficiency and fidelity is absent or present in the NOS or AOS scheme, respectively.
Table 3. Dependences of the NOS performances on the number of individuals in designing the target spectrum S1.
Number of individuals
Np
Overall efficiency
totη
Highest ghost peak efficiency
ghostη
Design fidelity
3tot ghost
F η η=
Computation time* T (minutes)
400 0.707 0.0310 7.60 88.6
800 0.725 0.0295 8.19 177
1200 0.776 0.0272 9.51 265
2000 0.789 0.0274 9.60 441
* Using a personal computer with Intel 2.4 GHz quad-core CPU.
Table 4. Dependences of the AOS performances on the internal weighting factors of the SA objective function in designing the target PM spectrum S1.
SA objective function Overall efficiency tot
η Ghost peak efficiency
ghostη
Design fidelity
3tot ghost
F η η=
objective function 1 0.603 0.0159 12.6
objective function 2 0.671 0.0218 10.3
objective function 3 0.687 0.0264 8.67
objective function 4 0.703 0.0313 7.49
Fig. 4. Normalized conversion efficiency spectra of the (a) NOS, and (b) AOS devices designed for the target spectrum S1 derived at different (a) number of individuals, and (b) internal weighting factors of the SA objective function, respectively.
3.3 Impacts of fabrication errors and pump depletion
The conversion efficiency spectrum of a real NOS device could be deviated from the designed one as a result of errors arising from the fabrication procedures. We consider two types of
error: (i) the uniform domain broadening(shrinking) x∆ due to overpole(underpole) in the
poling process, (ii) the random variation x∂ due to uncontrollable factors. Each domain
length therefore would be deviated from the optimized one by an amount of x x∆ + ∂ , where
x∂ came from a normally distributed random variable of zero-mean and a standard deviation
(C) 2010 OSA 1 March 2010 / Vol. 18, No. 5 / OPTICS EXPRESS 5334#122924 - $15.00 USD Received 19 Jan 2010; revised 24 Feb 2010; accepted 24 Feb 2010; published 26 Feb 2010
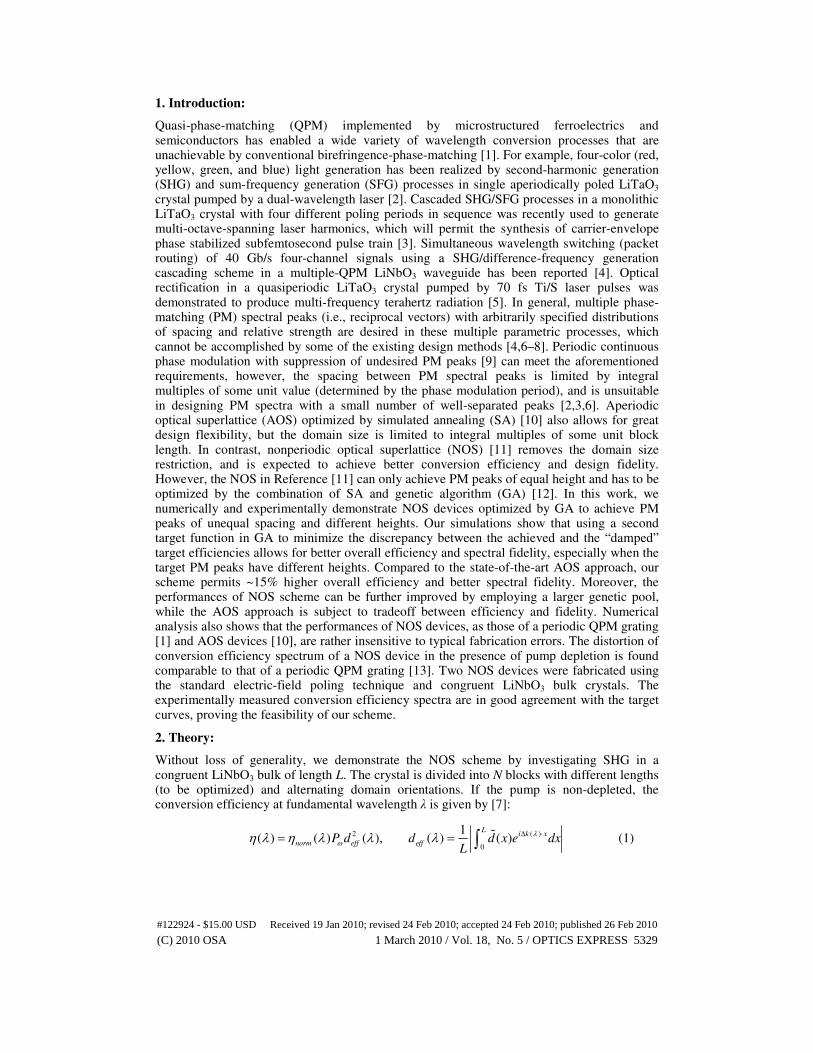
of x∂ . We introduce the same domain error parameters used in Reference [10], x∆ = 0.7 µm,
x∂ = 0.7 µm, to the NOS devices designed for the target spectra S1 and S2. Fig. 5 shows the
conversion efficiency spectra designed for the target spectrum S1 [Fig. 5(a)] and S2 [Fig. 5(b)], without (solid) and with (dashed) domain error. Compared to the error-free devices, the
imposed domain errors ( x∆ = x∂ = 0.7 µm) only lower the overall efficiency tot
η by ~5.7%
and slightly deteriorate the average spectral shape error η∆ by ~0.56%. The overall
efficiency degradation (~5.7%) is smaller than those of the AOS device in Ref. [10] (~7.7%) and a periodic QPM grating simulated as a reference (~7%). This means that the NOS scheme is rather insensitive to the fabrication errors.
Fig. 5. Normalized conversion efficiency spectra of the two NOS devices designed for target spectra (a) S1, and (b) S2, before (solid) and after (dashed) the introduction of a uniformly
overpoled error of x∆ = 0.7 µm and a normally distributed domain length error with a
standard deviation of x∂ = 0.7 µm, respectively. The values near the peaks represent the
reduction of normalized efficiencies due to the domain errors.
When the pump power is sufficiently high such that its depletion has to be taken into account, Eq. (1) is no longer valid and the resulting conversion efficiency spectrum will be distorted. For a purely periodic QPM grating, there exists analytic formula to quantitatively
describe the dependence of the conversion efficiency spectrum ( )η λ (a sinc-square function
when the pump is non-depleted) on its peak value 0
( )ref
η η λ= (0
λ is the central PM
wavelength) [13]. It shows that the main lobe of ( )η λ gets narrower, while the side lobes and
unwanted “noise” can be significantly amplified at high peak conversion efficiency. To
investigate the distortion of ( )η λ of NOS devices due to pump depletion, we numerically
solve the coupled equations of fundamental and second-harmonic plane waves in the presence
of longitudinally varying domain orientation function ( )d xɶ derived by the NOS scheme.
Figures 6(a) and Fig. 6(b) show the absolute conversion efficiency spectra (solid) of the same
NOS device designed for target spectrum S1 at peak conversion efficiencies SHG
η (defined as
the ratio of the second-harmonic power to the fundamental power at the wavelength corresponding to the maximum conversion efficiency) of 51% and 91%, respectively. Compared with the result at low conversion efficiency (dashed, the peak of the curve is
normalized to the corresponding SHG
η value for comparison), the spectral shape at
SHGη = 51% [Fig. 6(a)] is roughly unchanged while the main lobe width slightly decreases
from 0.59 nm to 0.55 nm. At SHG
η = 91% [Fig. 6(b)], however, the spectral shape is totally
distorted with much reduced main lobe widths (~0.22 nm) and largely amplified ghost peaks
(say at 1550.6 nm, 1567.5 nm). As elucidated before, the effective power ratio eff
r is used to
measure the performance degradation due to the pump depletion. Figure 7 shows that the
(C) 2010 OSA 1 March 2010 / Vol. 18, No. 5 / OPTICS EXPRESS 5335#122924 - $15.00 USD Received 19 Jan 2010; revised 24 Feb 2010; accepted 24 Feb 2010; published 26 Feb 2010

performance of the NOS device (open circles, designed for the target spectrum S1) experiences
dramatic degradation when SHG
η approaches 90%, which is similar to the tendency of a
purely periodic QPM grating (solid) predicted by the analytic formula [13].
Fig. 6. Conversion efficiency spectra (solid) of a NOS device designed for the target spectrum
S1 at peak conversion efficiencies SHG
η of (a) 51%, and (b) 91%, respectively. The peaks of
the reference spectra (dashed) derived at low conversion efficiency are normalized to the
corresponding SHG
η values.
Fig. 7. Conversion efficiency spectral area ratio of target main lobes eff
r versus the peak SHG
conversion efficiency SHG
η for an NOS device (open circles) and a purely periodic QPM
grating (solid), respectively.
4. Experimental results
We use lithographic and electric-field poling techniques to fabricate two congruent LiNbO3 NOS devices designed for the target spectra S1 and S2 according to our simulation results. Both NOS devices have 2000 alternatively oriented domains and a total length of ~18.9 mm. The fundamental beam with 16-mW power comes from a wavelength-tunable continuous-wave external-cavity diode laser (Agilent, 81949A), and is focused to the NOS device by a lens with 20-cm focal-length. The output second-harmonic yield is measured by a photomultiplier tube (Hamamatsu, R636-10) and a lock-in amplifier (EG&G, 7225) as a function of fundamental wavelength. The temperature of the NOS device is carefully controlled within a range of 0.1°C to suppress the error due to the drift of the conversion efficiency spectrum. The fundamental power is also monitored by an InGaAs photodetector to calibrate the conversion efficiency in the presence of pump power fluctuation. Fig. 8 shows that the experimentally measured PM tuning curves agree well with the corresponding two
(C) 2010 OSA 1 March 2010 / Vol. 18, No. 5 / OPTICS EXPRESS 5336#122924 - $15.00 USD Received 19 Jan 2010; revised 24 Feb 2010; accepted 24 Feb 2010; published 26 Feb 2010
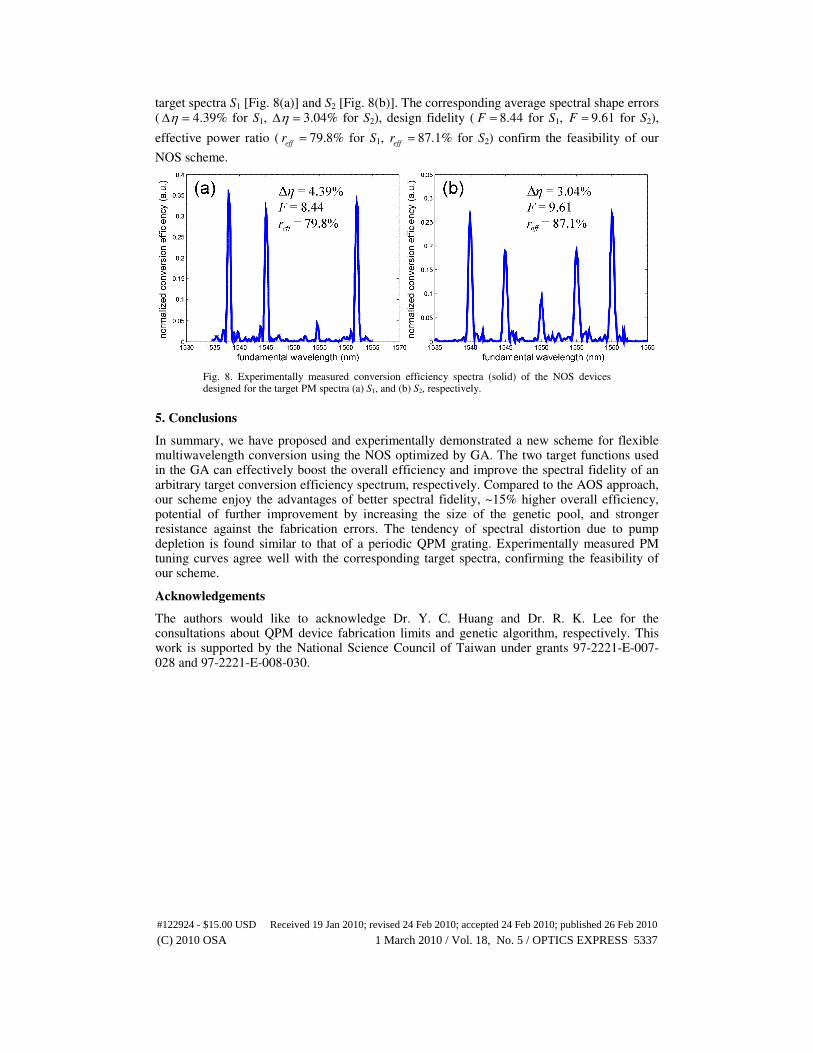
target spectra S1 [Fig. 8(a)] and S2 [Fig. 8(b)]. The corresponding average spectral shape errors ( η∆ = 4.39% for S1, η∆ = 3.04% for S2), design fidelity ( F = 8.44 for S1, F = 9.61 for S2),
effective power ratio (eff
r = 79.8% for S1, effr = 87.1% for S2) confirm the feasibility of our
NOS scheme.
Fig. 8. Experimentally measured conversion efficiency spectra (solid) of the NOS devices designed for the target PM spectra (a) S1, and (b) S2, respectively.
5. Conclusions
In summary, we have proposed and experimentally demonstrated a new scheme for flexible multiwavelength conversion using the NOS optimized by GA. The two target functions used in the GA can effectively boost the overall efficiency and improve the spectral fidelity of an arbitrary target conversion efficiency spectrum, respectively. Compared to the AOS approach, our scheme enjoy the advantages of better spectral fidelity, ~15% higher overall efficiency, potential of further improvement by increasing the size of the genetic pool, and stronger resistance against the fabrication errors. The tendency of spectral distortion due to pump depletion is found similar to that of a periodic QPM grating. Experimentally measured PM tuning curves agree well with the corresponding target spectra, confirming the feasibility of our scheme.
Acknowledgements
The authors would like to acknowledge Dr. Y. C. Huang and Dr. R. K. Lee for the consultations about QPM device fabrication limits and genetic algorithm, respectively. This work is supported by the National Science Council of Taiwan under grants 97-2221-E-007-028 and 97-2221-E-008-030.
(C) 2010 OSA 1 March 2010 / Vol. 18, No. 5 / OPTICS EXPRESS 5337#122924 - $15.00 USD Received 19 Jan 2010; revised 24 Feb 2010; accepted 24 Feb 2010; published 26 Feb 2010