Embed Size (px)
Citation preview

Spring 2008
enlightenmentCollecting and Using Public Information :: Public Information and Public Involvement Processes. :: Performance Journalism: Bridging the Gap Between Agencies and Citizens :: Jamming: Engaging Stakeholders in a New Way :: ON THE HORIZON: 3rd Annual Texas Transportation Forum :: Preview: Summer 2008 Issue
Engagingthe Public:
the art of

Table of ContentsWelcome Letter ............................................................................................................................. iv
Collecting and Using Public Information by Matthew Lindstrom, Ph.D and Martin Nie, Ph.D ............................................................ 2
Public Information and Public Involvement Processesby Robert S. Done, Ph.D. and John Semmens ..................................................................... 14
Performance Journalism: Bridging the Gap Between Agencies and Citizensby Daniela Bremmer, MPA and James H. Bryan, Jr., MPA ................................................. 27
Jamming: Engaging Stakeholders in a New Wayby Mia Zmud . .............................................................................................................................. 47
On the HORIZON: 3rd Annual Texas Transportation Forum .................................. 59
PREVIEW: Summer 2008 Issue - Future of Transportation ...................................... 62
Submission Guidelines for Authors ..................................................................................... 65
Subscription Form ....................................................................................................................... 66
The statements, comments, or opinions expressed within these articles are those of their respective authors, who are solely responsible for them, and do not necessarily represent the views of the Texas Department of Transportation or the Texas Transportation Commission.

Our transportation system affects virtually every aspect of our communities. It moves people, goods, and services; it shapes patterns of growth, facilitates economic prosperity, and ultimately influences the character of these communities. So, whether discussing a long-term plan to build a highway or just a short-term maintenance project, it is people and their communities who will feel the impacts – both positive and negative.
Federal transportation law requires an emphasis on public outreach to educate and inform the public. While transportation agencies and community advocates agree that public involvement is essential, such efforts can be challenging because of the long-time horizons and complex technical issues involved in transportation planning and development. Often, the process not only leaves some stakeholders skeptical, it can sometimes add years to the ultimate completion of worthwhile projects. There is no universal agreement on a “successful” approach to engage the public. However, it is essential that the process presents information to educate the public, facilitate understanding of different perspectives, allay fears where possible, and attempt to build broad-based public support for needed transportation investments and improvements.
In this issue, HORIZON examines the process of engaging the public in the transportation planning process. First, researchers Dr. Matthew Lindstrom and Dr. Martin Nie discuss the importance of public participation in the development of transportation plans and the myths and realities of public participation. Next, John Semmens of the Arizona Department of Transportation and Dr. Robert Done of Data Methods Corp. summarize the current public information and public involvement structures currently available. Then, Daniela Bremmer and James Bryan discuss the principles of “performance journalism,” an approach that the Washington State Department of Transportation developed to improve how information is presented to the public by applying both analytical and journalistic methods. Finally, Mia Zmud of Nustats, a survey research company, presents a look at
the pilot test of an “online jam,” a Web-based online discussion venue that enhances the free flow of ideas in a computer-mediated, virtual environment.
Also in this issue, On the HORIZON offers a look back at this year’s 3rd Annual Texas Transportation Forum through the impressions and quotes from several of the distinguished speakers at this year’s event. On the HORIZON also looks ahead to the Summer 2008 issue by presenting a synopsis of a TxDOT project that develops future transportation scenarios to assist with planning today.
We hope you enjoy this issue of HORIZON and we welcome your comments.
Sincerely,
Amadeo Saenz, Jr., P.E.Executive DirectorTexas Department of Transportation
HORIZONiv Spring 2008 v

2
Collecting and UsingPublic Information
by Matthew Lindstrom, Ph.DSaint John’s University/College of Saint Benedict
andMartin Nie, Ph.D
University of Montana
This article is an excerpt from a larger study prepared for sponsors Federal Highway Administration (FHWA) and the Arizona Department of Transportation (AzDOT). The findings and opinions within do not necessarily reflect the opinions or policy of either the FHWA or AzDOT.
must be aware of several obstacles and pitfalls that lay ahead of them.The Importance of Public Participation Before the question of how to increase and effectively use public participation in the development of transportation plans and programs can be answered, it is necessary to understand the overall importance of this participation. Citizen involvement in the political process is an oft-studied and rich field of inquiry. Voting studies, political alienation, citizen efficacy, and political behavior are all
ollecting and effectively using public information in the development of transportation plans and programs is an
important goal. Unfortunately, many agencies have been unsuccessful in achieving it. This research is dedicated to helping the Arizona Department of Transportation, and other interested agencies, to better their citizen participation efforts. It not only examines the various themes and concepts often discussed in public participation, but also the myths and realities of engaging the public because those tasked with successfully engaging the public

HORIZON Spring 2008
... governmental administration cannot be managed in a closed and private manner, but must actively seek out public input.
Citizen Interest - in AzDOT and other bureaucratic processes.Protection - against costly delays and lawsuits.Planning success - will be increased once the public is involved and their concerns heard.
Conceptualizing ParticipationPublic participation has been a catchword in democratic governments for close to 30 years. The demands for increasing public involvement in government planning and policy making have come from many places.5 Like democracy, the concept of participation conjures up socially desirable meanings-- yet both are slippery ideas that are difficult to define and execute. During their 1973 annual conference, the Highway Research Board focused on the issue of public participation in transportation planning. They came to a consensus on the following definition of “citizen participation” as it relates to transportation planning:
•
•
•
For the purposes of this study, we will essentially use the same definition.
There are two key facets to any process whereby the public participates in the decision making process. First, the procedural element simply allows the public a formal opportunity to voice their concerns and opinions, usually at various stages of decision making. The procedural requirements for public participation are a prerequisite for substantive participation, or participation that entails a real impact and effect on public policy. Secondly, substantive participation implies two-way channels of communication to the extent that government officials and the public become mutual partners in the decision making process.
Most participation takes place on procedural grounds while creating an illusion that the public can have a substantive impact. As a result, even though a citizen’s advice is rejected, they may feel at least they had their day in court and will probably be more willing to go along with the final decision.
Timing and Citizen Participation A recurring theme in the literature is the importance of when participation is sought in the decision-making process. That is, at what stage is citizen involvement elicited and
3
An open process in which the rights of the community to be informed, to influence, and to get a response from government are reflected and in which a representative cross section of affected citizens interact with appointed and elected officials on issues of transportation supply at all stages of planning and development. 6
staples of the social sciences. The question of bureaucratic participation that will be examined here is less well-known but does have an adequate literature base. Participation in the political and decision-making processes is crucial for a healthy and stable democratic system. Although a representative democracy, the United States requires an active and caring citizenry if it is to remain a legitimate democracy. A participatory democracy has three important redemptive qualities. First, it strengthens the democratic spirit through its educative function. Second, it helps build and strengthen communities. And third, participation helps turn institutions into more effective instruments of society.1 Participation is often erroneously thought of as the simple act of voting. Yet, it is and must be much more than this one single and solitary act.2
Public participation in the bureaucratic process has important democratic implications. It is within this type of decision-making process that communities can regain control while issues can be honestly and earnestly discussed. It is a chance to move away from the adversarial politics that currently dominates toward a more open, discursive, and congenial process.3 Moreover, it appears to be what Americans want.4 The political right, left, and center have consistently put forth the merits of increased individual and community political participation.
Despite being politically efficacious, it is realized that successful governing requires some type of popular consent and without some degree of approval, governing and the most basic of decision-making becomes impossible.
The importance of public involvement in the political decision-making process is well-known. There are a number of requirements that bureaucracies must abide by that allow for some degree of citizen involvement and input, i.e., the federal Intermodal Surface Transportation Efficiency Act of 1991 (ISTEA). These statutory requirements were significant for they recognized that governmental administration cannot be managed in a closed and private manner, but must actively seek out public input.
The following are some of the benefits of actively soliciting citizen input in the policy planning process from a theoretical and practical point of view:
Democracy - cannot work or becomes hollow without citizen participation.Br idge - between agency and constituency.Public relations - increased and more effective public participation will inevitably give the agency a more positive standing in the community.Public Trust and Support - is impossible to attain without citizen involvement in the decision-making process.Information - more pertinent and constituency-related information can be gathered and taken into account.Diversity - increasing the number and types of perspectives will result in a more interdisciplinary and multi-valued approach.Preparation - the agency will be better equipped to deal with various contingencies.Education - participants will gain knowledge of the agency, planning process, and project.
•
•
•
•
•
•
•
•
4

HORIZON Spring 2008 6
how do various issues make it to the agenda-setting stage.7, 8 Although the focus of this study is primarily at the implementation level of public policy, it is not immune from the same type of concerns. If citizens are asked to participate in the decision-making process once the project is well underway and close to completed, they may feel slighted and insignificant. Thus, it may be crucial to garner citizen participation from the very beginning.
The Cumulative Curve of InvolvementIn an ideal world, public participation would run throughout the project or policy from the outset. But this ideal has proven difficult to achieve and maintain. Initial interest in a project or policy will be low because plans are general and agency credibility is lacking. But as plans become more developed and citizens see how they will be affected, a “cumulative curve of involvement” develops and public participation tends to increase.9
The research also found that protests are related to whether the public understands and accepts agency decisions.10
The implications of this “cumulative curve of involvement” are as follows:
I t i s common for on ly a f ew c i t i zens to be present a t the beginning or start of a project. Active solicitation is therefore required. Citizens will enter the process at staggered times. Thus, introductory or ientat ion mater i a l s w i l l be needed throughout the project. B u d g e t s w i l l n e e d t o b e ba l a nc e d a c c o rd i n g to w hen
1.
2.
3.
4.
most cit izens enter the process. Although difficult, it is important that citizen participation is elicited at the earliest possible time.
The Timing of Opposition
Directly related to the cumulative curve of involvement is the stage of planning that public opposition usually takes place. It is common for a project to proceed unabated until the latter stages of the planning process whereby it then meets virulent public opposition and negativity. Recognizing this recurring pattern, the Montana Department of Transportation created a task force to examine this recurring problem and made the following recommendations:
More Personal Contact – despite the difficulties inherent in early planning, the task force contends that early informal meetings with landowners, interest groups, and citizens can help the agency attain important and early information and feedback.
Clear Communication – the task force recommends using informal, clear, and concise language, i.e., no abbreviations or acronyms, write for a non-technical and general audience, etcetera.
Talk and Act – communication is critical among project team members and the public. When issues or problems are identified, team members are urged to
5.
1.
2.
3.
...as plans become more developed and citizens see how they will be affected, a “cumulative curve of involvement” develops and public participation tends to increase.9
act. The task force also recommends act ive ly seeking out potent ia l project opponents and adversaries.
Keeping People Informed – the agency must inform more than just those whom attend formal procedures. This can be done through a variety of mediums, i.e., newspapers, radio, and television. 11
This task force contends that the aforementioned recommendations have resulted in a better use of resources, better projects, and a better ability to meet the public interest. Although public attendance at meetings is still low, the department is trying new ways to seek public awareness.
Levels of Citizen ParticipationWithin the existing literature, there is a general agreement on the importance of citizen participation in the bureaucratic decision-making process. From an academic and theoretical point of view, citizen participation is democratically and individually healthy, and from the point of view of the administrator, it is an excellent way to facilitate program-policy success and improve public standing within the community. There also appears to be a consensus regarding the different levels of public participation ranging from complete citizen control to manipulation. These different levels of participation can be seen as a “Ladder of Citizen Participation.”12
4.
Ladder of Citizen Participation
Citizen control, delegated power, and partnership are defined as degrees of citizen power. Placation, consultation, and informing are considered degrees of tokenism. Therapy and manipulation are considered forms of non-participation.
5
citizen control
delegated power
partnership
placation
consultation
informing
therapy
manipulation

HORIZON Spring 2008 8
This is not to say that forms of one-way communication, i.e., public reports, direct mail, advertising, press conferences, and public hearings, are not important, but the motives of the agency must be considered and made known to the public. If an agency is seen by the public or relevant stakeholders as making a mere pro-forma attempt at acquiring citizen participation, they will get little and mostly negative feedback. Citizens are equally weary of public meetings and hearings that are held once a project has already begun, when input becomes a case of too little, too late. 13
myths and realities of public participation
But even with the multiplicity of options available to engage and inform the public in the decision making structure, there are countervailing arguments that challenge the utility of public participation. While many scholars, professionals, and the general public agree that public participation is a worthwhile ideal, there are serious roadblocks when it comes to implementation, particularly in transportation planning.
One of the major reasons behind the difficulties with public participation is the fact that the government objectives in encouraging public involvement can often be contradictory. They may include promoting citizenship, building public support for a project, shaping programs to meet community needs and priorities, or developing an awareness of the neighborhood. This section will review some of the criticisms and obstacles that public officials face when attempting to incorporate public input in the planning process.
The Case Against Citizen ParticipationIn his book, Citizen Participation in American Communities: Strategies for Success, Professor Daniel Barber classified the case against citizen participation in four main points. First, participation may mobilize negative sentiment. Participation is viewed as a self-defeating measure for transportation planners. Citizen participation is an open invitation for criticism. Due to the “sound bite” nature of current political discourse, more participation is based on shallow emotion and short-sightedness. Furthermore, the idealistic image of participatory democracy propagated by its advocates suggests that evenings devoted to neighborhood politics at community meetings are broadly appealing events. In the real world, even the most open and democratic meetings can be perceived as intimidating. Also, people can be decidedly uninterested in local politics not because they are alienated or apathetic, but because they find other pursuits more compelling and worth their while.
Second, public participation interferes with professionals. According to Barber, the role of “experts” is thwarted by citizens who usually lack the technical capabilities to understand the complexities involved with transportation issues. Barber claims that the central problem for public participation is balancing the desire to maximize participation and democratic control with the need for efficiency and stability in government. Proponents of this sentiment maintain that it makes little sense to reduce the role of competent, nonpartisan experts so that a modest number of highly vocal people can participate in policy making. If citizens want to influence political outcomes, it is believed that elections are
One of the major reasons behind the difficulties with public participation is the fact that the government objectives in encouraging public involvement can often be contradictory.
7
appropriate arena for political activity. The idea of having the public influence policies such as budgetary priorities and research design is often considered to be unacceptable to public managers. To some extent, there is a built-in conflict between public participation and the traditional principles of hierarchy and professionalism found in the tradition of Progressive political theory.
Third, Barber argues that public participation is not representative. Citizen participation is perceived as merely lobbying for locally-based vested interests or special privileges at the expense of other localities or the total community. Consequently, if lobbying efforts are successful, a disproportionate allocation of total community resources is given to the interests that have exerted the most influence.
Finally, Barber contends that public participation has no authority. As presently organized, most citizen groups have no power or legitimacy to make decisions; their responsibilities limited to influencing those who make decisions for the community. Participation is viewed as a form of tokenism.14
Such critics of public participation maintain that it is romanticized and over-rated and some even make the case that well-trained elites should have power because even when decision making becomes more egalitarian, the masses only participate at a moderate level anyway. This view is grounded in the
“trustee” model of representation – the belief that government is best served by “guardians” who are qualified to govern because of their superior knowledge and skills. Several scholars also have warned against the “excesses of democracy” claiming that people become more cynical and disrespectful of government when it is unable to satisfy conflicting claims made upon it. This eventually leads to a crisis of authority and participation is then viewed as a response to a representative system not working.
Obstacles Facing ParticipationThese arguments against participation, however, are not meant to imply that it should not exist. Rather, they point out the limitations of participation as a comprehensive process and indicate the powerlessness and vulnerabilities of many participation structures. We will review some of the dominant obstacles facing public planners when they attempt to operationalize the goal of public participation. Specific attention will be paid to the efforts and difficulties other state transportation departments have encountered when implementing public participation.
TrustIn theory, political structures may act in two ways to increase participation: first, by expanding the methods of citizen participation; and second, by making public involvement more meaningful. If you only increase participation, citizens may still not find it worth their while to participate. Furthermore, if citizens do not trust some part of government agencies, their projects may be subject to extra scrutiny by the public.
Citizen opposition to transportation projects is often explained as being fueled by
Spring 2008 10
Research Board conference once concluded, “Ironically, citizen mistrust is what stirs them to demand a closer look at what the planning agencies are doing. There is little desire by people to participate if they think that what is being done is really being done honestly and has beneficial effects for the community.”18
However, despite the propaganda efforts by all government agencies claiming that their project benefits everyone, no project can benefit everyone equally. The falsity of this assertion undermines public trust in what governments say and do. The easily-punctured illusion of universal benefits and minimal costs can significantly contribute to feelings of mistrust of government. A more candid approach that acknowledged the imbalances of benefits and costs to various persons and sought ways of mitigating the negative effects on those disadvantaged by the proposed project would have a better chance of success.
Because many transportation projects throughout the United States have been stymied by active opponents, it is essential that citizens participate and share their concerns and ideas from the very beginning
a fundamental sense that public managers and bureaucrats are untrustworthy. Several scholars have suggested that political behavior is directly correlated to political trust and confidence. Joel Aberbach and Jack Walker state, “[I]f distrustful groups are denied access to decision-making, or if institutions are too rigid to change, destructive conflict and a breakdown of the social order are possible.”15 Richard Cole arrives at similar conclusions in his book, Citizen Participation and the Urban Policy Process.16
One aspect of mistrust includes the belief that the bureaucracy will not deliver the promised goods and services at the specified time and cost, if at all. As John Semmens, an Arizona Department of Transportation senior planner, argues:
[T]he standard approach to public finance has the taxpayers pay first and trust the bureaucracy to perform. We have seen the inferior results produced by this method. Whatever taxes are paid is never enough. The money is always spent. The benefit for which the tax was assessed typically falls short of what was promised.17
Consequently, if this is true, efforts to improve public feedback will involve a significant change in the way public transportation projects get financed. If the public doesn’t trust government agencies to do what they say, any efforts at public participation will need to address this issue first and foremost lest the complete process loses all meaning and dignity.
Another part of the public mistrust of planning agencies has been ascribed to the project opponents’ belief that the agencies are simply not listening. As a Highway
of the planning process. However, it is often difficult for transportation officials to attract citizens to the agenda setting and scoping meetings due to the cumulative curve of involvement discussed earlier.
InformationRelated to this mistrust problem is the availability and understanding of information. In this respect, it is often difficult and frustrating for citizens to effectively participate when they are faced with highly technical language and voluminous governmental data. If citizens can’t interpret and use all the relevant information, they feel hapless in the technical world of transportation research and design. As Steven Schatzow has concluded, a public which is poorly informed “cannot sustain a high level of concern about such issues, is unlikely to ask for more information, to demand to be included in decision making, or to scrutinize government action closely.19
CostsInformation is costly to acquire and costly to provide. The more newsletters people read and the more meetings people go to the more time and money they spend. Likewise, government agencies will have higher costs associated with any attempt to increase the generation and dissemination of information. Infrastructure costs in terms of space, paper, and office resources will tend to increase as a result of more sophisticated participation programs. Larger participation mechanisms will most likely increase staff time as well. Often, these costs demand the investment of
resources from other activities. Reassigning resources will always involve opportunity costs for any activities sacrificed for the sake of public participation and information.
As with any increase in information quality and quantity, there will usually be an increase in information costs for both the consumer and provider. When the combined costs of providing and accessing information exceed the perceived benefits of an informed public, fewer investments will be made in improving information channels and quality.
AttitudesThe attitudes of both citizens and public officials are yet another obstacle to effective public participation. The combination of highly charged and hot-tempered citizens and unresponsive public officials is a recipe for little progress in terms of transportation improvements. On one hand, if public officials are hostile toward participation from the onset, then the entire process is a procedural smoke-screen in the form of hearings, papers, reports, and forms that function as an inconsequential footnote to an agency’s decision. 20, 21
On the other hand, however, agency unresponsiveness tends to trigger highly charged citizen-activists who may block plans and projects either within agency avenues or utilize outside institutions such as the courts and media to argue their case. Due to the correlated nature of these events, scholars have recommended that agencies set up mechanisms for addressing the concerns of project opponents from the time the project is conceived.
Defining the PublicAs mentioned earlier, defining “the public” is another problem that affects how
HORIZON9
The easily-punctured illusion of universal benefits and minimal costs can significantly contribute to feelings of mistrust of government.

HORIZON Spring 2008 12
ImplementationA policy is only as successful as its implementation is successful. A great legal document that is improperly implemented does nothing for the original law’s purpose and mission. While this axiom is well known, many programs fall apart at the critical point of implementing principles into practice. Many programs succeed in preparation for participation but fail to handle all the subsequent information. As a result, decision making authority remains strictly to the politicians, their advisors, and the relevant influential few in the community.
Marver Bernstein23 and Anthony Downs24
have each presented well-known theories of policy cycles that suggest a gradual decline in public attention to political issues as legislation and policy ideas mature to the stage of implementation. Furthermore, both Downs and Bernstein agree that only the most vested interests will see it advantageous to continue to participate in the implementation stage.
worKs cited
1Berry, Jeffrey M., Kent E. Portney, Ken Thomson. The Rebirth of Urban Democracy. Washington, DC: The Brookings Institution, 1993.2Barber, Benjamin R. Strong Democracy: Participatory Politics for a New Age. Berkeley, CA: University of California Press, 1984.3Mansbridge, Jane, Beyond Adversary Democracy, Basic Books, 1980.
participation is structured. This is one of the principle issues that transportation agencies have to address. Should “the public” be a random sample from the general population or traditionally underrepresented populations or should participation efforts serve those most affected by transportation policies? Current transportation planning literature often uses the terms “customers,” “constituents,” “clients” and “stakeholders” to describe the people transportation agencies serve. 22 It may be worthwhile however, to see the public not as any of these but as the proprietor and employer of any given agency.
Administrative Personnel
A recurring problem with many citizen participation programs stems f rom the resources and personnel within government administrations. Citizen participation is not an easy job. Facilitating participation is a full-time job requiring a full-time staff. The personality of agency individuals is crucial to effective participation. Most importantly, the participation coordinator from public agencies must be a dynamic and flexible leader. In many ways, the public participation coordinator is faced with a conundrum: if he or she organizes and activates local groups too much they may be helping to subvert the dominant structures of political authority. On the other hand, if the coordinator plays exclusively by the political rules, he may be charged with elitism by citizen groups. Indeed, the job of coordinator is one of the more difficult jobs to be trained for, yet it is possibly the most crucial element in the participatory process.
The combination of highly charged and hot-tempered citizens and unresponsive public officials is a recipe for little progress in terms of transportation improvements.
...agency unresponsiveness tends to trigger highly charged citizen-activists who may block plans and projects either within agency avenues or utilize outside institutions such as the courts and media to argue their case.
4Bellah, Robert et al. Habits of the Heart: Individualism and Commitment in American Life. Berkeley: University of California Press, 1985.5Wengart, N. “Public Participation in Water Planning: A Critique of Theory, Doctrine, and Practice.” Water Resources Bulletin, Vol.7, No.1, pp. 26-32.6Highway Research Board Conference Report #142, Citizen Participation in Transportation Planning. May 29-31, 1973.7Cobb, Roger W., and Charles D. Elder. Participation in American Politics: The Dynamics of Agenda Building. Baltimore: Johns Hopkins University Press, 1983.8Kingdon, John. Agendas, Alternatives, and Public Policies. Harper Collins, 1984.9American Association of State Highway and Transportation Officials. Guidelines on Citizen Participation in Transportation Planning.American Association of State Highway and Transportation Officials, Washington DC, 1978.10Connor, D.M. Environmental Design for Public Projects. Fort Collins, CO: Water Resources Publications, 197511Unsworth, Dennis J. “Redefining Public Involvement.” Transportation Research Record 1463, p. 45.12Arnstein, Sherry R. “Eight Rungs on the Ladder of Citizen Participation.” Journal of the American Institute of Planners, Vol. 35, July 1966.13Barber, Daniel M. Citizen Participation in American Communities: Strategies for Success. Dubuque, IA: Kendall-Hunt, 1981.14Barber, Daniel M. Citizen Participation in American Communities: Strategies for Success. Dubuque, IA: Kendall-Hunt, 1981.15Aberbach, Joel D. and Jack L. Walker. “Political Trust and Racial Ideology.” The
American Political Science Review, Vol. 32. March/April, pp. 211-217, 1972.16Cole, Richard L. Citizen Participation and the Urban Policy Process. Lexington, MA: Lexington Books, 1974.17Semmens, John. “Performance Before Payment Proposed as Freeway Solution.” Arizona Capital Times, October 29, 1993. 18Highway Research Board Conference Report #142. Citizen Participation in Transportation Planning. May 29-31, 1973.19Schatzow, Steven. “The Influence of the Public On Federal Environmental Decision-Making in Canada.” Public Participation in Planning edited by W.R. Derrick Sewell and J.T. Coppock, London: John Wiley and Sons, 1977.20Bouchard, Richard J. “Community Participation: How to Get There from Here.” Highway Research Record, No. 380, pp. 1-7.21Harper, Beverly A. “Tomorrow’s People: Achieving Effective Citizen Participation.” Transportation Research Record, No. 555, 1975, pp. 13-22.22Boyd, David S. and Amy G. Gronlund. “The Ithaca Model: A Practical Experience in Community-Based Planning.” Transportation Research Record, No. 1499, pp. 56-61.23Bernstein, Marver. Regulating Business by Independent Commission. Princeton, New Jersey, 1955.24 Downs, Anthony. “Up and Down with Ecology – The Issue Attention Cycle.” The Public Interest, Vol. 29, Summer, pp. 38-50.
Dr. Matthew Lindstrom is an Associate Professor of Political Science with Saint John’s University/College of Saint Benedict.
Dr. Martin Nie is an Associate Professor of Natural Resource Policy in the College of Forestry and Conservation at the University of Montana.
11

14
Public Information & Public Involvement
Processesby Robert S. Done, Ph.D.
Data Methods Corporation
&
John SemmensArizona Transportation Research Center
This excerpt is part of a larger report submitted to the Transportation Research Board, 87th Annual Meeting, January 13-17, 2008, in Washington, D.C.
urrent federal transportation legislation, Safe, Accountable, F l e x i b l e , E f f i c i e n t Transportation Equity Act:
A Legacy for Users (SAFETEA-LU) creates considerable responsibility for state departments of transportation and metropolitan planning organizations to provide public information and public involvement to a diverse community and to obtain feedback that satisfies legal
mandate and results in improved planning and project development.1
The four main domains of publ ic participation are informing people, involving people, getting feedback, and applying special techniques. The current best practices in public information and public involvement for transportation agencies are reviewed here.2
HORIZON Spring 2008
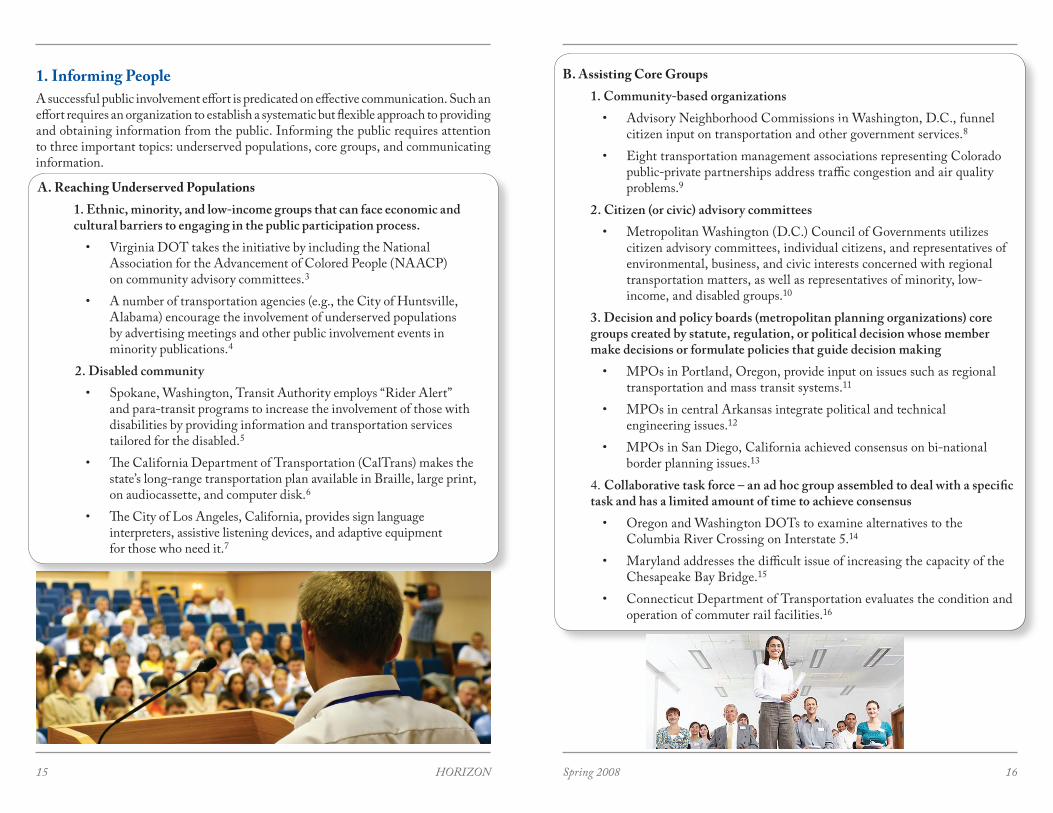
1. informing peopleA successful public involvement effort is predicated on effective communication. Such an effort requires an organization to establish a systematic but flexible approach to providing and obtaining information from the public. Informing the public requires attention to three important topics: underserved populations, core groups, and communicating information.
15
b. assisting core groups1. Community-based organizations
Advisory Neighborhood Commissions in Washington, D.C., funnel citizen input on transportation and other government services.8 Eight transportation management associations representing Colorado public-private partnerships address traffic congestion and air quality problems.9
2. Citizen (or civic) advisory committees Metropolitan Washington (D.C.) Council of Governments utilizes citizen advisory committees, individual citizens, and representatives of environmental, business, and civic interests concerned with regional transportation matters, as well as representatives of minority, low-income, and disabled groups.10
3. Decision and policy boards (metropolitan planning organizations) core groups created by statute, regulation, or political decision whose member make decisions or formulate policies that guide decision making
MPOs in Portland, Oregon, provide input on issues such as regional transportation and mass transit systems.11 MPOs in central Arkansas integrate political and technical engineering issues.12 MPOs in San Diego, California achieved consensus on bi-national border planning issues.13
4. Collaborative task force – an ad hoc group assembled to deal with a specific task and has a limited amount of time to achieve consensus
Oregon and Washington DOTs to examine alternatives to the Columbia River Crossing on Interstate 5.14 Maryland addresses the difficult issue of increasing the capacity of the Chesapeake Bay Bridge.15
Connecticut Department of Transportation evaluates the condition and operation of commuter rail facilities.16
•
•
•
•
•
•
•
•
•
16
in
a. reaching underserved populations 1. Ethnic, minority, and low-income groups that can face economic and cultural barriers to engaging in the public participation process.
Virginia DOT takes the initiative by including the National Association for the Advancement of Colored People (NAACP) on community advisory committees.3
A number of transportation agencies (e.g., the City of Huntsville, Alabama) encourage the involvement of underserved populations by advertising meetings and other public involvement events in minority publications.4
2. Disabled communitySpokane, Washington, Transit Authority employs “Rider Alert” and para-transit programs to increase the involvement of those with disabilities by providing information and transportation services tailored for the disabled.5 The California Department of Transportation (CalTrans) makes the state’s long-range transportation plan available in Braille, large print, on audiocassette, and computer disk.6
The City of Los Angeles, California, provides sign language interpreters, assistive listening devices, and adaptive equipment for those who need it.7
•
•
•
•
•

HORIZON Spring 200817
c. communicating information – before the public can participate in transportation projects, they must first receive information about the projects.
1. Mailing lists are commonly used as a foundation for mass communication
North Central Texas Council of Governments in Arlington, Texas maintains a list of 8,000 names.17
2. Other mediaThe San Diego Assoc iat ion of Governments prov ides publications, announcements, and Web content in Spanish and other languages.18
3. Key person interviewsCommunity leaders like the West Michigan Shoreline Regional Development Commission used key person interviews to identify five critical elements in the development of an area-wide plan.19
4. Briefings can provide comprehensive summaries of transportation planning processes.
Indianapolis Metropolitan Planning Organization annual briefing20
5. Visual presentations
Florida DOT created a high-fidelity visual simulation of traffic flow on Interstate 4 to study the effect of additional truck lanes.21
6. Video conferencing
DOTs in Colorado, Montana, North Dakota, South Dakota, Utah, and Wyoming are linked to each other as well as four universities (Colorado State University, North Dakota State University, University of Wyoming, and Utah State University) by video conferencing.22
7. Speakers’ bureaus – provide an opportunity to communicate a consistent message on transportation topics.
•
•
•
•
•
•
18
Balt imore Metropol itan Counci l informs the publ ic about transportat ion and air qua l it y, the regiona l transportat ion planning process, the regional transportation plan, pedestrian and bicycle safety, and demographic and development trends.23
2. involving people Meetings provide a forum for communication and allow community members to meet the people who represent the transportation agency and allow agency staff to directly respond to comments. The two most important characteristics of face-to-face meetings are the meeting type and the meeting structure.
a. meeting type1. Public meetings – optional events that generate informal input from
local residents2. Public hearings – more formal and result in a public record of information relevant to the transportation project, can be linked to public meetings
Wisconsin DOT followed public hearings with public meetings in the development of its 2030 regional transportation plan.24
3. Open houses – similar to public meetings but more informal and have no agenda
Washington State DOT hosted an open house on intercity transit services following the closure of a local transit operator.25
4. Open forum hearings – hybrids of public hearings and open housesGeorgia DOT used open forums to create a shared vision of the state’s transportation program.26
5. Conference – a structured series of presentationsKansas DOT used a conference format to develop its long-range transportation plan.27
6. Workshops – task-oriented meetings7. Retreats – workshops held in non-traditional settings to reduce distractions
Washington State DOT’s Agency Council on Coordinated Transportation held a retreat to focus on specific project and legislative priorities for the 2005-2007 biennium.2
•
•
•
•
•
•

HORIZON Spring 200819
b. meeting structure – although transportation agencies determine the meeting type, it is common for meeting participants to also determine the meeting structure.
1. Brainstorming – can be effective in shifting participants away from conflict and toward consensus; not unstructured discussions, but rather freethinking forum such as those utilized by Pierce County, Washington.29 2. Charrette – meeting to address and resolve a specific issue that can last
from four hours to several daysThe Regional Planning Council in New Orleans, Louisiana used a series of charrettes facilitated by involving neighborhood residents and stakeholders to evaluate neighborhood transportation problems and possible solutions.30
3. Visioning meeting – designed to result in a long-range plan. Visioning solicits deep seated feelings about the future and highlights the development of policies to get residents involved in important topics such as transportation infrastructure.
States including Utah, Idaho, and Oregon, have used the visioning technique to establish long-range goals.31
4. Small groups – limited sized groups (less than about 20) facilitate the active participation of each member. Small groups can include workshops, seminars, community juries, roundtables, and study circles that make larger meetings more productive.
A variety of agencies have demonstrated the effectiveness of small groups including the San Francisco County Transportation Authority in San Francisco, California, and the San Diego Association of Governments in San Diego, California.32
•
•
•
20
3. getting feedbackSuccessful communication will generate feedback. Feedback helps measure the public’s understanding of transportation issues and what information is needed to increase that understanding. The two key components of this public participation effort are providing information and getting feedback.
a. providing information – before community members can give informed feedback on transportation projects, they must be provided with information about those projects.
1. On-line services provide information on a 24-hour basis, and advances in mobile information technology are allowing consumers to access information outside their homes and offices.
2. Websites that offer information ranging from existing road conditions to transportation planning.
Websites such as that hosted by the Tennessee DOT are commonplace.33
3. Hotlines provide a channel of real-time communication for transportation agencies to provide information to the public. Hotlines are usually staffed during normal business hours and many provide toll-free access for long-distance callers.
Some hotlines, such as the one provided by the Tri-County Metropolitan Transportation District of Oregon, also support a telecommunications device for the deaf (TDD) for the hearing impaired.34
4. Drop-in centers provide yet another outlet for transportation information. Drop-in centers can be a convenient source of information to consumers as well as being a visible commitment to the community.
CalTrans effectively used drop-in centers to overcome barriers between the agency and the community during an access and circulation study.35
•
•
•
HORIZON Spring 200821 22
a. holding special events
1. transportation fairs – provide opportunities for exposure to transportation information in a low-stress environment.
Focus on visual interest and excitement, multiple exhibits, accessibility, and the ability to get feedback from those in attendance.
Can be annual events or a road show that is held invarious locations40
Idaho used a road show in its strategy to create an understanding of and to demonstrate the value of airstrips as one of the state’s transportation assets.
2. games and contests – provide additional opportunities to facilitate public participation.
Challenge people to think about different alternatives in transportation planning.
Knoxville (TN) Regional Transportation Planning Organization uses a transportation planning simulation game to increase understanding of the transportation planning process.41 The participants’ choices about where to put development in relation to transportation reveals the relationships between land use and transportation, the perspectives of others, and the implications of decision.
b. changing meeting approaches
1. improving meeting attendance is a special challenge that can be overcome by making public input count in the decision making process.
The Mid-America Regional Council in Kansas City, Missouri, attempts to maintain high levels of public involvement by conducting surveys to identify opportunities to continually engage the public.42
2. role playing – encourages active participation in meetings by defining contexts and roles for people to play in those contexts.
Because the contexts and roles are hypothetical, participation in role playing is risk-free experience for participants that exposes them to alternative viewpoints.
•
•
•
•
•
•
•
b. getting feedback – even with opportunities to provide feedback at meetings and forums, some people may be reluctant to voice their opinions.
1. Focus groups – small and informal structure can be effective ineliciting public opinion on transportation issues and produce awritten record of input.
New Jersey DOT conducted a series of focus groups to obtain consumer feedback during the development of a long-range transportation plan.36
2. Surveys can be administered with paper and pencil in person or by mail, with interviews in person or by telephone, and electronically over the Internet.Surveys can be used with other techniques (e.g., stakeholder interviews, workshops, and public meetings) to achieve consensus.
Michigan DOT prepared its long-range transportation plan.37
3. Facilitation is managed by a facilitator with the consent of the participants and can be used to guide a group through a consensus building process.
Pennsylvania Turnpike Commission used facilitation by design advisory teams to resolve issues the Commission and communities that were impacted by the Mon-Fayette Expressway.38
4. Negotiation and mediation – follow a problem solving model rather than an adversarial model.
Used when facilitation is not successful in resolving differences.
Provide a structured and semi-formal venue for people to resolve disagreements
Wisconsin DOT and the Federal Highway Administration incorporated negotiation and mediation into a partnership agreement with eleven federally recognized Indian tribes in Wisconsin.39
4. applying special techniques
Beyond traditional meetings and processes, special techniques can be applied as circumstances warrant. These circumstances include declining or static participation in meetings, a lack of questions by meeting participants, or doubts that progress is being made. These techniques include holding special events, changing meeting approaches, and finding new communication channels.
•
•
•
•
•
•

HORIZON Spring 200823 24
New Jersey DOT used role playing exercises to explore the facets of transportation planning during its long-range transportation plan education program.43
3. site visits – allow the public to engage in the transportation planning process by traveling to project areas.
Improve agency credibility and give participants a common frameof reference.
Sioux City, Iowa, included site visits into the planning process for Vision 2020 where its task force took a citywide bus tour. Task force members were able to view issues in all parts of the city as a group, and agency staff reported that the site visits were a valuable overview of local concerns.44
c. finding new communication channels – emerging on a regular basis, largely due to advances in information technology.
1. interactive television and teleconferencing allow participants to meet virtually face-to-face across long distances without the need for travel.
Interactive video displays and kiosks in public areas are also useful communication channels because many people are familiar with this technology from their experience with automatic teller machines.
2. improvements in computer graphics make computer presentations, geographic information system mapping, and three-dimensional visualization practical for most transportation agencies.
Computer presentations of digitized photography, video brochures, and video simulations attract attention through color, movement,
and sound.
Geographic information systems allow users to develop custom maps by merging layers of spatial information.
Three-dimensional visualization allows projects to be rendered in life-like presentations before construction ever begins.
Visual preference surveys allow a community to determine how a transportation project will affect its overall image by comparing implementation alternativesthrough sketches and pictures.
Instant voting technology, such as that used by marketing firms, allows voters to cast ballots on a large number of topics and allows
•
•
•
•
•
•
•
•
•
agencies to automate the ballot counting and reporting process.
Mark-up software also allows participants to record their preferences by electronically marking up project plans with notes and questions. And finally, remote sensing technology is useful in collecting data for use in geographic information systems.
•
worKs cited 11P.L. 109-59 §6001(i)(5)(A).2U.S. Department of Transportation. (2002). Public Involvement Techniques for Transportation Decision-Making.3Virginia Department of Transportation. (2002). Route 5 Bikeway Feasibility Study.4City of Huntsville, Alabama. (2005). Public Involvement Plan for Transportation Planning in the Huntsville Urbanized Area.5Spokane Transit Authority. (2006). 2005-2006 Report to the Community.6California Department of Transportation. (Spring, 2003). California Transportation Plan Newsletter.7City of Los Angeles, California. (2004). Facts about the City of Los Angeles.8Washington , DC, Depar tment o f Transportation. (2005). North Capitol Street Transportation Study.9Colorado Department of Transportation. (2005). 2030 Statewide Transportation Plan.10Metropolitan Washington Council of Governments. (1999). National Capitol Region Transportation Planning Board Public Involvement Process.11Metro. (2003). Metro Charter.12Metroplan. (2004). 2004 Central Arkansas Regional Transportation Study.13San Diego Association of Governments. (2007). Otay Mesa – Mesa de Otay Binational Corridor Strategic Plan.
14Columbia River Crossing. (Winter 2007, Issue 4). Bridgenews.15Maryland Transportation Authority. (2006). Task Force on Traffic Capacity Across the Chesapeake Bay: Final Report.16Connecticut Department of Transportation. (2005). Connecticut Rail Station Governance Study.17North Central Texas Council of Governments. (2006). 2006 Annual Report.18San Diego Association of Governments. (2005). Public Participation/Involvement Policy.19West Michigan Shoreline Regional Development Commission. (2004). Muskegon Area-wide Plan.20Indianapolis Metropolitan Planning Organization. (2006). 2006 Briefing Paper.21Department of Transportation. (2005). I-4 Corridor Traffic Simulation and Visualization.22Upper Great Plains Transportation Institute. (2002). TEL8: The Development of a Transportation Video Conference Network.23Baltimore Metropolitan Council. (2006). 2006 Annual Report.24Wisconsin Department of Transportation. (2007). Connections 2030 Public Participation Plan.25Washington State Department of Transportation. (2005). WSDOT Public Transportation and Rail Division Monthly Report, September, 2005.

HORIZON Spring 200825 26
26Georgia Department of Transportation. (2001). Georgia Department of Transportation Public Involvement Plan.27Kansas Department of Transportation. (2006). Kansas Long Range Transportation Plan Phase 1: Setting the Vision.28Washington State Department of Transportation. (2005). ACCT 2005 Retreat Summary Report.29Pierce County, Washington. (2006). Coordinated Transportation Plan for People with Special Transportation Needs in Pierce County.30Regional Planning Commission. (2005). Public Involvement Plan.31Utah Department of Transportation. (2007). UDOT Long Range Transportation Plan 2007-2030; Idaho Department of Transportation. (2004). Idaho’s Transportation Vision: 2034; Oregon Department of Transportation. (2006). Oregon Transportation Plan.32San Francisco County Transportation Authority. (2007), Tenderloin-Little Saigon Neighborhood Transportation Plan; San Diego Association of Governments. (2006). A Commitment to Regional Priorities: SANDAG Annual Report 2006.33Tennessee Department of Transportation. (2004). Report to Tennesseans: Biennial Report 2003-2004.34Tri-County Metropolitan Transportation District of Oregon. (2006). Tri-County Elderly and Disabled Transportation Plan.35California Department of Transportation. (2003). Public Participation Plan for Bishop Area Access & Circulation Study36New Jersey Department of Transportation. (2001). Transportation Choices 2025.
37Michigan Department of Transportation. (2007). Moving Michigan Forward: 2005-2030 State Long-Range Transportation Plan.38Oakland Transportation Management Association. (2006). 2005-2006 Annual Report: Building Community Connections.39Wisconsin Department of Transportation. (2005). Partnership Agreement Between Wisconsin’s Eleven Federally Recognized Tr ibes ; W iscons in Depar tment o f Transportation; and Wisconsin Division – Federal Highway Administration.40USC 133; Idaho Transportation Department. (2005). The Idaho Airstrip Network Action Plan.41Knoxville Regional Transportation Planning Organization. (2004). Knoxville Regional Transportation Planning Organization Public Involvement Plan.42Mid-Amer ican Regional Counci l . (2001). Mid-American Regional Council Transpor ta t ion Depar tment Publ ic Involvement Plan.43New Jersey Department of Transportation. (2006). Transportation Choices 2030: New Jersey’s Statewide Long-Range Transportation Plan Education Program.44City of Sioux City. (2005). Sioux City Comprehensive Plan.
Robert S. Done, Ph.D is a Public Involvement and Group Intelligence Specialist with the Pima Association of Governments. His background includes transportation planning, group decision support systems, and geographic information systems. He is also the author of several journal articles and book chapters on topics in transportation and management.
John Semmens has been with the Arizona Department of Transportation for over 30 years and a Project Manager in the Department’s Research Center since 1994.
He has written over 300 published articles on transportation-related topics and was a contributing author to the award-winning book, “Street Smart,” covering innovative solutions to transportation problems.

information asymmetry, and can increase public dissatisfaction, reflected as anti-tax sentiments and growing funding shortages. Faced with a severe funding and accountability crisis six years ago, the Washington State Department of Transportation (WSDOT) developed its performance journalism approach to communicate performance measures and results to make the case for increased funding to a diverse audience including the public, the media, and policymakers.
Performance journalism begins with the premise that effective communication of
erformance measurement is an evolving field that has gained momentum,
particularly with the call for enhanced accountability that many transportation organizations are facing. Public agencies use measures to evaluate their performance, and while these measures have evolved into sophisticated tools for agency management, the methods for effectively communicating results to external audiences have not. Even though an agency is performing well, the public may perceive that it is not.
Ineffective agency communication does little to build credibility, leads to
28
Performance Journalism:Bridging the Gap Between
Agencies & Citizensby Daniela Bremmer, MPA
Director of Strategic Assessmentand
James H. Bryan, Jr., MPAResearch Analyst - Strategic Assessment Office
Washington State Department of Transportation
This article is an excerpt of a larger report submitted for the Transportation Research Board 87th Annual Meeting, January 13-17, 2008, in Washington, D.C.
The full report can be found at: http://www.wsdot.wa.gov/Accountability/Publications/PerformanceDocuments.htm#reports
HORIZON Spring 2008
performance information is more than just publishing data and text. It requires an agency to tell its story by applying both analytical and journalistic methods. Since 2001, the agency has successfully used performance journalism as its fundamental communication strategy and developed the principles of performance journalism based on experience it gained over six years of reporting comprehensive transportation system performance information in the agency’s quarterly performance report, Measures, Markers and Mileposts, also referred to as the Gray Notebook (GNB).
Press reaction to the GNB indicates that the approach successfully changed the perception of WSDOT from an organization plagued with “waste and mismanagement” to an agency that is accountable for its actions. Regarding the GNB, one reporter writes, “What’s notable is the department holding itself to a standard of accountability, a report card that offers no place to hide if there’s a slippage from one quarter to the next.”1 Public confidence is evident from the approval of two funding packages totaling $14 billion and rejection of an initiative to rescind one of these packages, the first time in state history that a tax decrease was defeated by voters.
effectiVe communication and information asymmetry
Even without statutory requirements (SAFETEA-LU, for example),2 there is evidence that it is in the best interest of agencies to collect and, more importantly, to report performance measurements and
results. The New Public Management (NPM) movement enjoyed wide-spread adoption, particularly after the Clinton administration endorsed it in the Reinventing Government program led by Vice President Al Gore. NPM assumes that even when agencies are performing well, it is still possible that citizens can be dissatisfied with agency performance3. This dissatisfaction is due to information asymmetry, which can be corrected through citizen education.
Information asymmetry is a state of imbalance between what an agency knows about its performance versus what the public knows about the agency’s performance. This occurs when an agency’s performance information is not effectively communicated to appropriate audiences. Some argue that dissatisfaction is due to citizens not understanding the message.3 However, the solution is telling the story and providing information in a format that allows citizens and policy-makers to understand the message. The onus is on the agency to effectively communicate its performance and solicit citizen input.
Our definition of citizens is based on the principle of accountability. Political science scholar Luigi Manzetti wrote: “Accountability is usually understood in political science as the act of informing
about one’s actions and answering and taking responsibility for them.”4 We use this understanding of accountability to define “citizens” as those to whom agencies must provide information about their actions and to whom they must answer: legislators, the media, institutions (private, public, and NGOs), and individuals.
Agencies know the audience they need to reach. One study discovered that two-thirds of state agencies use the strategic planning process to identify stakeholders and constituents.5 The problem is that these citizens may not understand the message. With the role of administrative agencies as technical experts, information communicated to the public may be too complex or technical to be easily understood. Even so, the primary challenge for effective communication of performance measures is the method of delivery, not necessarily the measures themselves. This hypothesis is consistent with author Kieron Walsh who notes that consumers of public services are in a paradoxical position when it comes to information – those who need information the most are often “least able to judge the service that they get because they lack the resources for evaluation.”6
In other words, agencies must do more than just publish performance information. The communication of performance information should provide citizens with the tools that they need to understand and evaluate the data that are presented to them. No amount of information is useful if the audience that it is directed toward is not getting the message and the problem of information asymmetry
persists. It is the effective communication of performance measures that is crucial to agency credibility.
current Knowledge about performance reporting is limited
The extensive literature that addresses the development and implementation of performance measurement systems and citizen participation is devoid of how to communicate this information. Previous work has noted that a complete performance measurement system includes a system for effective communication, but points to the lack of guidance for doing so. 7
In our research, we queried two popular social science electronic databases that broadly index social science literature, including public administration, political science, sociology, and psychology. As of June 2007, there were no articles in either database with the key words “performance measurement communication” or “performance communication” in the citations or abstracts. A similar search of communications journals was also unsuccessful.
Likewise, performance measurement textbooks for public administrators offer little to learn how to effectively communicate with citizens. The review of several texts discovered extensive coverage on topics like benchmarking and measuring inputs, outputs, and outcomes. Some may include chapters applicable to specific types of organizations like municipal or health care agencies but have no advice
29 30
Information asymmetry is a state of imbalance between what an agency knows about its performance versus what the public knows about the agency’s performance.

HORIZON Spring 2008
or strategy to communicate the measures once they are collected and computed. 9
10 11 12 13 14 15
Resources such as the Government Accounting Standards Board (GASB) and the Association of Government Accountants’ (AGA) Certificate of Excellence in Accountability Reporting (CEAR) program offer some guidance with respect to content16 and design17 of performance reports but no training or detailed guidance for the practitioner. The significant need for information in this area and the lack of useful, practitioner-oriented information led us develop this practical approach.
performance Journalism as a method for effectiVe performance communication
Performance journalism centers around seven key principles that guide the communication of all agency performance results. WSDOT uses the agency’s Gray Notebook (GNB), the quarterly report of performance, as its central report. It is the basis for many forms of performance communication, either through the web or through printed media such as folios, brochures, papers, press releases, and oral presentations. The GNB is directed toward a wide audience including the public, the media, the governor, the legislature, and national and international transportation partners.
Production of the GNB began in the spring of 2001. Prior to that, WSDOT collected
extensive data, but did not communicate performance results; thus, the agency faced a crisis of public, legislative, and executive confidence. The intent behind performance journalism was to regain public credibility by communicating performance to assure accountability and transparency. The subsequent success in achieving this credibility and reversing a decade-long trend of no new funding encouraged WSDOT to analyze, summarize, and share the performance journalism factors behind these positive results.
The WSDOT journey began by researching how other state departments of transportation (DOTs) and other national and international public agencies reported performance, a process the continues even today. WSDOT continually evaluates and tests best practices and reviews the work of its peers around the world. After looking at various approaches, WSDOT selected examples that displayed rigor of analysis, clarity of description, or effectiveness of graphical format, yet we found no approaches or reports that embedded all of the needed factors. In addition, WSDOT staff incorporated the work of information graphics professor Edward R. Tufte18 19 20 for the effective presentation of quantitative data.
The key elements of clear writing and story telling, effective graphic presentation of data, and rigorous data analysis and data quality control are the foundation for the following seven principles of performance journalism and for all subsequent agency performance reporting:
• Good stories combined with good graphics• Good writing• Good data• Good graphics• Good format/presentation• Quality control• Good timing
the seVen principles of performance Journalism
good stories combined with good graphs: use narrative reporting to make it real and tell the story
Many reporting efforts use limited text to accompany the data that are presented as graphs, tables, charts, etc. These efforts miss an important opportunity to tell citizens the story that underlies the particular data and performance reports. Narrative reporting is particularly useful when describing a program, together with its key challenges, trends, factors, and supporting or comparative data, information that is difficult, if not impossible, to convey via a table or graph alone.
But narrative reporting requires discipline. You must strike a proper balance between the urge to be too brief and the urge to provide an overly lengthy narrative. Clear, concise, unbiased writing using the what, why, who, and when approach is the key to this first principle. You must guard against trivializing issues, using vague descriptions, avoiding candor, or burying the result in bureaucratic jargon. Interactive and web-based dashboard type reports are becoming
more popular as they offer an easy to view, roll-up summary of results. Most of these approaches and related software should be flexible enough to accommodate good storytelling by providing “click-down” paths that lead to relevant and detailed narratives.
Narrative reporting also takes time and effort. Investigating a problem underlying a particular result and digging into the organizational issues takes tenacity and skills not unlike those needed to be an investigative reporter. Hard questions have to be asked, organizational barriers and silos need to be overcome, and superficial or canned answers need to be rejected. “Why was a project late; why did we fail our maintenance targets; why is this transit run consistently late; why is this district always on budget compared to others?”
But identifying the underlying issue is just the beginning. Crafting a paragraph that explains results clearly and concisely takes discipline and time. Writing it can take many more hours than gathering and analyzing the data itself. These journalistic aspects of performance reporting and telling the story are key and yet are the aspects that are often omitted in performance reporting.
While it is tempting to use narrative reporting to only tell the story of what went right, it is just as important to tell the story of when things go wrong. Figure 1 shows an example of a report that was used in the WSDOT Gray Notebook edition of March 31, 2007. The example illustrates the approach to reporting “the good, the bad,
31 32
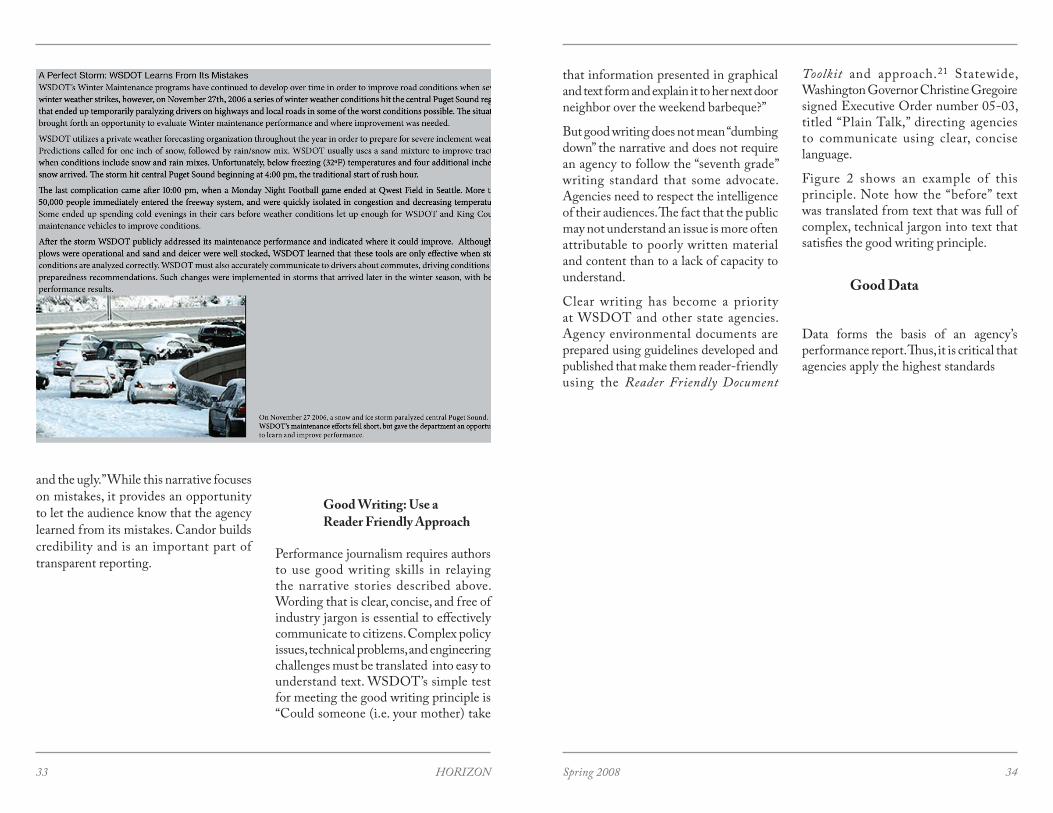
HORIZON Spring 2008
and the ugly.” While this narrative focuses on mistakes, it provides an opportunity to let the audience know that the agency learned from its mistakes. Candor builds credibility and is an important part of transparent reporting.
that information presented in graphical and text form and explain it to her next door neighbor over the weekend barbeque?”
But good writing does not mean “dumbing down” the narrative and does not require an agency to follow the “seventh grade” writing standard that some advocate. Agencies need to respect the intelligence of their audiences. The fact that the public may not understand an issue is more often attributable to poorly written material and content than to a lack of capacity to understand.
Clear writing has become a priority at WSDOT and other state agencies. Agency environmental documents are prepared using guidelines developed and published that make them reader-friendly using the Reader Friendly Document
Toolkit and approach.21 Statewide, Washington Governor Christine Gregoire signed Executive Order number 05-03, titled “Plain Talk,” directing agencies to communicate using clear, concise language.
Figure 2 shows an example of this principle. Note how the “before” text was translated from text that was full of complex, technical jargon into text that satisfies the good writing principle.
good data
Data forms the basis of an agency’s performance report. Thus, it is critical that agencies apply the highest standards
33 34
good writing: use a reader friendly approach
Performance journalism requires authors to use good writing skills in relaying the narrative stories described above. Wording that is clear, concise, and free of industry jargon is essential to effectively communicate to citizens. Complex policy issues, technical problems, and engineering challenges must be translated into easy to understand text. WSDOT’s simple test for meeting the good writing principle is “Could someone (i.e. your mother) take
While it is tempting to use narrative reporting to only tell the story of what went right, it is just as important to tell the story of when things go wrong.
figure 2. example of good writing.
figure 1. telling the story: example of candid, narrative reporting.
HORIZON Spring 2008
for data analysis. This requires critical thinking skills and an unyielding pursuit for data integrity and quality. At the same time, agencies must balance the need for data perfection against a need to publish in a timely manner (see the Good Timing principle described below).
Some writers have the tendency to be overly cautious when using and publishing data. Their preference may be to gather additional years of data before being comfortable to publish. You must be prepared to push back while respecting these concerns. At the same time, address the issue of incomplete or data limitations in the performance report by providing detailed footnotes or paragraph text. If data are likely to change, refer to it as “preliminary.”
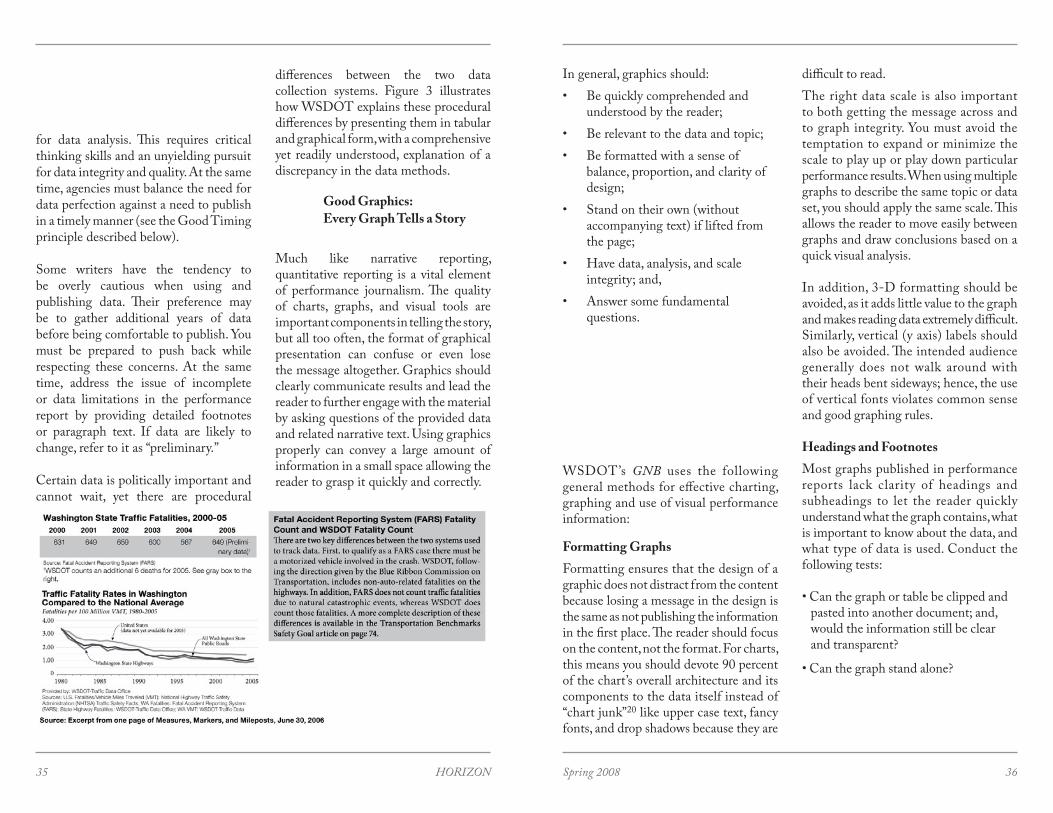
Certain data is politically important and cannot wait, yet there are procedural
35 36
differences between the two data collection systems. Figure 3 illustrates how WSDOT explains these procedural differences by presenting them in tabular and graphical form, with a comprehensive yet readily understood, explanation of a discrepancy in the data methods.
good graphics: every graph tells a story
Much like narrative reporting, quantitative reporting is a vital element of performance journalism. The quality of charts, graphs, and visual tools are important components in telling the story, but all too often, the format of graphical presentation can confuse or even lose the message altogether. Graphics should clearly communicate results and lead the reader to further engage with the material by asking questions of the provided data and related narrative text. Using graphics properly can convey a large amount of information in a small space allowing the reader to grasp it quickly and correctly.
In general, graphics should:Be quickly comprehended and understood by the reader;Be relevant to the data and topic;Be formatted with a sense of balance, proportion, and clarity of design;Stand on their own (without accompanying text) if lifted from the page;Have data, analysis, and scale integrity; and, Answer some fundamental questions.
WSDOT’s GNB uses the following general methods for effective charting, graphing and use of visual performance information:
formatting graphsFormatting ensures that the design of a graphic does not distract from the content because losing a message in the design is the same as not publishing the information in the first place. The reader should focus on the content, not the format. For charts, this means you should devote 90 percent of the chart’s overall architecture and its components to the data itself instead of “chart junk”20 like upper case text, fancy fonts, and drop shadows because they are
•
••
•
•
•
difficult to read. The right data scale is also important to both getting the message across and to graph integrity. You must avoid the temptation to expand or minimize the scale to play up or play down particular performance results. When using multiple graphs to describe the same topic or data set, you should apply the same scale. This allows the reader to move easily between graphs and draw conclusions based on a quick visual analysis.
In addition, 3-D formatting should be avoided, as it adds little value to the graph and makes reading data extremely difficult. Similarly, vertical (y axis) labels should also be avoided. The intended audience generally does not walk around with their heads bent sideways; hence, the use of vertical fonts violates common sense and good graphing rules.
headings and footnotesMost graphs published in performance reports lack clarity of headings and subheadings to let the reader quickly understand what the graph contains, what is important to know about the data, and what type of data is used. Conduct the following tests:
• Can the graph or table be clipped and pasted into another document; and, would the information still be clear and transparent?
• Can the graph stand alone?
figure 3. example of good data application.
Graphics should clearly communicate results and lead the reader to further engage with the material by asking questions of the provided data and related narrative text.
Agencies need to respect the intelligence of their audiences.

HORIZON Spring 2008
Treat headings as any headings describing text. Be succinct, yet clear. If the topic is complex, use multiple lines and subheadings to convey the information. Within seconds of viewing the page, the reader should understand the graph’s content and purpose. Use footnotes liberally to explain data sources and anything else the reader needs to know to draw the right conclusions, and understand analysis and data limitations.
limit the use of color
While color makes for a nice, glossy print, the majority of performance reports are posted to the Web or shared over e-mail and are eventually printed or photo copied in black and white. Black and white with gray scaling is the best choice for publishing. Every chart needs to be readable in a photocopy or fax and, if in doubt, test colors and shading on a copy machine before publishing. Gradient shades should be used to show incremental transitions in data or scale. Gray shading should be used consistently. Black or the darkest shade should be used for the most significant piece of data or the most current, with the caveat that the most significant piece of data may not always be the biggest slice. The lightest shades should be used for data with the least significance or previous period data.
de-and reconstructing a typical graph
Spreadsheet software, while widely used, has some limitations. Resist the temptation to use the many formatting features offered in spreadsheet programs simply because they are available. Many of these
formatting features violate good graphing principles. The following reconstruction of a typical graph is offered as an alternative. All of this can be done using standard spreadsheet software and anyone with good spreadsheet skills should be able to replicate these steps.
Figure 4 shows a re-designed chart to illustrate some important good graphics principles. The simple steps used to improve the readability of this chart include:
1) Removing the background shading; 2) Removing the outside box;3) Removing the 3-D effect;4) Removing some of the numbers on the left axis;5) Removing some gridlines and lightening them; removing tick marks on the bottom axis;6) Removing the legend on the right
side of the graphic; 7) Removing the unneeded totals data
(comparing men versus women in income, so the totals are not relevant);
8) Labeling bars and moving totals out of the bars;
9) Strengthening the color by making the 1989 bar darker;
10) Matching the headings (i.e. men versus male and female versus women);
11) Making the fonts more legible decreasing the emphasis on the chart reference;
12) Re-writing the title;13) Deleting the sub-head;14) Removing vertical/y-axis label and
use as sub-heading; and,15) Adding a reference for the source data.
37
good format/presentation
Good formatting and presentation is an essential principle of performance journalism, as the design of a report should entice the reader to engage with the material, allow a quick grasp of the message, and not distract f rom the content.
employ a reader-friendly page layout
Use a layout that does not overwhelm the reader by cramming too much data onto one page. At the same time, strive to present the critical information, text, and graphs adjacent to each other in as
little space as possible. Do not use multiple fonts or too many colors. Treat the page like expensive real estate and use it wisely to share the most critical result and key messages. You should ask yourself, “What is it that the audience needs to know about a particular performance topic?”
group relevant information together
Include text that explains a chart or graph on the same page. This prevents readers from having to flip between pages in order to find data that is being discussed in the narrative. The use of figures or table references, while possibly appropriate or required for academic material (like this paper), is not suggested. If, as mentioned under the “good graphs” principle, the
38
figure 4. revising graphical data to be reader friendly.

HORIZON Spring 2008
text that relates to a data set is placed close to the graph, no referencing system using “Table #” or “Figure #” is needed.
When possible, use a photograph that can give the reader a further visual representation of a topic that is being discussed. If the topic is very technical or
requires additional background material, use side bars and text boxes near the graph and main text. Ask the question, “How should you plan this page to use and lay out text, data graphs, technical information, and photos in the most effective way to convey the message?”
Figure 5 is a page from WSDOT’s GNB. Notice how this layout includes graphical data, a narrative explanation, a side bar, and a photo to illustrate the concepts in the article.
Quality control: it’s your credibility
The issue of quality control was briefly discussed earlier under “Good Data.” Quality control goes beyond ensuring that data are correct. It is also important to maintain data reasonableness. Do the data obtained from different sources or years make sense? Is the data set consistent? Statistical testing, while helpful, is not absolutely necessary to check that data are consistent. The important skill is critical thinking and a good eye for numbers.
ensure an audit trail
Quality assurance also mandates keeping an audit trail of all data. A performance audit at some time in the future is virtually guaranteed and keeping careful records of the source of data will be helpful in responding to audit questions. At the very least, a systematic and efficient record-keeping system makes answering questions about how performance measures are computed or the decisions about why one method of measuring was chosen over another much easier to answer.
Question data and text
Agencies must challenge assumptions and explanations for performance and understand data sources and their
particular and weaknesses or shortcomings. Performance reports must also be quality controlled for consistent messaging. Are agency programs siloed or do they work collaboratively in ensuring good performance reports? Instilling a sense of shared responsibility where everyone in the organizations owns the results and has responsibility for accuracy is a key component of this sixth principle.
performance reporting is not a spectator sportExecutives should be prepared to edit the performance report as needed. For example, WSDOT’s former secretary, Doug MacDonald and other executives were closely involved in editing the Gray Notebook. An example of his hands-on approach can be found on “Doug’s Accountability Legacy” at the following link:
www.wsdot.wa.gov/Accountability/Publications/PerformanceDocuments.htm.
While not every CEO is able to conduct such detailed, hands-on editing, executive and upper level management involvement is necessary. Upper level management should understand and be able to critically review data and text.
good timing: lead, don’t follow
Timing is everything. It is important to start performance reporting now and to report frequently and consistently. Do not yield to the temptation to delay reporting until
39 40
figure 5. example of a good layout.

HORIZON Spring 200841 42
The good, The bad, and The ugly
Do not hide bad news. Performance journalism is an agency’s chance to tell its story first and do it the correct and complete way. This is especially true for sharing bad news. Timely performance reporting allows agencies to control rather than be controlled by the headlines. Reporting the bad as well as the good builds credibility and trust. A report on a negative result can be just as powerful as telling a success story provided that an agency tells the story, in a frank, candid manner and provides a clear picture of what will be the next step to address a given situation. However, this is not meant to be a license to perform poorly. Consistent good performance is a must for sustained credibility.
performance reporting is iterative
Practitioners must be aware that performance measurement and reporting
a perfect dataset is collected, a complete measurement program is developed, or a sophisticated IT system is installed. WSDOT’s 100-page Gray Notebook is published every quarter without automated data collection systems. While difficult, it is not a fatal flaw or handicap.
Public expectations and discontent have added a sense of urgency to the need to publish performance results, yet many organizations struggle with how to begin and how to sustain the effort once underway. What to report is largely a function of what the agency is responsible for and what accountability needs exist. Questions to ask may include: “What are we responsible for; what is important for us to know about our programs; what is important for the public or media to know about us; how do we know we are doing what we said we would do and are funded to do; what data do we have to support any of these questions?”
While there is a sense of urgency, it is important to be selective. It is not necessary to start reporting everything immediately; rather, start small. Gradually cover all of the most critical systems and delivery issues. For example, WSDOT’s first performance report was published within six weeks of the arrival of the new secretary. Even though it was only seven pages long and addressed only two topics - worker safety and project delivery - it was an important message and symbol that WSDOT was going to be accountable. The media response was immediate. The agency had faced strong public ridicule and criticisms for lack of accountability prior to April 2001. Three months later, just after
Even if key performance areas such as congestion or pavement and bridge condition can only be published annually due to data availability, other topics such as incident response or on-time performance of transportation services can be published at least quarterly to establish a regular public presence and accountability brand that people will readily recognize. For additional examples of these seven principles of performance journalism, the reader is encouraged to visit WSDOT’s Gray Notebook archives on the web at:http://www.wsdot.wa.gov Accountability/GrayNotebook/gnb_archives.htm for more examples.
lessons learned
software for reporting
Standard office software packages can be used and adapted to meet performance journalism principles and create effective communication tools either for regular hard copy reports, the internet, or special publications such as folios and brochures. Some vendors offer various performance reporting software packages that produce standard reports and graphs. While WSDOT has not specifically tested these products, many appear to lack good customized graphing and formatting options and have limited to no options for narrative text. Performance journalism principles can be easily applied to dashboard and other interactive, web-based performance reporting approaches as long as the underlying software is flexible enough to allow for narrative text and enhanced graphs.
the second GNB was published, reactions were positive:“These reports are among the best I’ve seen in Washington state government for using performance easurement data to tell the agency’s story.”(unpublished data, The Washington State Office of Financial Management, July 2001)
Twelve months later, press response was overwhelmingly positive:“Accountability builds trust and candor, removes mysteries,…the Gray Notebook is as addictive in the same manner as the copy of The Word Almanac.”22
“The Measures, Markers, and Mileposts (Gray Notebook) publication is education in action. If you are not checking this out, you are missing out.” (unpublished data, Washington Highway Users Federation, May 2002)
In general, the more timely and frequent the performance information is published, the better. In today’s environment, citizens and policymakers expect instant information and just-in-time delivery. Annual reports, while suitable for outcomes or indicators tracking, do not provide the agility to respond to changing public needs, emerging policy issues, and topics that gain media attention. A quarterly or, even better, monthly report allows agencies to use performance journalism, to provide performance data, and special updates on selected topics and emerging issues. For example, WSDOT was able to use the GNB as a venue to quickly respond to a public outcry over pesticide use by producing a performance article on the actual pesticide usage and overall program.
HORIZON Spring 2008
is not static. It is an iterative process that is continuously evolving to meet changing external mandates, policy priorities, funding scenarios, and internal management needs. Agencies should also expect that measures will change over time as performance tracking and analysis methods become more robust and established. Agencies have to be prepared to try and test different approaches to find the right balance in analyzing and communicating key issues.
Development of a performance reporting program may seem to be a huge project. Agencies may be tempted to abandon development of a performance reporting system due to the enormity of the task. The authors urge public administrators to start small but start now. Recognize that additional performance measures can and most likely will be added as multiple information consumers become accustomed to receiving performance information and request more.23 Using WSDOT’s GNB as an example, the first edition had seven pages of content and has grown to over 100 pages of content over three years. It continues to change to meet changing internal and external reporting needs.
conclusion
Public administrators must not only publish performance information, but should do so in a manner that effectively communicates this information to a broad audience collectively defined as “citizens.” Effective communication of information goes beyond simply compiling and publishing data. It requires
a communication style that captures and retains citizens’ interest and then provides citizens with the necessary tools to understand the data that are presented. If citizens can not easily understand the performance report that is produced, it will do little if anything to correct the problem of information asymmetry and the resulting lack of knowledge about agency performance. Public agencies are well-advised to effectively communicate performance information in light of the current environment of ever increasing demands for government services combined with declining funding.
WSDOT ’s strategy for effective communicat ion of per formance information is the result of over six years of experience communicating transportation performance measures for the agency. The seven principles, collectively called performance journalism, proved successful in gaining public support for increased funding. Seattle Mayor Gregory Nickels’ comments in April 2007 provide a succinct summary of the results obtained from the “performance journalism” approach to performance reporting that was instituted by former Secretary Douglas MacDonald: “Under [Doug MacDonald’s] watch,
Washington State increased funding for state highway projects to an unprecedented degree. He consistently emphasized accountability to the people of Washington State” (unpublished data).
In light of the importance of effective performance reporting methods in correcting information asymmetry and supporting increased funding, future work in research, testing, and validating the effectiveness of various approaches is important.
worKs cited
1 Pascal, C. “DOT’s MacDonald Takes Road to Accountability.” Puget Sound Business Journal, May 3, 2002. www.seattle.bizjournals.com/seattle/stories/2002/05/06/editorial3.html. Accessed July 13, 2007.2 “Strategic Highway Safety Plans: A Champion’s Guide to Saving Lives.” Federal Highway Administration. www.safety.fhwa.dot.gov/safetealu/shspguidance.htm#LinkTarget_1478. Accessed July 20, 2007.3 Kelly, J.M. “If You Only Knew How Well We Are Performing, You’d Be Highly Satisfied With the Quality of Our Service.” National Civic Review, Vol. 91, No. 3, 2002, pp. 283-292.3 Swindell, D., and Kelly, J. “Performance Measurement Versus City Service Satisfaction: Intra-City Variations in Quality?” Social Science Quarterly, Vol. 86, No. 3, 2005, pp. 704-723.4 Manzetti, L. “Political Manipulations and Market Reform Failures.” World Politics, Vol. 55, 2003, pp. 315-360.5 Berry, F.S., and Wechsler, B. “State Agencies’ Experience with Strategic Planning: Findings
from a National Survey.” Public Administration Review, Vol. 55, No. 2, 1995, pp. 159-168.6 Walsh, K. “Quality and Public Services.” Public Administration, Vol. 69, 1991, pp. 503-514.7 Bremmer, D., Cotton, K., and Hamilton, B. “Emerging Performance Measurement Responses to Changing Political Pressures at State DOTs: A Practitioners’ Perspective.” In Transportation Research Record: Journal of the Transportation Research Board, No. 1924, TRB, National Research Council, Washington, D.C., 2005, pp. 175-83.9 Ammons, D.N. Municipal Benchmarks: Assessing Local Performance and Establishing Community Service Standards. Sage Publications, Thousand Oaks, CA, 2001.10 Berman, E.M. Productivity in Nonprof it Organizations: Strategies and Techniques.: Sage Publications, Thousand Oaks, CA, 1998.11 Haltry, H.P. Performance Measurement: Getting Results. Urban Institute Press, Washington, DC, 1999.12 Heinrich, C.J., and Lynn, Jr., L.E., eds. Governance and Performance: New Perspectives. Georgetown University Press, Washington, DC, 2000.13 Keehley, P., Medlin, S., MacBride, S., and Longmire, S. Benchmarking for Best Practices in the Public Sector: Achieving Performance Breakthroughs in Federal, State, and Local Agencies. Jossey-Bass, Somerset, NJ, 1996.14 Sims, R.R., ed. Accountability and Radical Change in Public Organizations. Quorum Books, Westport, CT, 1998.15 Williams, H.S., Webb, A.Y., and Philips, W.J. Outcome Funding: A New Approach to Targeted
43 44
E f f e c t i v e c o m m u n i c a t i o n o f information goes beyond simply compiling and publishing data. It requires a communication style that captures and retains citizens’ interest and then provides citizens with the necessary tools to understand the data that are presented.
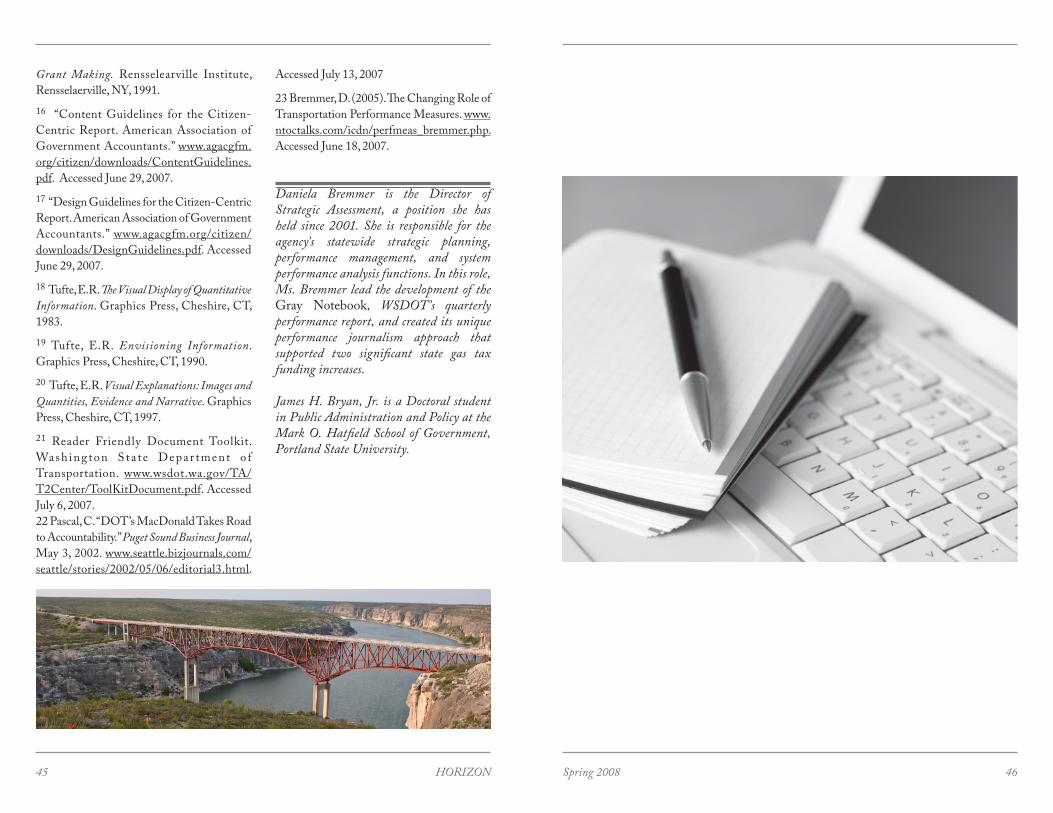
HORIZON Spring 2008
Grant Making. Rensselearville Institute, Rensselaerville, NY, 1991.16 “Content Guidelines for the Citizen-Centric Report. American Association of Government Accountants.” www.agacgfm.org/citizen/downloads/ContentGuidelines.pdf. Accessed June 29, 2007.17 “Design Guidelines for the Citizen-Centric Report. American Association of Government Accountants.” www.agacgfm.org/citizen/downloads/DesignGuidelines.pdf. Accessed June 29, 2007.18 Tufte, E.R. The Visual Display of Quantitative Information. Graphics Press, Cheshire, CT, 1983.19 Tufte, E.R. Envisioning Information. Graphics Press, Cheshire, CT, 1990.20 Tufte, E.R. Visual Explanations: Images and Quantities, Evidence and Narrative. Graphics Press, Cheshire, CT, 1997.21 Reader Friendly Document Toolkit. Wash ing ton S ta t e Depar tment o f Transportation. www.wsdot.wa.gov/TA/T2Center/ToolKitDocument.pdf. Accessed July 6, 2007.22 Pascal, C. “DOT’s MacDonald Takes Road to Accountability.” Puget Sound Business Journal, May 3, 2002. www.seattle.bizjournals.com/seattle/stories/2002/05/06/editorial3.html.
Accessed July 13, 2007
23 Bremmer, D. (2005). The Changing Role of Transportation Performance Measures. www.ntoctalks.com/icdn/perfmeas_bremmer.php. Accessed June 18, 2007.
Daniela Bremmer is the Director of Strategic Assessment, a position she has held since 2001. She is responsible for the agency’s statewide strategic planning, performance management, and system performance analysis functions. In this role, Ms. Bremmer lead the development of the Gray Notebook, WSDOT’s quarterly performance report, and created its unique performance journalism approach that supported two significant state gas tax funding increases.
James H. Bryan, Jr. is a Doctoral student in Public Administration and Policy at the Mark O. Hatfield School of Government, Portland State University.
45 46

Online JamProcess Overview
Report
Topic Guide
Email Invitation
Forum Active
Confirmation(URL-PIN)
Recruitment
Idea Generation & Brainstorming
Session
Idea Prioritization Session
Pretest
Planning
Forum Consensus
48
Jamming:Engaging Stakeholders
in a New Wayby Mia Zmud
Research Director, NuStats LLC
s we move into the 21st century, the challenges facing transportation officials are becoming ever more complex
and unpredictable. Agencies must balance a complicated set of interrelated problems that were not on the agenda just 10 to 20 years ago. Efforts to improve mobility must also address inadequate f inance, institutional reform, environmental protection, energy conservation, safety, equity, and security.1 Overcoming this
challenge means engaging different voices and perspectives for assistance. But how do you achieve a meaningful stakeholder response2 yet avoid the trap of a one-size-fits-all approach?
There are many “tried and true” public engagement approaches currently in practice, yet the multi-dimensional aspect of the mobility issue means that transportation leaders must look for new ways to engage stakeholders in more
HORIZON Spring 200849 50
in
or even days) for an exchange of ideas and “brainstorming.” The topics discussed in the jam are focused on issues selected by the sponsor and the results are an instantly accessible and analyzable record of the ideas and opinions expressed within the jam. Moderators are present during the discussion period to monitor the activity, answer questions, encourage participation, and even narrow or expand the scope of the conversation, if necessary. At the end of the discussion period, these facilitators also winnow and consolidate the results for further evaluation by participants.
The online jam was pioneered by the IBM Corporation who organized three internal jams of varying duration in 2001, 2002, and 2006.3 IBM designed the jam in the belief that given the right opportunity and forum, IBM employees worldwide could both identify critical challenges facing the corporation and devise clever solutions to address them. According to Mike Wing, IBM director of worldwide intranet strategy and programs, “…we didn’t necessarily want the executives who were responsible for X,Y, or Z topic [to respond to the problems], because we precisely wanted to come at things from some unusual angles, encouraging people
purposeful and targeted discussions. Not all stakeholders have equal capacity to be involved, so efforts to engage them should be targeted and focused. This means selecting the appropriate engagement activity or venue for the policy goal to be addressed and then matching that venue with the stakeholders who can best deliver and inform. This article introduces a new format for public participation called an online jam and briefly shares the process and experiences of the Texas Department of Transportation (TxDOT) in the first pilot test of this format in a government setting.
introducing the online Jam
The use of Internet websites has become a popular tool to educate and inform the public about transportation issues, but typically, it has been a one-way communication flow from transportation agency to the stakeholder. In recent years, however, online surveys, blogs, podcasts, and polling have made web-based, two-way communication more commonplace for gauging public sentiment and gathering input.
In May 2007, the Texas Department of Transportation (TxDOT) in collaboration with the RAND Corporation and NuStats, a social science research firm, explored the application, feasibility, and implementation costs of using a format called an “online jam” to help TxDOT managers in policy and program decision making. An online jam is around the idea of collaborative innovation. It is a web-based forum that can bring a large number of people together through a web site to communicate for a specified period (hours
who would bring a different intellectual frame of reference to the topic.” 4
For the f irst jam held in 2001, the intranet site included distinct forums on topics ranging from work/life balance to sales tactics. At the end of each session, moderators nominated some of the best ideas discussed during the jam and attendees voted on these to create a final list of “10 great ideas” which were posted to the corporate website. The response from employees was signif icant -- 6 million hits from approximately 53,000 employees worldwide, resulting in 6,000 individual comments posted.
More recently, the jam held in 2006, known as the InnovationJam, lasted 72 hours and was open to IBM employees, universities, clients, and business partners to pitch ideas about what the company should be doing. The purpose was to move beyond incremental innovations to identify major new market opportunities and to create achievable solutions that would advance businesses, communities, and broader society in meaningful ways.5
The first session focused on creating ideas for new types of innovative services and new ways of doing business. The largest online brainstorming session ever, the InnovationJam registered more than 150,000 participants in more than 104 countries, including business partners and clients from 67 companies.6 These participants generated more than 46,000 ideas which were then filtered, partly by software and partly by teams of IBM staff, based on potential for short-term success and long-term impact. Of those ideas, a select few would pass to the next
stage, a second session where participants returned and refined the most promising ideas. At the time, IBM had committed millions in development funds for the best ideas.
Despite the successful experiences reported by IBM, the market for online jam service providers is still not yet well-established and the software for conducting such an online forum remains in early development or is strictly proprietary. While Internet searches indicate that online jams are being used to inform public decision making, there is little to no guidance on designing and conducting an online jam. Furthermore, few, if any, articles have been published on the application of the online jam format as a way to engage stakeholders in government decision making.
In the summer of 2007, NuStats, in cooperation with the RAND Corporation, collaborated with TxDOT on a pilot project to test online jams. The first, the Trans-Texas Corridor Jam, was used to solicit suggestions on how to better educate the public on Texas’ mobility needs and the potential value of the Trans-Texas Corridor project (TTC), including how to address their concerns. The TTC Jam was planned for a small group (25 to 50 participants) located around Texas and a short time frame (a few hours) to assess the jam’s utility both as an idea generation tool and as an alternative to a conference call or in-person meeting. The second jam generated ideas on how to best communicate the value of toll roads to society and the benefit of using them as a financing tool. The second Toll Road Jam

HORIZON Spring 200851 52
figure 1. overview of online Jam.
online Jam session.the trans-texas corridor online Jam
In June 2007, TxDOT held the Trans-Texas Corridor online jam (TTC Jam) to shed light on how the agency could improve its public education efforts on behalf of the Trans-Texas Corridor, one of the largest, most ambitious transportation projects in the nation. With an eye on enhancing its communications, TxDOT enlisted key stakeholders in an online jam to generate fresh and informed ideas on effective education and outreach strategies
for engaging the public on the TTC.
Participants were drawn from the memberships of both the TTC Advisory Committee7 and the Alliance for I-69 Texas.8 Through these affiliations, all participants were familiar with TTC issues and were in a best position to suggest effective ways to communicate the needs and benefits of the TTC while at the same time addressing the concerns of the public.
The purpose of Session 1 was to generate ideas and strategies, and the discussion was guided by a set of general questions
entering the site.
Participants were encouraged to visit the website prior to the session in order to get familiar with and navigating on the online jam website. Instruction and quick tips on using the site and background information on topic were also posted on the website.
The moderator introduced the Session 1 general discussion topics (questions) and kept the discussion on topic and flowing.
At the conclusion of Session 1, NuStats analyzed the discussion and generated a succinct summary of the top ideas generated. These ideas served as the topics of discussion for Session 2.
The moderator introduced Session 2 and facilitated discussion flow.
At the conclusion of Session 2, participants also voted on the top ideas generated from Session 1.
While both jams produced interesting results and insights for their use in public dialogue, for brevity’s sake we present the following discussion of the TTC jam as a good illustration of the mechanics of an online jam session.
3.
4.
5.
6.
7.
was intended for a larger group (100 to 200 participants) and a longer time frame (a few days), acting as a bulletin board where people could post their ideas and come and go as they pleased.
For both online jams, NuStats chose an effective linear threaded discussion, in which each thread is represented by a single topic and each post follow the previous post in chronological sequence. A focal point of the construct of the online jam is that it is a two-session, iterative process—first, it engages participants in a brainstorming discussion on a specific topic and in a second, follow-up session, participants select the top ideas or strategies in a consensus-building discussion.
Each online jam was held over two sessions, each ranging from one to 48 hours. Each followed a similar sequence of operational steps:
The online Jam process
Email invitations were sent to prospective participants.
Email confirmations were sent following receipt of expressions of interest from participants. Because the online jam was restricted to invited participants only, the email confirmations provided the link to the online jam website and personal identification number (PIN) for
1.
2.

HORIZON Spring 200853 54
in
Enlist TTC Advisory members to assist with education.
Build partnerships with commercial entities located along TTC routes.
Finally, the summary outlined three questions that the panelists would discuss in Session 2 for each of the strategies:
What is the expected impact or outcome of this strategy in helping to communicate the needs and benefits of TTC to the public and to address their concerns?
Would this strategy require acceptable manpower and monetary costs to implement?
Are there any drawbacks or things to watch for when implementing this strategy?
After a second round of discussion in Session 2 to rank the proposed solutions, the participants voted on the top two strategies.
Getting buy in and support from local government and elected officials who may not be willing to take a stand in support of TTC if their constituents are opposed to it ranked first.
Setting up meetings with local citizen groups that have a local community influence, such as Lions Clubs, Rotaries, neighborhood associations, and others, to inform their membership and be a resource for support ranked second.
Since the conclusion of the pilot, TxDOT has been evaluating both the potential
5.
6.
1.
2.
3.
•
•
for future applications of the online jam format and the strategies suggested by the participants.
lessons learned in conducting an online Jam
In this section, we present several broad observations on conducting online jams and suggestions for integrating them into your public engagement plan.
obstacles to getting participants Though effect ive in enl ist ing participations, most government agencies are restricted from offering prizes or monetary incentives. Government agencies must typically rely on the topic saliency and interest in contributing to resolution of the issues being discussed. TxDOT found that a strong incentive to participate in the online jam was genuine interest in the online jam as a new participatory venue.
participant motivations Var y Participants will have different motivations to participants and
1.
2.
ranging from the current knowledge levels of the public about the TTC to opinions on their attitudes towards TxDOT in general to issues and concerns about the TTC. Participants were also queried about how TxDOT could overcome and address those issues.
The exchanges among the participants were active during both sessions of the TTC Jam and many high-quality and insightful comments were generated—a ref lection of having knowledgeable panelists. They discussed their individual experiences dealing with local officials and stressed that educating local elected officials is the key to success of TxDOT’s TTC outreach efforts. Among the notable comments by the participants:
“Local officials can’t be expected to support something they don’t have enough knowledge about to counter objections. They must understand the underlying need for the project.”
“In advance of community meetings, visit with the local leadership to develop a list of all issues that are of concern in that area and focus the program on those issues. We need to understand that the standard presentation does not work in all areas.”
“The local folks along the route need to see what is in it for them. In many rural areas they compare TTC to the Interstate Highway System, which bypassed local communities and killed small businesses in many of those towns. In urban areas, many folks see it as a bypass of their community and that it will take money and resources from urban congestion relief to fund international trade
corridors.”
It became apparent that participants close to the issue felt strongly that convincing local officials and providing them answers to their communities’ concerns were considered vital to gaining public support for the TTC.
Their suggestions were consolidated into six strategies to better educate the public on the purposes and benefits of the TTC. These strategies naturally led to a second session for further discussion about their effectiveness, practicality, and overall attractiveness. Prior to Session 2, panelists received a three-part summary that opened with the major problems revealed in the first session:
Many Texans still do not have a good understanding of the need for the TTC.
Misconceptions about the TTC still exist.
TxDOT outreach efforts could be improved.
The summary then outlined the six strategies proposed as possible solutions:
Get local government buy-in and support.
Conduct smaller public meetings.
Develop and distribute materials to address public concerns.
Meet with community groups to build local support.
•
•
•
1.
2.
3.
4.

HORIZON Spring 200855 56
in
Ideas for improving the quality of discussions include:
(1) inviting guest speakers to introduce new topics or to purposefully offer challenging opinions during the discussion; and,
(2) extending f lexibility to the panelists by allowing them to start new threads. Any loss of control over the agenda and evolution of the discussion may be offset by the gains in regards to the quality of the discussion the guest speaker/panelist may inspire.
Venue accessibility. While the online jam offers an intr iguing venue to engage a stakeholder community in public policy discussions, there still needs to be equal opportunity and other options for public participation that does not require Internet access. However, the online jam format is still viable to reaching this segment of the population by providing Internet access through partnerships with community centers, public libraries, churches, or other local community organizations.
potential obstacles
Still, there are some impediments to its
•
•
1.
sponsors of the online jam venue should anticipate these motivations. Some may participate to learn more about the topic and others may feel that answering basic questions is a waste of their time. Each of the TxDOT online jams was designed to match the knowledge level of the participants on the topic to the range and depth of questions posed during the sessions.
time commitments Selecting the proper duration for the online jam for the set of participants is an important consideration. If the session was too short (e.g., one or two hours), participants would not have enough time to comment on each other’s ideas and the jam could become superficial. Conversely, if it was too long, some participants would lose interest and drop out or even decline to participate in the first place.
discussion Quality. Achieving the goals of the online jam requires sustaining active part icipation of panel ists and maximizing the quality of the information they post. This involves capturing panelist interest and inspir ing creat ive, thoughtful discussion throughout each session with a well-developed discussion guide (prepared in advance), and a trained moderator to keep the discussion on topic. The discussion should be designed to find a middle ground between the knowledge levels and experience of the panelists.
3.
4. practical use. First, the topic must be of clear interest and importance to the stakeholders in order to successfully recruit sufficient participants to create a meaningful dialogue. Second, it is important to identify situations in which online jams would clearly be a better choice than other engagement tools.
The likelihood is higher that an online jam wil l prove to be an effective tool for stakeholder discussions and bra instorming i f one or more of the fol lowing characteristics exist:
Participants are unable to come to 1.
one physical location for a meeting.
A conference call will not suffice because the participants need to review earlier discussions in the meeting.
A video-conference cannot be held because some participants have no access to such facilities.
The meeting organizer wants the participants to produce results in a short period of time and then react quickly to a summary of the brainstorming.
An incentive or recognition for participating can be offered to participants.
conclusion
The online jam offers a viable venue for hosting in-depth discussions with stakeholders on public policy issues. It is about the potential to broaden the organization’s view beyond its walls through the varying perspectives of different people and hopefully triggering a process of new ideas.
It saves time and money since panelists can participate without the need to travel.
It potentially reaches and involves more people than t radit iona l participation processes. Participants are able to take part in multi-day discussions at a location of their choice (e.g., anywhere they can access the Internet).
2.
3.
4.
5.
•
•
Lessons LearnedParticipantso Anticipate a low response rate & over-recruit
by 10-15%.o Expect core of active panelists & many “lurkers.”o “Recruit to Fit” by securing panelists with similar
knowledge and interest levels with topic.
Format & Lengtho Set time for discussion topics may limit some
ideas, but leads to consensus-building.o Multiple threads open at once is successful
for generating ideas, but may be too uncontrolledfor consensus-building.
o A longer session timeframe (>24 hrs) offersconvenient posting; match the length to the goal.
Discussiono Expect strong start and finish; collegial & positive.o A moderator is vital to keep discussion flowing,
generate new questions and maintain focus.o Consider “guest speakers” to introduce new topics
and elicit/sustain panelist interest.
Softwareo Assess technical capacity beforehand.o Consider “free” user-friendly software or v-Bulletin
with tech assistance ($100-150).
Overall Utilityo Engage stakeholders or experts on policy topics at
their convenience.o Augment public involvement/community
involvement programs to capture those whocannot attend meetings; be mindful of those whocan’t participate.
HORIZON Spring 200857 58
in
carry out, and manage decisions. Activities include ballots, citizen juries, and delegated decisions.
A key message in designing engagement processes is to be clear on the level of participation and the extent in which participants determine outcomes and actions. The level of participation must match the purpose of engagement.
worKs cited 1 Transportation Research Board, “Critical Issues in Transportation” 2006 located at: http://www.trb.org/news/blurb_detail.asp?ID=5786.2 Stakeholders is a broad term used in this article to define groups of people; whether they are community or business groups, interest groups, citizens, etc. A stakeholder community may represent a geographic location, a community of practice or similar interest, or a community of affiliation such as a neighborhood or industry association).3 Bob Andelman, Big Blue’s World Jam, MeetingsNet, October 1, 2001; Lynn Dorsett, Michael Fontaine and Tony O’Driscoll, Redefining Manager Interaction at IBM, Knowledge Management Review, September/October 2002, Melcrum Publishing; and InnovationJam: Getting Started, downloaded from www.globalinnovationjam.com/get_started2006/intro/index.shtml on September 4, 20064 Andelman, Bob. Big Blue’s World Jam, MeetingsNet, October 1, 2001.5 InnovationJamGetting Started, downloaded from www.globalinnovationjam.com/get_started2006/intro/index.shtml in May 2008. 6IBM Invests $100 Million in Collaborative Innovation Ideas, http://www-03.ibm.com/press/us/en/pressrelease/20605.wss
It introduces a more dynamic mode of communication than a meeting. The online format affords participants time to ref lect and prepare well-reasoned statements for others to hear while also listening to, responding to, and questioning statements made by others. It also creates a new way for them to learn how to collaborate around an idea.
staKeholder engagement
Stakeholder engagement can take many forms and covers a broad range of activities: 9
informing stakeholders of policy directions. Activities include websites, fact sheets, open houses and other one-way information sharing venues.
consulting stakeholders as part of a process to develop policy or build awareness and understanding. Activities include public meetings, focus groups and surveys, and formal public comment efforts.
involving stakeholders to ensure their issues and concerns are understood and considered as part of a decision-making process. Activities include workshops and deliberative polling.
collaborating with stakeholders t h r o u g h p a r t n e r s h i p s t o de ve lop opt ion s a nd ma k e recommendat ions. Activities include citizen advisory committees and consensus-building activities. empowering stakeholders to make,
•
•
•
•
•
7 A citizen committee formed in March 2005 to give more Texans a seat at the table in developing the Trans-Texas corridor and to advise TxDOT on key issues that should be addressed in planning the corridor. Membership: approximately 26 members.8 Organized in 1993 by the Greater Houston Partnership, the Alliance for I-69 Texas is an advocacy group representing 34 counties from East to South Texas that have worked collaboratively to advance the development of I-69. Membership: approximately 100 members.9 Community Engagement Network, “Effective Engagement: building relationships with community and other stakeholders. Book 1-An Introduction to Engagement.” Melbourne, September 2005.
Mia Zmud is a research director at NuStats LLC, an Austin-based firm specializing in social science research. She directs research studies on a number of social issues with an emphasis on environmental and public health and safety and pioneered the application of technology for inclusive public involvement through the Virtual Forum that integrates communication, research and public relations. She recently piloted the technique of “ jamming,” using an on-line venue for engaging stakeholders and others in public policy and program development dialogues.

ore than 1,200 people attended the 2008 Texas Transportation Forum in
Austin on April 20-22 to hear from front-line officials about how they’re tackling local, state and national transportation problems. Conference goers learned about the realities of funding both present and future transportation needs, talked about transportation security in a post-9/11 world, and discussed how a good transportation system can bring economic opportunity to future generations of Texans.
Below are some of the comments from presenters at the Forum sessions:
“The work we do together makes a difference and we cannot relent in our quest to solve these challenges. because we’re not just talking about dollars and concrete and orange cones. instead, we are talking about freedom: the freedom
horizonON THE
60
to move about, to transport goods or to simply travel freely with one’s family.”- Gov. Rick Perry, on the need to stay engaged in solving Texas’ transportation challenges
“we, as a state, have come to the real point where we have to decide whether we are going to become a third-world transportation state or whether we are going to rise to the occasion and make sure that we can keep as much maintenance as possible and keep people moving.”- U.S. Rep. Eddie Bernice Johnson of Dallas, on the transportation challenges facing Texas
“america’s global economic strength is due in large part to a surface transportation system that historically ranked amongst the best in the world. it’s our highway system that enables a large,
3
HORIZON Spring 2008
prosperous population to efficiently import and distribute goods from around the world and to transport its own goods efficiently from anywhere on the continent to the rest of the world.”- State Rep. Mike Krusee, on the impact and importance of the state’s highway system
“we in texas should guard against the temptation to injudiciously transfer funds from maintenance to new capacity. although our current citizens desperately need the new roads, if we transform mere maintenance costs into future rehabilitation costs, we will have passed on a many-fold burden to the next generation.”- State Rep. Mike Krusee, on the competing needs of maintaining the highways we have and reducing congestion
“we recognize there’s a short-term funding problem with the highway trust fund, which is somewhat just this side of catastrophic. and then there is a long-term problem that actually, may be structurally even more serious.”- Geoffrey Yarema, member of the National Surface Transportation Infrastructure Financing Commission, summarizing the commission’s finding on transportation funding in the U.S.
“north texas positioned itself to do quite well.”- James Bass, TxDOT’s chief financial officer, on the success of the Dallas-Fort Worth region to get a $3.2 billion upfront
eople have always been fascinated with the future.
Maybe it’s the adventuresome side of humans that pokes at our imaginations and calls us to speculate about the frontier
6261
by John BoggessVice President of Communications
Thompson Marketing
future texas: scenarios for the future of texastransportation
payment from the North Texas Tollway Authority for the State Highway 121 project. The money is obligated to road projects in the DFW region.
“nobody can tell you what the plan is, what the vision is.”- U.S. Representative John Mica of Florida, Republican leader of the House Transportation and Inf rastructure Committee, on the need to define a national goal for transportation.
“ we texans are at the wheel of a powerhouse economy that is racing forward at record speeds. as our growth accelerates, our needs do as well. we do not fulfill the public trust if we waste our time arguing over millions when our needs are in the billions.”- Gov. Rick Perry, on the need to work together to deliver transportation solutions.
of tomorrow. One thing for sure, it’s always tough to wrap your mind around something that doesn’t exist…yet.
But that’s exactly what a team of TxDOT and University of Houston Futures Studies researchers are trying to do. They’ve come together on the TxDOT Scenarios Project to develop some transportation situations that could materialize in the future in order to determine how Texas should be planning today.
“Trying to forecast the future always seems to conjure up spooky music and pictures of crystal balls in people’s minds,” said Ron Hagquist, senior planner with TxDOT’s research off ice. “However, the type of scenario planning that we’re embarking on has actually been used for decades. Major corporations and the military have successfully applied these methods to prepare themselves for what could come.”
Hagquist explained that the University of Houston’s Futures Studies program had already done much of the data gathering by futurists worldwide on major trends and possible developments in six categories: technology, demographics, economics, culture, politics, and the environment.
For example, over the next several decades, vehicle fuel efficiency will impact
While it is impossible to predict the future, you can always be better prepared for it. More than ever, the transportation challenges we face require our leaders to think strategically about the future. Maintaining a forward-thinking view today will allow them to make more informed decisions in the present and better position them tomorrow to guide policy and shape strategy in a constantly changing world.
In this article, we present a preview of the upcoming Summer issue of HORIZON that will present the results of a joint project between TxDOT and the University of Houston Futures Studies program to develop knowledge-based future scenarios that could impact transportation. By studying these scenarios, TxDOT and others in the transportation community can build a clearer picture of the emerging environment and enhance our ability to prepare for the complexity of the future as it unfolds.
HORIZON Editor

HORIZON Spring 2008
transportation organizations throughout the country. A technology forecasting company surveyed transportation industry stakeholders about the timeframe for hybrid vehicles to make an impact on the car market. Many experts have circled the year 2013 for when hybrids should achieve a major market share of 30 percent. While such projections are not an exact science, they are based on trends and sound projections from credible professionals.
This type of projection is helpful to TxDOT in planning for the future because most of its operating dollars come from the gas tax. Better gas mileage can mean overall lower fuel revenues even when factoring in more drivers. And while vehicle improvements are great for the economy and the environment, lower gas tax revenues mean Texas will need to be ready to finance its transportation needs from other sources.
For the Scenarios Project, the team added transportation as the seventh major issue. To gather data on transportation trends, the team talked to stakeholders around the state from various interest groups such as rail, aviation, environmental, legislative, and finance.
The next step was to formulate potential scenarios of what the future might look like in Texas. Those seven scenarios are grouped in three categories of traff ic congestion, economic development, and shifting transportation experiences which anticipates major changes in the transportation industry.
For example, a brief overview of a scenario
Texas should begin to prepare for the future. Those types of discussions could be done in workgroups with various transportation stakeholders, including legislators, regional mobility authorities and interested citizens around the state.
“Depa r tments of t ranspor tat ion have always been long-term thinkers because of the extended periods of time massive transportation infrastructure improvements take to build and finance,” said Dr. Peter Bishop, chair of the University of Houston’s Studies of the Future graduate program. “This project will help TxDOT think critically about many scenarios that could be true in the future and become more flexible in addressing those possibilities. TxDOT will also need to take a leadership role in working with the public on why long-term decisions are so important.”
Communication is a key objective of this effort. The idea is to get policy makers and citizens around the state thinking about the long term. Trying to anticipate how the future might look could help decision makers as they develop both short- and long-term solutions.
“It’s no secret that we’re facing some tough decisions on our transportation system for the future,” Hagquist concluded. “But we need to maintain our focus on the long term. Solutions for key infrastructure of this magnitude do not happen overnight. It’s important that the decisions we make in the near term are clearly going to address our long-term needs. We think the Scenarios Project will help bring that type of forward thinking to Texas’ transportation issues.”
6463
in the economic development category follows:
scenario: an energy constrained world Attitudes and lifestyles have been transformed by the high costs of energy resulting from the peaking of global oil production driven by high global demand. The transportation industry changes slowly until a disaster in the Middle East results in a month without oil. The United States responds with a massive investment program that accelerates the auto industry’s movement beyond oil and the combustion engine. The transportation industry and mobility patterns are changed forever.
Potential Implications for TxDOT
Faster than anticipated decline in fuel taxes leads to new funding strategies
Sharp drop in vehicle miles traveled and congestion until a new fleet is deployed
Shorter and less frequent commutes; higher demand for mass transit solutions or ride- sharing services
“We don’t expect any of the seven scenarios to come true, but probably parts of each will happen in some combination,” Hagquist projected. “If we are proficient at planning for each scenario we should be ready for what the future actually does have in store for Texas transportation.”
The next step in the process is to begin analyzing the data and discussing how
•
•
•
Check out the April 25 podcast interview with Dr. Bishop at www.KeepTexasMoving.com.
Submit article suggestions to John Sabala at [email protected] • (512) 416-2386.
submission guidelines for authorsHorizon is a journal of the Texas Department of Transportation, Government and Business Enterprises Division. It provides innovative and trend-setting articles about transportation policies in Texas and throughout the world. Research findings and policy issues are presented in accessible language to allow for discussion among policy-makers, professionals, and citizens.The journal seeks manuscripts, preferably original, (i.e., articles, commentary, and book reviews) which are timely in scope and relevant to transportation.
1. Submit manuscripts by email in MS Word format to the Editor at: [email protected]
2. Acceptance of manuscripts for publication is subject to approval by the editorial staff.3. The author must inform the editor if the article has appeared in, or was submitted
to, any other publications. The author must provide written approval from the publication in which his article appears. If the article was presented as a paper at a seminar or other event, please state the location, time, and event.
4. Sales presentations for organizations, promoting a particular product or service, are not suitable for publication.
5. The text of manuscripts is to be double-spaced and 12-point type. Articles are limited to a maximum length of 2000 words (approximately 5-6 pages); commentary and book reviews are limited to a maximum of 1000 words.
6. The manuscript should have a title page which includes the names, affiliations, addresses (mailing and email) and phone numbers of all authors. Brief biographical sketches for all authors should be included with the manuscript.
7. Include an abstract that briefly describes the contents, procedures, and results of the manuscript and does not exceed 100 words.
8. Endnotes are to be used rather than footnotes and placed at the end of the manuscript. Footnotes may be occasionally used within the document for clarification purposes, but not for citing references.
9. The Modern Language Association Style (MLA) is to be used for endnotes and references. At the end of the manuscript, complete references are listed alphabetically (not by number) by author surname, government agency, or association name.
10. Photo/Art Guidelines. • If you provide photos, please include caption, photographer’s credit, and written
permission from the photographer for each image. • If sending compressed files, please send as a self-extracting file (SEA). • All photos must be scanned or saved at 300 dpi or greater and sent separately
from the document. Please send photos in high resolution JPG, TIFF or GIF file formats.
65

Subscribe to receive free quarterly issues of HORIZON.
Full Name:__________________________________________________________
Title: ______________________________________________________________
Organization: _______________________________________________________
Type: Private Sector University Media
Government Other
Street Address: ______________________________________________________
City: _______________ State: _____ Zip: _________ Country: _____________
Phone Number: _____________________ Fax: ___________________________ E-mail Address: _____________________________________________________
Are you a TxDOT employee? ___________________________________________
How did you hear about HORIZON? ____________________________________
___________________________________________________________________
___________________________________________________________________
___________________________________________________________________
___________________________________________________________________
___________________________________________________________________
please fax to:
horizon subscriptions 512-416-2329
If you have any questions or need assistance, call 512-416-2382.
subscription form
66

Prepared by the Government & Public Affairs Division at the Texas Department of Transportation
125 East 11th Street, Austin, Texas 78701-2483 www.TxDOT.gov
Copies of this publication have been deposited with the Texas State Library in compliance with the State Depository requirements.
Spring 2008


![[XLS]ftp.dot.state.tx.usftp.dot.state.tx.us/pub/txdot-info/trf/crash_statistics/... · Web viewFranklin Gothic Book,Regular"Public 2010 and Greater Extract File Specification Page](https://img.dokumen.tips/doc/110x75/5b3226b47f8b9aa0238bebdf/xlsftpdotstatetxusftpdotstatetxuspubtxdot-infotrfcrashstatistics.jpg)