Embed Size (px)
Citation preview

NSSENational Survey of
Student Engagement
Engaged Learning:Fostering Success for All StudentsAnnual Report 2006

National Advisory Board
Douglas Bennett, Chair President, Earlham College
Molly BroadPresident, The University of North Carolina
Thomas Ehrlich, Vice Chair Senior Scholar, Carnegie Foundation for the Advancement of Teaching
Peter EwellVice President, National Center for Higher Education Management Systems
Muriel HowardPresident, Buffalo State College
Stanley IkenberryRegent Professor and President Emeritus, University of Illinois Urbana-Champaign
John ImmerwahrAssociate Vice President for Academic Affairs, Villanova University
Charlie NelmsVice President for Institutional Development and Student Affairs, Indiana University
Patrick TerenziniDistinguished Professor and Senior Scientist, Center for the Study of Higher Education, The Pennsylvania State University
Judith Torney-PurtaProfessor of Human Development, University of Maryland
William TysonPresident, Morrison and Tyson Communications
Ex-officio:John KennedyDirector, Center for Survey Research,Indiana University Bloomington
Kay McClenneyDirector, Community College Survey of Student Engagement, University of Texas at Austin
1 National Survey of Student Engagement | Annual Report 2006

Table of Contents
The National Survey of Student Engagement (NSSE) documents dimensions of quality in undergraduate education and provides information and assistance to colleges, universities, and other organizations to improve student learning. Its primary activity is annually surveying college students to assess the extent to which they engage in educational practices associated with high levels of learning and development.
Foreword
Director’s Message
Quick Facts
Selected Results
Non-Traditional Students
A Comprehensive Picture of Engagement
Connecting the Dots — Linking Engagement and Success
Using NSSE Data
NSSE Institute for Effective Educational Practice
Looking Ahead
Supporting Materials
Benchmarks of Effective Educational Practice
Participating Colleges and Universities
Staff
3
7
11
13
15
19
23
25
31
33
34
35
47
54
National Survey of Student Engagement | Annual Report 2006 2

Foreword
3 National Survey of Student Engagement | Annual Report 2006
professional, systematic approach to assessing quality. Accrediting bodies were increasingly urging a focus on outcomes rather than a focus on resources or reputation. But the available tools were far less satisfactory than they are today. Colleges and universi-ties seeking to assess whether students were learning had to use mostly home-grown measures, the results from which were diffi-cult to understand or compare with others.
The national policy environment in which NSSE has grown to maturity has been noisy, confused and often thoughtless. All at once, it seemed, there were calls from many quarters for higher education institutions to be more accountable. But accountable for what? Along with the rapidly rising tide of new requirements were calls that colleges and universities report data on a bewildering array of aspects of performance.
What was all but overlooked in this clamoring for more account-ability was the need for professional assessment of student learning.
In the spring of 2005, a blue-ribbon National Commission on Accountability in Higher Education (a project of the State Higher Education Executive Officers) produced “Accountability for Better Results: A National Imperative for Higher Education.” The report wisely concluded that “our current system of account-ability can be described as cumbersome, over-designed, confusing and inefficient. It overburdens policy makers with excessive, misleading data, and it overburdens institutions by requiring them to report it.” It called for a broad national dialogue to develop a better, leaner approach that would put “more emphasis on successful student learning and high quality research.”
Almost immediately after this report was issued, U.S. Secretary of Education Margaret Spellings appointed a National Commission
Accountability Sweeps NSSE to Center StageThe development of the National Survey of Student Engagement (NSSE) as a means for assessing quality in higher education has coincided with the emergence of accountability as the central issue in national higher education policy.
The 1999 grant from the Pew Charitable Trusts to Indiana University to develop what subsequently became NSSE was a remarkably prescient decision because it anticipated a public concern that we need to know much more about whether students at colleges and universities are actually learning. NSSE since has given shape to what was then an inchoate sense that we could and should know more.
This past year, more than one million college and university students at 557 four-year degree granting institutions in the U.S. and Canada were sent the NSSE survey. Many of these institu-tions have made NSSE a key component of their approach to assessing quality.
Seven years ago we were in a very different place. Many of these same colleges and universities knew they wanted a better, more
“NSSE is as good as it gets at the moment as a tool for examining institutional and student behaviors related to learning — practices that point directly to things that faculty and institutional leaders can do something about.”
— Peter T. Ewell, Vice President, National Center for Higher Education Management Systems

National Survey of Student Engagement | Annual Report 2006 4
on the Future of Higher Education. Its deliberations appeared to ignore the work of the National Commission on Accountability but, nevertheless, made accountability one of its key foci. It could have, but failed to sponsor the kind of broad, open national dialogue on accountability that the SHEEOs report had recommended.
Released in September 2006, The Spellings Commission report recommends that “Postsecondary institutions should measure and report meaningful student learning outcomes.” So far, so good. But the Spellings Commission has little else to say about what such assessments of student learning should look like, or how we will develop the valid, reliable instruments with which to assess learning outcomes.
In the midst of this cacophony in the national policy debate, the National Survey of Student Engagement emerged as a professional, best practice, widely adopted approach to assessing collegiate quality.
Three questions should be asked of any current or future approach to accountability focused on student learning and the conditions that foster student success:
1. Is it grounded in ongoing research on student learning?
2. Is it subject to continuing professional dialogue with others who conduct research on student learning?
3. Is it administered and governed in a manner that will insure an abiding focus on the highest quality assessmentof student learning?
The National Survey of Student Engagement meets all three of these tests.
• NSSE is grounded in a substantial body of research on student learning. Most of the questions on the instrument have been used for many years. Because of this rich foun-dation, we know what students mean when they answer questions as they do, and we know we can trust the results. NSSE continues to conduct research on student learning, further developing the instrument and exploring new approaches to assessment. Through this annual report and in other ways, we make publicly available a great deal of research information about NSSE.
• NSSE regularly discusses its findings with other professional researchers interested in questions of assessment and student learning, and NSSE regularly publishes research on student learning in professionally refereed journals on learning and higher education. In this regard, NSSE has benefited from a long-standing partnership with the Carnegie Foundation for the Advancement of Teaching.
• NSSE has well developed governance arrangements that place its direction in the hands of education professionals committed to the highest quality standards of learning assessment. Housed at the Indiana University Center for Postsecondary Research, NSSE reports to the dean of the University’s School of Education. The instrument is administered by the IU Center for Survey Research, and subject to scrutiny of the University’s human subjects review procedures. NSSE has a National Advisory Board of higher educational professionals drawn from across the United States.
Over the course of the next decade, it is almost certain that new, sophisticated instruments will be developed to assess student learning. Indeed, we should all hope to see such new instruments.
In the midst of this cacophony in the national policy debate, the National Survey of Student Engagement emerged as a professional, best practice, widely adopted approach to assessing collegiate quality.

5 National Survey of Student Engagement | Annual Report 2006
Foreword (continued)
Many of these may well assess different aspects of what students are learning across the broad spectrum of knowledge, skills, competencies, and sensibilities we expect of students in postsec-ondary education. Because colleges and universities have different missions, they do not all try to teach students the same thing. Thus, from among this emergent array of assessment measures, institutions will want to select assessment instruments most closely aligned with their missions to demonstrate the learning outcomes they value.
As these additional instruments are put into use, two other characteristics will continue to make NSSE especially valuable for colleges and universities to use, often in conjunction with measures designed to assess specific kinds of student learning.
Both strengthen NSSE’s value as an accountability measure. Both are grounded in NSSE’s focus on gathering information from students about how they are learning.
First, NSSE helps colleges and universities understand what they need to change in order to improve. An accountability process should not just ‘keep score,’ it should also help institutions improve. A college may learn that too many of its students are not achieving at the desired level in, for example, quantitative reasoning. Simply knowing this information is not likely to provide many clues about what to do next to improve. Because NSSE provides insight into how students are engaging in learning, it is likely to provide pointers to ways in which the college can enhance student performance.
Second, NSSE provides prospective students and their parents with information and insights that will help them find a college or university that is a good fit for them. An accountability process should be useful not just to government officials, but also (and especially) to students. Different students thrive in different environments. Simply knowing how well students learn on average at a particular university is unlikely to help a student know whether he or she will succeed there. NSSE can help a student understand how an institution educates to choose a college or university best suited to his or her style of learning. It is a corollary of this virtue that NSSE refuses to cooperate with anyone wanting to rank colleges and universities on a single dimension of quality.
“Everyone wants a tool that really works. NSSE results provide faculty and staff with information they can readily use to strengthen the learning environment.”
— David E. Shulenburger, Vice President for Academic Affairs, National Association of State Universities and Land-Grant Colleges
An accountability process should not just ‘keep score,’ it should also help institutions improve.

National Survey of Student Engagement | Annual Report 2006 6
From its inception, NSSE allowed every participating college or university to control its own data. In this annual report you will not find institution-specific findings, only aggregate results. We assist institutions in making their data public if they choose to do so, but that choice is theirs to make. In the context of a growing national focus on accountability, each college and university will have to wrestle with whether and how it makes publicly available its NSSE data, or any data it collects for accountability purposes.
On behalf of NSSE’s National Advisory Board, I want to thank the many people who had a role in NSSE’s rapid emergence as a premier approach to understanding and improving student learning, including the forward-thinking leaders of the hundreds of colleges and universities that have used NSSE thus far. I especially want to thank the Pew Charitable Trusts for making possible the development of NSSE and Russ Edgerton, then at Pew Trusts and until last year the Chair of the NSSE National Advisory Board. Peter Ewell of NCHEMS chaired the original team that helped design what became NSSE and continues to contribute to its improvement. We are indebted to the many NSSE staff members who daily provide expertise, encouragement and good counsel to colleges and universities across the United States — and now even beyond. Finally, we thank George Kuh, NSSE’s founding director, whose leadership has been essential to all we have accomplished.
Douglas C. BennettPresident, Earlham CollegeChair, NSSE National Advisory Board
Simply knowing how well students learn on average at a particular university is unlikely to help a student know whether he or she will succeed there.
“NSSE has changed the national conversation about quality in undergraduate education, providing a rich model for institutional change and improvement.”
— Joni Finney, Vice President, National Center for Public Policy in Higher Education

Director’s Message
It’s finally happened — near-consensus that colleges and universities must be more transparent about what they do and what happens to their students. A confluence of factors brought us to this point. Among the more pressing are signs that the quality of postsec-ondary education in the U.S. is slipping relative to some other countries, that too many students who start college fail to earn a baccalaureate degree, that what most students learn during college may not be adequate for the demands of the 21st century, and that too little meaningful information is available to prospective students to make informed decisions about which college to attend.
According to some observers, a major step toward addressing these troubles is to administer standardized tests to measure the impact of college on students. The idea is if we had valid and reliable instruments that measured the range of important outcomes of college, we could then estimate how much students gain in skills and competencies since staring college. This would make it possible to compare and judge the relative effectiveness of various colleges and universities, which in turn would inspire faculty and administrators to change what they do to get better. Prospective students and others would use this information to decide where to attend, and employers would have assurances that graduates are well prepared.
Beyond calling for more and better outcome measures, most major higher education organizations and public policy groups so far have paid very little attention to two related matters that are every bit as important as knowing how much students learn during college. The first is deciding what should be measured. That is, given current and near-future challenges, what are the skills, competencies and knowledge that college graduates need for the 21st century?
Engagement: The Bridge from Here to There
As the adage goes, we value what we measure. That is, we usually refer to the data we have, which for better or worse become the measures by which our performance is judged. The demand for evidence will only intensify in a climate clamoring for information about institutional performance. Thus, we need to determine carefully what we are trying to accomplish and whether the curriculum and other learning opportunities are organized to induce students to acquire the skills, competencies, knowledge, and sensibilities needed today and in the future to make a living and live a satisfying civically responsible life. Only then can we select outcomes measures that are geared toward what we are trying to achieve with our academic programs. In this regard, the Association of American Colleges and Universities (AAC&U) has done a great service by putting forth a well-reasoned conception of essential learning outcomes for college graduates as the first step in its ten-year “Liberal Education and America’s Promise” (LEAP) initiative.
The second point about which too little has been said is how to get from here to there. If the quality of the undergraduate experience is not what it needs to be, and if institutions must do different things or things differently for students to obtain the tools demanded by the 21st century, what must institutions do to improve their performance and enhance student learning? Certainly this was on the mind of the National Commission on the Future of Higher Education when it urged “postsecondary institutions to make a commitment to embrace new pedagogies, curricula, and technologies to improve student learning” (pp. 7-8). Beyond this, the Commission said very little about getting better, except to assert that institutions embrace the notion of continuous improvement and FIPSE disseminate promising practices in teaching and learning. Generally in tune with the
7 National Survey of Student Engagement | Annual Report 2006
“NSSE data inform planning and decision making, provide a comprehensive snap-shot of the quality of the undergraduate experience, and encourage institutions to adopt best models and practices.”
— James A. Anderson, Vice President and Associate Provost, University at Albany

National Survey of Student Engagement | Annual Report 2006 8
Commission’s report, the Educational Testing Service in Culture of Evidence said “the key to improving performance is measuring performance” (p. 1), and recommended adoption of “a common framework and set of measures” (p. 23) in order to compare colleges and universities.
Linking Processes to Outcomes
The Voluntary Accountability System prepared by NASULGC and AASCU directly addresses the improvement imperative: “Because improving student learning is our primary goal, universities must be accountable… Faculty and staff need feed-back about student engagement and their success in educating students” (p. 6).
NASULGC and like-minded thinkers have it right. Outcomes measures in the form of test scores alone cannot help us catch up. As one wag trenchantly observed, if testing was the answer to improving the quality of education, America’s K-12 schools would be the envy of the world. In this sense, testing is akin to racing a car. While racing establishes one’s position in the pack, knowing this doesn’t necessarily provide clues for what to do to make the car go faster the next time. To perform better requires careful review of a host of factors, many of which are evident long before a race begins, such as how the car is built or set up, the race track layout and conditions, the preparation of the driver and racing team, and so forth.
This is why Baldrige National Quality Award Criteria for iden-tifying high performing organizations explicitly link processes with outputs. As Doug Bennett said in the Foreword, without information about the processes that produced the outcomes, it is difficult to know where changes to a system are needed to increase quality and efficiency. It is the same with assessing and improving the quality of undergraduate education. To improve student learning, we need to know how students spend their time, what a college or university is trying to accomplish, and what the institution actually emphasizes with their educational programs in order to connect student test results to the teaching and learning activities associated with the scores.
Make no mistake, we absolutely need more and better measures of what students know and can do, especially assessments that determine the extent to which students are acquiring the skills and competencies that are relevant to the changing demands and challenges of the workplace, family and civic life. At the same time, outcomes testing has limitations that must be taken into account to use their results responsibly.
For example, the preferred approach to determine what and how learning occurs during college is to test students before they start classes their first year and then test students again just before they graduate. Such longitudinal analyses are relatively rare, because they are time-consuming and costly. In the absence of longitudinal data, statistical models such as regression are sometimes used to estimate what a student learns or gains. These approaches take into account students’ background characteristics and institu-tional factors and employ some sort of pre-test or performance proxy such as the SAT to produce an “expected” score. The expected score is then subtracted from a student’s actual score on the second test, producing a residual or difference between the expected and actual score, which is a “value added” estimate — either positive or negative. In the former case, the institution is credited with improving a student’s performance beyond what is expected; in the latter instance, the student falls short of what should have happened with the implication being that the college also is underperforming.
Both approaches are appealing in the current environment, but as Leonard Baird cautioned, they are also fraught with measurement problems that make it difficult to interpret the results or discern their implications for policy and practice. Two limitations of the
Outcomes measures in the form of test scores alone cannot help us catch up.

residual approach are especially problematic when comparing institutional performance. The first problem is the amount of error (or inaccuracy) associated with a test score due to such vagaries as the testing situation, student frame of mind, and a host of other factors. This means there is a certain amount of unknown error in the test result because a student’s “true” score may vary from one day to the next. The second problem comes into play when individual student results are aggregated to create an institution-level “score.” The amount of error in student scores compounds and introduces additional error into the results, which makes meaningful interpretations difficult.
These are not merely hypothetical musings. NSSE experimented with its version of a value-added model to calculate predicted institution-level scores for its five benchmarks of effective educational practice. After a thorough review of several years of results and consultation with experts, we no longer provide this information because it can be potentially misleading when used to distinguish among institutions. These results are consistent with the conclusion of Pascarella and Terenzini that differ-ences between types of institutions (public versus private or big versus small) are small and inconsistent. In due course, we will learn more from experts about these and other issues related to estimating change or gains in student learning in college, and whether these limitations can be adequately resolved to produce valid and reliable value-added estimates. In any event, test scores alone cannot identify the institutional policies and teaching and learning practices that may require attention to help students learn more and progress toward graduation.
The Engagement Premise and Promise Revisited
For years, researchers have pointed to involvement in educationallypurposeful activities as the gateway to desired outcomes of college. Students who engage more frequently in educationally effective practices get better grades, are more satisfied, and are more likely to persist. Two decades ago, this literature prompted Chickering, Gamson, and their colleagues to compile a list of “Seven Principles for Good Practice in Undergraduate Education,” which are reflected in many NSSE survey items. Recent findings from independent studies have corroborated
the relationships between engagement and indicators of student success in college such as grades and persistence with under-graduates in different types of institutional settings. These studies also show that while engagement is positively linked to desired outcomes for all types of students, historically underserved students tend to benefit more than majority students. Later in this report we present in more detail results that demonstrate these compensatory effects of engagement, or how using effectiveeducational practices can help enhance the performance of certain groups of students.
Recognizing the power of engaged learning, AAC&U’s LEAP project is focusing on “high impact practices” — activities that make a claim on student time and energy in ways that deepen learning and change the way students think and act. NSSE collects information about many of these activities, such as learning communities. In our 2004 Research in Higher Education article, Chun-Mei Zhao and I reported about the powerful effects of participating in learning communities which NSSE defines as “some formal program where groups of students take two or more classes together.” Of course, there are many different kinds of learning communities and — format notwithstanding — some surely are implemented better than others. Even so, the results were striking in that the 20,000+ students who reported having a learning community experience were substantially more engaged across the board in educationally effective activities compared to their counterparts who had not been part of such an activity. They interacted more with faculty and diverse peers, studied more, and engaged more frequently in higher order mental activities such as synthesizing material and analyzing problems. They also reported gaining more from their college experience. Moreover, the differences favoring learning community students persisted through the senior year, suggesting that this high impact practice — which most students have in their first college year — continued to positively affect what students did later in college.
Participating in high impact activities like learning communities and others that AAC&U will describe sets students on a trajectory of achievement that benefits them both in college and beyond. By the very act of being engaged — something not represented
9 National Survey of Student Engagement | Annual Report 2006
Director’s Message (continued)
“Our NSSE results have provided us with a very meaningful framework for organizing our data and assessing our ongoing progress for our accreditation self study.”
— Mary J. Meehan, President, Alverno College
By the very act of being engaged — something not represented in outcomes measures — students develop habits of the mind and heart that promise to stand them in good stead for a lifetime of continuous learning.

National Survey of Student Engagement | Annual Report 2006 10
in outcomes measures — students develop habits of the mind and heart that promise to stand them in good stead for a life-time of continuous learning. In his wonderful article, “Making Differences: A Table of Learning,” Lee Shulman observed that “learning begins with student engagement, which in turn leads to knowledge and understanding…” He described NSSE as “a proxy for learning, understanding, and postgraduation commitments that we cannot measure very well directly, or that we would have to wait 20 years to measure.” Lee ultimately concluded that “engagement is not solely a proxy; it can also be an end in itself…a fundamental purpose of education.”
Apparently many others agree with Shulman’s view, as more than 1,000 colleges and universities in the U.S and Canada have used NSSE to evaluate the quality of the undergraduate experience; several hundred two-year colleges have used the Community College Survey of Student Engagement. The Educational Testing Service, NASULGC, and other groups recommend NSSE or some other engagement measure be part of an institutional account-ability program.
There are many details to be worked out in order to develop the kind of public reporting templates called for by the National Commission to make transparent various aspects of student and institutional performance. In the meantime, student engagement results can help document whether students find their academic work challenging, the degree to which they are active learners, how often they interact in meaningful ways with their teachers and diverse peers, the richness of their out-of-class experiences, the nature of the campus environment, and the range and educational impact of technology uses. NSSE is not a perfect instrument, and there is obviously more to a high quality undergraduate experience than student engagement. In combination with student outcomes measures appropriate to an institution’s mission and curricular emphases, student engagement data reveal the means and methods that can improve many dimensions of student success and institutional performance.
NSSE 2006
I now invite you to review some of the highlights from the 2006 NSSE program. This is the seventh such report exploring the relationships between effective educational practice and selected aspects of student success in college. This year’s results are based
on 131,256 first-year and 128,727 senior students randomly sampled from 523 four-year colleges and universities in the U.S. Another 34 universities in Canada also participated this year. In addition to summarizing activities and experiences measured by the core survey, we also report results from experimental items added to the web version. Look at, for example, the findings for distance education and adult learners. It may surprise some to learn these students are at least as engaged if not more so in many educationally purposeful activities.
Finally, as with previous reports, we offer examples of how a variety of institutions are using their NSSE data and summarize ongoing and new efforts undertaken by the NSSE Institute. An increasing number of colleges and universities are converting their student engagement results into action. More than twice as many schools this year compared with previous years sent us detailed examples about how they are using their NSSE results and other information about the student experience and instructional practices to improve their undergraduate programs.
The NSSE project and its siblings — BCSSE and FSSE — along with this annual report are very much a team effort. Those who lent a hand in one aspect or another of the enterprise are listed on the back cover. I am privileged to be associated with them.
George D. KuhChancellor’s Professor and DirectorIndiana University Bloomington
... student engagement data reveal the means and methods that can improve many dimensions of student success and institutional performance.

Quick Facts
11 National Survey of Student Engagement | Annual Report 2006
Survey
The annual NSSE survey is supported by institutional participation fees. The survey is available in paper and Web versions and takes about 15 minutes to complete.
Objectives
Provide data to colleges and universities to use to improve under-graduate education, inform state accountability and accreditation efforts, and facilitate national and sector benchmarking efforts, among others.
Partners
Established in 2000 with a grant from The Pew Charitable Trusts. Support for research and development projects from Lumina Foundation for Education, the Center of Inquiry in the Liberal Arts at Wabash College, Teagle Foundation, and the National Postsecondary Education Cooperative.
Participating Colleges and Universities
More than 1,160,000 students at nearly 1,100 different four-year colleges and universities thus far. Participating NSSE institutions generally mirror the national distribution of the 2005 Basic Carnegie Classifications (Figure 1).
Administration
Indiana University Center for Postsecondary Research in cooperation with the Indiana University Center for Survey Research.
Validity & Reliability
The NSSE survey was designed by experts and extensively tested to ensure validity and reliability and to minimize nonresponse bias and mode effects. For more information visit the NSSE Web site at www.nsse.iub.edu/html/2006_inst_report.cfm.
Response Rates
The average institutional response rate is 39%. In 2006, the Web-only mode response rate (41%) exceeded that of the paper administration mode (37%).
Audiences
College and university administrators, faculty members, advisors, student life staff, students, governing boards, institutional researchers, higher education scholars, accreditors, government agencies, prospective students and their families, high school counselors.
Participation Agreement
Participating colleges and universities agree that NSSE will use the data in the aggregate for national and sector reporting purposes and other undergraduate improvement initiatives. Colleges and universities can use their own data for institutional purposes. Results specific to each college or university and identified as such will not be made public except by mutual agreement.
Figure 1: NSSE 2006 Participating Colleges and Universities
0%
5%
10%
15%
20%
25%
30%
NSSE 2006 National
DRU-VH DRU-H DRU Master’s-L Master’s-M Master’s-S Bac-AS Bac-Div
DRU-VH Research Universities (very high research activity)
DRU-H Research Universities (high research activity)
DRU Doctoral/Research Universities
Master’s-L Master’s Colleges and Universities (larger programs)
Master’s-M Master’s Colleges and Universities (medium programs)
Master’s-S Master’s Colleges and Universities (smaller programs)
Bac-AS Baccalaureate Colleges–Arts & Sciences
Bac-Div Baccalaureate Colleges–Diverse Fields
Carnegie 2005 Basic Classifications
www.carnegiefoundation.org/classifications/

National Survey of Student Engagement | Annual Report 2006 12
National Benchmarks of Effective Educational Practice■ Level of Academic Challenge
■ Active and Collaborative Learning
■ Student-Faculty Interaction
■ Enriching Educational Experiences
■ Supportive Campus Environment
www.nsse.iub.edu/pdf/nsse_benchmarks.pdf
Consortia & State or University Systems
Different groups of institutions (e.g., urban institutions, women’s colleges, research institutions, Christian colleges, engineering, independent colleges, and technical schools) and state and university systems (e.g., California State University, Georgia, Indiana, Kentucky, Massachusetts, North Carolina, South Dakota, Texas, Tennessee, and Wisconsin) ask additional mission-specific questions. Some groups make arrangements to share unidentified institution- specific student-level responses.
Data Sources
Randomly selected first-year and senior students from hundreds of four-year colleges and universities. Supplemented by other information such as institutional records, results from other surveys, and data from the Integrated Postsecondary Education Data System (IPEDS).
Cost
Institutions pay a minimum participation fee ranging from $1,800 to $7,800 determined by undergraduate enrollment.
Current Initiatives
The NSSE Institute for Effective Educational Practice partners with the Institute for Higher Education Policy and the Alliance for Equity in Higher Education on the “Building Engagement and Attainment of Minority Students” (BEAMS) project. Other ongoing collaborative work is with The Policy Center on the First Year of College “Foundations of Excellence” project, the Wabash College National Study of Liberal Arts Education, Penn State’s Spencer Foundation-funded “Parsing the First Year of College” project, and AAC&U’s “Bringing Theory to Practice” project.
Other Programs & Services
Beginning College Survey of Student Engagement, Faculty Survey of Student Engagement, Law School Survey of Student Engagement, NSSE Institute workshops, faculty and staff retreats, consulting, peer comparisons, norms data, and special analyses.

Selected Results
13 National Survey of Student Engagement | Annual Report 2006
In spring 2006, nearly 260,000 first year and seniors students attending 523 U.S. four-year colleges and universities reported their college activities and experiences to the National Survey of Student Engagement (NSSE). In this section of the report we present selected results from these 2006 data, starting with a handful of promising and disappointing findings (below). Table 1 on page 14 shows that gender differences do exist in some educationally purposeful activities. For example, among first-year students, women are more likely to do volunteer work and spend more time in academic preparation, while men are more likely to serve as tutors and to interact with faculty members outside of class. Table 2 on page 14 emphasizes that the engagement of students can differ depending on the type of institution they attend.
Pages 15-24 feature key findings in three areas. The first focuses on the engagement of non-traditional students, a growing segment of undergraduates who are older, working, enrolled part-time, or distance learners. Next, we paint a comprehensive picture of engagement by illustrating how NSSE data can be
Promising Findings■ Student engagement is positively related to first-year
and senior student grades and to persistence between the first and second year of college.
■ Student engagement has compensatory effects on grades and persistence of students from historically underserved backgrounds.
■ Compared with campus-based students, distance education learners reported higher levels of academic challenge, engaged more often in deep learning activities, and reported greater developmental gains from college.
■ Part-time working students reported grades comparable to other students and also perceived the campus to be as supportive of their academic and social needs as their non-working peers.
■ Four out of five beginning college students expected that reflective learning activities would be an important part of their first-year experience.
■ The NSSE instrument works equally well for students ofcolor and White students in different institutional contexts.
Disappointing Findings■ Students spend on average only about 13-14 hours
a week preparing for class, far below what faculty members say is necessary to do well in their classes.
■ Students study less during the first year of college than they expected to at the start of the academic year.
■ Women are less likely than men to interact with faculty members outside of class including doing research with a faculty member.
■ Distance education students are less involved in active and collaborative learning.
■ Adult learners were much less likely to have participated in such enriching educational activities as community service, foreign language study, a culminating senior experience, research with faculty, and co-curricular activities.
■ Compared with other students, part-time students who are working had less contact with faculty and participated less in active and collaborative learning activities and enriching educational experiences.
used in combination with two related survey instruments — the Beginning College Survey of Student Engagement (BCSSE) and the Faculty Survey of Student Engagement (FSSE). Finally, we report promising results from our “Connecting the Dots” study that examined the relationships between student engagement, grades, and persistence.
“NSSE provides some of the necessary evidence needed to document the quality of the educational experience. We constantly ask ourselves: Are we as good as we think we are? And if so, where is the evidence?”
— Ronald Crutcher, President, Wheaton College (MA)

National Survey of Student Engagement | Annual Report 2006 14
Female students more engaged Male students more engaged
Community service or volunteer work Tutored or taught other students
Hours per week preparing for classHours per week relaxing and socializing (watching TV, partying, etc.)
Hours per week providing care for dependents living with you (parents, children, spouse, etc.)
Hours per week participating in co-curricular activities
Worked harder than you thought you could to meet an instructor’s standards or expectations
Exercised or participated in physical fitness activities
Used e-mail to communicate with an instructor
Discussed ideas from your readings or classes with faculty members outside of class
Foreign language courseworkNumber of problem sets (problem-based homework assignments) that take less than an hour to complete
Prepared two or more drafts of a paper or assignment before turning it in
Worked with classmates outside of class to prepare class assignments
Attended an art exhibit, gallery, play, dance, or other theater performance
Worked with faculty members on activities other than coursework (committees, orientation, student life activities, etc.)
Table 1: First-Year Student Gender Differences
Female and Male Students Equally Engaged
Quality of academic advising
Community-based project (e.g., service learning) as part of a regular course
Hours per week working for pay on campus
Class presentations
Put together ideas or concepts from different courses when completing assignments or during class discussions
Used an electronic medium (listserv, chat group, Internet, instant messaging, etc.) to discuss or complete an assignment
Serious conversations with students who are very different from you in terms of their religious beliefs, political opinions, or personal values
Relationships with administrative personnel and offices
Activities Institutional Typeb
Hours per week participating in co-curricular activities
Bac-AS
Asked questions in class or contributed to class discussions
Bac-AS
Relationships with faculty members Bac-AS
Class presentations Master’s-M
Worked with other students on projects DURING CLASS
Master’s-L and Master’s-M
Number of problem sets (problem-based homework assignments) that take you LESS than an hour to complete
DRU
Practicum, internship, field experience, co-op experience, or clinical assignment
Bac-AS
Worked with classmates OUTSIDE OF CLASS to prepare class assignments
DRU-VH
Activities InstitutionalTypeb
Hours per week preparing for class DRU-VH and Bac-AS
Asked questions in class or contributed to class discussions
Bac-AS
Relationships with faculty members Bac-AS
Class presentationsMaster’s-S and Bac-Div
Gains since starting college speaking clearly and effectively
Master’s-S and Bac-Div
Participate in a learning community or other program where groups of students take two or more classes together
DRU-VH and DRU-H
Practicum, internship, field experience, co-op experience, or clinical assignment
DRU
a. For additional information on the multi-dimensional nature of student engagement by institutional type, consult the Benchmarks of Effective Educational Practice beginning on page 35.
b. See page 11 for a list of the Carnegie 2005 Basic Classifications.
First-year students are more engaged in selected activities at the following institutional types:
Senior students are more engaged in selected activities at the following institutional types:
Table 2: Institutional Strengthsa

Distance Education Students
The 2006 NSSE Web survey asked students to indicate if they were taking all their courses online during the current academic term. Almost 4,000 respondents from 367 different colleges and universities identified themselves as distance education learners — 1,279 first-year students and 2,615 seniors. The characteristics of distance education students differed from their counterparts in notable ways. For example:
• Seventy percent of distance education students were caring for dependents.
• Half of distance education students worked at jobs more than 30 hours per week (Figure 2).
• Half of distance education students were enrolled part-time compared with only 10% of other students.
• Distance education students were older on average: The median age of first-year distance learners was 25 and of seniors was 32. Their counterparts were 18 and 22 years, respectively.
• Sixty-three percent of distance education students were first generation compared with 42% of other students.
• Distance education students generally chose this format for reasons of convenience and being able to work at their own pace (Figure 3).
Engagement of distance education learners compared favorably to that of students taking classes on campus (Table 3). While distance education students are comparable to other students in terms of academic activities, they were much less likely to participate in active and collaborative learning activities. Even so, distance education students report greater educational gains and are more satisfied overall with their college experience. These mixed results illustrate that the educational and personal needs of distance education students may differ from those of other students.
Adult Learners
The number of adult learners enrolling in postsecondary educa-tion continues to increase due in part to the growing demand for a college degree in an increasingly complex, competitive, and rapidly changing global economy. About 5% of first-year students and more than one quarter (26%) of seniors responding to NSSE in 2006 were adult learners 25 years of age or older.
• Almost half (46%) were working more than 30 hours per week and about three fourths were caring for dependents.
• In contrast, only 3% of traditional-age students worked more than 30 hours per week; about four fifths said they spend no time caring for dependents.
Because they work more hours per week and often care for dependents, adult learners have many demands on their time in addition to their studies. What does this mean for the nature and quality of their educational experiences?
15 National Survey of Student Engagement | Annual Report 2006
0%
10%
20%
30%
40%
50%
60%
70%
80%
90%
100%
First-year Senior
5%
44%
15%
60%
Campus-Based Learners
Distance Ed. Learners
Figure 2: Percentage of Students Spending More than 30 Hours/Week Working for Pay Off Campus
Selected Results: Non-Traditional Students
Distance Education Students:■ Reported higher levels of academic challenge
■ Engaged more frequently in deep learning activities such as the reflective learning activities described later on p. 20.
■ Participated less in active and collaborative learning activities
■ Worked more hours off campus
■ Devoted more time to caring for dependents
■ Reported greater developmental gains
■ Were more satisfied overall with their educational experience

National Survey of Student Engagement | Annual Report 2006 16
Enrollment Patterns
• About half of first-year NSSE adult learner respondents and two fifths of seniors were enrolled part-time compared with only about 3% of traditional-age respondents.
• Although a minority of NSSE respondents, adult learners were overrepresented among undergraduates taking all their classes via distance education. That is, more than half of first-year and 70% of seniors who were taking their classes online were adult learners.
• Among all adult learners, 12% of first-year and 7% of seniors were taking all their classes online, compared with only 1% of traditional-age students.
• Adult learners were more likely to have started college at an institution different from the one they were currently attending: half (51%) of first-year and three quarters (78%) of senior adult learners compared with 7% and 25% of traditional-age students.
College Activities and Performance
• The grades of adult learners are stronger overall than those of traditional-age students, with about half of adult learners reporting “A-” or “A” grades compared with about two fifths of traditional-age students.
Table 3: Comparison of Distance Education and Campus-Based Learnersa
First-Year Senior
Benchmarks of Effective Educational PracticeLevel of academic challenge + +
Active & collaborative learning – –
Student-faculty interaction + =
Enriching educational experiences + =
Supportive campus environment = +Deep Learning (see Nelson Laird, Shoup, & Kuh, 2006)
Higher-order learning = +
Integrative learning = =
Reflective learning + +
Gains
Gains in practical competence + +
Gains in personal and social development + +
Gains in general education = +
Overall Satisfaction = +
+ indicates that distance education students reported significantly higher participation in these activities.
= indicates no statistical difference between distance and campus-based learners.
– indicates that distance education students reported significantly lower participation in these activities.
a. alpha = .01
0% 20% 40% 60% 80% 100%
Figure 3: Reasons for Taking Online Courses
More convenientfor my schedule
I can work at myown pace
I like to learnon my own
No colleges nearby have the courses I want
Online learners are morelikely to be my age
Less expensive than attending classes on-campus
Grading online is easier thanthat in the classroom 8%
21%
27%
34%
70%
77%
96%

17 National Survey of Student Engagement | Annual Report 2006
Selected Results: Non-Traditional Students (continued)
background characteristics, it is also not surprising that part-time working seniors are less likely to attend selective institutions.
As with adult learners, some research shows that part-time working students effectively use the limited amount of time they have to devote to their studies. NSSE data, however, suggest that part-time working students are less engaged in certain areas. For example, Figure 5 shows that part-time working seniors interact
Figure 4: Characteristics of Part-Time Working and Other Seniors
Working over20 hours
Caring forDependents
Age(over 30 years)
First GenerationStudent
Attending LessCompetitive Institution
84%
26%
66%
31%
57%
31%
11%
39%
Part-Time Working Seniors
Other Seniors
0%
25%
50%
75%
100%
19% 17%
• Adult learners and traditional-age students are similarly satisfied with their college experience, with 9 of 10 students in both groups rating it either “good” or “excellent.”
• About half of all adult learners (53% first year, 45% seniors) say they would “definitely” go to the same institution if starting over again.
• Adult learners were much less likely to have participated in such enriching educational activities as community service, foreign language study, a culminating senior experience, research with a faculty member, or extracurricular activities (Table 4).
• At the same time, adult learners are more engaged in class-room-based activities, as they are more likely to come to class prepared, to rewrite papers before submitting them, and to more frequently ask questions in class (Table 4).
Part-time and Working Students
The numbers of undergraduates who work and attend college part-time are on the rise (NCES, 1999-2000). How do work and part-time enrollment affect engagement and related experiences in college?
Only about 4% (4,367) of NSSE first-year respondents and 13% (15,183) of seniors were enrolled part-time. Of the part-time seniors who were working during the academic year, the large majority work over 20 hours/week (Figure 4). As expected, these students are older, spend more time caring for dependents, and are more likely to be first-generation students. Given their
Table 4: Participation of Adult Learners and Traditional-Age Seniors in Selected Activities
Adult Traditional
Community service or volunteer work 47% 69%
Foreign language study 29% 50%
Study abroad 7% 21%
Culminating senior experience 23% 42%
Research experience with faculty 12% 23%
Co-curricular activity 27% 69%
Asked questions in class or contributed to discussionsa 80% 72%
Prepared two or more paper drafts before submittinga 61% 40%
Came to class without completing assignmentsa 13% 24%
a. Represents combination of “often” and “very often” responses

National Survey of Student Engagement | Annual Report 2006 18
Figure 5: Median Benchmark Scores forPart-Time Working and Other Seniors
AcademicChallenge
Active andCollaborative
Learning
Student-FacultyInteraction
EnrichingEducationalExperiences
SupportiveCampus
Environment
Part-Time Working Seniors
Other Seniors
57
54
52
43
29
58
56
0
25
50
75
100
44
33
43
Figure 6: Selected Results for Seniors Who Are Part-Time and Working and Other Seniors
Earned ‘A’ Gradesa Prepared MultipleDrafts of Papersb
Preparedfor Classesb
Reported Examsto be HighlyChallengingb
Worked Harder ThanThought to Meet
Faculty Expectationsb
0%
25%
50%
75%
100%
Part-Time Working Seniors Other Seniors
46% 45%
58%
44%
86%
78%
57%52%
58% 58%
a. Percentages of seniors who reported A or A- grades b. Percentages of seniors who reported doing the activity “often” or “very often”
with faculty members less often and report fewer enriching educational experiences. They also score lower on the active and collaborative learning benchmark. The good news is that part-time working seniors perceive the campus to be as supportive of their academic and social needs as do other seniors. The patterns of results for first-year students are similar to those for seniors, but less pronounced.
At the same time, part-time working seniors devote as much effort to their courses as other seniors (Figure 6). For example, they prepare multiple drafts of papers more often and are more likely come to class with assignments completed. They also are on par with others in reporting that their exams were challenging and that they worked harder than they thought they could to meet faculty expectations. Their efforts earn them grades comparable to those of other seniors.

When used in concert with NSSE, the Beginning College Survey of Student Engagement (BCSSE) and the Faculty Survey of Student Engagement (FSSE) provide additional sources of information about students’ experiences and campus practices. BCSSE (pronounced ‘bessie’) collects information about entering first-year students’ high school academic and co-curricular involvement, as well as the importance that these students place on their participation in educationally purposeful activities during college. FSSE (pronounced ‘fessie’) measures faculty expectations of student engagement in educational practices that are empirically linked with high levels of learning and development. FSSE also collects information about how faculty members spend their time related to professorial activities and the kinds of learning experi-ences their institution emphasizes.
BCSSE and FSSE results can be used to identify areas of institutional strength as well as aspects of the undergraduate experience that may warrant attention. The information is intended to be a catalyst for productive discussions related to teaching, learning, and the quality of students’ educational experiences.
Here are two applications of how results from BCSSE, NSSE and FSSE can be used together to learn more about collegiate quality and identify areas where improvements can be made.
19 National Survey of Student Engagement | Annual Report 2006
Figure 7: Hours per Week Preparing for Class – Expectations and Reality
0
5
10
15
20
25
30
40
Hou
rs P
er W
eek
Institution A Institution B
29.4
16.7
14.3 14.7
26.8
23.4
15.0
19.8
Lower-Division Faculty Expectation of Students
Lower-Division Faculty Estimate of Student Actual
First-Year Student Expectation
First-Year Student Actual
Selected Results: A Comprehensive Picture of Engagement
Insights into the Study Time Conundrum
NSSE consistently finds that across institutions the average first-year student spends about 14 hours a week preparing for class. This number seems low, considering it encompasses all of the time a student is reading, preparing assignments, doing lab work, and rehearsing. FSSE data indicate that faculty members expect students to spend more than twice that amount preparing —

National Survey of Student Engagement | Annual Report 2006 20
Figure 8: Degree to Which Entering Students ViewReflective Learning Activities as Important
Examining strengthsand weaknesses
of own views
Understanding issuesfrom another’s view
or perspective
Learning somethingthat changes your
understanding
20% 19%15%
80% 81%85%
0%
25%
50%
75%
100%
Students Placing LowImportance on Activity(1-3 on 6 point scale)
Students Placing HighImportance on Activity(4-6 on 6 point scale)
“We have found NSSE data to be quite instructive both in terms of identifying students who are engaged and the opportunities for their engagement, as well as those who are disengaged and most likely not to be retained.” — Diane Lee, Vice Provost, University of Maryland
Baltimore County
about 6 hours per week for a single class or an estimated 24-30 hours a week for all classes. Moreover, BCSSE findings indicate that the average first-year student studies 2-6 hours less per week than they expected to study when they started college. For better or worse, while faculty have high expectations, their estimates of the time students actually spend per week preparing for class are very similar to student self-reported hours spent per week and occasionally a bit lower.
While there is a general pattern of faculty and student expectations being high and faculty estimates and students’ reports of actual time spent preparing for class being lower, different patterns can be observed from institution to institution. Figure 7 shows these numbers for two different institutions that participated in BCSSE, NSSE, and FSSE. At Institution A, faculty members teaching lower division courses say students should spend more than twice as many hours studying as they believe their students actually study. Students’ expectations are much lower than faculty expectations, but closely aligned with student actual time spent studying. At Institution B, the gap between faculty expectations and actual time spent studying is narrower, primarily because faculty expectations are lower. However, student expectations are closer to faculty expectations. And, while the gap between student expectations and student actual time spent preparing for class per week is higher, students at Institution B spend nearly 20 hours per week preparing for class.
Assuming the yawning gap between faculty expectations and reality is troublesome, Institution A can use these results to substantiate the problem and bring together groups of faculty, staff and students to decide what might be done. The results for Institution B can be used to stimulate discussions about whether the level of academic challenge is acceptable and, if not, what might be done to increase it.
Reflective Learning
Many colleges and universities attempt to create conditions that encourage “deep” learning, or activities that require students to focus not only on content but also the underlying meaning of information. Used together, BCSSE, NSSE, and FSSE can provide additional insight into certain deep learning behaviors, such as how students use higher-order or advanced thinking skills; how students integrate diverse ideas and perspectives into their learning, and how they reflect on their own learning and views.
When starting college, students indicate they value reflective learning and taking part in activities that may challenge and even change their views on issues (Figure 8). For example, four out of five students rate these activities as a highly important part (4 or higher on a 6-point scale) of their first-year experience. To what extent does this happen during the first year of college?
Students who placed a high value on reflective learning (4 or higher on a 6-point scale) were far more likely to engage in deep or reflective activities during their first-year of college (Figure 9, p. 21). For example, while more than half (54%) of those valuing reflective learning frequently examined the strengths and weak-nesses of their own views on a topic, only about a third of the students (31%) did so who at the beginning of college placed low importance on reflective learning activities.

While this pattern confirms that students act on their values, it is nonetheless troubling. How can the curriculum be arranged to induce students — even those less interested in reflective learning activities — to engage in these more meaningful thought processes? What role does the admissions process play in setting appropriate expectations for engaging in such meaningful learning activities? How might summer advising and orientation events and fall welcome week programs emphasize the importance of these behaviors?
As expected, FSSE data show that faculty place more importance on reflective learning than do students (Figure 9). What is troubling is the gap between faculty expectations and those of beginning college students who are minimally interested in reflec-tive learning. While nearly 9 of 10 faculty stress that challenging
21 National Survey of Student Engagement | Annual Report 2006
Selected Results: A Comprehensive Picture of Engagement (continued)
Students Placing High Importance on Activity WhoExperienced itFrequentlya
Students PlacingLow Importance on Activity WhoExperienced itFrequentlya
Percent LowerDivision Faculty Who View Activity as Important or Very Important
Figure 9: Relationship Between Students Value of and Experience in ReflectiveLearning Compared to Faculty Views on Such Activities
Examining strengthsand weaknesses
of own views
Understanding issuesfrom another’s view
or perspective
Learning somethingthat changes your
understanding
0%
25%
50%
75%
100%
54%
31%
67%62%
37%
65% 66%
46%
88%
a. “Frequently” is the percentage of those responding ‘often’ or ‘very often.’
or changing one’s understanding of issues is important, fewer than half of the students who place a lower value on reflective learning report engaging in these activities on a regular basis during their first year of college.
Discovering and discussing disconnects between student and faculty views on desired approaches to teaching and learning can help institutions understand where attention is needed to enhance the quality of the academic experience. The results could be used to identify students who might benefit from, for example, participating in learning communities which typically feature learner-centered engaging pedagogical activities. In addition,this knowledge can be used to challenge faculty to develop assign-ments that engage students more frequently in deep learning and related activities.
BCSSE-FSSE-NSSE Institutional Examples
With BCSSE still in the pilot stage, few institutions have had the opportunity to administer a combination of BCSSE, FSSE, and NSSE. However, several schools are in the process of putting their combined results to good use.
Brigham Young University (BYU) and Radford University are comparing students’ descriptions of their academic experiences (NSSE) with the expectations they described prior to starting classes (BCSSE). FSSE responses will make it possible to examine faculty perceptions alongside student experiences. BYU’s Faculty Center will report these findings during new faculty training and internal workshops.
“NSSE provides valuable comparisons across a variety of institutional settings, including unique aspects of student engagement such as developing a code of ethics or participating in spiritually enriching activities.”
— Harold V. Hartley III, Director of Research, Council of Independent Colleges

National Survey of Student Engagement | Annual Report 2006 22
Beginning College Survey of Student Engagement (BCSSE)
BCSSE Facts
■ Field tested in summers 2004, 2005, and 2006
■ 70 institutions participated in 2005-2006
■ First national administration in 2007-2008 academic year
■ Questionnaire administered locally via paper or online
BCSSE collects information about:
■ First-year students’ high school academic and co-curricular involvement
■ The degree of importance students place on participating in various educationally purposeful activities in college
For more additional and for more 2006 results visit BCSSE’s Web site: www.bcsse.iub.edu.
Faculty Survey of Student Engagement (FSSE)
FSSE Facts
■ First national administration: 2003
■ Administered online
■ Average institutional response rate: 50+%
■ 75,000 faculty responding from 380 different schools
■ 130 institutions participated in 2006
■ 21,000 faculty respondents in 2006
FSSE collects information about:
■ Classroom practices
■ Emphasis placed on various effective educational practices
■ Perceptions of student engagement and campus environment
■ The importance placed on various areas of student learning and development
For additional information and for more 2006 results visit FSSE’s Web site: www.fsse.iub.edu.
“We have found the NSSE a powerful tool in our work to increase student academic achievement and persistence.”
— Scott E. Evenbeck, Dean of University College, Indiana University-Purdue University Indianapolis
By triangulating data from BCSSE, NSSE and FSSE, the University of Maine at Farmington (UMF) established a baseline against which to assess the impact of its shift in 2006-07 from a three-credit to a four-credit model for full-semester courses. The results from the bundle of student engagement surveys will help UMF identify concerns that may emerge as they implement the four-credit model; administrators will assess the effectiveness of these efforts on the intended outcomes which are enhancing academic rigor, raising performance expectations, and involving students in more writing and research.
Illinois State University plans to draw on BCSSE, NSSE, and FSSE findings to guide campus conversations among current students, prospective students, faculty, student affairs personnel, and other key stakeholders about the differences between the nature of student engagement in high school and what is expected at the University. By integrating faculty perceptions of student engagement into the mix, the goal is to understand how engaged learning can be further enhanced through current campus initiatives, such as civic and political engagement, the first-year experience, general education outcomes, and partnerships for student learning. The combined data will also be used to assess the impact of these and related efforts to increase the quality of the undergraduate experience.

With generous support from Lumina Foundation for Education, NSSE collaborated with 19 partner institutions over the past two years to determine the relationships between student engagement, grades, and persistence. We also examined NSSE’s psychometric properties in the context of Minority-Serving Institutions (MSIs) and for underrepresented students at Predominantly White Institutions (PWIs). In addition, we conducted cognitive interviews and focus groups with students about the processes respondents use to answer survey questions, to identify potential problems that might lead to survey response error, and to gain a better sense of respondents’ understanding of items.
The findings from the Connecting the Dots project point to three conclusions.
1. Student engagement is positively related to first-year and senior student grades and to persistence between the first and second year of college at the same institu-tion. Consistent with the findings of many other studies over several decades, the positive effects of engagement persist even after controlling for a host of variables, such as pre-college achievement, financial aid, family income, enrollment status, living on campus, working off campus, and so forth. Equally important, the effects of engagement are generally in the same positive direction for students from different racial and ethnic backgrounds.
2. Engagement has a compensatory effect on first-year grades and persistence to the second year of college (Figures 10 and 11). That is, although exposure to effective educational practices generally benefits all students, the salutary effects are even greater for lower ability students as well as students of color compared with White students.
23 National Survey of Student Engagement | Annual Report 2006
Selected Results: Connecting the Dots — Linking Engagement and Success
Figure 10: Impact of Educationally Purposeful Activities on First Academic Year GPA by Pre-College Achievement Level
Educationally Purposeful Activities (standardized)
2.00
2.25
2.50
2.75
3.00
3.25
3.50
3.75
4.00
-2 -1 0 1 2
Firs
t-ye
ar G
PA
ACT 28
ACT 24
ACT 20
“We are using our NSSE results to help guide the development of a new five-year strategic plan which focuses on increasing student engagement in both curricular and co-curricular arenas.”
— T ori Haring-Smith, President, Washington and Jefferson College

National Survey of Student Engagement | Annual Report 2006 24
3. The NSSE instrument works equally well for students of color and White students in different institutional contexts, such as Predominantly White Institutions (PWIs), Historically Black Colleges and Universities (HBCUs), and Hispanic-Serving Institutions (HSIs). The results are highly stable for PWIs and moderately to highly stable for MSIs.
There are limits as to what colleges and universities can realistically do to help students overcome years of educational disadvantages. Even so, most institutions can foster greater levels of student engagement and success by more consistently using what this and other research show are promising policies and effective educational practices. While student engagement is not a silver bullet, finding ways to get students to take part in the right kinds of activities helps to level the playing field, especially for those from low-income family backgrounds and others who have been historically underserved, increasing the odds that they will complete their program of study and enjoy the intellectual and monetary gains associated with the completion of the baccalaureate degree.
More information about the Connecting the Dots project can be obtained at: www.nsse.iub.edu/pdf/Connecting_the_Dots_Report.pdf.
Figure 11: Impact of Educationally Purposeful Activities on the Probability of Returning for the Second Year of College by Race
Educationally Purposeful Activities (standardized)
Prob
abili
ty o
f Ret
urni
ng0.50
0.55
0.60
0.65
0.70
0.75
0.80
0.85
0.90
0.95
1.00
-2 -1 0 1 2
African American
White/Caucasian
“NSSE asks some simple yet vitally important, compelling questions: Are we challenging our students? Do we provide experiences inside and outside the class-room that contribute to their intellectual and personal development? How are we doing compared to our peers? Are we improving over time? How can we do better?”
— Alex McCormick, Senior Scholar, Carnegie Foundation for the Advancement of Teaching

NSSE is widely used in part because it provides information that faculty, staff and others can use almost immediately to improve the quality of the undergraduate experience. Institutions such as IUPUI and Coker College (see examples that follow) link students’ NSSE results with other institutional records such as transcripts and persistence behavior to better understand who is at risk and the effects of various programs and practices. This section offers a sampling of different applications and interven-tions based on engagement results.
Monitoring Curricular Changes
Indiana University Purdue University Indianapolis
IUPUI annually monitors trends over time and the impact of programmatic interventions by using NSSE one year and its own ongoing student survey the next. After finding few differences in first-year student persistence between those in “regular” learning communities (linked classes) and those enrolled in thematic learning communities (faculty work together across sections to infuse interdisciplinary learning), University College staff speculated that being part of a cohort experience is itself enough to enhance student persistence. This appears to be especially the case for students admitted conditionally. However, NSSE data show that students in the thematic learning communities are more engaged compared with other students.
Hanover College
Hanover College uses NSSE data to help gauge the effect of some of its academic program changes. In 2003, faculty and trustees endorsed sweeping changes to many aspects of the Hanover experience based on benchmarking, review of best practices, and self-examination. Many of the changes were introduced in Fall 2004, including a first-year experience, team-taught interdisci-plinary liberal arts degree requirements, and curricular revisions
25 National Survey of Student Engagement | Annual Report 2006
Using NSSE Data
to several popular majors. In addition, the college established an Early Alert Team to provide additional support to students encountering difficulty and expanded the Writing and Speaking Center into a one-stop, self-help Learning Center. NSSE data are augmented with results from internal surveys, focus groups and other measures to assess the impact of these modifications and their effects on specific areas of student performance, such as first-year student gains in writing clearly and speaking persuasively.
Improving Teaching and Learning
Truman State University
NSSE results are used in combination with faculty reflection, student dialogue, self-assessment, and other efforts to inform teaching and learning at Truman State. For example, student responses to NSSE over several years consistently indicated an excessive emphasis on memorization compared to peer institu-tions in the Council on Public Liberal Arts Colleges (COPLAC). This finding, combined with UCLA Higher Education Research Institute survey data indicating that faculty were increasingly relying on lecture in their courses, prompted the university to undertake a comprehensive review of classroom teaching methods and student learning strategies. All faculty members were asked, as part of their annual discipline-based action plans, to complete teaching method/learning strategy inventories. Academic units examined the extent to which their programs were incorporating the pedagogies of service-learning, study abroad, and internships. In addition, every unit reviewed how well their teaching methods promoted student learning in its five-year program review, a process that encourages reflection, self-assessment, and planning for improvement among faculty members. The Center for Teaching and Learning also coordinates programs to facilitate the adoption of engaged learning pedagogies.
California State University Chico
The provost at California State University Chico challenged each academic department to involve students in helping interpret the institution’s NSSE results. Four questions guided the review: (1) What student behavior should be changed, how might we change it, and how will you know if it does change? (2) What faculty behavior should be changed, how might we change it, and how will you know if it has changed? (3) Which of Chickering and Gamson’s Seven Principles of Good Practice in Undergraduate Education exemplify your department and what is the evidence this is so? (4) Which of the seven principles deserves greater attention? The Seven Principles of Good Practice were featured in this exercise because many of the NSSE items are based on
“NSSE results help us connect strategic planning initiatives with student learning outcomes and understand how we compare with peer institutions on these important measures.”
— Sally Mason, Provost, Purdue University

National Survey of Student Engagement | Annual Report 2006 26
these practices. The goals of this exercise were to learn about promising practices being used across the campus and to enhance engagement and rigor. NSSE data are also used in the institution’s overall assessment effort.
James Madison University
First-year students at James Madison University (JMU) were less involved in service learning than the institution desired, which prompted efforts to increase the number and quality of class presentations about service-learning. New faculty were encouraged to consider adapting their courses and teaching approaches to accommodate service learning opportunities. To encourage more interaction with faculty outside of class, modifications were made to advisor training. Also, NSSE data were shared with college deans who then worked with department heads to consider how to improve student-faculty interaction. Additional emphasis is placed on the importance of acquiring a broad general education during new advisor training and new student orientation. Finally, JMU developed a series of workshops and presentations to help faculty and staff better understand and implement effective educational practices throughout the campus.
Measuring Learning Outcomes
Ursinus College
In 2003, the Ursinus College Academic Council approved a set of outcomes for its core curriculum along with a plan for assessing each of the outcomes. In 2004, the emphasis was on communica-tion skills; in 2005, the focus was appreciation of diversity. Each academic department uses interviews with seniors and other data sources that the Committee for Outcomes Assessment chair inte-grates with NSSE data when appropriate. The Academic Council reviews this information and makes recommendations to the faculty. Also, NSSE benchmarks are tracked from year to year and annually reported to the faculty, which has helped the college more quickly come to consensus about areas that warrant attention.
Coker College
In an innovative approach to measuring value-added learning, the Coker College institutional research director coordinates faculty assessments of core general education skills (FACS) of analytical thinking, creative thinking, effective speaking, and effec-tive writing. Each course has rubrics to determine the levels of achievement for areas relevant to the course. Faculty rate student performance in these areas at the end of the term, with the ratings being independent of grades. As expected, students’ FACS scores increase from their first year to senior year. Individual
NSSE items related to general education outcomes positively correlate at modest levels with FACS scores, except for the item, “coming to class without completing assignments” which was negatively correlated. The NSSE self-reported gain item, “acquiring a broad general education,” correlated at .25 (p<.02) with FACS. Other relationships between FACS and NSSE items were generally in the expected direction, suggesting that engagement matters to desired learning outcomes.
Communicating Results On and Off Campus
Pace University
Pace University’s “Blueprint for Campus Accountability: Lessons from the Pace University Experience,” addresses the ways in which this large, multi-campus metropolitan university is assessing and improving student learning. For example, Pace admin-istrators presented NSSE data at a one-day faculty conference to identify additional ways student-faculty contact might be appro-priately increased. Results from NSSE, the Collegiate Learning Assessment, the Cooperative Institutional Research Project, and other information are used as evidence that Pace adds value to the student experience.

27 National Survey of Student Engagement | Annual Report 2006
Eastern Connecticut State University
The Planning and Institutional Research Office introduces NSSE results using PowerPoint presentations for senior staff, specific groups such as the First-Year Committee and the Assessment Committee, those responsible for implementing the new general education requirements, and the larger university community. Also reviewed are comparative data for consortium and Carnegie peers in order to help the institution establish priorities and develop a common language about engagement and student success.
Planning & Accountability
College of Saint Scholastica
The College of Saint Scholastica annually reviews and updates its strategic plan. One continuing goal is to achieve NSSE benchmark scores at or above the mean of the top half of all NSSE schools. Each academic and student services department examines the college’s NSSE results, tries to determine why it did or did not meet the goal in each area, and then develops departmental level goals to address any areas of concern. In addition, student engagement results are presented annually to the trustees at their February meeting along with steps the institution is taking to improve.
Edgewood College
Edgewood College uses NSSE benchmarks and individual items as “key indicators” for college wide planning. One of the latter indicators is the question of whether students would choose the same institution again. As a result of discussions by faculty, staff and students about the college’s effectiveness in engaging students, greater attention is being given to helping students develop meaningful relationships with one another, both inside and outside the classroom.
Campus Climate
Bennington College
Bennington distributed its NSSE results to senior staff, faculty, board of trustees, and students upon request. After celebrating Bennington’s strengths, its major challenge was identified — culti-vating a more supportive campus environment. The primary responsibility for addressing this issue was assigned to the academic dean and student life professionals who, in turn, invited front-line staff members to offer suggestions. One group attended a workshop on improving service to students by enacting the FISH! philosophy, which emphasizes play, positive attitudes, and attention to others’ needs. Bennington also made some changes to make physical spaces more inviting. For example, several wooden doors were replaced with glass panels, creating a welcoming sense of openness. The college also attempted to reduce the anxiety and frustration sometimes associated with class registration by giving out door prizes.
Florida A&M University
To foster more student-faculty contact, Florida A&M University (FAMU) is modifying its approach to academic advising by developing a student-status alert system, observing prerequisite requirements, creating an academic advisement database, and providing academic advising workshops for faculty advisers. FAMU will supplement NSSE data with student and faculty focus groups to further explore how to increase student-faculty interaction in meaningful ways. Academic departments will develop relevant strategies to increase student feedback as part of their departmental assessment plans. Administrative personnel and offices will also develop additional ways to increase student satisfaction with academic and support services.
Longitudinal Assessment
University of South Dakota
The University of South Dakota (USD) reviewed its NSSE findings from 2000, 2002, 2003, 2004, and 2006 to note trends over time. One result was the introduction of a first-year experience program made up of a seminar and residential learning communities. The university also restructured institutional graduation require-ments, requiring an additional course in English and more writing in capstone courses. The campus is also a “Foundations of Excellence for the First Year” program participant and is using NSSE as part of its efforts to improve retention and engagement.
College Misericordia
To help guide program planning and budget priorities, College Misericordia (CM) incorporates 12 NSSE-based measures in its
Using NSSE Data (continued)

National Survey of Student Engagement | Annual Report 2006 28
strategic indicators, such as improving the diversity of the educa-tional experience. CM tracks responses to all items over time to uncover any changing patterns with a particular eye toward unwelcome trends. Several years ago, after noting some slippage in satisfaction with academic advising, the vice president for academic affairs convened a series of meetings with division heads to emphasize the importance of academic advising by faculty. The numbers have since improved.
Student Persistence
University of Massachusetts Lowell
The University of Massachusetts Lowell is examining differences in NSSE responses of first-year students who persist and those who leave the subsequent spring. The pattern was the same for all five NSSE benchmarks: the scores of students who returned for the second year were higher than those of the other group. That is, persisters were more engaged in educationally purposeful activities. Because about half of Lowell’s students are commuters, infusing effective educational practices in the classroom is essential.
New Jersey City University
From its participation in the Building Engagement and Achievement of Minority Students (BEAMS) project, New Jersey City University discovered that its students were less engaged in course-related and co-curricular activities (e.g., clubs, research, cultural events) and were preoccupied with economic and family support issues. The university developed a comprehensive strategy to increase the engagement of entering students with a particular focus on racial and ethnic minority students in order to improve persis-tence and graduation rates. Among the planned interventions are a virtual academic resource center, a committee for cultural competencies development, faculty development activities sponsored by the University Center for Teaching and Learning, a faculty-driven early warning system for at-risk students, and addition of community service projects tied to the curriculum.
Linking NSSE to Other Data
University of Wisconsin-Stout
After reviewing students’ most and least frequently reported activities on NSSE, the university delved deeper into what makes for an engaged learning experience. During the spring 2006 semester, a team commissioned by the University’s Teaching and Learning Center (TLC) interviewed Stout students to develop a more contextualized understanding of student engagement. Six important themes emerged: relationships with faculty and staff, empowerment, application of course content, passion of instructor, being comfortable to ask questions in class, and
openness of the instructor to student participation. The most important factor was relationships with faculty and other students. As one student noted, “It starts with, again, that relationship. And that respect factor. I feel that I’m much more willing to dive head first into a class if I feel that respect from and to the instructor.” TLC also distilled a list of effective classroom practices from the interview data.
University of California, Merced
The University of California, Merced (UC Merced) welcomed its inaugural class in Fall 2005. From the start, the campus decided to use NSSE to benchmark its students’ academic and co-curricular experiences against campuses similar in mission and/or size. The first few years for a new institution are important as faculty and staff learn what works and what doesn’t in terms of promoting student success and the campus culture begins to take shape. To take full advantage of this unusual opportunity, the Institutional Planning and Student Affairs units are collaborating to present NSSE-based information sessions to various groups: admissions, registration, advising, student life, residential life, dining services, and counseling; faculty and academic administrators; and student leaders. The goal is to help identify ways to enhance student engagement and academic success. In addition to NSSE, other sources of information about the student experience (e.g., University of California Undergraduate Experience Survey; campus academic progress data) will be analyzed to inform decision making and improvement strategies, and used for accreditation studies.
Involving Students
North Carolina Central University
North Carolina Central University uses NSSE to compare its performance against other Historically Black Colleges and Universities (HBCUs) similarly classified by Carnegie in five main areas: academic advising, academic support, orientation and class level experience, diversity and multiculturalism, and culminating senior year experiences. Initiatives designed to increase student engagement include adding a career development component to academic advising and freshmen orientation programs, academic support services that feature experiential activities, diversity training for each class during the Fall and Spring semesters, and requiring a second semester senior year capstone course. Equally important, students are highly involved in planning these new initiatives. Another attempt to increase student engagement is appointing student leaders to every major and minor university committee for the first time in the 2006-2007 academic year.

29 National Survey of Student Engagement | Annual Report 2006
Using NSSE in Accreditation
What students get out of their education depends on what they put into it. For this reason, about one third of participating schools have incorporated their NSSE results in institutional self-studies and accreditation reports as evidence of collegiate quality and institutional effectiveness, to demonstrate improvements resulting from assessment, and to guide future institutional improvement initiatives.
Accrediting agencies are the primary external group with which schools share NSSE results. The Accreditation Toolkits, available from the NSSE Web site (www.nsse.iub.edu/institute/?view=tools/accred), are customized for each of the six regional accredita-tion bodies and provide suggestions for incorporating student engagement results into accreditation reviews with an emphasis on mapping results to the respective region’s standards. Specific applications vary — ranging from inclusion of NSSE results in self-studies to systematic incorporation of NSSE results into quality improvement plans.
The following brief examples illustrate how four institutions have used their NSSE results in the accreditation process.
Delta State University
The Delta State University Quality Enhancement Plan (QEP) for the Southern Association of Colleges and Schools (SACS) is based on the premise that engagement in educationally purposeful activities leads to enhanced student learning. As part of the plan, the University’s vision is “Delta State — an environment where you learn, discover, create, and grow in service to humanity.” To assess its educational effectiveness, Delta State established four goals: (1) foster student and faculty interaction; (2) increase use of information technologies; (3) emphasize practice of communication skills in all courses, and (4) encourage productive feedback and meaningful communication among students and faculty about student performance and career decisions. For example, to increase student-faculty interaction, the provost asked five faculty mentors from different schools to be Student Engagement Champions (SEC) to be responsible for identifying areas of need or opportunity for enhancing communication and interaction within learning environments. The SEC also created a series of campus-wide and college-by-college faculty development workshops to help create learning environments conducive to student-student and student-faculty interaction and to make their colleagues aware of NSSE’s five Benchmarks of Effective Educational Practice — the clusters of questions from the NSSE survey that capture many important student behaviors and institutional characteristics that contribute to learning and personal development. SEC mentors are also leading faculty development sessions to help instructors become more proficient with technology and Web-based communications.
University of Massachusetts Boston
As an urban, public university, UMass Boston’s mission is to provide a diverse population of citizens with access to a high quality education, quality research, and service responsive to urban needs. Many of its students are first-generation; the median age is 24, and many require financial aid to attend. In 2002-2003, a chancellor-appointed University Planning Council was charged with developing a five-year strategic plan as a frame-work to guide the University’s efforts to expand and enhance its dual mission of excellence in and access to postsecondary education. Focused on retention, research, and reputation, the plan is designed to be integrated with the campus’ New England Association of Schools and Colleges (NEASC) reaccreditation self-study process. Several self-study task forces used NSSE results from 2000, 2002 and 2004 to evaluate the University’s performance according to NEASC standards.
In response to NSSE results showing its students being less involved in campus life than comparison institutions, a vice chancellor for student life was appointed to increase student involvement on campus. As part of the self-appraisal for the Programs and Instructions, and Faculty, the university used NSSE results and its own Graduating Senior Survey (GSS) to monitor student satisfaction with their undergraduate experience.
Skidmore College
Skidmore College took advantage of its Middle States Association reaffirmation self-study to focus on student engagement. After reviewing its 2003 NSSE results and other information, the college decided to redouble efforts to increase student-faculty interaction and enhance the first-year experience by developing a new model for the first-year experience, strengthening its science programs; and emphasizing cultural diversity. Composed of faculty, key administrative personnel, and students, the Skidmore Middle States Steering Committee created three subcommittees to address each of the sub-topics within the main focus of student engagement. In addition, trustees and members of the campus and local communities were invited to respond to early drafts of the self-study document.
Using NSSE Data (continued)
“NSSE is used more widely today than ever as an effective way to assess what both institutions and students themselves do to foster student success.”
— Belle S. Wheelan, President, Southern Association of Colleges and Schools

National Survey of Student Engagement | Annual Report 2006 30
Clayton State University
Clayton State University developed its SACS Quality Enhancement Plan (QEP) in concert with its Academic Affairs strategic plan that called for improving student retention and success. Believing that “retention is a reflection of the overall quality of the institution’s services to students,” the SACS Steering Committee established by the provost decided to use these same themes as the core of its QEP. After campus-wide meetings with faculty, the focus of the QEP became improving student performance through increasing faculty and staff under-standing of effective educational practices. Subcommittees made up of administrators, faculty, staff, and students concentrated on four areas: data collection and analysis, student success and faculty engagement, intervention and faculty/staff involvement, and advisement and mentoring. The subcommittees gathered and analyzed data from multiple sources — including NSSE and FSSE, a survey on faculty interests and knowledge, an institu-tionally administered Student Satisfaction Questionnaire, and descriptive data on all students enrolled at Clayton.
Using information and advice from the subcommittees, the Steering Committee identified a list of “critical needs relevant to student engagement and success” which included recommendations for improving the class scheduling process and new student orientation, developing new programs for first-year students to foster persistence and student success, adopting more rigorous admissions standards, developing programs to promote faculty-student interaction outside of class, expanding academic support services, and using more effectively existing technologies and staff expertise in student advising.
Consortium Participation
From the beginning, NSSE encouraged participating colleges and universities to form consortia, which allows member schools to ask additional context- and mission-specific questions, to compare performance with peer institutions, and to share results. About 40 percent of participating schools take advantage of this opportunity each year, and since 2000 more than 550 different colleges and universities have joined 50 self-selected or system consortia representing a wide range of institution types. Some of these groups are based on long-standing affiliations, such as the Council for Public Liberal Arts Colleges (COPLAC), women’s colleges, engineering schools, or Catholic institutions, while others form as part of short-term grant projects focused on specific topics such as writing or technology use.
A COPLAC group forms periodically, asking questions about who students turn to for academic advising, preferred class schedule formats, and the degree to which library instruction
sessions have prepared students to conduct research. One annual consortium is composed of research universities. Under the auspices of the Association of American Universities Data Exchange (AAUDE), participating institutions have asked additional questions about performance expectations, course availability, and whether students get the “run-around” trying to get the information or approvals they need. In addition, some AAUDE institutions agree to student-level data-sharing to conduct additional analyses to support decision-making at their institutions. The AAUDE Web site features information about shared data, institutional examples of NSSE report formats and presentations, and illustrations of NSSE use in accreditation (see: www.colorado.edu/pba/surveys/nsse-aaude/index.htm).
Each year, urban universities ask additional questions about such matters as the importance of writing clearly and effectively, thinking critically and analytically, developing the ability to make informed decisions as a citizen, and acquiring job or work-related knowledge and skills. Urban consortium schools have also asked students about the relationships between work and family commitments and how their financial situation affects their ability to complete their studies as well as about the support they receive from close friends and family to succeed in college.
Other consortia form because of grant-funded research projects, such as AAC&U’s “Bringing Theory to Practice” group, funded by the Charles Engelhard Foundation to explore specific forms of engaged learning (including service-learning and community-directed collaborative research) and the effectiveness of campus plans to deter alcohol abuse and ameliorate depression of affected students. Another grant-related consortium is composed of liberal arts colleges funded by the Teagle Foundation which is investi-gating the impact of students’ writing experiences on such skills as creating an effective organizational framework for a paper, incorporating convincing evidence and support, and integrating multiple points of view. Other questions focused on the efficacy of certain practices, such as being required to revise papers multiple times, and the helpfulness of feedback on drafts from faculty and peers, writing labs instructors, and written comments by faculty members on their assignments.
These are but a few examples of how colleges and universities work together to increase the value of their NSSE participation by asking additional questions and sharing data. A complete list of consortia can be found at www.nsse.iub.edu/html/consortia.cfm.

The NSSE Institute for Effective Educational Practice was created in 2003 to respond to requests for assistance in using student engagement data to improve student learning and institutional effectiveness. NSSE Institute associates have completed a major national study of high performing colleges and universities, made dozens of presentations at national and regional meetings, worked with dozens of campuses to enhance student success, and sponsored five Regional NSSE Users Workshops.
Assistance to Institutions and Organizations
• Designed a day-long retreat with key administrators of a state university to identify institutional policies and practices that promote and inhibit student persistence and academic success.
• Reviewed student engagement data with small groups with faculty, administrators, and staff at a private liberal arts univer-sity to identify areas where the institution could profitably focus to improve student engagement.
• Conducted a workshop on effective educational practice to institutional teams assembled for a state system conference on student engagement.
• Facilitated a “back-to-school” faculty workshop for a regional public university aspiring to enhance student success by focusing on educational quality as measured by NSSE and to adapt lessons from the high-performing institutions featured in Student Success in College: Creating Conditions That Matter (Kuh, Kinzie, Schuh, Whitt & Associates, 2005).
• Advised a philanthropic organization on planning a symposium to examine the role of assessment and accountability for private colleges and universities.
• Helped design an invitational conference to examine the changing role of student affairs professionals in promoting student engagement.
• Worked with teams from dozens of colleges and universities that participated in several regional workshops (Texas, Illinois, Florida, Oklahoma) on using NSSE and FSSE results for accreditation and institutional improvement initiatives.
NSSE Users Share “Good Ideas” at Regional Workshops
The University of Central Oklahoma at Edmond sponsored the Fall 2005 Regional NSSE Users Workshop attended by about 80
31 National Survey of Student Engagement | Annual Report 2006
NSSE Institute for Effective Educational Practice
faculty and staff from 31 different colleges and universities. These workshops are designed to help institutional researchers, faculty, administrators, and staff to better understand and use their NSSE data and to gain ideas from colleagues at other institutions. The two-day events feature a combination of plenary sessions, concurrent interest sessions, group activities, and hands-on sessions through which participants learn more about linking NSSE data to other institutional data, using FSSE to understand faculty expectations for student engagement, and gaining knowledge about how understanding educationally effective practices contributes to student success. Workshop topics address how to use NSSE data for assessment, accreditation, self-studies, general educa-tion reviews, reviews of academic and student life programs, and faculty development initiatives.
“Good Ideas” generated from participants at a recent Regional NSSE Users Workshop:
Sharing NSSE Data with Administration
■ Don’t just send a report; discuss the results with deans.
■ Consider requiring deans and faculty to submit plans for enhancing student engagement.
■ Review multi-year comparisons in a retreat.
■ Involve students majoring in marketing to solicit student feedback about NSSE results.
■ Create colorful brochure with graphs and tables of data of interest to campus administrators.
■ Invite student affairs units to identify meaningful items for their own benchmarking activities.
Sharing NSSE Data with Faculty and Students
■ Form an “action team” of faculty and staff to help analyze results.
■ Host lunch to discuss findings with faculty.
■ Have Student Ambassadors visit first-year student classes and senior capstone courses to discuss the impact and importance of involvement in campus life.
■ Place articles in campus newspapers explaining the results.
■ Hold a college-wide symposium on student engagement, with discussion groups.
■ Conduct focus groups with students to understand survey results.
■ Place table tents with key NSSE findings in dining halls.

National Survey of Student Engagement | Annual Report 2006 32
“NSSE has been extremely helpful in identifying best practices to foster engagement in educational enriching experiences for our students.”
— Nuria M. Cuevas, Associate Vice President for Academic Affairs, Norfolk State University
• The fall 2006 Regional NSSE Users Workshop was held at Southern Connecticut State University with about 100 participants from 50 different colleges and universities.
• To view presentations from past workshops, visit the NSSE Institute Web site: www.nsse.iub.edu/institute.
Building Engagement and Attainment of Minority Students (BEAMS)
The BEAMS project is a multi-year initiative designed to facilitate data-informed campus change efforts and to increase student engagement and learning at Historically Black, Hispanic-serving, and Tribal colleges and universities. Currently in its fifth and final year, BEAMS involved about 23,000 students at more than 100 four-year institutions in the Alliance for Equity in Higher Education. Having administered NSSE at least once, these institu-tions are committed to implementing action plans to improve the quality of the undergraduate experience on their campus. They are using a second NSSE administration to measure the impact of their efforts. The work of several BEAMS schools is featured in this report — Florida A&M University, New Jersey City University, and North Carolina Central University.
For more information about BEAMS and the Alliance visit: www.msi-alliance.org.
Inventory for Student Engagement and Success (ISES)
The Documenting Effective Educational Practice project (DEEP) examined the everyday workings of 20 diverse educationally effective colleges and universities to learn what they do to promote student success. Major findings from the study are reported in Student Success in College (Kuh et al., 2005). The book illustrates many of the policies, practices, and cultural features common to these 20 institutions that work well together to promote student engagement and persistence.
In addition, a companion resource guide is available to help insti-tutions assess the extent to which their learning environments and campus culture support student success. Assessing Conditions to Enhance Educational Effectiveness (Kuh, Kinzie, Schuh, & Whitt, 2005) presents the Inventory for Student Engagement and Success (ISES), a self-guided, diagnostic framework based on the six properties and conditions common to high-performing schools and the five clusters of effective educational practices featured on NSSE.
DEEP Practice Briefs
Presidents, senior academic affairs and student affairs administrators, faculty members, and governing boards often have little time to read volumes of materials, even when they offer practical advice. For this reason, we prepared more than a dozen four-page documents for specific campus audiences that summarize key findings from the strong-performing colleges in Project DEEP. These short reports can be downloaded from the NSSE Web site: www.iub.nsse.edu.
Center of Inquiry in the Liberal Arts Projects Continue
NSSE continues its collaborations with the Center of Inquiry in the Liberal Arts (CILA) at Wabash College. First, thanks to CILA we were able to add six liberal arts colleges to the Connecting the Dots project to better understand the relationships between individual student engagement, grades, satisfaction, and persistence. CILA also supported the field test of The Beginning College Survey of Student Engagement (BCSSE). Finally, through a licensing agreement NSSE is being used in the Wabash National Study of Liberal Arts Education, a longitudinal project to assess liberal arts outcomes.
Teagle Foundation Grant to Evaluate Assessment Efforts
NSSE Institute staff are conducting an evaluation of Teagle Foundation assessment initiatives grants. These projects are designed to promote rigorous, systematic assessment of the quality of undergraduate education in the liberal arts, to encourage the use of existing assessment models and tools in liberal arts colleges, to develop additional approaches that are sensitive to educational processes valued in the liberal arts tradition, and to cultivate a culture of evidence on participating campuses.

The coming months promise many opportunities for NSSE and its partners to contribute to the higher education improvement and accountability agenda. For example, we intend to help insti-tutions experiment with appropriate ways to share their NSSE results publicly through the development of common templates schools can use to display their performance results. As Doug Bennett noted in the Foreword, a “one size fits all” set of indicators will not be sufficient, given the diversity of institutional missions and students, and the multiple, winding pathways undergraduates follow to a baccalaureate degree. Along with engagement and learning outcomes, other appropriate indicators of student success that might be featured in a performance template include:
• persistence and graduation rates
• student goal attainment
• course retention
• transfer rates and transfer success
• success in subsequent course work
• degree/certificate completion
• student satisfaction
• personal and professional development
• post-college endeavors including graduate school, employment, and orientation to lifelong learning.
We also plan to work more closely with and learn from institutions that are using student engagement data to improve teaching and learning. As George Kuh mentioned in his Director’s Message, this past year many more colleges and universities provided detailed descriptions of how they are using their NSSE results and the changes they are trying to make to foster engage-ment and enhance student development. As more schools begin to use their assessment results for improvement and account-ability, they will benefit from examples of how institutions have effectively converted data into action.
33 National Survey of Student Engagement | Annual Report 2006
After extensive field-testing, the Beginning College Survey of Student Engagement (BCSSE) will be available for use in the 2007-2008 academic year. As illustrated earlier, by linking BCSSE with results from NSSE and FSSE and other institutional data about the student experience, institutions will be able to more accurately estimate the impact of their programs and practices on student engagement and other desired outcomes of college.
Finally, as time and resources permit, NSSE will pursue additional validation studies, building on the findings from our “Connecting the Dots” research summarized earlier. We are involved presently in two such efforts, the Wabash National Study of Liberal Arts Education which is using NSSE as part of a battery of instruments and Penn State’s “Parsing the First Year of College” study funded by the Spencer Foundation.
As we prepare for the eighth annual survey cycle, we are more confident than ever that the seeds of innovation and improvement in undergraduate education are taking root and that student engagement data are essential to these efforts. We look forward to helping higher education meet the challenges and responsibilities of the accountability mandate with an eye toward fostering learning and success for all students.
Looking Ahead
“NSSE data have focused institutional responses to areas of concern for under-graduate education in ways that would not have been possible without these data.”
— John F. Schell, Vice Provost and Dean, University of Central Florida
... the seeds of innovation and improvement in undergraduate education are taking root and student engagement data are essential to these efforts.

Association of American Colleges and Universities (2006, June). College learning and America’s promise: Preparing ALL students for a new global century. Washington, DC.
Baird, L.L. (1988). Value added: Using student gains as yardsticks of learning. In C. Adelman (Ed.), Performance and judgment: Essays on principles and practice in assessment of college student learning (pp. 205-216). Washington, DC: U.S. Government Printing Office.
Cruce, T., Wolniak, G.C., Seifert, T.A., & Pascarella, E.T. (2006). Impacts of good practices on cognitive development, learning orientations, and graduate degree plans during the first year of college. Journal of College Student Development, 47, 365-383.
Chickering, A.W., & Gamson, Z.F. (1987). Seven principles for good practice in undergraduate education. AAHE Bulletin, 39, 3–7.
Dwyer, C.A., Millett, C.M., & Payne, D.G. (2006, June). A culture of evidence: Postsecondary assessment and learning outcomes. Princeton, NJ: Educational Testing Service.
Kuh, G.D., Kinzie, J., Cruce, T., Shoup, R., & Gonyea, R.M. (2006, July). Connecting the dots: Multifaceted analyses of the relationships between student engagement results from the NSSE and the institutional policies and conditions that foster student success. Final report to Lumina Foundation for Education. Bloomington, IN: Indiana University Center for Postsecondary Research.
Kuh, G. D., Kinzie, J., Schuh, J. H., & Whitt, E. J. (2005). Assessing conditions to enhance educational effectiveness: The inventory for student engagement and success. San Francisco: Jossey-Bass.
Kuh, G. D., Kinzie, J., Schuh, J. H.,Whitt, E. J. & Associates (2005). Student success in college: Creating conditions that matter. San Francisco: Jossey-Bass.
McPherson, P. & Shulenburger, D. (2006, August). Toward a public universities and colleges Voluntary System of Accountability for undergraduate education (VSA): A NASULGC and AASCU discussion draft. Washington, DC: NASULGC.
Nelson Laird, T. F., Shoup, R., & Kuh, G. D. (2006). Measuring deep approaches to learning using the National Survey of Student Engagement. Paper presented at the Annual Forum of the Association for Institutional Research, May, 2006, Chicago, IL (available on the NSSE web site at www.nsse.iub.edu/conferences/index.cfm).
Organisation for Economic Co-operation and Development (2006). Education at a glance: OECD indicators 2006. Paris: Author.
Pascarella, E.T. & Terenzini, P. T. (2005). How college affects students: A third decade of research. San Francisco: Jossey-Bass.
Richardson, J.T.E. & King, E (1998). Adult students in higher education: burden or boon? The Journal of Higher Education, 69(1), 65-88.
Shulman, L.S. (2002). Making differences: A table of learning. Change, 34(6), 36-44.
State Higher Education Executive Officers (2005). Accountability for better results — A national imperative for higher education. Denver, CO.
U.S. Department of Education (2006, September). A test of leadership: Charting the future of U.S. higher education. Washington, D.C.: Author.
U.S. Department of Education National Center for Education Statistics. (2002). Profile of undergraduates in U.S. postsecondary institutions: 1999–2000 (NCES Publication No. NCES 2002–168). Washington, DC: Author.
The 2006-7 Almanac (2006) [Electronic version]. The Chronicle of Higher Education, 53(1), 18. Retrieved August 23, 2006, from http://chronicle.com/weekly/almanac/2006/nation/0101802.htm.
For a list of research articles, conference presentations, and other works, see www.nsse.iub.edu/html/researchers.cfm.
Supporting Materials
National Survey of Student Engagement | Annual Report 2006 34

35 National Survey of Student Engagement | Annual Report 2006
To represent the multi-dimensional nature of student engagement at the national, sector, and institutional levels, NSSE developed five indicators or Benchmarks of Effective Educational Practice:
• Level of Academic Challenge
• Active and Collaborative Learning
• Student-Faculty Interaction
• Enriching Educational Experiences
• Supportive Campus Environment
Pages 37 through 46 show percentile and frequency distributions of student scores on these indicators within the 2005 Basic Carnegie Classification groups and all NSSE 2006 colleges and universi-ties.1 Also included are student distributions for schools that scored in the top 10% of all NSSE 2006 institutions.2 These data are based on the results from 2006 and reflect responses from 131,256 first-year and 128,727 senior students randomly sampled from 523 four-year colleges and universities in the U.S.
Student cases in the percentile and frequency tables are weighted within their institution by gender, enrollment status (full-time, less than full-time), and between institutions by undergraduate enrollment. To facilitate comparisons across time, as well as between individual institutions and types of institutions, each benchmark is expressed as a 100-point scale. For more details on the construction of the benchmarks, visit our Web site at www.nsse.iub.edu/html/2006_inst_report.cfm.
As in previous years, students attending smaller schools with a focus on arts and sciences have higher scores across the board on average. However, the variation of student scores within institu-tions is substantial. Some large institutions are more engaging than certain small colleges in a given area of effective educational practice. Thus, many institutions are an exception to the general principle that “smaller is better” in terms of student engagement. For this reason, it is prudent that anyone wishing to estimate collegiate quality ask for student engagement results or comparable data from the specific institution under consideration.
Revisions to NSSE Benchmarks
In 2004, response categories for the ‘Enriching’ items (question 7) were revised. As a result, student response patterns shifted and multi-year comparisons using these items require caution. Two benchmarks were affected: Enriching Educational Experiences and Student-Faculty Interaction. ‘Enriching’ benchmark scores in 2003 and earlier cannot be compared with 2004 or later. The Student-Faculty Interaction benchmark can be compared to the earlier years provided that the ‘research’ item is dropped. For this reason NSSE provided both forms of this variable in school data files. All 2006 NSSE schools that also participated in 2003 and earlier received a “benchmark recalculation report” that displayed their comparable benchmark scores through the years.
Although not directly comparable on a yearly basis, analyses of the results produced by the revised benchmark calculation process compared with the one used previously show that institutions’ scores are highly stable and that percentile rankings remain generally unchanged. NSSE continues to work with schools that have participated in multiple years to understand yearly comparisons based on the revised calculation process.
More information about the revisions in 2004, calculations for 2006, and descriptions of how to calculate the benchmarks at the student- level (current and past years), are posted on the NSSE Web site: www.nsse.iub.edu/html/2006_inst_report.cfm.
Benchmarks of Effective Educational Practice
DRU-VH Research Universities (very high research activity)
DRU-H Research Universities (high research activity)
DRU Doctoral/Research Universities
Master’s-L Master’s Colleges and Universities (larger programs)
Master’s-M Master’s Colleges and Universities (medium programs)
Master’s-S Master’s Colleges and Universities (smaller programs)
Bac-AS Baccalaureate Colleges–Arts & Sciences
Bac-Div Baccalaureate Colleges–Diverse Fields
Carnegie 2005 Basic Classifications
www.carnegiefoundation.org/classifications/

Guide to Benchmark Figures
The benchmark figures are a modified “box and whiskers” type of chart. Each column shows students’ scores within the distribution at the 95th, 75th, 50th (median), 25th, and 5th percentiles.3 The dot signifies the median — the middle score that divides all students’ scores into two equal halves. The rectangular box shows the 25th to 75th percentile range, the middle 50% of all scores. The “whiskers” on top and bottom are the 95th and 5th percentiles, showing a wide range of scores but excluding outliers.
This type of chart gives more information than a chart of simple point-estimates such as means or medians. One can see the range and variation of student scores in each category, and also where mid-range or normal scores fall. At the same time one can see what range of scores are needed (i.e., 75th or 95th percentile) to be a top performer in the group.
100
90
80
70
60
50
40
30
20
10
0
Benc
hmar
k Sc
ores
DRU-VH
95th Percentile
75th Percentile
25th Percentile
5th Percentile
50th Percentile(Median)
59
Guide to Benchmark Figures
Benchmark Frequency Tables
Following each set of percentile distributions is a table of frequencies based on data from 2006. These tables show the percentages of how students responded to the survey items that comprise the benchmark. The values listed are column percentages. Frequencies are shown by class standing for each of the 2005 Basic Carnegie Classification types and for the whole NSSE 2006 U.S. cohort. A weight was applied to adjust for non-response and to ensure that students from a single institution contribute to the figures in the same proportion as if every first-year and senior student from that institution responded to the survey.
In addition, a special column shows the response percentages of students attending schools that scored in the top 10% (52 schools) of all 2006 U.S. institutions on the benchmark. Thus, the pattern of responses among these institutions sets a high bar for schools aspiring to be among the top performers on a particular benchmark.
Notes
1 This is a departure from NSSE’s early years when the mean institution-level benchmarks were reported. Starting in 2005, NSSE reported student-level benchmarks for multi-institution groups to emphasize the variance and range among students attending different types of institutions. Thus, scores for multi-institution groups (Carnegie Classifications and NSSE 2006) represent the average student attending those types of institutions.
2 To derive the top 10% categories, institutions were sorted according to their precision-weighted scores. Precision-weighting adjusts less reliable scores toward the national mean.
3 A percentile is a score within a distribution below which a given percentage or scores is found. For example, the 75th percentile of a distribution of scores is the point below which 75 percent of the scores fall.
National Survey of Student Engagement | Annual Report 2006 36

Level of Academic Challenge
DRU-VH DRU-H DRU Master’s-L Master’s-M Master’s-S Bac-AS Bac-DIV Top 10% NSSE 2006
52 52 52 5254 5660
51 50 51
DRU-VH DRU-H DRU Master’s-L Master’s-M Master’s-S Bac-AS Bac-DIV Top 10% NSSE 2006
95th % 74 73 74 73 74 76 77 73 80 74
75th % 61 60 61 60 61 63 65 60 69 61
Median 52 51 52 50 52 54 56 51 60 52
25th % 44 42 43 41 43 44 47 41 52 43
5th % 32 30 30 29 29 31 34 29 40 30
DRU-VH DRU-H DRU Master’s-L Master’s-M Master’s-S Bac-AS Bac-DIV Top 10% NSSE 2006
55 56 56 5760
55 56 56
65
55
DRU-VH DRU-H DRU Master’s-L Master’s-M Master’s-S Bac-AS Bac-DIV Top 10% NSSE 2006
95th % 78 78 79 79 78 80 81 79 83 79
75th % 65 65 66 65 66 67 69 66 73 66
Median 55 55 56 55 56 57 60 56 65 56
25th % 46 45 46 46 47 48 51 46 56 46
5th % 32 32 32 32 33 33 37 33 43 32
Percentiles Seniors
Benchmark Scores Seniors
100
90
80
70
60
50
40
30
20
10
0
Benc
hmar
k Sc
ores
DRU-VH
95th Percentile
75th Percentile
25th Percentile
5th Percentile
50th Percentile(Median)
59
Guide to Benchmark Figures
First-Year Students
Seniors
Key
Challenging intellectual and creative work is central to student learning and collegiate quality. Colleges and univer-sities promote high levels of student achievement by setting high expectations for student performance.
Percentiles First-Year Students
Benchmark Scores First-Year Students
37 National Survey of Student Engagement | Annual Report 2006
Benchmarks of Effective Educational Practice (continued)

First-Year Students Seniors (in percentages) DRU-VH DRU-H DRU Master’s-L Master’s-M Master’s-S Bac-AS Bac-DIV Top 10% NSSE 2006
Number of assigned textbooks, books, or book-length packs of
course readings
None 0 1 1 1 1 1 1 1 1 1 1 1 0 1 1 1 0 0 1 1
Between 1 and 4 16 24 20 28 20 27 23 29 22 27 18 23 13 17 25 28 6 11 20 26
Between 5 and 10 45 40 44 40 41 37 44 39 42 39 39 38 34 33 42 38 24 27 43 39
Between 11 and 20 27 22 24 19 27 21 23 19 24 19 27 23 33 28 22 19 40 33 25 21
More than 20 12 13 10 12 12 14 10 12 11 13 14 15 19 21 10 12 29 29 11 13
Number of written papers or reports of 20 PAGES OR MORE
None 85 51 83 51 82 47 82 49 79 49 80 43 81 38 81 48 79 29 82 48
Between 1 and 4 12 41 13 42 13 43 13 42 14 43 15 49 15 54 14 42 18 60 13 43
Between 5 and 10 2 6 2 5 3 7 3 6 4 6 2 6 2 6 3 7 2 8 3 6
Between 11 and 20 1 1 1 1 1 2 1 2 1 1 2 2 1 1 1 2 1 1 1 1
More than 20 1 1 1 1 1 2 1 1 1 1 1 1 1 1 1 2 1 1 1 1
Number of written papers or reports BETWEEN 5 AND 19 PAGES
None 15 9 15 11 10 8 15 9 14 8 12 7 8 4 17 8 3 2 14 9
Between 1 and 4 52 43 54 47 51 40 54 45 53 45 50 39 47 34 54 45 38 27 53 44
Between 5 and 10 26 32 23 29 29 35 24 31 25 31 27 35 33 40 23 31 42 43 25 32
Between 11 and 20 6 12 6 10 8 12 6 11 6 11 8 14 11 17 5 11 15 21 7 11
More than 20 1 4 1 4 2 5 1 4 1 4 2 5 2 5 1 4 3 7 1 4
Number of written papers or reports of FEWER THAN 5 PAGES
None 3 6 3 7 3 7 4 8 3 6 2 6 2 5 4 8 1 4 3 7
Between 1 and 4 32 33 32 36 32 35 32 35 31 33 24 30 24 28 31 36 18 24 31 34
Between 5 and 10 35 29 33 26 34 27 34 27 34 28 33 28 35 30 32 28 33 31 34 28
Between 11 and 20 20 18 20 17 20 17 20 16 21 18 24 20 25 20 21 16 28 22 21 17
More than 20 10 13 11 15 11 15 10 14 11 15 16 16 15 16 11 13 19 19 11 14
Coursework emphasized: ANALYZING the basic elements of
an idea, experience, or theory, such as examining a particular case or
situation in depth and considering its components
Very little 2 2 3 2 3 2 3 2 2 2 2 1 1 1 3 2 1 1 2 2
Some 18 15 21 16 21 15 22 16 23 15 19 14 16 11 24 16 10 7 21 15
Quite a bit 46 44 46 42 44 43 46 44 45 45 46 43 44 41 46 43 42 36 45 44
Very much 34 40 31 40 33 40 29 39 30 39 33 41 38 47 28 39 48 56 32 40
Coursework emphasized: SYNTHESIZING and organizing ideas,
information, or experiences into new, more complex interpretations
and relationships
Very little 4 4 6 4 5 4 6 4 5 4 5 3 3 2 5 4 2 1 5 4
Some 29 25 31 25 30 23 32 24 30 23 28 21 25 18 34 24 18 12 30 24
Quite a bit 42 41 41 40 40 41 41 41 43 41 43 43 43 40 41 41 43 37 41 41
Very much 25 31 23 31 24 32 22 31 22 32 25 33 29 40 20 31 37 51 23 32
Coursework emphasized: MAKING JUDGMENTS about the value of information, arguments,
or methods, such as examining how others gathered and
interpreted data and assessing the soundness of their conclusions
Very little 6 6 7 6 5 5 6 6 6 5 5 4 4 4 7 5 3 3 6 5
Some 31 27 30 26 29 22 29 25 30 24 27 23 25 22 29 25 23 18 29 25
Quite a bit 41 39 41 39 41 40 41 40 42 40 43 41 43 40 41 40 42 39 42 40
Very much 22 29 22 29 25 32 23 30 22 31 25 32 27 34 22 30 32 40 23 30
Coursework emphasized: APPLYING theories or concepts to practical
problems or in new situations
Very little 4 4 4 3 4 3 5 3 4 3 4 3 3 3 5 3 3 2 4 3
Some 22 20 25 19 25 17 25 18 25 17 22 18 22 16 25 17 18 14 24 18
Quite a bit 41 36 39 36 40 38 41 38 41 38 41 38 41 37 41 38 40 35 41 37
Very much 34 41 32 42 31 42 29 40 29 42 32 42 34 45 29 42 39 50 31 42
Worked harder than you thought you could to meet an instructor's
standards or expectations
Never 11 9 9 7 8 6 8 6 8 6 7 5 8 6 7 5 7 5 9 7
Sometimes 41 40 41 37 39 34 40 36 40 37 38 36 39 37 40 35 36 34 40 37
Often 35 35 36 37 37 39 37 39 39 38 38 38 37 38 38 39 38 38 37 38
Very often 13 15 14 19 16 21 14 20 14 19 17 20 16 19 16 21 20 23 15 19
Hours per 7-day week spent preparing for class (studying,
reading, writing, doing homework or lab work,
analyzing data, rehearsing, and other academic activities)
0 0 0 0 0 0 0 0 0 0 0 1 0 0 0 0 0 0 0 0 0
1-5 13 15 17 19 20 20 21 20 20 19 18 18 13 13 20 20 6 7 18 18
6-10 23 25 27 26 29 28 31 28 27 27 26 27 24 23 29 27 17 19 27 26
11-15 22 20 21 19 21 20 20 20 21 20 22 19 21 21 20 19 23 21 21 20
16-20 18 16 16 15 14 14 14 14 15 15 16 15 18 18 14 15 22 21 16 15
21-25 11 10 9 9 8 8 7 8 8 8 9 10 12 12 8 9 15 14 9 9
26-30 6 6 5 5 3 4 4 5 4 5 4 5 6 7 4 5 9 9 5 5
More than 30 5 8 4 7 4 5 3 6 4 6 5 5 5 7 4 5 9 9 4 6
Institutional emphasis: Spending significant amounts
of time studying and on academic work
Very little 2 3 3 3 3 3 3 2 2 2 3 2 2 2 2 3 1 1 2 2
Some 18 20 21 20 23 21 21 20 19 19 20 19 15 14 18 18 10 9 19 19
Quite a bit 47 45 47 45 47 46 48 47 48 47 47 48 44 44 48 45 41 40 47 46
Very much 33 32 30 32 27 30 28 30 31 32 30 32 39 41 31 34 48 50 31 32
National Survey of Student Engagement | Annual Report 2006 38
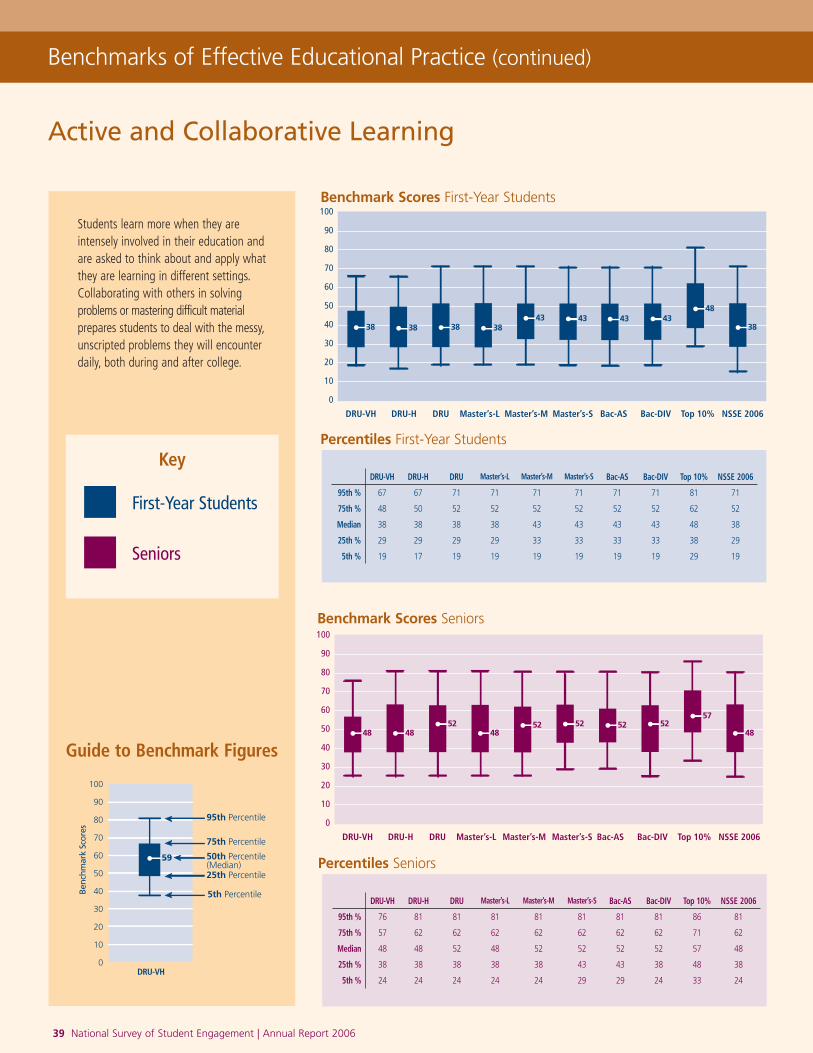
Active and Collaborative Learning
DRU-VH DRU-H DRU Master’s-L Master’s-M Master’s-S Bac-AS Bac-DIV Top 10% NSSE 2006
38 3843
3843 43 43
48
38 38
DRU-VH DRU-H DRU Master’s-L Master’s-M Master’s-S Bac-AS Bac-DIV Top 10% NSSE 2006
95th % 67 67 71 71 71 71 71 71 81 71
75th % 48 50 52 52 52 52 52 52 62 52
Median 38 38 38 38 43 43 43 43 48 38
25th % 29 29 29 29 33 33 33 33 38 29
5th % 19 17 19 19 19 19 19 19 29 19
DRU-VH DRU-H DRU Master’s-L Master’s-M Master’s-S Bac-AS Bac-DIV Top 10% NSSE 2006
4852 52 52 52
4852
48
57
48
DRU-VH DRU-H DRU Master’s-L Master’s-M Master’s-S Bac-AS Bac-DIV Top 10% NSSE 2006
95th % 76 81 81 81 81 81 81 81 86 81
75th % 57 62 62 62 62 62 62 62 71 62
Median 48 48 52 48 52 52 52 52 57 48
25th % 38 38 38 38 38 43 43 38 48 38
5th % 24 24 24 24 24 29 29 24 33 24
100
90
80
70
60
50
40
30
20
10
0
Benc
hmar
k Sc
ores
DRU-VH
95th Percentile
75th Percentile
25th Percentile
5th Percentile
50th Percentile(Median)
59
Guide to Benchmark Figures
First-Year Students
Seniors
Key
Percentiles Seniors
Benchmark Scores Seniors
Benchmarks of Effective Educational Practice (continued)
Percentiles First-Year Students
Benchmark Scores First-Year Students
Students learn more when they are intensely involved in their education and are asked to think about and apply what they are learning in different settings. Collaborating with others in solvingproblems or mastering difficult material prepares students to deal with the messy, unscripted problems they will encounter daily, both during and after college.
39 National Survey of Student Engagement | Annual Report 2006

First-Year Students Seniors (in percentages) DRU-VH DRU-H DRU Master’s-L Master’s-M Master’s-S Bac-AS Bac-DIV Top 10% NSSE 2006
Asked questions in class or contributed to class discussions
Never 5 3 5 3 3 2 3 2 3 1 2 1 2 1 2 1 1 1 3 2
Sometimes 45 36 44 31 35 25 37 26 36 23 32 20 30 19 33 20 25 18 38 27
Often 33 32 33 34 37 34 36 34 36 34 37 32 37 32 38 35 37 30 35 33
Very often 17 29 18 32 25 40 24 39 25 41 29 47 31 48 27 44 36 51 23 37
Made a class presentation
Never 20 6 21 7 14 4 14 5 12 4 10 3 12 3 12 4 4 1 16 5
Sometimes 58 45 54 38 51 31 52 30 51 30 51 28 57 33 52 30 44 20 53 34
Often 17 32 19 34 26 39 26 38 28 39 29 41 25 40 28 39 37 40 24 37
Very often 4 17 6 21 9 27 8 27 8 27 9 29 6 24 9 27 15 38 7 24
Worked with other students on projects DURING CLASS
Never 15 14 13 12 11 9 12 9 10 8 10 9 14 12 10 8 9 8 12 10
Sometimes 46 47 46 43 47 43 46 41 44 42 46 42 49 48 45 42 44 39 46 43
Often 30 26 31 30 31 31 33 33 34 33 33 34 29 28 34 34 34 33 32 31
Very often 9 13 10 15 10 17 10 17 12 17 11 16 8 12 11 16 13 20 10 15
Worked with classmates OUTSIDE OF CLASS to
prepare class assignments
Never 12 5 16 7 18 8 18 8 13 7 13 8 11 5 16 8 5 4 15 7
Sometimes 45 35 45 34 45 35 46 36 45 35 46 36 44 36 44 37 38 27 45 35
Often 30 33 28 33 26 33 26 34 31 35 30 35 32 38 29 34 39 37 29 34
Very often 13 27 12 27 10 24 10 22 11 23 10 21 12 22 11 21 19 33 11 24
Tutored or taught other students (paid or voluntary)
Never 49 42 49 41 54 44 54 45 54 43 54 44 51 36 52 40 44 32 52 43
Sometimes 36 37 35 37 32 35 32 34 33 35 32 34 34 36 33 37 37 38 33 36
Often 11 13 11 12 10 13 10 12 10 13 10 11 11 15 10 13 13 15 10 13
Very often 5 9 5 9 4 9 4 9 4 9 4 10 4 13 5 10 7 14 4 9
Participated in a community-based project (e.g., service learning) as
part of a regular course
Never 71 61 65 56 61 50 66 53 65 51 58 48 63 49 61 50 39 37 65 54
Sometimes 20 25 23 28 25 30 23 29 24 31 28 32 25 32 27 32 35 36 23 29
Often 7 9 9 10 10 12 8 11 8 12 10 12 9 12 9 12 17 17 8 11
Very often 3 5 3 6 4 8 3 6 3 6 4 7 3 7 3 6 8 11 3 6
Discussed ideas from your readings or classes with others
outside of class (students, family members, co-workers, etc.)
Never 6 4 8 4 8 5 8 4 7 4 7 4 5 3 8 4 4 2 7 4
Sometimes 39 34 37 33 38 33 38 34 37 33 39 31 33 28 38 34 31 26 38 33
Often 35 37 35 37 33 37 35 37 36 39 34 39 38 39 34 38 38 39 35 38
Very often 19 24 20 26 21 25 19 24 19 25 20 26 24 30 20 24 27 32 20 25
National Survey of Student Engagement | Annual Report 2006 40
“Our Center for Excellence in Learning and Teaching has sponsored campus-wide Faculty Forums to discuss ways to enhance learning related to NSSE results, benchmarks, and student engagement.”
— Corly Brooke, Director, Center for Excellence in Learning and Teaching, Iowa State University.

Student-Faculty Interaction
DRU-VH DRU-H DRU Master’s-L Master’s-M Master’s-S Bac-AS Bac-DIV Top 10% NSSE 2006
95th % 61 67 67 67 67 72 67 67 78 67
75th % 39 39 44 39 44 44 44 44 56 44
Median 28 28 28 28 28 33 33 33 39 28
25th % 17 17 22 17 22 22 22 22 28 20
5th % 6 6 11 11 11 11 11 11 17 11
DRU-VH DRU-H DRU Master’s-L Master’s-M Master’s-S Bac-AS Bac-DIV Top 10% NSSE 2006
95th % 78 78 83 78 83 83 89 83 94 83
75th % 50 50 56 56 56 56 67 56 72 56
Median 33 39 39 39 39 44 44 39 56 39
25th % 22 22 28 28 28 28 33 28 39 28
5th % 11 11 11 11 11 17 17 17 22 11
DRU-VH DRU-H DRU Master’s-L Master’s-M Master’s-S Bac-AS Bac-DIV Top 10% NSSE 2006
28 28 28 28 2833 33 33
39
28
DRU-VH DRU-H DRU Master’s-L Master’s-M Master’s-S Bac-AS Bac-DIV Top 10% NSSE 2006
3339 39 39 393939
44 44
56
Benchmark Scores Seniors
Percentiles Seniors
Benchmarks of Effective Educational Practice (continued)
100
90
80
70
60
50
40
30
20
10
0
Benc
hmar
k Sc
ores
DRU-VH
95th Percentile
75th Percentile
25th Percentile
5th Percentile
50th Percentile(Median)
59
Guide to Benchmark Figures
First-Year Students
Seniors
Key
Students learn firsthand how experts think about and solve problems by interacting with faculty members inside and outside the classroom. As a result, their teachers become role models, mentors, and guides for continuous, lifelong learning.
Percentiles First-Year Students
Benchmark Scores First-Year Students
41 National Survey of Student Engagement | Annual Report 2006

First-Year Students Seniors (in percentages) DRU-VH DRU-H DRU Master’s-L Master’s-M Master’s-S Bac-AS Bac-DIV Top 10% NSSE 2006
Discussed grades or assignments
with an instructor
Never 10 5 10 5 8 4 8 4 8 4 6 4 6 4 7 4 4 3 9 5
Sometimes 47 41 45 38 42 35 44 36 43 36 40 33 42 34 42 33 33 27 44 37
Often 28 32 30 32 31 33 31 34 32 34 35 36 33 34 33 35 37 35 31 33
Very often 14 21 15 24 19 28 17 26 16 26 19 28 19 28 19 28 26 36 17 25
Discussed ideas from your readings or classes
with faculty members outside of class
Never 46 32 47 31 41 27 45 30 41 26 37 22 34 18 39 24 25 11 43 28
Sometimes 38 45 37 44 39 43 37 44 40 46 41 48 44 46 40 47 43 44 39 45
Often 11 15 12 16 13 19 13 17 13 18 15 18 16 22 15 19 21 26 13 17
Very often 5 8 5 8 6 11 5 9 6 10 7 11 6 14 6 10 11 19 5 9
Talked about career plans with a faculty member or advisor
Never 26 19 27 20 25 17 27 19 23 14 23 13 24 10 22 13 16 4 26 17
Sometimes 49 45 47 43 45 40 46 41 48 42 48 38 48 37 47 39 44 31 47 41
Often 18 23 18 23 20 26 19 25 21 26 20 28 20 29 21 29 26 32 19 25
Very often 7 13 8 15 10 18 8 16 9 18 10 21 9 24 10 20 14 33 8 17
Received prompt written or oral feedback
from faculty on your academic performance
Never 9 6 10 7 8 5 9 5 9 4 6 3 5 2 8 4 4 1 8 5
Sometimes 42 38 41 34 39 32 38 31 38 30 34 27 34 26 38 29 29 18 39 32
Often 38 43 36 43 38 44 39 45 39 46 42 47 43 48 39 45 45 48 39 45
Very often 11 14 12 16 15 19 14 19 14 20 18 22 18 24 15 22 23 34 14 18
Worked with faculty members on activities
other than coursework (committees, orientation, student life activities, etc.)
Never 66 52 64 51 61 46 63 51 59 44 53 43 53 32 55 42 38 21 61 48
Sometimes 23 30 24 29 26 31 24 29 27 33 29 33 32 37 29 33 35 38 26 31
Often 8 12 9 12 9 14 9 13 10 15 12 15 11 19 11 15 18 23 9 13
Very often 3 6 3 7 4 8 4 7 4 9 5 9 4 12 5 9 9 18 4 8
Work on a research project with a faculty
member outside of course or program
requirements
Have not decided 40 13 40 16 39 17 41 18 42 17 41 15 42 11 41 17 35 7 41 16
Do not plan to do 21 51 25 52 26 51 29 55 27 54 24 55 20 52 30 54 21 46 26 53
Plan to do 34 12 30 13 29 13 26 12 26 12 29 10 34 8 24 12 36 7 29 12
Done 5 24 4 19 5 19 4 15 5 18 5 21 4 29 5 17 8 40 5 19
National Survey of Student Engagement | Annual Report 2006 42
“We are using NSSE results in our new strategic plan and regularly refer to the data to promote a college-wide focus on learning and engagement.”
— Robert G. Drake, William B. Spendiff Director of the Center for Excellence in Teaching, Siena College

Enriching Educational Experiences
DRU-VH DRU-H DRU Master’s-L Master’s-M Master’s-S Bac-AS Bac-DIV Top 10% NSSE 2006
2825 26 24 2526
2823
34
25
DRU-VH DRU-H DRU Master’s-L Master’s-M Master’s-S Bac-AS Bac-DIV Top 10% NSSE 2006
95th % 51 50 51 48 47 51 51 50 56 50
75th % 37 35 36 33 33 35 37 33 43 35
Median 28 25 26 25 24 26 28 23 34 25
25th % 20 17 18 17 17 18 19 16 25 17
5th % 11 8 8 8 7 8 10 7 14 8
DRU-VH DRU-H DRU Master’s-L Master’s-M Master’s-S Bac-AS Bac-DIV Top 10% NSSE 2006
4237
40 39 393936
40
50
58
DRU-VH DRU-H DRU Master’s-L Master’s-M Master’s-S Bac-AS Bac-DIV Top 10% NSSE 2006
95th % 71 69 72 68 69 73 79 70 83 71
75th % 54 50 54 50 51 55 62 51 69 52
Median 42 37 40 36 39 40 50 39 58 39
25th % 30 26 28 25 26 28 36 25 47 26
5th % 14 11 13 11 11 12 17 12 30 12
Percentiles Seniors
Benchmark Scores Seniors
Benchmarks of Effective Educational Practice (continued)
100
90
80
70
60
50
40
30
20
10
0
Benc
hmar
k Sc
ores
DRU-VH
95th Percentile
75th Percentile
25th Percentile
5th Percentile
50th Percentile(Median)
59
Guide to Benchmark Figures
First-Year Students
Seniors
Key
Complementary learning opportunities inside and outside the classroom augment the academic program. Experiencing diversity teaches students valuable things about themselves and other cultures. Used appropriately, technology facilitates learning and promotes collaboration between peers and instruc-tors. Internships, community service, and senior capstone courses provide students with opportunities to synthesize, integrate, and apply their knowledge. Such experi-ences make learning more meaningful and, ultimately, more useful because what students know becomes a part of who they are.
Percentiles First-Year Students
Benchmark Scores First-Year Students
43 National Survey of Student Engagement | Annual Report 2006

First-Year Students Seniors (in percentages) DRU-VH DRU-H DRU Master’s-L Master’s-M Master’s-S Bac-AS Bac-DIV Top 10% NSSE 2006
Had serious conversations with students who are very different
from you in terms of their religious beliefs, political opinions,
or personal values
Never 8 7 13 11 11 9 13 10 14 11 11 10 8 6 13 11 5 3 12 10
Sometimes 32 32 34 35 32 33 34 36 35 36 34 36 32 33 36 38 27 28 34 35
Often 31 32 28 28 29 30 28 30 29 30 30 30 30 31 28 29 31 32 29 30
Very often 29 29 25 25 28 28 24 24 23 23 25 25 30 30 23 22 37 37 26 26
Had serious conversations with students of a different race or
ethnicity than your own
Never 13 11 17 13 14 11 17 13 20 14 17 13 14 11 19 16 8 7 17 13
Sometimes 34 33 34 35 32 32 34 36 35 37 35 38 34 37 36 37 29 32 34 35
Often 27 28 26 27 27 28 26 27 25 27 26 26 26 26 24 25 29 28 26 27
Very often 25 28 23 25 27 29 22 24 20 21 22 23 25 26 20 21 33 33 23 25
Institutional emphasis: Encouraging contact among
students from different economic, social, and racial or ethnic
backgrounds
Very little 14 22 16 22 15 19 15 20 15 19 15 18 13 17 16 19 10 15 15 20
Some 34 38 35 37 31 33 35 36 33 37 32 35 32 36 33 36 28 35 34 36
Quite a bit 32 25 31 26 32 29 31 28 32 28 33 28 32 28 33 27 33 29 32 27
Very much 21 14 18 15 22 20 19 16 20 16 20 18 24 19 18 18 30 21 20 16
Hours per 7-day week spent participating in co-curricular
activities (organizations, campus publications, student
government, fraternity or sorority, intercollegiate or intramural
sports, etc.)
0 33 38 41 48 45 48 49 55 46 48 37 47 30 28 45 48 20 14 43 47
1-5 35 33 31 29 30 28 27 25 29 28 31 27 33 32 28 28 36 35 30 29
6-10 16 14 13 10 11 10 11 8 12 10 13 10 15 16 11 11 19 21 12 11
11-15 8 6 6 5 6 6 5 4 6 6 8 7 10 9 7 6 11 12 7 5
16-20 4 4 4 3 4 3 4 3 4 4 5 3 6 7 5 4 7 8 4 4
21-25 2 2 2 2 2 1 2 2 2 2 3 2 3 3 2 2 3 4 2 2
26-30 1 1 1 1 1 1 1 1 1 1 1 1 1 2 1 1 1 2 1 1
More than 30 2 2 2 2 2 2 2 2 1 2 2 2 2 3 2 2 3 4 2 2
Used an electronic medium (listserv, chat group, Internet,
instant messaging, etc.) to discuss or complete an
assignment
Never 11 10 15 11 15 10 17 11 18 12 16 12 18 12 20 14 11 10 16 11
Sometimes 31 28 29 26 30 27 30 27 32 28 28 27 31 30 30 26 29 30 30 27
Often 29 27 27 27 27 27 27 27 27 27 29 28 27 27 26 27 29 28 27 27
Very often 28 35 28 36 28 36 26 35 23 33 27 33 24 31 24 33 31 33 27 35
Practicum, internship, field experience, co-op experience,
or clinical assignment
Have not decided 13 7 14 8 12 8 16 9 16 8 15 8 15 6 17 6 9 4 15 8
Do not plan to do 3 17 5 18 4 15 6 17 5 16 4 16 4 17 7 15 2 14 5 17
Plan to do 77 20 74 24 75 23 71 25 72 24 74 19 74 13 68 21 78 7 73 23
Done 7 57 7 50 9 54 8 49 7 52 8 57 7 64 8 57 10 75 7 53
Community service or volunteer work
Have not decided 14 8 16 11 15 10 17 11 17 10 15 10 14 7 17 10 8 4 16 10
Do not plan to do 7 16 7 18 8 16 10 19 8 17 7 17 6 14 11 17 4 11 8 18
Plan to do 41 12 40 14 38 15 38 15 39 14 37 13 39 9 36 15 35 5 39 14
Done 38 64 37 57 38 59 35 54 36 59 41 59 42 70 37 58 52 80 37 59
Participate in a learning community or some other
formal program where groups of students take two or more
classes together
Have not decided 30 11 32 14 34 16 34 16 38 15 38 16 40 12 36 16 30 9 35 14
Do not plan to do 32 59 29 53 25 48 28 51 25 51 25 53 28 58 27 48 29 59 0.28 53
Plan to do 18 5 21 8 26 9 22 9 25 9 23 7 22 5 23 9 19 3 22 8
Done 20 25 18 26 15 27 16 24 12 25 14 24 11 24 14 27 22 29 16 25
Foreign language coursework
Have not decided 16 6 18 9 19 9 20 10 20 9 19 8 14 5 21 9 9 2 19 8
Do not plan to do 26 36 27 42 26 41 31 47 28 44 27 45 18 28 33 47 14 16 28 42
Plan to do 27 7 33 9 36 10 31 9 32 9 31 7 31 5 31 10 31 2 31 8
Done 32 52 22 41 20 40 18 34 20 39 23 40 37 62 15 34 45 80 22 41
Study abroad
Have not decided 29 11 30 14 30 14 31 14 31 12 27 12 25 7 31 14 22 3 30 13
Do not plan to do 23 63 28 64 29 63 34 68 30 66 26 64 19 56 39 68 15 42 29 65
Plan to do 47 9 40 9 39 10 33 8 37 8 44 6 54 6 27 7 62 3 39 8
Done 2 18 2 13 3 13 3 10 3 14 3 18 2 31 3 10 2 52 3 14
Independent study or self-designed major
Have not decided 33 9 34 13 35 13 35 14 36 12 37 11 38 7 34 13 35 4 35 12
Do not plan to do 51 67 49 61 43 58 46 62 42 58 40 57 39 57 43 56 45 56 46 61
Plan to do 13 6 14 9 18 10 15 9 18 10 19 8 20 5 18 9 18 3 16 9
Done 3 17 3 17 4 19 3 16 3 20 3 24 3 31 4 21 3 37 3 19
Culminating senior experience (capstone course, senior project or
thesis, comprehensive exam, etc.)
Have not decided 44 10 41 11 38 11 42 12 43 11 40 10 34 5 39 11 35 2 41 11
Do not plan to do 12 37 12 28 13 27 13 27 12 25 11 24 7 18 13 22 8 13 12 28
Plan to do 42 25 46 31 47 28 44 30 43 33 48 27 58 24 47 33 56 16 46 29
Done 1 29 1 30 2 34 1 30 2 31 2 40 1 54 2 34 1 69 1 32
National Survey of Student Engagement | Annual Report 2006 44

Supportive Campus Environment
DRU-VH DRU-H DRU Master’s-L Master’s-M Master’s-S Bac-AS Bac-DIV Top 10% NSSE 2006
95th % 86 89 89 92 92 92 92 92 97 89
75th % 69 69 69 72 72 75 75 72 83 72
Median 58 58 58 58 61 61 64 61 69 58
25th % 44 44 44 47 47 50 50 47 58 47
5th % 28 28 28 28 31 31 31 28 39 28
DRU-VH DRU-H DRU Master’s-L Master’s-M Master’s-S Bac-AS Bac-DIV Top 10% NSSE 2006
95th % 83 89 89 89 89 92 89 92 97 89
75th % 64 69 69 69 72 72 72 72 81 69
Median 53 56 56 56 58 61 61 61 69 56
25th % 42 42 42 44 47 47 50 47 56 44
5th % 22 25 22 25 28 28 31 28 36 25
DRU-VH DRU-H DRU Master’s-L Master’s-M Master’s-S Bac-AS Bac-DIV Top 10% NSSE 2006
58 58 58
69
58 5861 6161
64
DRU-VH DRU-H DRU Master’s-L Master’s-M Master’s-S Bac-AS Bac-DIV Top 10% NSSE 2006
53 56 56 5656 5861 6161
69
Benchmark Scores Seniors
Percentiles Seniors
100
90
80
70
60
50
40
30
20
10
0
Benc
hmar
k Sc
ores
DRU-VH
95th Percentile
75th Percentile
25th Percentile
5th Percentile
50th Percentile(Median)
59
Guide to Benchmark Figures
First-Year Students
Seniors
Key
Students perform better and are more satisfied at colleges that are committed to their success and cultivate positive working and social relations among different groups on campus.
Percentiles First-Year Students
Benchmark Scores First-Year Students
Benchmarks of Effective Educational Practice (continued)
45 National Survey of Student Engagement | Annual Report 2006

First-Year Students Seniors (in percentages) DRU-VH DRU-H DRU Master’s-L Master’s-M Master’s-S Bac-AS Bac-DIV Top 10% NSSE 2006
Institutional emphasis: Providing
the support you need to thrive socially
Very little 18 27 19 28 21 28 20 28 17 26 16 25 17 21 21 24 8 12 19 27
Some 40 42 38 39 37 39 38 41 40 41 38 39 38 41 36 41 29 31 38 40
Quite a bit 31 23 31 24 31 24 30 23 31 25 33 26 32 28 31 24 37 34 31 24
Very much 11 7 12 9 12 10 12 8 13 9 13 10 13 10 12 10 26 22 12 9
Institutional emphasis: Providing
the support you need to help you succeed
academically
Very little 3 7 4 7 4 6 4 5 3 4 3 4 2 3 4 4 1 2 3 5
Some 24 31 25 29 25 28 24 27 21 24 19 20 17 18 22 22 12 15 23 27
Quite a bit 46 43 46 43 45 42 45 45 46 45 46 46 43 43 44 44 41 43 45 44
Very much 28 19 25 22 26 24 27 24 30 27 32 30 37 36 31 30 45 40 29 24
Institutional emphasis: Helping
you cope with your non-academic
responsibilities (work, family, etc.)
Very little 31 46 30 41 30 40 30 40 27 36 24 35 23 31 29 34 13 18 29 40
Some 42 37 40 36 37 35 38 36 39 38 40 38 42 42 37 37 36 38 39 37
Quite a bit 20 12 22 16 23 17 23 17 24 18 27 19 25 19 25 19 32 26 23 16
Very much 7 4 8 7 10 9 9 7 10 8 9 8 10 8 9 9 19 17 9 7
Quality: Your relationships with
other students
Unfriendly, Unsupportive, Sense of Alienation 1 1 1 1 1 1 1 1 1 1 1 1 1 1 1 1 1 1 1 1
2 3 3 3 2 3 3 3 2 2 2 3 2 3 2 2 2 1 1 3 2
3 5 5 5 5 6 5 5 4 5 4 6 4 5 4 6 3 3 2 5 5
4 12 12 13 11 13 12 13 11 12 10 12 10 11 9 12 10 8 8 12 11
5 22 22 21 20 23 21 22 21 21 20 20 21 20 20 22 19 16 16 21 21
6 32 31 30 30 28 29 29 30 31 31 30 31 30 32 29 30 32 33 30 30
Friendly, Supportive, Sense of Belonging 25 26 26 30 26 29 27 31 28 33 28 31 29 32 28 35 39 40 27 30
Quality: Your relationships with faculty members
Unavailable, Unhelpful, Unsympathetic 1 1 1 1 1 1 1 1 1 1 1 1 1 0 1 1 0 0 1 1
2 3 4 3 3 3 3 3 3 2 2 2 2 1 1 2 2 1 1 3 3
3 8 8 8 6 8 6 7 5 6 4 5 4 5 3 6 4 3 2 7 5
4 21 17 20 15 19 13 18 12 16 11 14 10 12 8 15 10 10 7 18 13
5 30 28 29 26 27 24 27 24 26 23 24 20 26 20 24 19 24 23 27 24
6 25 28 26 29 26 30 28 31 30 32 32 34 33 32 29 33 33 32 28 31
Available, Helpful, Sympathetic 11 15 13 20 16 23 17 24 20 28 21 30 23 32 22 31 28 34 17 23
Quality: Your relationships with
administrative personnel and offices
Unhelpful, Inconsiderate, Rigid 4 6 4 6 6 8 4 5 3 5 3 4 3 5 3 4 1 3 4 6
2 8 10 8 9 8 10 7 9 7 8 6 8 6 8 7 7 3 5 7 9
3 14 14 13 12 13 12 11 12 11 11 10 11 10 11 10 10 8 8 12 12
4 26 23 25 22 23 21 23 21 22 21 22 20 22 21 21 20 19 19 23 21
5 23 21 23 22 22 20 23 21 24 22 23 21 25 23 23 22 25 24 23 21
6 16 16 17 17 17 16 18 18 19 19 21 20 21 19 21 20 24 22 18 18
Helpful, Considerate, Flexible 9 9 10 12 11 13 13 14 14 14 15 16 13 13 16 18 20 18 12 13
National Survey of Student Engagement | Annual Report 2006 46

Participating Colleges and Universities: 2000–2006
47 National Survey of Student Engagement | Annual Report 2006
AlabamaAuburn University1
Auburn University at MontgomeryBirmingham-Southern College1
Huntingdon CollegeJacksonville State UniversityJudson CollegeMiles CollegeOakwood CollegeSamford UniversitySpring Hill CollegeStillman CollegeTroy State University-Montgomery CampusTroy UniversityUniversity of Alabama at Birmingham1
University of Alabama in HuntsvilleUniversity of Alabama, The1
University of North AlabamaUniversity of South Alabama
AlaskaAlaska Pacific University1
University of Alaska Anchorage1
University of Alaska Southeast
ArizonaArizona State UniversityArizona State University at the West CampusEmbry Riddle Aeronautical University-PrescottNorthern Arizona University1
University of Arizona, The
ArkansasArkansas Tech University1
Henderson State University1
Hendrix CollegeJohn Brown University1
Lyon CollegeOuachita Baptist UniversityPhilander Smith College2
Southern Arkansas UniversityUniversity of ArkansasUniversity of Arkansas-Fort Smith1
University of Arkansas at Little Rock1
University of Arkansas at Pine Bluff2
University of Central ArkansasUniversity of the Ozarks
CaliforniaAlliant International UniversityCalifornia College of the ArtsCalifornia Lutheran UniversityCalifornia Polytechnic State University- San Luis ObispoCalifornia State Polytechnic University-PomonaCalifornia State University San MarcosCalifornia State University, Fresno2
California State University, Northridge2
California State University, Sacramento1
California State University-BakersfieldCalifornia State University-Chico1
California State University-Dominguez Hills1 2
California State University-FullertonCalifornia State University-Long BeachCalifornia State University-Los Angeles2
California State University-Monterey Bay2
California State University-San Bernardino1 2
California State University-Stanislaus2
Chapman UniversityConcordia University1
Fresno Pacific UniversityHarvey Mudd College1
Holy Names UniversityHumboldt State UniversityLa Sierra UniversityLaguna College of Art and DesignLoyola Marymount UniversityMaster’s College and Seminary, TheMenlo CollegeNational University1
Occidental College2
Pepperdine UniversityPitzer CollegePoint Loma Nazarene UniversitySaint Mary’s College of California1
San Diego Christian CollegeSan Diego State UniversitySan Francisco State UniversitySan Jose State University1
Santa Clara University1
Scripps College1
Sierra CollegeSimpson UniversitySonoma State University1
University of California-DavisUniversity of California-MercedUniversity of California-Santa CruzUniversity of JudaismUniversity of La VerneUniversity of RedlandsUniversity of San DiegoUniversity of San FranciscoUniversity of the PacificWestmont CollegeWhittier CollegeWoodbury University2
ColoradoAdams State College1 2
Colorado College1
Colorado School of MinesColorado State University1
Colorado State University-Pueblo2
Fort Lewis College1
Metropolitan State College of Denver1
Naropa University
Regis UniversityUnited States Air Force AcademyUniversity of Colorado at BoulderUniversity of Colorado at Colorado Springs1
University of Colorado at Denver & Health Sciences Center1
University of Denver1
ConnecticutCentral Connecticut State UniversityConnecticut College1
Eastern Connecticut State UniversityFairfield UniversityPost University1
Quinnipiac University1
Sacred Heart UniversitySaint Joseph CollegeSouthern Connecticut State UniversityUniversity of BridgeportUniversity of ConnecticutUniversity of HartfordUniversity of New HavenWestern Connecticut State University
DelawareDelaware State University2
Goldey-Beacom CollegeUniversity of Delaware
District of ColumbiaAmerican UniversityCatholic University of AmericaCorcoran College of Art and DesignGallaudet UniversityGeorgetown UniversityHoward UniversitySoutheastern UniversityTrinity UniversityUniversity of the District of Columbia1 2
FloridaBarry University2
Beacon CollegeBethune Cookman College2
Eckerd CollegeEdward Waters College2
Embry Riddle Aeronautical University- Daytona BeachEmbry Riddle Aeronautical University- Extended CampusFlagler College1
Florida A&M UniversityFlorida Atlantic University1
Florida Gulf Coast University1
Florida Institute of TechnologyFlorida International University2
Florida Memorial UniversityFlorida Southern College1
Florida State University

National Survey of Student Engagement | Annual Report 2006 48
Jacksonville University1
Lynn University1
New College of Florida1
Northwood University-Florida Education CenterNova Southeastern UniversityPalm Beach Atlantic University-West Palm BeachRingling School of Art and DesignRollins College1
Saint John Vianney College Seminary1
Saint Leo UniversitySaint Thomas University2
Stetson UniversityUniversity of Central Florida1
University of FloridaUniversity of MiamiUniversity of North FloridaUniversity of South FloridaUniversity of South Florida St. PetersburgUniversity of Tampa, The1
University of West Florida, TheWarner Southern College1
GeorgiaAgnes Scott College1
Albany State University2
Armstrong Atlantic State UniversityAugusta State UniversityBerry CollegeBrenau UniversityClark Atlanta University2
Clayton State University1
Columbus State University1
Covenant CollegeDalton State CollegeEmory UniversityFort Valley State University2
Georgia College and State University1
Georgia Institute of TechnologyGeorgia Southern University1
Georgia Southwestern State University1
Georgia State University1
Kennesaw State University1
LaGrange College1
Macon State CollegeMedical College of GeorgiaMercer University1
Morehouse College2
North Georgia College & State University1
Oglethorpe University1
Oxford College of Emory UniversitySavannah State University1 2
Shorter College1
Southern Catholic CollegeSouthern Polytechnic State UniversitySpelman College2
Thomas UniversityUniversity of Georgia1
University of West GeorgiaValdosta State UniversityWesleyan College1
HawaiiBrigham Young University-HawaiiChaminade University of Honolulu1
University of Hawaii at Hilo1
University of Hawaii at Manoa1
University of Hawaii-West Oahu
IdahoAlbertson College of IdahoBoise State University1
Brigham Young University-Idaho1
Idaho State University1
University of Idaho
IllinoisAugustana College1
Aurora University1
Blackburn College1
Bradley UniversityChicago State University2
Columbia College Chicago1
Concordia UniversityDePaul University1
Dominican UniversityEast-West UniversityElmhurst College1
Eureka CollegeGreenville CollegeIllinois College1
Illinois Institute of TechnologyIllinois State University1
Illinois Wesleyan University1
Judson CollegeKnox College1
Lake Forest CollegeLewis UniversityLincoln Christian College and SeminaryLoyola University ChicagoMcKendree CollegeMillikin UniversityMonmouth College1
North Central College1
Northeastern Illinois UniversityNorthern Illinois UniversityNorthwestern UniversityOlivet Nazarene UniversityRobert Morris College1
Rockford CollegeRoosevelt University1
Saint Xavier University1
School of the Art Institute of ChicagoSouthern Illinois University Edwardsville1
Trinity Christian College1
University of Illinois at Chicago
University of Illinois at SpringfieldUniversity of Illinois at Urbana-ChampaignUniversity of St Francis1
Western Illinois UniversityWheaton College1
IndianaAnderson UniversityBall State UniversityButler University1
Calumet College of Saint Joseph1
DePauw University1
Earlham College1
Hanover CollegeHuntington University1
Indiana State UniversityIndiana University Bloomington1
Indiana University KokomoIndiana University-East1
Indiana University-NorthwestIndiana University-Purdue University-Fort WayneIndiana University-Purdue University-Indianapolis1
Indiana University-South Bend1
Indiana University-SoutheastIndiana Wesleyan UniversityManchester College1
Purdue UniversityPurdue University-Calumet CampusPurdue University-North Central CampusRose-Hulman Institute of TechnologySaint Mary’s CollegeTaylor University-UplandUniversity of EvansvilleUniversity of Indianapolis1
University of Southern Indiana1
Valparaiso UniversityWabash College
IowaCentral CollegeClarke College1
Cornell CollegeDordt CollegeDrake University1
Graceland University-LamoniGrand View CollegeGrinnell CollegeIowa State University1
Loras CollegeLuther CollegeMaharishi University of ManagementMorningside College1
Mount Mercy CollegeSaint Ambrose University1
University of DubuqueUniversity of IowaUniversity of Northern Iowa

Participating Colleges and Universities: 2000–2006 (continued)
49 National Survey of Student Engagement | Annual Report 2006
Waldorf CollegeWartburg College1
KansasBaker University College of Arts and SciencesBenedictine CollegeEmporia State University1
Fort Hays State University1
Friends UniversityHaskell Indian Nations University2
Kansas State UniversityMidAmerica Nazarene UniversityNewman University1
Southwestern CollegeUniversity of KansasUniversity of Saint MaryWashburn University1
Wichita State University1
KentuckyAlice Lloyd CollegeAsbury CollegeBellarmine University1
Berea CollegeCampbellsville University1
Centre CollegeEastern Kentucky University1
Georgetown CollegeKentucky State University1 2
Lindsey Wilson CollegeMorehead State University1
Murray State University1
Northern Kentucky UniversitySullivan University1
Transylvania University1
Union CollegeUniversity of KentuckyUniversity of LouisvilleWestern Kentucky University1
LouisianaCentenary College of LouisianaDillard University2
Louisiana State University A&M1
Louisiana State University-ShreveportLoyola University New Orleans1
Northwestern State University of LouisianaSoutheastern Louisiana University1
Southern University and A&M College2
Tulane University of LouisianaUniversity of Louisiana at MonroeXavier University of Louisiana2
MaineCollege of the AtlanticHusson College1
Saint Joseph’s CollegeThomas College1
Unity College1
University of MaineUniversity of Maine at Farmington1
University of Maine at Fort Kent
University of Maine at Presque Isle1
University of New EnglandUniversity of Southern Maine
MarylandBowie State University2
College of Notre Dame of Maryland1
Coppin State University2
Frostburg State UniversityGoucher CollegeHood CollegeLoyola College in Maryland1
McDaniel College1
Morgan State University2
Mount St. Mary’s University1
Salisbury UniversitySojourner-Douglass College2
St. Mary’s College of MarylandTowson UniversityUnited States Naval Academy1
University of Maryland-Baltimore County1
University of Maryland-College ParkUniversity of Maryland-Eastern Shore2
Villa Julie College1
Washington College
MassachusettsBabson CollegeBay Path CollegeBoston Architectural CenterBoston UniversityBridgewater State CollegeClark UniversityCollege of the Holy CrossDean CollegeEmerson CollegeEmmanuel CollegeEndicott College1
Fitchburg State College1
Framingham State College1
Franklin W. Olin College of EngineeringGordon CollegeMassachusetts College of Liberal Arts1
Merrimack CollegeMount Ida CollegeNichols College1
Northeastern UniversityPine Manor College1
Regis CollegeSimmons CollegeSimons Rock College of BardSpringfield College1
Stonehill CollegeSuffolk University1
University of Massachusetts-Amherst1
University of Massachusetts-BostonUniversity of Massachusetts-DartmouthUniversity of Massachusetts-Lowell1
Wentworth Institute of Technology1
Western New England College
Wheaton College1
Wheelock CollegeWilliams CollegeWorcester Polytechnic Institute1
MichiganAlbion CollegeAlma CollegeCalvin CollegeCentral Michigan University1
Cleary University1
Concordia UniversityDavenport UniversityEastern Michigan University1
Ferris State UniversityGrand Valley State University1
Great Lakes Christian CollegeHope CollegeKalamazoo CollegeKettering UniversityKuyper CollegeLawrence Technological UniversityMadonna UniversityMichigan State UniversityMichigan Technological UniversityNorthern Michigan UniversityNorthwood UniversityOakland UniversitySpring Arbor UniversityUniversity of Detroit Mercy1
University of Michigan-Ann Arbor1
University of Michigan-Dearborn1
Wayne State University1
Western Michigan University1
MinnesotaAugsburg College1
Bemidji State UniversityBethany Lutheran CollegeBethel University1
Capella UniversityCollege of Saint BenedictCollege of Saint Scholastica, TheCollege of St. Catherine1
Concordia College at MoorheadConcordia University-Saint Paul1
Gustavus Adolphus CollegeHamline UniversityMacAlester CollegeMetropolitan State UniversityMinnesota State University-MankatoMinnesota State University-MoorheadSaint Cloud State UniversitySaint Mary’s University of MinnesotaSouthwest Minnesota State UniversitySt. Olaf CollegeUniversity of Minnesota, MorrisUniversity of Minnesota-DuluthUniversity of St. Thomas1

National Survey of Student Engagement | Annual Report 2006 50
MississippiAlcorn State University2
Delta State University1
Jackson State University1 2
Mississippi State UniversityMississippi State University-Meridian CampusMississippi Valley State University2
Tougaloo College2
University of MississippiUniversity of Southern MississippiWilliam Carey College
MissouriBarnes-Jewish College of Nursing and Allied HealthCentral Methodist UniversityCentral Missouri State University1
College of the OzarksDrury University1
Fontbonne UniversityHarris-Stowe State University2
Kansas City Art InstituteMaryville University of Saint LouisMissouri Baptist UniversityMissouri Southern State University1
Missouri Valley College1
Missouri Western State UniversityNorthwest Missouri State University1
Rockhurst University1
Saint Louis UniversitySoutheast Missouri State UniversityTruman State University1
University of Missouri-ColumbiaUniversity of Missouri-Kansas City1
University of Missouri-RollaUniversity of Missouri-St. Louis1
Webster University WorldwideWestminster CollegeWilliam Jewell CollegeWilliam Woods University
MontanaCarroll CollegeSalish Kootenai College2
University of Montana, The
NebraskaChadron State CollegeConcordia University NebraskaCreighton University1
Doane CollegeHastings CollegeNebraska Methodist College1
Nebraska Wesleyan University1
University of Nebraska at KearneyUniversity of Nebraska at Lincoln1
University of Nebraska at Omaha1
Wayne State College1
NevadaNevada State College at HendersonUniversity of Nevada-Las VegasUniversity of Nevada-Reno1
New HampshireColby-Sawyer College1
Daniel Webster CollegeFranklin Pierce CollegeKeene State College1
New England CollegePlymouth State University1
Rivier CollegeSaint Anselm College
New JerseyBloomfield CollegeCentenary College1
College of New Jersey, TheCollege of Saint ElizabethDrew University1
Fairleigh Dickinson University- Metropolitan CampusGeorgian Court University1
Kean UniversityMonmouth University1
Montclair State University1
New Jersey City University2
New Jersey Institute of TechnologyRamapo College of New JerseyRichard Stockton College of New Jersey, The1
Rider UniversityRowan UniversityRutgers University-New Brunswick/PiscatawaySaint Peters College2
Seton Hall University1
William Paterson University of New Jersey1
New MexicoEastern New Mexico University1 2
Institute of American Indian and Alaska Native Culture2
New Mexico Institute of Mining and TechnologyNew Mexico State UniversityUniversity of New Mexico2
Western New Mexico University1 2
New YorkAdelphi University1
Alfred University1
Barnard CollegeCanisius CollegeCazenovia College1
Clarkson UniversityColgate UniversityCollege of New Rochelle, TheCollege of Saint Rose, TheConcordia CollegeCUNY Bernard M Baruch College1
CUNY Brooklyn College1
CUNY City CollegeCUNY College of Staten IslandCUNY Hunter CollegeCUNY John Jay College Criminal JusticeCUNY Lehman College2
CUNY Medgar Evers College1 2
CUNY New York City College of Technology2
CUNY Queens CollegeCUNY York College1 2
Daemen College1
Elmira College1
Hamilton CollegeHartwick CollegeHobart and William Smith CollegesHofstra UniversityHoughton CollegeIona CollegeIthaca CollegeKeuka CollegeLaboratory Institute of MerchandisingLe Moyne CollegeLong Island University-Brooklyn Campus1
Manhattanville CollegeMarist CollegeMarymount College of Fordham UniversityMarymount Manhattan CollegeMedaille College1
Mercy College2
Molloy CollegeNazareth College of RochesterNew School, TheNiagara UniversityPace University1
Paul Smiths CollegePolytechnic University1
Roberts Wesleyan CollegeRochester Institute of TechnologyRussell Sage CollegeSage College of AlbanySaint Bonaventure UniversitySaint Joseph’s College1
Saint Joseph’s College-Suffolk Campus1
Sarah Lawrence CollegeSchool of Visual ArtsSiena College1
Skidmore CollegeSt. Francis CollegeSt. John’s University-New York1
St. Lawrence UniversityState University of New York at GeneseoStony Brook University1
SUNY at BinghamtonSUNY at BuffaloSUNY College at Brockport1
SUNY College at Old WestburySUNY College at OneontaSUNY College at Oswego1
SUNY College at PlattsburghSUNY College of Environmental Science and ForestrySUNY FredoniaSUNY PotsdamSUNY-Buffalo State College1
Syracuse UniversityUnion CollegeUnited States Merchant Marine Academy1

Participating Colleges and Universities: 2000–2006 (continued)
51 National Survey of Student Engagement | Annual Report 2006
United States Military AcademyVassar CollegeWagner CollegeWebb InstituteWells College1
North CarolinaAppalachian State UniversityBarton CollegeBelmont Abbey CollegeBennett College for Women2
Campbell University Inc.Catawba CollegeEast Carolina UniversityElizabeth City State University1 2
Elon UniversityFayetteville State University1 2
Gardner-Webb University1
Greensboro CollegeGuilford College1
High Point UniversityJohnson C Smith University2
Lees-McRae College1
Lenoir-Rhyne CollegeLivingstone College2
Mars Hill CollegeMeredith College1
Methodist CollegeNorth Carolina A&T State University1 2
North Carolina Central University2
North Carolina State UniversityPeace CollegePfeiffer UniversityQueens University of CharlotteSalem College1
St. Andrews Presbyterian CollegeUniversity of North Carolina at AshevilleUniversity of North Carolina at Chapel HillUniversity of North Carolina at CharlotteUniversity of North Carolina at GreensboroUniversity of North Carolina at PembrokeUniversity of North Carolina Wilmington1
Warren Wilson College1
Western Carolina University1
Wingate UniversityWinston-Salem State University1 2
North DakotaDickinson State University1
Mayville State UniversityMinot State University1
North Dakota State UniversityUniversity of MaryUniversity of North Dakota1
Valley City State University
OhioAntioch College1
Baldwin-Wallace College1
Bowling Green State University1
Capital University
Case Western Reserve UniversityCedarville University1
Central State University2
Cleveland State UniversityCollege of Mount St. JosephCollege of Wooster, TheColumbus College of Art and Design1
Defiance College1
Denison University1
Franciscan University of Steubenville1
Heidelberg College1
Hiram College1
John Carroll University1
Kent State University1
Kenyon CollegeLourdes CollegeMalone CollegeMiami University-Oxford1
Mount Union College1
Notre Dame College1
Ohio Christian UniversityOhio Northern University1
Ohio State University, TheOhio State University-Mansfield CampusOhio State University-Newark CampusOhio UniversityOhio University-Zanesville CampusOhio Wesleyan UniversityOtterbein CollegeTiffin UniversityUniversity of Akron1
University of Cincinnati1
University of DaytonUniversity of ToledoUrbana University1
Ursuline College1
Walsh UniversityWilmington CollegeWittenberg UniversityWright State UniversityXavier University1
Youngstown State University
OklahomaOklahoma City University1
Oklahoma State UniversityOral Roberts UniversityRogers State UniversityUniversity of Central OklahomaUniversity of Oklahoma Norman CampusUniversity of Science and Arts of OklahomaUniversity of Tulsa1
OregonConcordia UniversityEastern Oregon University1
George Fox University1
Lewis & Clark CollegeLinfield CollegeNorthwest Christian College1
Oregon State University1
Pacific UniversityPortland State University1
Southern Oregon UniversityUniversity of OregonUniversity of PortlandWarner Pacific CollegeWestern Oregon UniversityWillamette University
PennsylvaniaAlbright CollegeAllegheny College1
Alvernia CollegeArcadia UniversityBloomsburg University of PennsylvaniaBryn Mawr CollegeBucknell UniversityCabrini CollegeCalifornia University of Pennsylvania1
Cedar Crest CollegeChatham College1
Cheyney University of Pennsylvania2
College MisericordiaDickinson CollegeDrexel University1
Duquesne UniversityEastern University1
Edinboro University of PennsylvaniaElizabethtown CollegeFranklin and Marshall CollegeGettysburg CollegeGrove City College1
Gwynedd Mercy CollegeHoly Family UniversityJuniata College1
Keystone CollegeLa Roche CollegeLa Salle UniversityLafayette CollegeLebanon Valley CollegeLincoln University of Pennsylvania1 2
Lock Haven University of PennsylvaniaMansfield University of PennsylvaniaMarywood UniversityMercyhurst CollegeMessiah CollegeMillersville University of PennsylvaniaMoore College of Art and DesignMoravian College and Moravian Theological SeminaryMount Aloysius CollegeMuhlenberg CollegeNeumann College1
Pennsylvania College of TechnologyPennsylvania State UniversityPennsylvania State University-Abington1
Pennsylvania State University-AltoonaPennsylvania State University-Berks1

National Survey of Student Engagement | Annual Report 2006 52
Pennsylvania State University-Erie, The Behrend CollegePhiladelphia University1
Rosemont CollegeSaint Francis UniversitySaint Joseph’s UniversitySaint Vincent College1
Seton Hill UniversityShippensburg University of PennsylvaniaSlippery Rock University of Pennsylvania1
Susquehanna University1
Swarthmore CollegeTemple UniversityThiel College1
University of PittsburghUniversity of Pittsburgh-BradfordUniversity of Pittsburgh-Greensburg1
University of Pittsburgh-Johnstown1
University of ScrantonUniversity of the Arts, TheUniversity of the Sciences in PhiladelphiaUrsinus College1
Villanova UniversityWashington & Jefferson CollegeWaynesburg CollegeWidener UniversityWilkes UniversityWilson CollegeYork College Pennsylvania
Puerto RicoInter American University of Puerto Rico- Ponce Campus2
Inter American University of Puerto Rico- San German2
Pontifical Catholic University of Puerto Rico-Ponce2
Universidad Del Este2
Universidad Politecnica de Puerto Rico2
University of Puerto Rico-Humacao1 2
University of Puerto Rico-Mayaguez2
University of Puerto Rico-Ponce1 2
University of Puerto Rico-Rio Piedras Campus1
University of Puerto Rico-Utuado2
Rhode IslandBryant University1
Providence CollegeRhode Island CollegeRhode Island School of DesignRoger Williams University1
Salve Regina UniversityUniversity of Rhode Island
South CarolinaAnderson UniversityBenedict College2
Claflin University2
Clemson UniversityCoker College1
College of Charleston
Columbia College1
Columbia International UniversityConverse College1
Francis Marion UniversityFurman UniversityLimestone CollegeMorris College2
Presbyterian College1
University of South Carolina Aiken1
University of South Carolina ColumbiaVoorhees College1 2
Winthrop University1
Wofford College
South DakotaAugustana CollegeBlack Hills State University1
Dakota State University1
Dakota Wesleyan UniversityMount Marty CollegeNorthern State University1
Oglala Lakota College2
South Dakota School of Mines and Technology1
South Dakota State University1
University of South Dakota1
TennesseeAustin Peay State UniversityBaptist Memorial College of Health Sciences1
Belmont University1
Bryan College1
Christian Brothers UniversityEast Tennessee State UniversityFisk UniversityJohnson Bible CollegeLane College2
Le Moyne-Owen College2
Lee UniversityLincoln Memorial UniversityLipscomb University1
Martin Methodist CollegeMaryville CollegeMiddle Tennessee State UniversityMilligan CollegeRhodes College1
Southern Adventist UniversityTennessee State University2
Tennessee Technological UniversityUnion UniversityUniversity of MemphisUniversity of Tennessee, The1
University of Tennessee-Chattanooga, The1
University of Tennessee-Martin, TheUniversity of the South, The1
TexasAbilene Christian University1
Angelo State UniversityAustin College1
Baylor UniversityHardin-Simmons University
Howard Payne UniversityHuston-Tillotson University2
Jarvis Christian College2
Lamar UniversityMcMurry University1
Northwood UniversityOur Lady of the Lake University-San Antonio2
Paul Quinn CollegePrairie View A&M University1 2
Rice UniversitySam Houston State University1
Southwestern Assemblies of God UniversitySouthwestern University1
St. Edward’s UniversitySt. Mary’s University1 2
Stephen F. Austin State University1
Tarleton State University1
Texas A&M International University1 2
Texas A&M UniversityTexas A&M University-Commerce1
Texas A&M University-Corpus Christi2
Texas A&M University-Galveston1
Texas A&M University-Kingsville1 2
Texas A&M University-TexarkanaTexas Christian University1
Texas Lutheran University1
Texas State University-San Marcos1
Texas Tech UniversityUniversity of Houston-Downtown1 2
University of Houston-University ParkUniversity of North TexasUniversity of St. Thomas2
University of Texas at Arlington, The1
University of Texas at Austin, The1
University of Texas at Brownsville, TheUniversity of Texas at Dallas, The1
University of Texas at El Paso, The2
University of Texas at San Antonio, The2
University of Texas at Tyler, The1
University of Texas of the Permian Basin, The2
University of Texas-Pan American, The1 2
University of the Incarnate Word1 2
West Texas A&M University1
Wiley College1 2
UtahBrigham Young University1
Southern Utah UniversityUniversity of UtahUtah State University1
Weber State UniversityWestminster College1
VermontBennington CollegeChamplain CollegeJohnson State CollegeLyndon State CollegeMarlboro CollegeMiddlebury College

Participating Colleges and Universities: 2000–2006
53 National Survey of Student Engagement | Annual Report 2006
Norwich University1
Saint Michaels CollegeSterling CollegeUniversity of Vermont1
Woodbury College
Virgin IslandsUniversity of the Virgin Islands2
VirginiaChristopher Newport UniversityCollege of William and MaryEastern Mennonite UniversityEmory and Henry CollegeGeorge Mason University1
Hampden-Sydney CollegeHollins UniversityJames Madison UniversityLiberty UniversityLongwood University1
Lynchburg CollegeMarymount University1
Norfolk State University1 2
Old Dominion UniversityRadford University1
Randolph-Macon CollegeRandolph-Macon Woman’s CollegeRoanoke College1
Shenandoah University1
Southern Virginia University1
Sweet Briar CollegeUniversity of Mary WashingtonUniversity of Richmond1
University of VirginiaUniversity of Virginia’s College at Wise, TheVirginia Commonwealth University1
Virginia Intermont CollegeVirginia Military InstituteVirginia Polytechnic Institute and State UniversityVirginia Union University2
Virginia Wesleyan CollegeWashington and Lee University1
WashingtonCentral Washington UniversityEastern Washington UniversityEvergreen State College, The1
Gonzaga UniversityHeritage University1 2
Pacific Lutheran UniversitySeattle Pacific University1
Seattle UniversityUniversity of Puget Sound
University of Washington, BothellUniversity of Washington-Seattle CampusWashington State University1
Western Washington UniversityWhitman College1
Whitworth College
West VirginiaDavis & Elkins CollegeFairmont State UniversityMarshall UniversityMountain State University1
Shepherd UniversityUniversity of Charleston1
West Virginia University1
West Virginia University Institute of TechnologyWest Virginia Wesleyan College1
Wheeling Jesuit University1
WisconsinAlverno College1
Beloit CollegeCardinal Stritch UniversityCarroll College1
Carthage CollegeConcordia University-WisconsinEdgewood College1
Lawrence UniversityMarian College of Fond du Lac1
Marquette UniversityMilwaukee Institute of Art Design1
Milwaukee School of EngineeringMount Mary College1
Northland CollegeRipon CollegeUniversity of Wisconsin-Eau Claire1
University of Wisconsin-Green Bay1
University of Wisconsin-La Crosse1
University of Wisconsin-MadisonUniversity of Wisconsin-Milwaukee1
University of Wisconsin-Oshkosh1
University of Wisconsin-Parkside1
University of Wisconsin-Platteville1
University of Wisconsin-River Falls1
University of Wisconsin-Stevens Point1
University of Wisconsin-Stout1
University of Wisconsin-SuperiorUniversity of Wisconsin-Whitewater1
Viterbo UniversityWisconsin Lutheran College1
WyomingUniversity of Wyoming1
Canada
AlbertaUniversity of AlbertaUniversity of Calgary
British ColumbiaTrinity Western UniversityUniversity of British ColumbiaUniversity of Victoria
New BrunswickSt. Thomas UniversityUniversity of New Brunswick - Fredericton Campus
Nova ScotiaAcadia UniversityDalhousie University
Ontario
Brock UniversityCarleton University1
Lakehead UniversityLaurentian UniversityMcMaster’s UniversityNipissing UniversityOntario College of Art and DesignQueen’s UniversityRyerson UniversityTrent UniversityUniversity of GuelphUniversity of Ontario Institute of TechnologyUniversity of OttawaUniversity of TorontoUniversity of WaterlooUniversity of Western OntarioUniversity of WindsorWilfrid Laurier UniversityYork University
QuebecConcordia UniversityMcGill UniversityUniversité Laval
Prince Edward IslandUniversity of Prince Edward Island1
SaskatchewanUniversity of ReginaUniversity of Saskatchewan
1 Participated in the Faculty Survey of Student Engagement (FSSE)
2 Participating in the Building Engagement and Attainment of Minority Students project (BEAMS)

National Survey of Student Engagement | Annual Report 2006 54
NSSE Staff
National Survey of Student EngagementDirector . . . . . . . . . . . . . . . . . . . George Kuh
Associate Director,
NSSE Institute . . . . . . . . . . . . . . . . Jillian Kinzie
Associate Director,
Research & Data Analysis . . . . . . . . . . Robert Gonyea
Assistant Director, Survey Operations . . . . Todd Chamberlain
Project Manager, FSSE . . . . . . . . . . . . Thomas Nelson Laird
Project Manager, LSSSE . . . . . . . . . . . Lindsay Watkins
Project Manager, NSSE Institute . . . . . . Kathy Anderson
Project Manager, CSEQ . . . . . . . . . . . Julie Williams
Project Manager, BCSSE . . . . . . . . . . . Ty Cruce
Project Coordinator . . . . . . . . . . . . . Julie Sylvester
Finance Manager . . . . . . . . . . . . . . . Kim Fatten
Research Analysts . . . . . . . . . . . . . . Pu-Shih Daniel Chen Ali Korkmaz Shimon Sarraf Rick Shoup
Office Coordinator. . . . . . . . . . . . . . Delene Churchill
Receptionist . . . . . . . . . . . . . . . . . Erin Whisler
Research Project Associates, NSSE . . . . . Fred Wanjera Xingming Yu
Client Services Manager . . . . . . . . . . . Rob Aaron
Project Associates, NSSE. . . . . . . . . . . Chad Ahren Elizabeth Beeler Dan Bureau Chad Christensen Lowell Davis Ted Ingram Amanda Suniti Niskodé Helen Grace Ryan
Project Associate, FSSE . . . . . . . . . . . Amy Garver
Project Associate, CSEQ . . . . . . . . . . . Michelle SalinasHolmes
Project Associates, NSSE Institute . . . . . . Jennifer Buckley Susan Johnson
Web Developers . . . . . . . . . . . . . . . Justin Reynard Jonathan Tweedy
Project Support Assistants . . . . . . . . . . Kyle Heady Kishen Parakshak
Indiana University Center for Survey ResearchDirector . . . . . . . . . . . . . . . . . . . John Kennedy
Associate Director . . . . . . . . . . . . . . Nancy Bannister
Assistant Director, Finance . . . . . . . . . . Donna Hackney
Assistant Director, Technology. . . . . . . . Kevin Tharp
Project Managers. . . . . . . . . . . . . . . Erica Moore Kathleen Matthews
Field Director . . . . . . . . . . . . . . . . Katherine Mabbitt
Field Manager, Mail . . . . . . . . . . . . . Jaime Roberts
Field Manager, Telephone . . . . . . . . . . Brian Brake
Research Assistants. . . . . . . . . . . . . . Kristin McCormick Mark Niswander Nicholas Roberts Stef Shuster Amanda Wrigley
Senior Supervisors . . . . . . . . . . . . . . Kristin Cody Bethany Bannister- Andrews
Programmer/Analyst . . . . . . . . . . . . . Jason Francis
Computing Assistants . . . . . . . . . . . Nicholas Bannister- Andrews Andrew Hill

Center for Postsecondary ResearchSchool of EducationIndiana University Bloomington1900 E. 10th StreetEigenmann Hall, Suite 419Bloomington, IN 47406-7512
Phone: 812-856-5824 Fax: 812-856-5150E-mail: [email protected]: www.nsse.iub.edu
w w w. n s s e . i u b . e d u


![The Powerful Act of Coaching Employees · Fostering a Culture of Engagement | 3 “ ” Amazingly…just 29% employees [are] engaged at work. Understand and identify engaged employees](https://img.dokumen.tips/doc/110x75/5f754765aa5c19607d1d8df4/the-powerful-act-of-coaching-fostering-a-culture-of-engagement-3-aoe-a-amazinglyjust.jpg)