Embed Size (px)
Citation preview

WP 2016-03 February 2016
Working Paper Charles H. Dyson School of Applied Economics and Management Cornell University, Ithaca, New York 14853-7801 USA
ENFORCEMENT MATTERS: THE EFFECTIVE REGULATION OF LABOR
Lucas Ronconi and Ravi Kanbur

It is the Policy of Cornell University actively to support equality of
educational and employment opportunity. No person shall be denied
admission to any educational program or activity or be denied
employment on the basis of any legally prohibited discrimination involving,
but not limited to, such factors as race, color, creed, religion, national or
ethnic origin, sex, age or handicap. The University is committed to the
maintenance of affirmative action programs which will assure the
continuation of such equality of opportunity.

3
Enforcement Matters:
The Effective Regulation of Labor*
By
Lucas Ronconi
Centro de Investigación y Acción Social (CIAS) & CONICET
And
Ravi Kanbur
Cornell University
3 December, 2015
Abstract
This paper provides, to our knowledge for the first time, cross-country measures of enforcement of labor law across almost every country in the world. The distinction between de jure and de facto regulation is well understood in theory, but almost never implemented in cross-country empirical work because of lack of data. As a result, influential papers like the one by Botero et. al. (2004) published in the Quarterly Journal of Economics, which have shaped the policy debate by finding strong negative consequences of labor regulation on labor market outcomes, are based entirely on measures of de jure stringency of regulations. We show that this neglect of regulation enforcement matters. There is, on average, a negative correlation between the stringency of labor regulation and the intensity of its enforcement. The strong results of Botero et. al. (2004) on the consequences of labor regulation, and the hypotheses of La Porta et. al (2008) on the legal origin theory of regulation stringency, no longer hold for effective labor regulation.
JEL classifications: J88; K42
Keywords: Labor Regulation, Enforcement, Effective Regulation, Legal Origin Theory, Labor Market Outcomes
* We thank Sami Berlinsky, Carlos Scartascini and seminar participants at CIAS, Cornell, IDB and Universidad de San Andrés for useful comments. Paulo Barbieri provided excellent research assistance.

4
1. Introduction
The causes and consequences of labor regulation have received substantial attention from
economists and social scientists. Theory stresses that the relevant concept to study is effective
labor regulation, that is, the combination of both de jure regulations and state enforcement
efforts. Country specific studies confirm the importance of non-compliance with labor
regulations, especially in developing countries.1 And yet cross-country studies invariably use de
jure measures of labor regulation stringency. This is true, in particular, of the highly influential
study by Botero et. al. (2004) whose findings have been used to argue for the negative
consequences of labor regulation.2 At the same time, the study by La Porta et. al. (2008)
proposes and confirms “the legal origin theory” as an explanation for cross-country variations of
labor regulation, once again using de jure measures of labor regulation stringency.
The cross-country econometric studies which use de jure measures of labor regulation
recognize the importance of enforcement, but in effect say that they are forced to use the de jure
measures because they do not have measures of enforcement. But how can we credibly assess the
consequences of labor regulation if we only consider the letter of the law, ignoring the possibility
that enforcement is lower in those places where the law is more stringent? These are not purely
hypothetical questions. Noncompliance with labor regulations is pervasive around the world.
Furthermore, noncompliance is particularly high in developing countries, and at the same time,
those countries tend to have the most stringent regulations. Is it correct to assume that state
intervention in the labor market is more stringent in Venezuela or Angola, where labor laws are
quite protective but enforcement and compliance are very low, than in Canada or New Zealand,
where the opposite occurs? The existing cross-country empirical research, however, usually
makes such an unrealistic assumption because of lack of data on enforcement.
The first contribution of this paper is that it fills this data gap. It provides, to our
knowledge for the first time, new measures of enforcement of labor law across almost every
country in the world. The second contribution of the paper is that it establishes a negative
1 Studies that analyze the consequences of enforcement include Ashenfelter and Smith, (1979), Almeida and Carneiro (2012), Bhorat et al. (2012), Pires (2008), and Ronconi (2010); and studies that analyze its determinants include Amengual (2010), Piore and Schrank (2008), Murillo et al. (2009), and Ronconi (2012). 2 For other studies in this vein, see Djankov and Ramalho (2009), Galli and Kucera (2004), Heckman and Pages (2004 ) and Feldmann (2009). The equally influential study by Besley and Burgess (2004) is for India, but for a cross section of Indian states.

5
correlation between stringency of labor regulation on paper and the intensity of its enforcement
on the ground. The third and perhaps most important contribution of this paper is that when the
same methods of Botero et. al, (2004) and La Porta et. al. (2008) are applied to ask the same
questions, their findings no longer hold. Effective labor regulation does not appear to have the
negative consequences for a range of economic outcomes which are ascribed to labor regulation
by Botero et. al (2004), and variations in effective labor regulation across countries cannot be
explained by the legal origin theory of La Porta et. al. (2008).
The plan of the paper is as follows. Section 2 presents the development of our new data
set on enforcement of labor law across more than 100 countries of the world. Section 3 shows the
negative relationship across countries between stringency in the letter of the law and the intensity
of its enforcement. Section 4 tests the La Porta et. al. (2008) legal origin theory for effective
regulation, which combines the de jure provisions used by them with measures of enforcement.
It is shown that serious doubts are thrown on the legal origin theory. Section 5 revisits the
influential findings of Botero et. al. (2004) on the negative consequences of labor regulation, but
using effective rather than de jure regulation. The strong results of Botero et. al. (2004) no longer
hold. Section 6 concludes the paper with a discussion of areas for further research.
2. Measuring Enforcement of Labor Law
This section presents new proxies for state enforcement of labor law across
countries.3Conceptually, the objective is to measure state actions to achieve compliance with
labor regulations. State actions can be categorized into two groups: first activities that affect the
probability of finding employers who violate the law, and second, actions that determine the
expected penalty. Public campaigns that provide workers with information about their rights,
access to the judiciary, and government inspections are in the first group. The penalties set in the
code, and their effective implementation by labor inspectors and judges are in the second group.
This paper covers a subset of the above actions.
3 A full description of data sources and variable construction is provided in the Appendix.

6
2.1 Inspection
One of the main policy instruments to enforce labor regulations is government inspection.
Labor inspectorates present substantial institutional heterogeneity across countries. In some
countries there is a single inspection agency in charge of enforcing all types of labor standards,
such as in France; in other countries there are two agencies, one enforcing safety and health and
the other covering employment standards; and in a few countries, such as the United States or the
United Kingdom, there are three or more agencies, each focusing on a relatively small number of
provisions. Piore and Schrank (2008) describe them as the Latin “generalist” approach to labor
inspection and the Anglo-American “diffuse” approach.
There is no single source of information to measure labor inspection agencies’ resources
and activities across countries. The relatively new ILOSTAT database, for example, only
provides information about labor inspection for 53 countries. Therefore, we compiled data and
statistics from governments’ websites, from reports produced by the International Labor
organization (ILO), the U.S. Department of Labor, and the U.S. State Department.
The first variable we construct is Inspector which is simply the number of labor
inspectors in a country. To count the number of inspectors we follow the definition suggested in
ILOSTAT, according to which a labor inspector is a public official responsible for securing
enforcement of the legal provisions relating to wages, safety and health, hours, the employment
of children, and other connected matters. The second variable we construct is Inspections,
defined as the number of labor inspections conducted per year. To make the values comparable
across countries, both variables are divided by the labor force in each country.
The figures cover the period from 2000 to 2012, but for the majority of countries the
collected data only covers the last three years (2010 to 2012). In case of conflicting information
across sources, we take the average. The constructed variables cover 197 countries and territories
in the case of Inspectors and 131 in the case of Inspections.
The simple average across countries is 8.24 inspectors per 100,000 workers and 76.61
inspections per year per million workers. The averages, however, are substantially lower when
countries and territories with a population below 1 million in 2011 are excluded from the sample.
In this case, the simple averages are 5.46 inspectors and 62.70 inspections. Table 1 presents the
figures by region. Countries in Europe, the Middle East and North Africa present the highest
values and Sub-Saharan Africa, and Central and South Asia the lowest.

7
Table 1. Number of Labor Inspectors and Inspections per Worker by Region (>1 million)
Region Inspectors Inspections
Average No. countries Average No. countries
Europe 9.30 37 90.75 33
Middle East & North Africa 7.77 18 98.00 13
East Asia & Pacific 6.18 19 61.90 13
North America 4.72 2 62.91 2
Latin America & Caribbean 4.13 22 52.64 22
Central & South Asia 2.70 14 14.62 13
Sub-Saharan Africa 2.35 41 31.61 17
World 5.46 153 62.70 113
Notes: This table presents the simple average across countries of the number of labor inspectors per 100,000 workers, and the number of labor inspections conducted per year per million workers. Countries with a population below one million in 2011 are excluded. Figures are for the period 2000-2012.
2.2 Penalties
The penalty structures for labor law violation are highly varied across countries, and
differ by type of regulation. Given the data sources, we focus on penalties for violations of
regulations with wage provisions. Specifically, we construct a measure of penalties specified in
the law in case of noncompliance with the minimum wage assuming the following: i) the
employer is a first-time offender, ii) the offense committed is paying one employee during one
month a salary 20 percent below the legal minimum, iii) the employer does not obstruct the work
of the inspector, iv) the employer corrects the problem after receiving a notice from the
enforcement authority, and v) the employer does not retaliate against the employee. In countries
with no minimum wage, we take the penalty that applies to violations of wage provisions.4 With
these assumptions we can build a penalties schedule using the ILO TRAVAIL legal database,
and country legislation. It covers 187 countries and their relevant penalties in 2011.
Penalties typically take the form of financial fines, either set as a monetary amount or as
a proportion of the minimum wage. Some countries set a single fine, while others set a minimum
and a maximum, and others only set a maximum. But penalties can also include criminal fines.
4 Some countries set sectorial minimum wages through collective bargaining. In this case, we take the penalty that applies to violations of the minimum wage set in the collective agreement.

8
In almost one out of four countries around the world, the applicable legislation stipulates
imprisonment. Finally, in some countries the legislation explicitly requires inspectors to notify
the employer before issuing any penalty; fines can only be applied to employers who did not
correct the violation.
We construct measures of de jure penalties for three alternative scenarios: low, medium
and high penalties, and convert criminal penalties into a money metric by assuming that the cost
for an employer of serving one year in prison equals 10 times GDP per worker. The Low total
penalty scenario assumes a 10 percent probability of receiving the minimum financial fine and a
5 percent probability of receiving the minimum term in prison.5 The Medium total penalty
scenario assumes a 50 percent probability of receiving a medium financial fine and a 25 percent
probability of receiving the medium term in prison.6 Finally, the High total penalty scenario
assumes a 100 percent probability of receiving the maximum financial fine and a 50 percent
probability of serving 50 percent of the maximum term in prison.
Table 2 presents these measures by region. The simple average across countries for the
medium financial fine equals U$ 1,171 and for the medium prison term equals 0.19 years.
Financial fines tend to be higher in more developed regions, and imprisonment varies
substantially from basically zero in Europe to more than four months in Sub-Saharan Africa,
East Asia and the Pacific.
5 The minimum financial fine in countries that do not establish a minimum is assumed to be 50% of the maximum, and the minimum term in prison is 25% of the maximum. 6 The medium financial fine is the average between the minimum and the maximum fine, and the medium term in prison is the average between the minimum and maximum terms.

9
Table 2. De Jure Penalties in Case of Minimum Wage Violation by Region
Region Medium Financial Fine (2011 U$)
Medium Imprisonment (years)
No. of countries
Europe 1,546 0.01 41
Middle East & North Africa 426 0.05 20
East Asia & Pacific 2,095 0.45 28
North America 9,225 0.21 3
Latin America & Caribbean 1,442 0.08 35
Central & South Asia 205 0.10 13
Sub-Saharan Africa 163 0.36 47
World 1,171 0.19 187
Notes: The table presents the simple average across countries of de jure penalties in case of violation of the minimum wage in 2011. The medium financial fine is defined as the average between the minimum and the maximum fine and converted to US$ using the official exchange rate. The medium term in prison is the average between the minimum and the maximum terms and it is expressed in years.
The measures presented above have several shortcomings. First, the penalties only refer
to violations of the minimum wage. Second, there are a number of state actions aimed at
enforcing the law that are not covered, such as providing information to workers about their
labor rights and ensuring access to the judiciary. But the most important limitation, of course, is
lack of data about the actual implementation of penalties. Our assumptions show the difficulties
of converting the mass of enforcement information into a number that can be compared across
countries in monetary terms. But this is the route that will have to be taken if we are to bring
enforcement measures into cross-country econometric analysis.
3. The Stringency of Law and The Intensity of Its Enforcement
This section empirically explores the relationship between de jure employment regulation
and labor enforcement across countries. First, using the World Bank Doing Business database for
the year 2011, and following a similar methodology as Botero et al. (2004), we create the
Employment law index (see Appendix).7 This index is available for 189 countries. Second, we
7 There are two main differences. First, we include the ratio of the minimum wage to the average value added of workers (also obtained from WBDB) as a component of the employment law index while Botero et al. (2004) do

10
combine the inspection and penalties measures and construct two variants of an Enforcement
index. The first is defined as the average of the normalized variables Medium total penalty and
Inspector per worker, the second index uses instead Inspections per worker, and they are
available for 180 and 121 countries respectively.
A key stylized fact that emerges is that countries with more stringent employment
regulations tend to enforce less. As Panel A Table 3 shows, there is a negative correlation
between the de jure employment index and the enforcement index that holds across different
specifications, samples and the inclusion of controls (i.e., income per capita), although it is
imprecise.
Table 3. The Relationship between de Jure Regulations and Enforcement of Labor
(1) (2) (3) (4) (5) (6)
Panel A Enforcement
index 1
Enforcement
index 1
Enforcement
index 1
Enforcement
index 2
Enforcement
index 2
Enforcement
index 2
Employment law index
-0.129*** -0.120** -0.065 -0.056 -0.042 -0.113
(0.045) (0.047) (0.044) (0.071) (0.078) (0.070)
N 172 161 131 118 109 94
R2 0.19 0.20 0.26 0.14 0.16 0.17
Panel B Enforcement
index 3
Enforcement
index 3
Enforcement
index 3
Enforcement
index 4
Enforcement
index 4
Enforcement
index 4
Employment law index
-0.185*** -0.179*** -0.106** -0.219** -0.200* -0.266**
(0.049) (0.052) (0.048) (0.104) (0.110) (0.120)
N 172 161 131 118 109 94
R2 0.16 0.16 0.18 0.17 0.18 0.20
Sample Sample A Sample B Sample C Sample A Sample B Sample C
Notes: The four measures of the dependent variable (Enforcement index) are (1) the average of the normalized variables Medium Total Penalty and Inspector per worker, (2) the average using Inspection per worker, (3) using Inspector per worker-regulation, and (4) using Inspection per worker-regulation. All models control for log GDP per capita in 2011. Sample A only includes countries with data for de jure employment index, labor inspectors and fines; sample B excludes colonizers; and sample C excludes countries with less than one million people in 2011. Robust standard errors are in parentheses. * Statistically significant at the 0.10 level, ** at the 0.05 level, *** at the 0.01 level.
not. Second, Botero et al. (2004) computed not only an index of employment law, but also an index of collective relations law and an index of social security law.

11
One technical concern is that a country that regulates many aspects of the employment
relationship needs to devote more resources compared to a country that regulates fewer aspects
in order to achieve the same level of enforcement. This line of reasoning suggests using the labor
force times the number of employment regulations as the denominator for inspectors and
inspections. 8 Panel B in Table 3 shows that the two additional enforcement indexes that result
from combining the penalty data with either the number of Inspectors per worker-regulation or
Inspections per worker-regulation are also negatively and significantly correlated with the
stringency of the employment law.
Figure 1 is a scatter plot that illustrates the negative correlation using rankings based on
the above measures of de jure regulation and enforcement. Countries with more stringent labor
codes (i.e., with higher ranking positions based on the Employment law index) tend to enforce
less (i.e., lower ranking position based on the Enforcement index).
8 The Number of Regulations is obtained from WBDB. The variable can take values from 0 to 10 and it is the sum of ten regulations (see appendix). Notice that this variable does not include variation in the stringency of each regulation and so it differs from the Employment law index. For example, severance pay is compulsory in both the Central African Republic and South Africa, and so both countries add one point to the Number of Regulations variable, although in the former country severance equals 17 monthly salaries for a worker with one year of tenure compared to one monthly salary in the latter.

12
Figure 1. The Negative Correlation across Countries between Enforcement and Labor Law
Notes: The horizontal axis is a ranking based on the de jure employment index wherein countries with more protective regulations have a higher ranking. The vertical axis is a ranking based on the enforcement index wherein countries with higher enforcement (labor inspectors and fines) have a higher ranking. The linear model between these variables equals Ranking Enforcement Index = 130.7 – 0.53*Ranking Employment Law Index.
The negative correlation between the letter of the law and enforcement efforts has been
generally unnoticed in the literature, but its implications are potentially very important. Cross-
country studies that attempt either to explain the causes of effective regulation or estimate its
effects relying only on the letter of the law are likely to be biased. The next sections show that
legal origin theory fails to account for variation in enforcement across countries, and that the
correlation between employment law and labor market outcomes changes substantially when
enforcement is included into the analysis.
AFG
AGO
ALB
ARE
ARG
ARM
ATG
AUS
AUT
AZE
BDI
BEL
BEN
BFA
BGD
BGR
BHR
BHS
BIH
BLR
BLZ
BOL
BRA
BRB
BRN
BTN
BWA
CAF
CAN
CHE
CHL
CHN
CIV
CMR
COD
COG
COL
COM
CPV
CRI
CYP
CZE
DEU
DJI
DMA
DNK
DOM
DZA
ECU
EGY
ERI
ESP
EST
ETH
FJI
FRA
GAB
GBR
GEO
GHA
GIN
GMB
GNB
GNQ
GRCGRD
GTM
GUY
HKG
HND
HRV
HTI
HUN
IDN
IND
IRL
IRQ
ISL
ISR
ITA
JAM
JOR
JPN
KAZ
KEN
KHM
KIR
KNA
KOR
KWT
LBN
LBR
LBY
LCA
LKA
LSO
LTU
LUX
LVA
MAR
MDG
MDV
MEX
MKD
MLI
MLT
MMR
MNE
MNG
MOZ
MRT
MUS
MWI
MYS
NAM
NER
NGA
NIC
NLD
NOR
NPL
NZL
OMN
PAN
PER
PHL
PLW
PNG
POLPRT
PRY
QAT
ROU
RUS
RWA
SAU
SEN
SGP
SLB
SLE
SLV
SMR
SRB
STP
SUR
SVK
SVN
SWE
SWZ
SYC
SYRTCD
TGO
THA
TLS
TTO
TUN
TURTWN
TZAUGA
UKR
URY
USA
VEN
VNM
VUT WSM
YEM
ZAFZMB
ZWE
050
100
150
200
Enf
orce
men
t In
dex
Ran
kin
g
0 50 100 150 200de Jure Employment Index Ranking

13
3. Legal Origin Theory and Enforcement of Labor Law
Legal origin theory stresses that there is a fundamental difference in the strategy of social
control of business between common and civil law countries. “Common law [seeks a balance
between private disorder and public abuse of power] by shoring up markets, civil law by
restricting them or even replacing them with state commands” (La Porta, López-de-Silanes and
Shleifer, 2008: 307). This theory, when applied to the regulation of labor, predicts, first, that civil
law countries have more protective formal legal rules; and second, it predicts that those formal
rules are enforced in both legal traditions but particularly so in civil law countries because of the
higher dislike for unregulated market outcomes. Furthermore, because civil law countries
regulate more aspects of the employment relationship, differences in the nature of the
enforcement task suggests more inspection resources and activities in civil law countries
compared to common law.
Botero et al. (2004) collected an impressive amount of information and showed that the
first prediction holds. Common Law countries –compared to civil law – have less stringent
employment, collective relations and social security laws. Their sample only covers 85 countries
(including former colonizers). But, thanks to their influential work and the World Bank Doing
Business (WBDB) initiative, it is now possible to easily access measures of employment
regulations for almost every country in the world.
We first replicate their work, running a similar cross-country regression model, but for a
larger sample using the Employment law index obtained from the WBDB database. As shown
below, Botero et al.’s (2004) finding holds: common law counties have less protective de jure
labor regulations as predicted by legal origin theory. However, the relationship between common
law and enforcement (which so far as not been tested) runs in the opposite direction. Therefore, it
is not clear whether common law countries have less stringent effective labor regulations.
Panel A in Table 4 presents the cross-country OLS regression of de jure Employment law
index on legal origin. Common law is an indicator equal to 1 if the country has a common law
legal tradition and zero otherwise.9 The model in column 1 includes all countries for which the
dependent variable is observed; in column 2 the sample is restricted to countries with available
data on de jure regulations, inspectors and penalties; we further reduce the sample by excluding
9 Countries are categorized as in La Porta, López-de-Silanes and Shleifer (2008).

14
former colonizers (column 3), and countries with less than one million people in 2011 (column
4). All models include as controls income per capita, total population, country size (in square
kilometers), and the urbanization rate, all in 2011.10
Table 4. Legal Origin and de Jure Regulation of Labor
(1) (2) (3) (4)
Panel A Employment law index
Employment law index
Employment law index
Employment law index
Common Law -0.13*** -0.12*** -0.11*** -0.08***
(0.02) (0.02) (0.02) (0.02)
N 188 172 161 131
R2 0.29 0.28 0.29 0.23
Panel B ILO Inspection Convention
ILO Inspection Convention
ILO Inspection Convention
ILO Inspection Convention
Common Law -0.84*** -0.86*** -0.76*** -0.68***
(0.17) (0.18) (0.18) (0.20)
N 205 172 161 131
R2 0.15 0.21 0.19 0.17
Sample All Sample A Sample B Sample C
Notes: OLS cross-country regressions. The dependent variables are de jure employment index in Panel A, and signature of ILO inspection conventions No. 81 and 129 in Panel B. Common Law is an indicator equal to one if the country has a common law legal tradition and 0 otherwise. Robust standard errors are in parentheses. Column 1 includes all countries; Column 2 only includes countries with data for de jure employment index, labor inspectors and fines (Sample A); Column 3 excludes from sample A colonizers (sample B); and Column 4 excludes from sample B countries with less than one million people in 2011 (sample C). All models control for log GDP per capita, urbanization rate, country size and population in 2011. *** Statistically significant at the 0.01 level.
As a supplement, and in the same spirit, we also consider the signing of ILO conventions
regarding labor inspection. This is, of course, a declaration of intention, not a measure of actual
enforcement efforts. The variable ILO Inspection Convention takes a value from 0 to three. It is
equal to three if the country signed convention No. 129 (i.e., labor inspection in agriculture) and
both parts of convention No. 81 (i.e., labor inspection in the industrial and service sector). The
results are in Panel B Table 4. Consistent with the legal origin theory, civil law countries signed,
10 Botero et al. (2004) only control for income per capita. We include the additional controls because they affect the nature of the enforcement task, but excluding them does not affect the results in any substantive matter.

15
on average, almost one inspection convention more than common law countries. However, as we
see below, this tells us very little about concrete enforcement efforts.
Panel A and B in Table 5 presents the results using the measures of actual inspection
resources and activities. In columns 1 and 2 the dependent variable is the number of inspectors
and inspections per worker. Column 1 includes all countries and column 2 excludes countries
with a population below one million people. Although the results are imprecise, they suggest
that, contrary to the legal origin theory, civil law countries tend to enforce less, not more.
Common law countries have about five inspectors more per 100,000 workers, but the difference
becomes close to zero when the smallest countries are excluded from the analysis. Common law
countries also conduct more inspections per worker, but in this case the difference is higher when
the sample is restricted to larger countries.
Table 5. Legal Origin and Labor Inspection Resources and Activities
(1) (2) (3) (4) (5) (6)
Panel A Inspector per
worker Inspector per
worker
Inspector per worker-
regulation
Inspector per worker-
regulation
Inspector per worker-
regulation
Inspector per worker-
regulation
Common Law 5.88*** 0.68 5.75*** 5.85*** 6.04*** 2.13*
(2.18) (1.06) (1.97) (2.04) (2.13) (1.18)
N 196 152 182 172 161 131
R2 0.19 0.41 0.15 0.15 0.16 0.25
Panel B Inspections per worker
Inspections per worker
Inspections per worker-regulation
Inspections per worker-regulation
Inspections per worker-regulation
Inspections per worker-regulation
Common Law 8.07 37.88* 33.42** 35.78** 36.1** 46.22**
(23.2) (20.7) (16.0) (16.7) (17.2) (19.55)
N 130 112 127 119 110 95
R2 0.14 0.26 0.23 0.24 0.26 0.32
Sample All Pop > 1 million
All Sample A Sample B Sample C
Notes: OLS cross-country regressions. The dependent variables are: inspector (inspections) per worker in columns 1-2 panel A (B); and inspector (inspections) per worker-regulation in columns 3-6 panel A (B). Common Law is an indicator equal to one if the country has a common law legal tradition and 0 otherwise. All models control for log GDP per capita, urbanization rate, country size and population in 2011. Sample A only includes countries with data for de jure employment index, labor inspectors and fines; sample B excludes colonizers; and sample C excludes countries with less than one million people in 2011. Robust standard errors are in parentheses. * Statistically significant at the 0.10 level, ** at the 0.05 level, *** at the 0.01 level.

16
These results, however, underestimate the positive correlation between common law and
inspections because they do not take into account differences across countries in the nature of the
task. In a number of common law countries (i.e., Bangladesh, India, Malaysia, Nepal and
Pakistan) the labor code explicitly excludes smaller firms. Labor inspectors therefore only have
to cover the portion of the workforce employed in large firms, which in some of these countries
is quite small. Second, common law countries tend to regulate fewer aspects of the employment
relationship, and therefore labor inspectors have a lighter workload. Again, ignoring differences
in the nature of the enforcement task across countries tends to underestimate enforcement efforts
in common law countries. Therefore, a more adequate measure to test whether civil law countries
enforce more would be the number of inspectors per legally covered worker (or firm), and per
regulation. We attempt to approximate this concept using the total labor force times the number
of employment regulations as the denominator, and construct the variables Inspectors per
worker-regulation and Inspections per worker-regulation. Columns 3 to 6 present the results
using inspector and inspection per worker-regulation as the dependent variable. The positive
correlation between common law and labor inspection, as expected, becomes stronger.
Table 6 presents the results for de jure penalties in case of a minimum wage violation.
Each column represents a different dependent variable (i.e., financial fine, prison term, and total
penalty under the three alternative scenarios), and Table 7 presents the results using the medium
total penalty as dependent variable for the different samples of countries. The results indicate
that common law countries set higher penalties, both financial and criminal.

17
Table 6. Legal Origin and de Jure Penalties
(1) (2) (3) (4) (5) (6)
Panel A Min Financial
Fine
Max Financial
Fine
Medium
Financial Fine
Max
Imprisonment
Min Total
Penalty
Max Total
Penalty
Common Law
257*** 2,908* 1,371** 0.57*** 1,763** 63,624**
(96) (1,555) (616) (0.18) (745) (28,846)
N 187 187 187 187 187 187
R2 0.17 0.22 0.21 0.09 0.10 0.09
Sample All All All All All All
Notes: OLS cross-country regressions. The dependent variables are measures of de jure penalties in case of violation of the minimum wage. All variables refer to 2011 and are in measured in US$ using the official exchange rate (except for maximum imprisonment, which is measured in years). Common Law is an indicator equal to one if the country has a common law legal tradition and 0 otherwise. All models control for log GDP per capita, urbanization rate, country size and population in 2011. Robust standard errors are in parentheses. * Statistically significant at the 0.10 level, ** at the 0.05 level, *** at the 0.01 level.
Table 7. Legal Origin and de Jure Medium Total Penalty
(1) (2) (3) (4)
Medium Total Penalty
Medium Total Penalty
Medium Total Penalty
Medium Total Penalty
Common Law
20,312** 25,805** 25,158** 28,059**
(9,066) (10,966) (11,169) (13,866)
N 187 172 161 131
R2 0.09 0.12 0.13 0.14
Sample All Sample A Sample B Sample C
Notes: OLS cross-country regressions. The dependent variable is the medium total penalty in case of violation of the minimum wage. It refers to 2011 and is measured in U$ using the official exchange rate. Common Law is an indicator equal to one if the country has a common law legal tradition and 0 otherwise. All models control for log GDP per capita, urbanization rate, country size and population in 2011. Sample A only includes countries with data for de jure employment index, labor inspectors and fines; sample B excludes colonizers; and sample C excludes countries with less than one million people in 2011. Robust standard errors are in parentheses. ** Statistically significant at the 0.05 level.
As mentioned above, however, there is a lack of data about the actual implementation of
penalties, which raises the following concern: what if countries with a civil law legal tradition
are more likely to effectively penalize labor violations and collect fines from non-compliers
18
compared to common law countries? In that case, the results could even reverse. Although there
is very little research on this matter, Piore and Schrank (2008: 4) suggest the contrary. Labor
inspectors in the former colonies of France, Portugal or Spain “hope to coach, coax and, only
occasionally, coerce firms into compliance with the letter and the spirit of the law.” In what the
authors call the “Latin model” of labor inspection, the approach is more pedagogical, less
punitive than in the Anglo-American model.
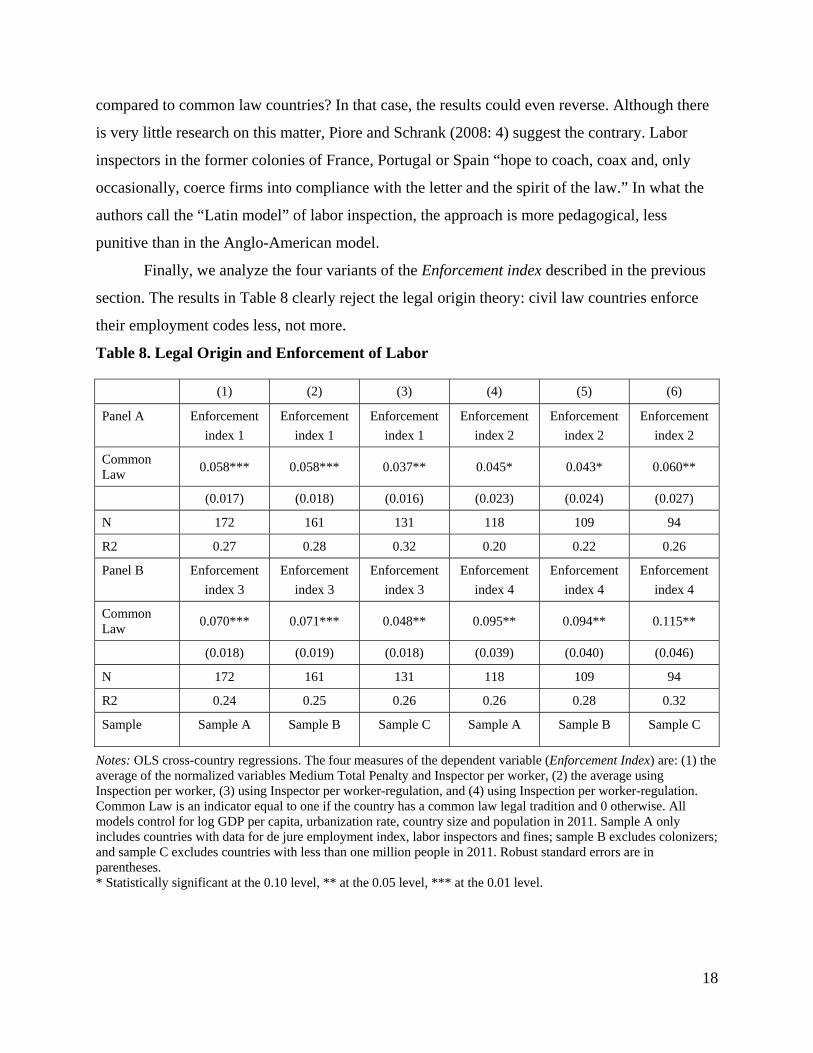
Finally, we analyze the four variants of the Enforcement index described in the previous
section. The results in Table 8 clearly reject the legal origin theory: civil law countries enforce
their employment codes less, not more.
Table 8. Legal Origin and Enforcement of Labor
(1) (2) (3) (4) (5) (6)
Panel A Enforcement
index 1
Enforcement
index 1
Enforcement
index 1
Enforcement
index 2
Enforcement
index 2
Enforcement
index 2
Common Law
0.058*** 0.058*** 0.037** 0.045* 0.043* 0.060**
(0.017) (0.018) (0.016) (0.023) (0.024) (0.027)
N 172 161 131 118 109 94
R2 0.27 0.28 0.32 0.20 0.22 0.26
Panel B Enforcement
index 3
Enforcement
index 3
Enforcement
index 3
Enforcement
index 4
Enforcement
index 4
Enforcement
index 4
Common Law
0.070*** 0.071*** 0.048** 0.095** 0.094** 0.115**
(0.018) (0.019) (0.018) (0.039) (0.040) (0.046)
N 172 161 131 118 109 94
R2 0.24 0.25 0.26 0.26 0.28 0.32
Sample Sample A Sample B Sample C Sample A Sample B Sample C
Notes: OLS cross-country regressions. The four measures of the dependent variable (Enforcement Index) are: (1) the average of the normalized variables Medium Total Penalty and Inspector per worker, (2) the average using Inspection per worker, (3) using Inspector per worker-regulation, and (4) using Inspection per worker-regulation. Common Law is an indicator equal to one if the country has a common law legal tradition and 0 otherwise. All models control for log GDP per capita, urbanization rate, country size and population in 2011. Sample A only includes countries with data for de jure employment index, labor inspectors and fines; sample B excludes colonizers; and sample C excludes countries with less than one million people in 2011. Robust standard errors are in parentheses. * Statistically significant at the 0.10 level, ** at the 0.05 level, *** at the 0.01 level.

19
Overall, the evidence indicates that the relationship between legal tradition and effective
labor regulation is mixed. On the one hand, former colonies of France, Spain, and the other
continental Europe colonizers presently have more stringent de jure labor regulations than former
British colonies, as the legal origin theory predicts. On the other hand, they enforce less. These
results suggest, at the very least, that a more nuanced version of the legal origin theory is needed.
4. Employment Regulation and Labor Market Outcomes
In the last part of Botero et al.’s (2004) paper, the authors regress the employment law
index on eight labor market outcomes: size of the unofficial economy, employment in the
unofficial economy, male/female participation in labor force, total unemployment, youth
male/female unemployment, and wages of machine operators over wages of clerks (as a proxy of
the relative wages of protected and unprotected workers). They run OLS cross country
regressions and only control for average years of schooling. They find a statistically significant
correlation in four cases: More stringent employment law is positively correlated with total
unemployment, youth male and youth female unemployment, and negatively correlated with
male participation in the labor force. Based on their finds they conclude “heavier regulation of
labor has adverse consequences for labor force participation and unemployment, especially the
young” (page 1379). 11
There are a number of potential problems when interpreting these cross country
correlations as causal effects. One of them is that they do not control for enforcement. As the
theory of the firm suggests, employers react not only to the letter of the law, but also to the
expected fine in case of noncompliance (for a formal model see Basu et al. 2010). How could we
credibly measure the effects of employment regulation if we only consider the letter of the law
ignoring the possibility that enforcement is lower in those places where the law is more
stringent? These are not purely hypothetical questions. As noted earlier, noncompliance with
labor regulations is widespread, particularly in developing countries, and at the same time, those
countries tend to have the most stringent regulations. As shown above, countries with more
11 For other cross-country studies which only look at the letter of the law, see Djankov and Ramalho (2009), Galli and Kucera (2004), and Feldmann (2009). As noted earlier, Besley and Burgess (2004) studies the consequences within-India cross-state variation in de jure labor regulation, and has been very influential in the development literature.

20
stringent labor codes tend to enforce less, suggesting that cross country estimates that only
consider the letter of the law are likely to provide biased estimates of the effects of labor
regulations on labor market outcomes.
We show below that the results in Botero et al. (2004) tend to disappear once we control
for enforcement. We begin with replication, by using the same sample of countries, the same
outcomes and the same measure of employment law stringency as in Botero et al.’s paper. That
is, a maximum of 85 countries, and measures of labor outcomes and regulation for the 1990’s.
The coefficients in panel A Table 9 are identical to those in page 1376-1377 in Botero et al.’s
paper. They show that countries with more stringent law tend to have worse outcomes. Panel B
runs the same models but using the enforcement index instead of the de jure index. The
correlations between enforcement and labor market outcomes are usually positive. Countries
with more inspections and higher fines tend to have lower unemployment, a smaller informal
economy, and a smaller wage gap between protected and unprotected workers. Panel C includes
both the employment law index and the enforcement index; and panel D uses instead an Effective
labor regulation index defined as the average of the normalized variables Employment law index
and Enforcement index.
Only one of the correlations in Botero et al. (2004) hold after controlling for
enforcement: More stringent effective regulation is negatively correlated with male labor force
participation. Interestingly, some outcomes go in the opposite direction. Countries with more
enforcement have lower levels of unemployment, particularly among young females. We do not
claim to find causal effects. But we show that, using the same methods, the results of an
influential paper tend to disappear, and in some cases reverse, when enforcement is taken into
account.
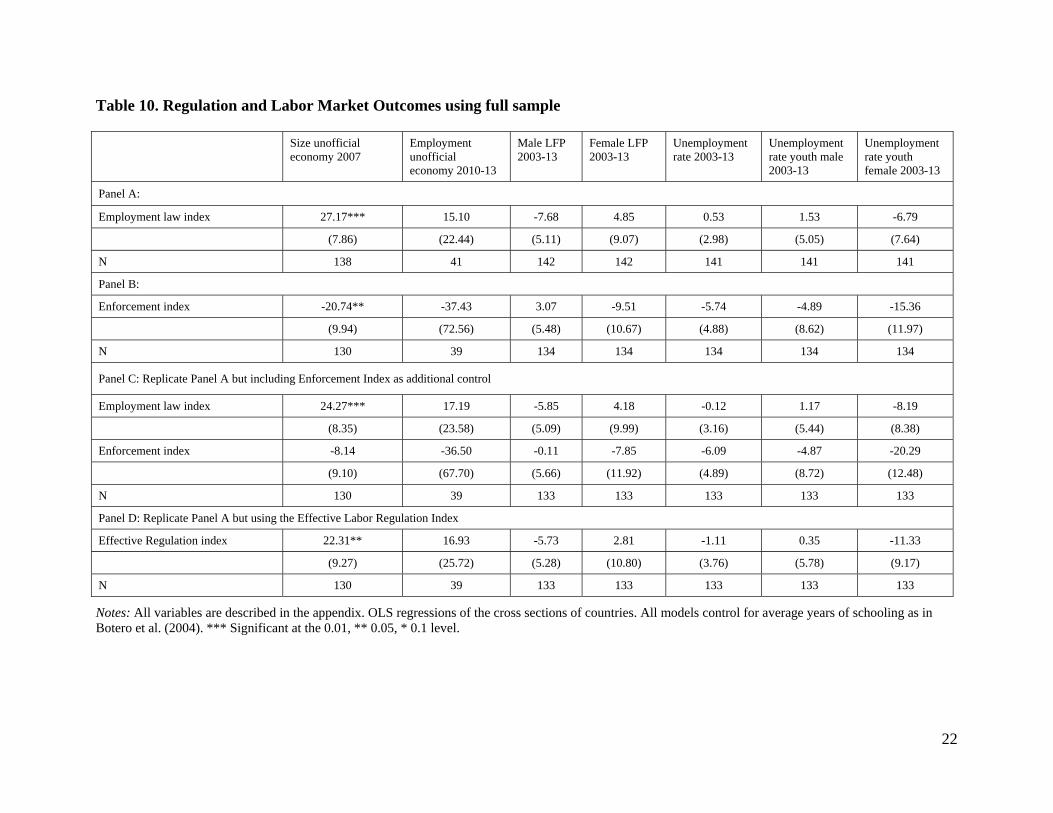
Table 10 presents the estimates running the same specifications (i.e., OLS cross country
regression controlling only for average years of schooling), but using a larger sample of
countries and more actual data. Coefficients are usually statistically insignificant except for a
positive (negative) relationship between the size of the unofficial economy and the letter of the
employment code (enforcement). Overall, these results indicate that there is no clear evidence of
either a positive or a negative correlation across countries between effective labor regulation and
labor market outcomes.

21
Table 9. Regulation and Labor Market Outcomes using Botero et al.’s database
Size unofficial economy 90’s
Employment unofficial economy 90’s
Male LFP 1990-94
Female LFP 1990-94
Unemployment rate 1991-2000
Unemployment rate youth male 1991-2000
Unemployment rate youth female 1991-2000
Wage machine/wage clerks 1990-1999
Panel A: Results shown by Botero et al. (2004) Table VIII page 1376-1377
Employment law index (B) 3.55 -5.28 -6.19*** 10.41 5.76** 14.63*** 18.01*** 0.22
(7.01) (11.79) (1.81) (10.04) (2.85) (4.46) (6.59) (0.15)
N 85 46 78 78 65 52 52 52
Panel B:
Enforcement index -19.58 -74.41 1.16 -16.50 -10.41*** -16.77** -23.85*** -0.52**
(12.47) (70.08) (5.93) (16.53) (3.58) (6.59) (8.03) (0.21)
N 82 44 75 75 63 50 50 50
Panel C: Replicate Panel A but including Enforcement Index as additional control
Employment law index (B) 1.94 -7.64 -6.07*** 6.34 4.15 11.80** 14.15* 0.23
(7.51) (13.40) (1.88) (11.23) (3.09) (4.97) (7.48) (0.16)
Enforcement index -18.46 -88.47 -2.20 -12.98 -7.96* -9.92 -15.65* -0.42**
(12.74) (81.17) (5.39) (18.97) (4.11) (6.91) (9.38) (0.18)
N 82 44 75 75 63 50 50 50
Panel D: Replicate Panel A but using the Effective Labor Regulation Index
Effective Regulation index (B) -0.22 -9.08 -7.39*** 5.41 3.33 10.20 11.36 0.15
(9.40) (17.55) (2.42) (14.61) (4.03) (6.65) (9.88) (0.20)
N 82 44 75 75 63 50 50 50
Notes: All variables are from Botero et al (2004) except for the enforcement index and the effective regulation index. OLS regressions of the cross sections of countries. All models control for average years of schooling as in Botero et al. (2004). *** Significant at the 0.01, ** 0.05, * 0.1 level.
22
Table 10. Regulation and Labor Market Outcomes using full sample
Size unofficial economy 2007
Employment unofficial economy 2010-13
Male LFP 2003-13
Female LFP 2003-13
Unemployment rate 2003-13
Unemployment rate youth male 2003-13
Unemployment rate youth female 2003-13
Panel A:
Employment law index 27.17*** 15.10 -7.68 4.85 0.53 1.53 -6.79
(7.86) (22.44) (5.11) (9.07) (2.98) (5.05) (7.64)
N 138 41 142 142 141 141 141
Panel B:
Enforcement index -20.74** -37.43 3.07 -9.51 -5.74 -4.89 -15.36
(9.94) (72.56) (5.48) (10.67) (4.88) (8.62) (11.97)
N 130 39 134 134 134 134 134
Panel C: Replicate Panel A but including Enforcement Index as additional control
Employment law index 24.27*** 17.19 -5.85 4.18 -0.12 1.17 -8.19
(8.35) (23.58) (5.09) (9.99) (3.16) (5.44) (8.38)
Enforcement index -8.14 -36.50 -0.11 -7.85 -6.09 -4.87 -20.29
(9.10) (67.70) (5.66) (11.92) (4.89) (8.72) (12.48)
N 130 39 133 133 133 133 133
Panel D: Replicate Panel A but using the Effective Labor Regulation Index
Effective Regulation index 22.31** 16.93 -5.73 2.81 -1.11 0.35 -11.33
(9.27) (25.72) (5.28) (10.80) (3.76) (5.78) (9.17)
N 130 39 133 133 133 133 133
Notes: All variables are described in the appendix. OLS regressions of the cross sections of countries. All models control for average years of schooling as in Botero et al. (2004). *** Significant at the 0.01, ** 0.05, * 0.1 level.

23
6. Conclusion
This paper provides, to our knowledge for the first time, measures of enforcement
of labor law across almost every country in the world. The distinction between de jure and
de facto regulation is well understood in theory, but almost never implemented in cross-
country empirical work because of lack of data. As a result, influential papers like the one
by Botero et. al. (2004) published in the Quarterly Journal of Economics, which have
shaped the policy debate by finding strong negative consequences of labor regulation, are
based entirely on measures of de jure stringency of regulations. We show that this neglect
of regulation enforcement matters. There is, on average, a negative correlation between the
stringency of labor regulation and the intensity of its enforcement. The strong results of
Botero et. al. (2004) on the consequences of labor regulation, and those of La Porta et. al
(2008) on the legal origin theory of regulation stringency, no longer hold for effective labor
regulation.
Of course, this paper has its limitations. Our Inspectors and Inspections measures
capture inputs to enforcement, and cannot possibly address the issue of inspectors “turning
a blind eye” to violations or being paid off by violators. Our measures of penalties are
themselves de jure measures calculated from the regulations, and we have further had to
make somewhat heroic assumptions to transform legal penalties into monetary equivalents.
Nevertheless, we believe that our results stand as a strong caution to those who would use
de jure measures of labor law and regulation in studies which in turn lead to strong policy
conclusions on the impact of these laws. Future research should go beyond the letter of the
law and focus on effective regulation. Enforcement matters.

24
References Almeida, R., and P. Carneiro. 2012. “Enforcement of Labor Regulation and Informality.”
American Economic Journal: Applied Economics 4(3): 64-89.
Almeida, R., and L. Ronconi. 2015. “Labor Inspections in the Developing World: Stylized
Facts from the Enterprise Survey.” Industrial Relations (forthcoming).
Amengual, M. 2010. “Complementary Labor Regulation: The Uncoordinated Combination
of State and Private Regulators in the Dominican Republic.” World Development
38(3): 405–14.
Ashenfelter, O., and R. Smith. 1979. “Compliance with the Minimum Wage Law.” Journal
of Political Economy 87(2): 333–350.
Barro, Robert and Jong-Wha Lee. 2010. “A New Data Set of Educational Attainment in the
World, 1950-2010.” Journal of Development Economics, Vol. 104, pp.184-198.
Basu, A., N. Chau and R. Kanbur. 2010. “Turning a Blind Eye: Costly Enforcement,
Credible Commitment and Minimum Wage Laws. Economic Journal
120(543): 244–69.
Besley, Timothy and Robin Burgess. 2004. “Can Labor Regulation Hinder Economic
Performance? Evidence from India.” (with Robin Burgess), Quarterly Journal of
Economics, 19(1), 91-134. February.
Becker, G. 1968. “Crime and Punishment: An Economic Approach.” Journal of Political
Economy 76: 169-217.
Bhorat, H., R. Kanbur and N. Mayet. 2012. “Minimum Wage Violations in South Africa.”
International Labour Review 151(3): 277-287.
Botero, J. et al. 2004. “The Regulation of Labor.” Quarterly Journal of Economics 119(4):
1339–82.
Collier, D., and R. Collier. 1991. Shaping the Political Arena. Princeton, United States:
Princeton University Press.
Cooper, F. 1996. Decolonization and African Society: The Labor Question in French and
British Africa. Cambridge, United States: Cambridge University Press.
Djankov, S., and R. Ramalho. 2009. “Employment Laws in Developing
Countries.” Journal of Comparative Economics 37(1): 3-13.

25
Engerman, S., and K. Sokoloff. 2002. “Factor Endowments, Inequality, and Paths of
Development among New World Economies.” Economia 3(1): 41-88.
Esping-Andersen, G. 1990. The Three Worlds of Welfare Capitalism. Princeton, United
States: Princeton University Press.
Feldmann, H. 2009. “The Unemployment Effects of Labor Regulation around the World.
Journal of Comparative Economics 37(1): 76–90.
Galli, R., and D. Kucera. 2004. “Labor Standards and Informal Employment in Latin
America.” World Development 32(5): 809-828.
Heckman, James and Carmen Pages (Editors). 2004. Law and Employment: Lessons from
Latin America and the Caribbean. Chicago: University of Chicago Press,
La Porta, R., F. López-de-Silanes and A. Shleifer. 2008. “Economic Consequences of
Legal Origin.” Journal of Economic Literature 46: 285-332.
Murillo, M.V., L. Ronconi and A. Schrank. 2011. “Latin American Labor Reforms:
Evaluating Risk and Security.” In: J.A. Ocampo and J. Ross, editors. The Oxford
Handbook of Latin American Economics. Oxford, United Kingdom: Oxford
University Press.
Olson, M. 1965. The Logic of Collective Action. Cambridge, United States: Harvard
University Press.
Piore, M., and A. Schrank. 2008. “Toward Managed Flexibility: The Revival of Labour
Inspection in the Latin World.” International Labour Review 147(1): 1-23.
Pires, R. 2008. “Promoting Sustainable Compliance: Styles of Labour Inspection and
Compliance Outcomes in Brazil.” International Labour Review 147(2–3): 199-229.
Ronconi, L. 2010. “Enforcement and Compliance with Labor Regulations in Argentina.”
Industrial and Labor Relations Review 64(4): 719-36.
Ronconi, L. 2012. “Globalization, Domestic Institutions and Enforcement of Labor Law:
Evidence from Latin America.” Industrial Relations 51(1): 89–105.
Schneider, Friedrich, Andreas Buehn, and Claudio E. Montenegro. "Shadow Economies all
over the World: New Estimates for 162 Countries from 1999 to 2007." World Bank
Policy Research Working Paper Series, Vol (2010).

26
Appendix
Variables Description
Employment Laws
Alternative employment contract
Measures the existence and cost of alternatives to the standard employment contract, computed as the average of (1) a dummy equal to one if fixed-term contracts are prohibited, (2) the normalized maximum duration of fixed-term contracts.
Cost of increasing hours worked
Measures the cost of increasing the number of hours worked, computed as the average of (1) the normalized maximum of working days per week, (2) a dummy equal to one if the workweek for a single worker can be extend to 50 hours per week (including overtime) for 2 months each year to respond to a seasonal increase in production, (3) a dummy equal to one if there are restrictions on night work, (4) a dummy equal to one if there are restrictions on weekly holiday work, (5) the normalized paid annual leave.
Cost of firing workers
Measures the cost of firing 20 percent of the firm’s workers for redundancy. The cost of firing a worker is calculated as the sum of the notice period, severance pay and penalties for a worker with five years of tenure with the firm (except for the penalty which is the average for 1, 5 and 10 years of tenure). If dismissal is illegal, the cost of firing is assumed to be equal to the annual wage. The cost of firing workers is computed as the ratio of new wage bill (defined as the normal wage of the remaining workers and the cost of firing) to the old wage bill.
Dismissal procedures
Measures worker protection against dismissal. It is the average of the following seven dummy variables which equal one if (1) the employer must notify a third party before dismissing one redundant worker, (2) the employer needs the approval of a third party in order to dismiss one redundant worker, (3) the employer must notify or consult a third party prior to a collective dismissal (9 employees), (4) the employer must obtain prior approval from a third party before a collective dismissal, (5) there is a retraining or reassignment obligation before an employer can make a worker redundant, (6) there are priority rules that apply to redundancy dismissals or lay-offs, (7) there are priority rules applying to re-employment.
Minimum wage The normalized ratio of the minimum wage to value added per worker.
Employment law index
Measures the protection of employment laws as the average of the above five variables (1) alternative employment contract, (2) cost of increasing hours worked, (3) cost of firing workers, (4) dismissal procedures, (5) minimum wage. The figures refer to the year 2011. Source: World Bank Doing Business.
Employment law index (B)
Measures the protection of employment laws as of 1997. Source: Botero et al. (2004)
Number of Regulations
It can take values from 0 to 10 and it is the sum of the following ten employment regulations: Is there a minimum wage? (yes=1, no=0); are fixed-term contracts prohibited? (yes=1, no=0); is there a limit to the cumulative duration of fixed-term contracts? (yes=1, no=0); can the workweek for a single worker extend to 50 hours per week? (yes=0, no=1); are there restrictions on night work? (yes=1, no=0); are there restrictions on "weekly holiday" work? (yes=1, no=0); is it legal for the employer to terminate the employment contract on the basis of redundancy? (yes=0, no=1); does the employer need the approval of a third party in order to dismiss one

27
Variables Description redundant worker? (yes=1, no=0); is severance pay for redundancy dismissal after one year of continuous employment compulsory? (yes=1, no=0); is paid annual leave compulsory (yes=1, no=0). The figures refer to the year 2011. Source: World Bank Doing Business report.
Enforcement
Inspector per worker
Number of labor inspectors over the labor force. The data usually refers to the period 2010-2012, but for some countries it includes data since 2000. Sources: Official websites, ILO, US State and Labor department.
Inspection per worker
Number of labor inspections conducted per year over the labor force. The data usually refers to the period 2010-2012, but for some countries it includes data since 2000. Sources: Official websites, ILO, US State and Labor department.
Inspector per worker-regulation
Inspector per worker/Number of regulations
Inspection per worker-regulation
Inspection per worker/Number of regulations
Financial fine
Financial fine as of 2011 in case of noncompliance with the minimum wage assuming: i) the employer is a first-time offender, ii) the offense committed is paying one employee during one month a salary 20 percent below the legal minimum, iii) the employer does not obstruct the work of the inspector, iv) the employer corrects the problem after receiving a notice from the enforcement authority, and v) the employer does not retaliate against the employee. In countries with no minimum wage, we take the penalty that applies to violations of wage provisions. Fines are converted to 2011 US dollars. Source: country legislation and ILO TRAVAIL legal database.
Imprisonment Years in prison as of 2011 that an employer faces in case of violating minimum wage law. Source: country legislation and ILO TRAVAIL legal database.
Low total penalty
Assumes a 10 percent probability of receiving the minimum financial fine and a 5 percent probability of receiving the minimum term in prison The minimum financial fine in countries that do not establish a minimum is assumed to be 50% of the maximum, and the minimum term in prison is 25% of the maximum. We assume one year in prison equals ten times GDP per worker.
Medium total penalty
Assumes a 50 percent probability of receiving a medium financial fine and a 25 percent probability of receiving the medium term in prison The medium financial fine is the average between the minimum and the maximum fine, and the medium term in prison is the average between the minimum and maximum terms. We assume one year in prison equals ten times GDP per worker.
High total penalty
Assumes a 100 percent probability of receiving the maximum financial fine and a 50 percent probability of serving 50 percent of the maximum term in prison. We assume one year in prison equals ten times GDP per worker.
Enforcement Index
The average of the normalized variables Medium total penalty and Inspector per worker.

28
Variables Description
Enforcement Index 2
The average of the normalized variables Medium total penalty and Inspection per worker.
Enforcement Index 3
The average of the normalized variables Medium total penalty and Inspector per worker-regulation
Enforcement Index 4
The average of the normalized variables Medium total penalty and Inspection per worker- regulation
Effective Regulation
The average of the normalized variables Employment law index and Enforcement index.
Effective Regulation (B)
The average of the normalized variables Employment law index (B) and Enforcement index.
ILO Inspection Convention
Number of ILO Inspection Conventions signed by each country as of 2011. Takes a value from 0 to three. It is equal to three if the country signed convention No. 129 (i.e., labor inspection in agriculture) and both parts of convention No. 81 (i.e., labor inspection in the industrial and service sector).
Outcomes
Size of the unofficial economy
Size of the shadow economy as a percentage of GDP. The figures for the nineties are from Botero et al. (2004). The figures for 2007 are from Schneider et al. (2010).
Employment in the unofficial economy
Share of the total employment in the informal sector. The figures for the nineties are from Botero et al. (2004). The figures for 2004-2013 are from ILOSTAT.
Male (female) participation rate in labor force
Male (female) participation rate as a percentage of the total male (female) population aged 15 to 64. The figures for 1990-1994 are from Botero et al. (2004). The figures for 2003-2013 are from World Development Indicators.
Unemployment rate
Unemployment rate as a percentage of the total labor force. The figures for 1991-2000 are from Botero et al. (2004). The figures for 2003-2013 are from World Development Indicators
Unemployment rate male (female) youth
Unemployed males (females) youth as a percentage of the male (female) youth labor force. The figures for 1991-2000 are from Botero et al. (2004). The figures for 2003-2013 are from World Development Indicators.
Wage machine/wage clerks
Ratio of the average wage of machine operators across industries to the average wage of clerks and workers in craft and related trades. The figures are for 1990-1999 and from Botero et al. (2004).
Other variables
Common Law Legal origin of the code of each country. Takes a value equal to one if it is common law. Source: La Porta, López-de-Silanes and Shleifer (2008).
Log of GDP per capita
Natural logarithm of GDP per capita in 2011, PPP, express in constant 2005 international $. Source: World Development Indicators.

29
Variables Description
Population Total population in 2011. Source: World Development Indicators.
Urbanization Share of the total population in urban areas in 2011. Source: World Development Indicators.
Country Size Land area in squared kilometers in 2011. Source: World Development Indicators.
Average years of schooling
Years of schooling of the population aged over 25. The figures for 1995-2000 are from Botero et al. (2004). The figures for 2010 are from Barro and Lee (2010).
Notes: This table presents brief definitions of the variables used in the paper. All measures of employment law are from the World Bank’s Doing Business 2011. Higher values indicate higher worker protection. All dummy variables are equal to one or zero; all normalized variables lie between 0 and 1 where 0 (1) is the minimum (maximum) value in the sample. Measures of inspection are from governments’ websites, from reports produced by the International Labor organization (ILO), the U.S. Department of Labor, and the U.S. State Department.

WP No Title Author(s)
OTHER A.E.M. WORKING PAPERS
Fee(if applicable)
Of Consequentialism, its Critics, and theCritics of its Critics
Kanbur. R2016-02
Specification of spatial-dynamic externalitiesand implications for strategic behavior indisease control
Atallah, S., Gomez, M. and J. Conrad2016-01
Networked Leaders in the Shadow of theMarket - A Chinese Experiment in AllocatingLand Conversion Rights
Chau, N., Qin, Y. and W. Zhang2015-13
The Impact of Irrigation Restrictions onCropland Values in Nebraska
Savage, J. and J. Ifft2015-12
The Distinct Economic Effects of the EthanolBlend Wall, RIN Prices and Ethanol PricePremium due to the RFS
de Gorter, H. and D. Drabik2015-11
Minimum Wages in Sub-Saharan Africa: APrimer
Bhorat, H., Kanbur, R. and B. Stanwix2015-10
Optimal Taxation and Public Provision forPoverty Reduction
Kanbur, R., Pirttilä, J., Tuomala, M. andT. Ylinen
2015-09
Management Areas and Fixed Costs in theEconomics of Water Quality Trading
Zhao, T., Poe, G. and R. Boisvert2015-08
Food Waste: The Role of Date Labels,Package Size, and Product Category
Wilson, N., Rickard, B., Saputo, R. and S.Ho
2015-07
Education for Climate Justice Kanbur, R.2015-06
Dynastic Inequality, Mobility and Equality ofOpportunity
Kanbur, R. and J.E. Stiglitz2015-05
The End of Laissez-Faire, The End of History,and The Structure of Scientific Revolutions
Kanbur, R.2015-04
Assessing the Economic Impacts of FoodHubs to Regional Economics: a frameworkincluding opportunity cost
Jablonski, B.B.R., Schmit, T.and D. Kay2015-03
Does Federal crop insurance Lead to higherfarm debt use? Evidence from the AgriculturalResource Management Survey
Ifft, J., Kuethe, T. and M. Morehart2015-02
Paper copies are being replaced by electronic Portable Document Files (PDFs). To request PDFs of AEM publications, write to (be sure toinclude your e-mail address): Publications, Department of Applied Economics and Management, Warren Hall, Cornell University, Ithaca, NY14853-7801. If a fee is indicated, please include a check or money order made payable to Cornell University for the amount of yourpurchase. Visit our Web site (http://dyson.cornell.edu/research/wp.php) for a more complete list of recent bulletins.