Embed Size (px)
Citation preview
EnergyPlus Testing with HVAC BESTEST Part 1 - Tests E100 to E200 EnergyPlus Version 1.2.1.012
October 2004
Ernest Orlando Lawrence Berkeley National Laboratory Berkeley, California
for
U.S. Department of Energy Office of the Building Technologies Program Energy Efficiency and Renewable Energy Washington, D.C.
Prepared by:
Robert H. Henninger and Michael J. Witte
GARD AnalyticsEnergy, Economic and Environmental Research
y
1028 Busse Highway Park Ridge, Illinois 60068 USA www.gard.com

Table of Contents Section Page
1 TEST OBJECTIVES AND OVERVIEW .................................................................................. 1
1.1 Test Type: Analytical and Comparative - HVAC ............................................................ 1 1.2 Test Suite: IEA HVAC BESTEST................................................................................... 1
1.2.1 Case E100 – Base Case Building and Mechanical System............................... 2 1.2.2 Dry Zone and Wet Zone Series (Cases E110 – E200) ...................................... 3 1.2.3 Weather Data .................................................................................................... 3 1.2.4 Simulation and Reporting Period...................................................................... 4
2 MODELER REPORT.................................................................................................................. 7
2.1 Modeling Methodology..................................................................................................... 7 2.2 Modeling Assumptions ..................................................................................................... 8
2.2.1 Thermostat Control ........................................................................................... 8 2.2.2 DX Coil Curve Fits ........................................................................................... 8
2.3 Modeling Options............................................................................................................ 10 2.4 Modeling Difficulties ...................................................................................................... 10
2.4.1 Weather Data .................................................................................................. 10 2.4.2 Building Envelope Construction..................................................................... 11 2.4.3 Indoor Fan....................................................................................................... 11 2.4.4 Compressor and Condenser Fan Breakout...................................................... 12
2.5 Software Errors Discovered and/or Comparison Between Different Versions of the Same Software – Round 1..................................................................................... 12
2.6 Results – Round 1 ........................................................................................................... 12 2.7 Software Errors Discovered and/or Comparison Between Different Versions
of the Same Software – Round 2..................................................................................... 13 2.8 Results – Round 2 ........................................................................................................... 14 2.9 Software Errors Discovered and/or Comparison Between Different Versions
of the Same Software – Round 3..................................................................................... 14 2.10 Results – Round 3 ........................................................................................................... 15 2.11 Software Errors Discovered and/or Comparison Between Different Versions
of the Same Software – Round 4..................................................................................... 16 2.12 Results – Round 4 ........................................................................................................... 18 2.13 Comparison of Changes that Occurred with Early Versions of EnergyPlus................... 20 2.14 Results with Subsequent Releases of EnergyPlus........................................................... 25
3 RESULTS AND DISCUSSION................................................................................................. 31
4 CONCLUSIONS......................................................................................................................... 33
5 REFERENCES........................................................................................................................... 35
Testing with HVAC BESTEST iii October 2004

Table of Contents Section Page
APPENDIX A CHARTS COMPARING ENERGYPLUS RESULTS WITH
OTHER WHOLE BUILDING ENERGY SIMULATION PROGRAMS
APPENDIX B ENERGYPLUS DISCUSSION EXCERPTED FROM HVAC BESTEST FINAL REPORT, (NEYMARK & JUDKOFF 2002)
APPENDIX C ENERGYPLUS PROGRAM CHARACTERISTICS SUMMARY “PROFORMA” AS PREPARED FOR HVAC BESTEST FINAL REPORT (NEYMARK & JUDKOFF 2002)
Testing with HVAC BESTEST iv October 2004

1 TEST OBJECTIVES AND OVERVIEW
1.1 Test Type: Analytical and Comparative - HVAC
The International Energy Agency (IEA) HVAC BESTEST contains a set of analytical tests as well as a set of comparative results from seven other whole building simulation programs that participated in the IEA project. Analytical tests compare a program’s results to mathematical solutions for simple cases. This is an excellent method to use for assessing the accuracy of results since there is only one solution for the case analyzed given the boundary conditions. Comparative tests compare a program to itself or to other simulation programs. Both types of testing accomplish results on two different levels, both validation and debugging. Validation is accomplished when the results of the test program compare favorably with the analytical results. Debugging is accomplished when the results for certain cases do not compare favorably with the analytical results and then through systematic checking it is determined that the source of the difference is due to an input error, a modeling inconsistency or flaw in the program logic.
1.2 Test Suite: IEA HVAC BESTEST
The tests described in International Energy Agency (IEA) Solar Heating and Cooling Programme Task 22 Building Energy Simulation Test and Diagnostic Method for HVAC Equipment Models (HVAC BESTEST), Volume 1: Cases E100 – E200, (Neymark & Judkoff 2001) were performed using the EnergyPlus program. Final comparison results for all programs that participated in the IEA project are reported in an NREL report by the same name as above but with a January 2002 publish date (Neymark & Judkoff 2002).
As stated in its Introduction, the IEA HVAC BESTEST report “documents an analytical verification and comparative diagnostic procedure for testing the ability of whole building simulation programs to model the performance of unitary space cooling equipment that is typically modeled using manufacturer design data presented in the form of empirically derived performance maps. The report also includes results from simulation programs that were used for field trials of the test procedure.”
The following tests were performed with EnergyPlus as specified in the HVAC BESTEST User’s Manual:
• Case E100 – Base Case Building and Mechanical System
• Additional Dry Coil Test Cases (Cases E110, E120, E130, E140, as described in Sections 1.3.2 & 1.3.3 of Manual)
• Humid Zone Test Cases (Cases E150, E160, E165, E170, E180, E185, E190, E195, E200, as described in Section 1.3.4 of Manual)
Testing with HVAC BESTEST 1 October 2004

1.2.1 Case E100 – Base Case Building and Mechanical System
The basic test building (Figure 1) is a rectangular 48 m2 single zone (8 m wide x 6 m long x 2.7 m high) with no interior partitions and no windows. The building is intended as a near-adiabatic cell with cooling load driven by user specified internal gains. Material properties are described below. For further details refer to Section 1.3.2.1 of the HVAC BESTEST User’s Manual.
Figure 1 Base Building (Case E100) - Isometric View of Southeast Corner
Wall, Roof and Floor Construction:
Element k Thickness U R (W/m-K) (m) (W/m2-K) (m2-K/W)
Int. Surface Coeff. 8.290 0.121 Insulation 0.010 1.000 0.010 100.000 Ext. Surface Coeff. 29.300 0.034
Overall, air-to-air 0.010 100.155
Opaque Surface Radiative Properties:
Interior Surface Exterior Surface Solar Absorptance 0.6 0.1
Infrared Emittance 0.9 0.9
Infiltration: None
Internal Load: 5400 W sensible, continuous, 100% convective; no latent load
Mechanical System: Simple unitary vapor compression cooling system with air cooled condenser and indoor evaporator coil, 100% convective air system, no outside air or exhaust air,
Testing with HVAC BESTEST 2 October 2004

single speed, draw-through air distribution fan, indoor and outdoor fans cycle on/off with compressor, no cylinder unloading, no hot gas bypass, crankcase heater and other auxiliary energy = 0. Performance characteristics at ARI rating conditions of 35.0°C outdoor dry-bulb, 26.7°C cooling coil entering dry-bulb and 19.4°C cooling coil entering wet-bulb are:
Net Total Capacity 7852 W Airflow 0.425 m3/s Apparatus Dew Point 13.8 °C Compressor Power 1858 W Indoor Fan Power 230 W Outdoor Fan Power 108 W COP 3.62 Seasonal COP 3.78
There is a non-proportional-type thermostat, heat always off, cooling on if zone air temperature >22.2°C and heat extraction rate is assumed to equal the maximum capacity of the equipment for the hour’s environmental conditions. For further specifications and equipment’s full-load and part load performance map, see Section 1.3.2.2 and Tables 1-6 in HVAC BESTEST User’s Manual.
1.2.2 Dry Zone and Wet Zone Series (Cases E110 – E200)
The 13 other cases represent a set of fundamental mechanical equipment tests. These cases test a program’s ability to model unitary space cooling equipment performance under controlled load and weather conditions. Given the underlying physical assumptions in the case definitions, there is a mathematically provable and deterministic solution for each case. The results of analytical solutions are included in the IEA/NREL report. Only the following parameters are varied to develop the remaining test cases:
• Internal sensible gains
• Internal latent gains
• Thermostat setpoint (indoor dry-bulb temperature)
• Outdoor dry-bulb temperature.
Table 1 summarizes how these parameters are varied for all of the test cases modeled.
1.2.3 Weather Data
Four three-month long (January – March) TMY format weather files were provided with the test suite designated as follows with the numeric code representing the outdoor dry-bulb temperature (without the decimal) used in the weather file:
HVBT294.TMY HVBT350.TMY
Testing with HVAC BESTEST 3 October 2004

HVBT406.TMY HVBT461.TMY
The only parameter that is different for each weather file is the ambient dry-bulb temperature; all other data is the same for each weather file.
1.2.4 Simulation and Reporting Period
Simulations for all cases were run for a three month period. The first month of the simulation period (January) served as an initialization period. The output results reported were for the second month of the simulation (February).
Testing with HVAC BESTEST 4 October 2004

Table 1 HVAC BESTEST Case Descriptions
Zone Weather
Internal Gains Setpoint
Case # Sensible
(W) Latent (W)
EDB (C)
ODB (C) Comments
Dry Zone Series E100 5400 0 22.2 46.1 Base Case, dry coil. High PLR.
E110 5400 0 22.2 29.4 High PLR. Tests low ODB versus E100
E120 5400 0 26.7 29.4 High PLR. Tests high EDB versus E110.
Tests ODB & EDB interaction vs. E100 E130 270 0 22.2 46.1 Low PLR test versus E100
E140 270 0 22.2 29.4 Tests ODB at low PLR vs. E130
Tests PLR at low ODB vs. E110 Humid Zone Series E150 5400 1100 22.2 29.4 High PLR. High SHR.
Tests latent load versus E110. E160 5400 1100 26.7 29.4 High PLR. High SHR.
Tests EDB versus E150. E165 5400 1100 23.3 40.6 High PLR. High SHR.
Tests ODB & EDB interaction with latent load vs. E160.
E170 2100 1100 22.2 29.4 Mid PLR. Mid SHR. Tests low sensible load versus E150.
E180 2100 4400 22.2 29.4 High PLR. Low SHR. Tests SHR versus E150. Tests high latent load vs. E170.
E185 2100 4400 22.2 46.1 High PLR. Low SHR. Tests ODB versus E180.
E190 270 550 22.2 29.4 Low PLR. Low SHR. Tests low PLR at constant SHR vs. E180. Tests latent load at low PLR versus E140
E195 270 550 22.2 46.1 Low PLR. Low SHR. Tests ODB at low PLR & SHR vs. E190. Tests low PLR at constant SHR vs. E185. Tests latent load at low PLR vs. E130.
Full load test at ARI conditions E200 6120 1817 26.7 35.0 Tests for ARI indoor wet-bulb temperature
at full sensible and latent loads. Abbreviations: PLR = part load ratio; ODB = outdoor dry-bulb temperature; EDB = cooling coil entering dry-bulb temperature; SHR = sensible heat ratio ARI = Air Conditioning and Refrigeration Institute
Testing with HVAC BESTEST 5 October 2004

Testing with HVAC BESTEST 6 October 2004

2 MODELER REPORT
The material included in this section is a slightly revised copy of the Modeler Report which was prepared by GARD Analytics at NREL’s request for inclusion in their final report to the International Energy Agency (IEA) Tool Evaluation and Improvement Experts Group. It documents the modeling approach taken to simulate the HVAC BESTEST cases using EnergyPlus. Several iterations occurred during which the input models were fine tuned, bugs were found in EnergyPlus and software changes were made. This Modeler Report was written to chronicle these experiences and demonstrate how the HVAC BESTEST test suite can be used in the development of whole building energy analysis software.
2.1 Modeling Methodology
For modeling of the simple unitary vapor compression cooling system, the EnergyPlus Window Air Conditioner model was utilized. No other DX coil cooling system was available at the time that this work began, but others have been added since then. The Window Air Conditioner model consists of three modules for which specifications can be entered: DX cooling coil, indoor fan and outside air mixer. The outside air quantity was set to 0.0. The DX coil model is based upon the DOE-2.1E DX coil simulation algorithms with modifications to the coil bypass factor calculations.
The building envelope loads and internal loads are calculated each hour to determine the zone load that the mechanical HVAC system must satisfy. The DX coil model then uses performance information at rated conditions along with curve fits for variations in total capacity, energy input ratio and part load fraction to determine performance at part load conditions. Sensible/latent capacity splits are determined by the rated sensible heat ratio (SHR) and the apparatus dewpoint/bypass factor approach.
Five performance curves are required:
1) The total cooling capacity modifier curve (function of temperature) is a bi-quadratic curve with two independent variables: wet bulb temperature of the air entering the cooling coil, and dry bulb temperature of the air entering the air-cooled condenser. The output of this curve is multiplied by the rated total cooling capacity to give the total cooling capacity at specific temperature operating conditions (i.e., at temperatures different from the rating point temperatures).
2) The total cooling capacity modifier curve (function of flow fraction) is a quadratic curve with the independent variable being the ratio of the actual air flow rate across the cooling coil to the rated air flow rate (i.e., fraction of full load flow). The output of this curve is multiplied by the rated total cooling capacity and the total cooling capacity modifier curve (function of temperature) to give the total cooling capacity at the specific temperature and air flow conditions at which the coil is operating.
Testing with HVAC BESTEST 7 October 2004

3) The energy input ratio (EIR) modifier curve (function of temperature) is a bi-quadratic curve with two independent variables: wet bulb temperature of the air entering the cooling coil, and dry bulb temperature of the air entering the air-cooled condenser. The output of this curve is multiplied by the rated EIR (inverse of the rated COP) to give the EIR at specific temperature operating conditions (i.e., at temperatures different from the rating point temperatures).
4) The energy input ratio (EIR) modifier curve (function of flow fraction) is a quadratic curve with the independent variable being the ratio of the actual air flow rate across the cooling coil to the rated air flow rate (i.e., fraction of full load flow). The output of this curve is multiplied by the rated EIR (inverse of the rated COP) and the EIR modifier curve (function of temperature) to give the EIR at the specific temperature and airflow conditions at which the coil is operating.
5) The part load fraction correlation (function of part load ratio) is a quadratic curve with the independent variable being part load ratio (sensible cooling load / steady-state sensible cooling capacity). The output of this curve is used in combination with the rated EIR and EIR modifier curves to give the “effective” EIR for a given simulation time step. The part load fraction correlation accounts for efficiency losses due to compressor cycling. In the earlier versions of EnergyPlus, this correction could only be applied to the condensing unit power, but a revision was made to also allow a part load correction for the indoor fan (see Round 4 discussion).
The DX coil model as implemented in EnergyPlus does not allow for simulation of the cooling coil bypass factor characteristics as called out in the specification.
2.2 Modeling Assumptions
2.2.1 Thermostat Control
Ideal thermostat control was assumed with no throttling range.
2.2.2 DX Coil Curve Fits
Since EnergyPlus utilizes a DX coil model very similar to that used in DOE-2, the performance curves initially used in EnergyPlus were identical to those used in DOE-2. Joel Neymark, who provided the DOE-2 modeling support for HVAC BESTEST, kindly provided us with a copy of the DOE-2 input files that he used for performing the DOE-2 analysis. Provided with the matrix of performance data in English units for each of the curves, we converted the temperature input variables to metric units and reran DOE-2 to get the curve fit coefficients. (This shortcut on the curves was done in order to save some time. New curve coefficients were developer later, see Round 4.) The resulting coefficients used for the initial runs are presented below.
1) Total cooling capacity modifier curve (function of temperature) Form: Bi-quadratic curve curve = a + b*wb + c*wb**2 + d*edb + e*edb**2 + f*wb*edb
Testing with HVAC BESTEST 8 October 2004

Independent variables: wet bulb temperature of the air entering the cooling coil, and dry bulb temperature of the air entering the air-cooled condenser.
a = 0.40731210 b = 0.04517144 c = 0.00008412 d = 0.00140582 e = -0.00003830 f = -0.00046771
2) Total cooling capacity modifier curve (function of flow fraction) Form: Quadratic curve curve = a + b*ff + c*ff**2 Independent variables: ratio of the actual air flow rate across the cooling coil to the rated air flow rate (i.e., fraction of full load flow).
Since the indoor fan always operates at constant volume flow, the modifier will be 1.0, therefore:
a = 1.0 b = 0.0 c = 0.0
3) Energy input ratio (EIR) modifier curve (function of temperature) Form: Bi-quadratic curve curve = a + b*wb + c*wb**2 + d*edb + e*edb**2 + f*wb*edb Independent variables: wet bulb temperature of the air entering the cooling coil, and dry bulb temperature of the air entering the air-cooled condenser.
a = 0.72724128 b = -0.02055985 c = 0.00075095 d = 0.01355680 e = 0.00040789 f = -0.00086178
4) Energy input ratio (EIR) modifier curve (function of flow fraction) Form: Quadratic curve curve = a + b*ff + c*ff**2 Independent variables: ratio of the actual air flow rate across the cooling coil to the rated air flow rate (i.e., fraction of full load flow).
Since the indoor fan always operates at constant volume flow, the modifier will be 1.0, therefore:
a = 1.0 b = 0.0 c = 0.0
Testing with HVAC BESTEST 9 October 2004

5) Part load fraction correlation (function of part load ratio) Form: Quadratic curve curve = a + b*ff + c*ff**2 Independent variable: part load ratio (sensible cooling load/steady state sensible cooling capacity)
Part load performance was specified in Figure 1-3 of Volume 1 of the HVAC BESTEST specification, therefore:
a = 0.771 b = -0.229 c = 0.0
2.3 Modeling Options
Throughout the HVAC BESTEST exercise with EnergyPlus, the Window Air Conditioner model was used to simulate the HVAC system. Subsequent to the initial rounds of testing, two new DX system models have been added to EnergyPlus, Furnace:BlowThru:HeatCool and DXSystem:AirLoop. No attempt was made to utilize Furnace:BlowThru:HeatCool since it does not accommodate a draw-thru fan option. DXSystem:AirLoop is a significantly different equipment configuration which has not been tested with this suite.
2.4 Modeling Difficulties
2.4.1 Weather Data
The TMY weather files provided as part of the HVAC BESTEST package are not directly usable by EnergyPlus. In order to create an EnergyPlus compatible weather file, the TMY file was first converted to BLAST format using the BLAST weather processor (WIFE). An EnergyPlus translator was then used to convert the weather data from the BLAST format to EnergyPlus format.
Table 1-2 of HVAC BESTEST Volume 1 indicates that the ambient dry-bulb and relative humidity should be as follows for the various data sets:
Data Set HVAC BESTEST HVAC BESTEST Dry-Bulb Temp. Relative Humidity
HVBT294.TMY 29.4 C 39% HVBT350.TMY 35.0 C 28% HVBT406.TMY 40.6 C 21% HVBT461.TMY 46.1 C 16%
The converted EnergyPlus weather data set contains slightly different values for ambient relative humidity as indicated below:
Testing with HVAC BESTEST 10 October 2004
Data Set EnergyPlus EnergyPlus Dry-Bulb Temp. Relative Humidity
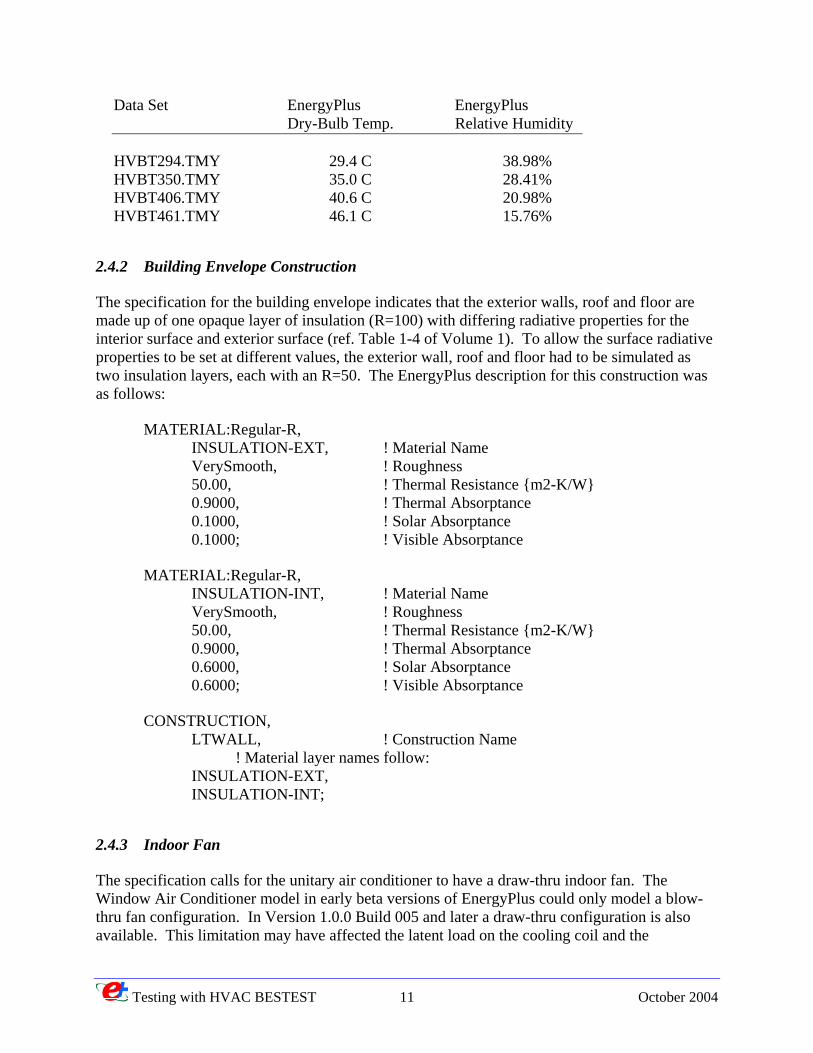
HVBT294.TMY 29.4 C 38.98% HVBT350.TMY 35.0 C 28.41% HVBT406.TMY 40.6 C 20.98% HVBT461.TMY 46.1 C 15.76%
2.4.2 Building Envelope Construction
The specification for the building envelope indicates that the exterior walls, roof and floor are made up of one opaque layer of insulation (R=100) with differing radiative properties for the interior surface and exterior surface (ref. Table 1-4 of Volume 1). To allow the surface radiative properties to be set at different values, the exterior wall, roof and floor had to be simulated as two insulation layers, each with an R=50. The EnergyPlus description for this construction was as follows:
MATERIAL:Regular-R, INSULATION-EXT, ! Material Name VerySmooth, ! Roughness 50.00, ! Thermal Resistance {m2-K/W} 0.9000, ! Thermal Absorptance 0.1000, ! Solar Absorptance 0.1000; ! Visible Absorptance
MATERIAL:Regular-R, INSULATION-INT, ! Material Name VerySmooth, ! Roughness 50.00, ! Thermal Resistance {m2-K/W} 0.9000, ! Thermal Absorptance 0.6000, ! Solar Absorptance 0.6000; ! Visible Absorptance
CONSTRUCTION, LTWALL, ! Construction Name ! Material layer names follow: INSULATION-EXT, INSULATION-INT;
2.4.3 Indoor Fan
The specification calls for the unitary air conditioner to have a draw-thru indoor fan. The Window Air Conditioner model in early beta versions of EnergyPlus could only model a blow-thru fan configuration. In Version 1.0.0 Build 005 and later a draw-thru configuration is also available. This limitation may have affected the latent load on the cooling coil and the
Testing with HVAC BESTEST 11 October 2004

compressor energy consumption in the early results (Round 1 and Round 2), but other issues were also contributing errors at that point. A draw-thru fan was modeled in Round 3 and thereafter.
2.4.4 Compressor and Condenser Fan Breakout
The rated COP required as input by the EnergyPlus DX coil model requires that the input power be the combined power for the compressor and condenser fans. As such, there are no separate input variables or output variables available for the compressor or condenser fan. The only output variable available for reporting in EnergyPlus is the DX coil electricity consumption which includes compressor plus condenser fan.
2.5 Software Errors Discovered and/or Comparison Between Different Versions of the Same Software – Round 1
During the first round of simulations several potential software errors were identified in EnergyPlus Beta Version 5-07:
• Fan electrical power and fan heat were consistently low compared to the analytical results for all tests.
• The reported cooling coil loads were consistently too high and apparently had not been adjusted for the fraction of the time step that the equipment operated, however, the DX coil electricity consumption and actual load delivered to the space were being adjusted appropriately for cycling time.
• For the dry coil cases, the reported sensible coil load was slightly higher than the reported total coil load. Latent load was not available as an output variable, but was calculated by subtracting the sensible from the total. This error caused small negative latent loads to be calculated for the dry coil cases.
• Zone relative humidity was higher for many tests compared to the analytical results, especially for the tests with wet coils. This difference was probably due to simulating a blow-thru configuration rather than the required draw-thru configuration.
Software change requests were posted. Once a new version became available, the tests were rerun.
2.6 Results – Round 1
Results from the first modeling with EnergyPlus Beta 5-07 are presented in Table 2. The evaporator total coil load was too large because cycling during the time step was not accounted for. The negative latent coil loads for cases E100 through E140 result from the reported coil sensible load being greater than the total load.
Testing with HVAC BESTEST 12 October 2004

Table 2 – HVAC BESTEST Results for EnergyPlus Beta 5 Build 07
Supply Condenser Humidity Humidity HumidityCases Total Compressor Fan Fan Total Sensible Latent Total Sensible Latent COP IDB Ratio COP IDB Ratio COP IDB Ratio
(kWh) (kWh) (kWh) (kWh) (kWh) (kWh) (kWh) (kWh) (kWh) (kWh) (°C) (kg/kg) (°C) (kg/kg) (°C) (kg/kg)E100 1517.1 136.5 4210.0 4265.4 -55.4 3653.7 3653.7 0.0 2.41 22.2 0.0075 2.41 22.2 0.0076 2.37 22.2 0.0074E110 1029.8 114.0 4979.6 5036.4 -56.8 3635.2 3635.2 0.0 3.53 22.2 0.0064 3.54 22.2 0.0064 3.48 22.2 0.0063E120 988.3 107.1 5380.0 5455.8 -75.8 3630.2 3630.2 0.0 3.67 26.7 0.0080 3.68 26.7 0.0081 3.62 26.7 0.0079E130 105.0 7.7 4210.8 4267.0 -56.2 206.3 206.3 0.0 1.96 22.2 0.0075 1.97 22.2 0.0076 1.93 22.2 0.0074E140 63.1 5.9 4979.6 5036.9 -57.2 187.8 187.8 0.0 2.98 22.2 0.0064 2.98 22.2 0.0064 2.93 22.2 0.0063E150 1185.1 133.9 5129.7 4328.5 801.2 4374.4 3635.2 739.2 3.69 22.2 0.0083 3.71 22.2 0.0084 3.68 22.2 0.0082E160 1124.0 122.2 5700.6 4821.1 879.6 4369.4 3630.2 739.2 3.89 26.7 0.0101 3.91 26.7 0.0101 3.87 26.7 0.0100E165 1495.7 144.8 4790.6 4053.8 736.8 4385.5 3646.3 739.2 2.93 23.3 0.0093 2.95 23.3 0.0093 2.92 23.3 0.0092E170 622.0 62.0 5492.9 3688.1 1804.9 2156.8 1417.6 739.2 3.47 22.2 0.0106 3.50 22.2 0.0106 3.45 22.2 0.0105E180 1088.1 112.1 6250.7 2138.4 4112.3 4374.4 1417.6 2956.8 4.02 22.2 0.0165 4.09 22.2 0.0165 3.96 22.2 0.0164E185 1570.8 136.4 5182.5 1807.7 3374.8 4392.9 1436.1 2956.8 2.80 22.2 0.0164 2.85 22.2 0.0164 2.75 22.2 0.0162E190 161.5 14.3 6250.7 2217.2 4033.5 557.4 187.8 369.6 3.45 22.2 0.0162 3.52 22.2 0.0163 3.37 22.2 0.0160E195 247.6 17.9 5175.4 1963.8 3211.7 575.9 206.3 369.6 2.33 22.2 0.0158 2.37 22.2 0.0159 2.27 22.2 0.0156E200 1472.6 153.7 5562.7 4380.1 1182.5 5341.1 4120.2 1221.0 3.63 26.7 0.0113 3.65 26.7 0.0114 3.61 26.7 0.0112
February Maximum February MinimumFebruary Totals
Cooling Energy Consumption Evaporator Coil Load Zone Load
February Mean
2.7 Software Errors Discovered and/or Comparison Between Different Versions of the Same Software – Round 2
EnergyPlus Beta 5-14 included changes to fix the following problems which were identified in HVAC BESTEST Round 1:
• Reporting of cooling coil loads were corrected to account for run time during cycling operation.
• The methods of calculating SHR and coil bypass factor were modified to eliminate the problem where the dry coil cases reported sensible coil loads which were slightly higher than the reported total coil loads. This error was causing small negative latent loads to be calculated for the dry coil cases.
During the second round of simulations with EnergyPlus Beta 5-14 the cooling coil error identified during the first round of simulations was corrected to account for cycling during each time step, and this brought the evaporator coil loads closer to the range of results for the other programs; but the loads were still higher than they should be. Another potential error was therefore identified which may have been masked by the coil problem identified in Round 1:
• Although there was excellent agreement for zone total cooling load, the evaporator cooling coil load was larger than the zone cooling load plus fan heat.
• Also, the mean indoor dry bulb for Case E200 moved from 26.7C to 27.1C.
• The other problems identified in Round 1 still remained (low fan power, poor agreement in zone humidity ratio).
Testing with HVAC BESTEST 13 October 2004

2.8 Results – Round 2
Results from the second round of simulations with EnergyPlus Beta 5-14 are presented in Table 3.
Table 3 – HVAC BESTEST Results for EnergyPlus Beta 5 Build 14
Supply Condenser Humidity Humidity HumidityCases Total Compressor Fan Fan Total Sensible Latent Total Sensible Latent COP IDB Ratio COP IDB Ratio COP IDB Ratio
(kWh) (kWh) (kWh) (kWh) (kWh) (kWh) (kWh) (kWh) (kWh) (kWh) (°C) (kg/kg) (°C) (kg/kg) (°C) (kg/kg)E100 1535.8 138.7 3842.1 3842.1 0.0 3653.7 3653.7 0.0 2.38 22.2 0.0074 2.38 22.2 0.0074 2.38 22.2 0.0074E110 1039.6 115.2 3792.2 3792.2 0.0 3635.2 3635.2 0.0 3.50 22.2 0.0062 3.50 22.2 0.0062 3.49 22.2 0.0062E120 1003.0 109.2 3792.0 3792.0 0.0 3630.2 3630.2 0.0 3.62 26.7 0.0078 3.63 26.7 0.0078 3.61 26.7 0.0078E130 106.6 7.8 216.9 216.9 0.0 206.3 206.3 0.0 1.93 22.2 0.0074 1.94 22.2 0.0074 1.93 22.2 0.0074E140 63.8 6.0 195.9 195.9 0.0 187.8 187.8 0.0 2.94 22.2 0.0062 2.95 22.2 0.0062 2.94 22.2 0.0062E150 1197.9 135.6 4589.9 3820.1 769.8 4374.4 3635.2 739.2 3.65 22.2 0.0084 3.67 22.2 0.0084 3.64 22.2 0.0083E160 1139.1 124.1 4587.2 3814.9 772.3 4369.4 3630.2 739.2 3.84 26.7 0.0102 3.86 26.7 0.0102 3.82 26.7 0.0101E165 1513.5 146.9 4620.2 3849.7 770.4 4385.5 3646.3 739.2 2.90 23.3 0.0094 2.92 23.3 0.0094 2.88 23.3 0.0093E170 630.3 62.9 2272.2 1502.4 769.7 2156.8 1417.6 739.2 3.42 22.2 0.0107 3.45 22.2 0.0107 3.40 22.2 0.0106E180 1104.9 114.2 4640.3 1561.5 3078.9 4374.4 1417.6 2956.8 3.96 22.2 0.0166 4.02 22.2 0.0166 3.90 22.2 0.0165E185 1594.9 139.0 4686.1 1607.2 3078.9 4392.9 1436.1 2956.8 2.75 22.2 0.0165 2.81 22.2 0.0165 2.71 22.2 0.0163E190 164.4 14.5 591.1 206.2 384.9 557.4 187.8 369.6 3.39 22.2 0.0163 3.45 22.2 0.0164 3.31 22.2 0.0162E195 251.9 18.2 613.9 229.0 384.9 575.9 206.3 369.6 2.29 22.2 0.0159 2.33 22.2 0.0160 2.23 22.2 0.0157E200 1486.6 155.2 5627.7 4351.7 1276.0 5340.7 4119.7 1221.0 3.59 27.1 0.0116 3.60 27.2 0.0117 3.59 27.0 0.0115
February Maximum February MinimumFebruary Totals
Cooling Energy Consumption Evaporator Coil Load Zone Load
February Mean
2.9 Software Errors Discovered and/or Comparison Between Different Versions of the Same Software – Round 3
The suite of HVAC BESTEST cases were simulated again using EnergyPlus Version 1.0.0.011 (the first public release of Version 1.0, April 2001) which included the following changes from Beta 5-14:
• Modified method for calculating coil outlet conditions.
• Changed to use of Double Precision throughout all of EnergyPlus. (This change was prompted by various issues not related to HVAC BESTEST.)
• Added two output variables for tracking run time Window AC Fan RunTime Fraction Window AC Compressor RunTime Fraction
• Added an output variable for coil latent load.
• Added Draw-Thru Fan option to Window AC.
• The name of the DX coil object was changed from COIL:DX:DOE2 to COIL:DX:BF-Empirical to better represent its algorithmic basis.
Testing with HVAC BESTEST 14 October 2004

In addition, the following input file changes were made :
• Changed from blow-thru fan to draw-thru configuration.
• Updated the DX coil object name to COIL:DX:BF-Empirical.
The following changes in results were observed:
• Indoor fan power consumption and fan heat decreased significantly from Round 2, moving farther below the analytical results.
• Space cooling electricity consumption changed slightly from Round 2 and moved closer to the analytical results.
• Mean indoor humidity ratio decreased compared to Round 2, moving farther away from the analytical results for most of the dry coil cases and moving closer to the analytical results for the wet coil cases.
• Mean indoor dry bulb for Case E200 moved further out of range to 27.5C (the setpoint for this case is 26.7C).
In general, except for fan power and fan heat, the overall EnergyPlus Version 1.0.0.011 results compared much better to the HVAC BESTEST analytical results.
2.10 Results – Round 3
Results from the third round of simulations with EnergyPlus Version 1.0.0.011 are presented in Table 4.
Table 4 – HVAC BESTEST Results for EnergyPlus Version 1.0.0 Build 011
Supply Condenser Humidity Humidity HumidityCases Total Compressor Fan Fan Total Sensible Latent Total Sensible Latent COP IDB Ratio COP IDB Ratio COP IDB Ratio
(kWh) (kWh) (kWh) (kWh) (kWh) (kWh) (kWh) (kWh) (kWh) (kWh) (°C) (kg/kg) (°C) (kg/kg) (°C) (kg/kg)E100 1527.6 132.6 3834.9 3834.9 0.0 3654.1 3654.1 0.0 2.39 22.2 0.0071 2.39 22.2 0.0071 2.39 22.2 0.0071E110 1032.2 109.2 3785.3 3785.3 0.0 3635.6 3635.6 0.0 3.52 22.2 0.0060 3.53 22.2 0.0060 3.52 22.2 0.0060E120 1001.3 104.4 3786.5 3786.5 0.0 3630.5 3630.5 0.0 3.63 26.7 0.0077 3.63 26.7 0.0077 3.62 26.7 0.0077E130 106.3 7.5 217.0 217.0 0.0 206.7 206.7 0.0 1.94 22.2 0.0071 1.95 22.2 0.0071 1.94 22.2 0.0071E140 63.5 5.7 195.9 195.9 0.0 188.2 188.2 0.0 2.96 22.2 0.0060 2.96 22.2 0.0060 2.96 22.2 0.0060E150 1197.5 130.9 4584.5 3815.0 769.5 4374.7 3635.5 739.2 3.65 22.2 0.0082 3.68 22.2 0.0082 3.64 22.2 0.0081E160 1137.3 119.1 4581.3 3809.3 772.1 4369.7 3630.5 739.2 3.84 26.7 0.0100 3.87 26.7 0.0100 3.83 26.7 0.0099E165 1514.9 142.2 4614.7 3844.5 770.2 4385.9 3646.7 739.2 2.90 23.3 0.0092 2.92 23.3 0.0092 2.88 23.3 0.0091E170 631.2 61.0 2270.2 1500.7 769.5 2157.1 1417.9 739.2 3.42 22.2 0.0105 3.45 22.2 0.0105 3.40 22.2 0.0104E180 1100.9 110.8 4636.5 1558.6 3077.9 4374.7 1418.0 2956.8 3.97 22.2 0.0163 4.04 22.2 0.0163 3.92 22.2 0.0162E185 1590.5 135.5 4682.1 1604.2 3077.9 4393.3 1436.5 2956.8 2.76 22.2 0.0161 2.81 22.2 0.0162 2.72 22.2 0.0160E190 164.0 14.1 591.0 206.2 384.8 557.8 188.2 369.6 3.40 22.2 0.0160 3.46 22.2 0.0161 3.33 22.2 0.0158E195 253.3 17.9 613.9 229.2 384.8 576.3 206.7 369.6 2.28 22.2 0.0156 2.32 22.2 0.0156 2.23 22.2 0.0154E200 1479.4 148.4 5621.0 4345.1 1276.0 5340.7 4119.7 1221.0 3.61 27.5 0.0116 3.62 27.6 0.0117 3.61 27.4 0.0115
February Mean February Maximum February Minimum
Cooling Energy Consumption Evaporator Coil Load Zone Load
February Totals
Testing with HVAC BESTEST 15 October 2004

2.11 Software Errors Discovered and/or Comparison Between Different Versions of the Same Software – Round 4
The suite of HVAC BESTEST cases were simulated again using EnergyPlus Version 1.0.0.023 (a maintenance release, June 2001) which included both input file and source code changes from Version 1.0.0.011.
Input file changes for Round 4:
• The equipment performance curves were refit from scratch using the Excel function LINEST. Data for the curves were taken from Table 1-6c of the HVAC BESTEST specification. Curve fits were developed using SI units since this is what EnergyPlus requires. Previously, the DOE-2 curve coefficients from Neymark’s work had been used, but the EIR curve fit done for DOE-2 applied only to the compressor input power. The EIR curve required for the EnergyPlus DX Coil model is based on compressor input power plus outdoor condenser fan power. The resulting curves used for the latest round of EnergyPlus simulations were as follows:
CoolCapFT = a + b*wb + c*wb**2 + d*edb + e*edb**2 + f*wb*edb where wb = wet-bulb temperature of air entering the cooling coil edb = dry-bulb temperature of the air entering the air-cooled condenser a = 0.43863482 b = 0.04259180 c = 0.00015024 d = 0.00100248 e = -0.00003314 f = -0.00046664 Data points were taken from first three columns of Table 1-6c of specification. CoolCap data was normalized to ARI rated capacity of 8,181 W, i.e. CoolCapFT = 1.0 at 19.4 C wb and 35.0 C edb.
EIRFT = a + b*wb + c*wb**2 + d*edb + e*edb**2 + f*wb*edb where: wb = wet-bulb temperature of air entering the cooling coil edb = dry-bulb temperature of the air entering the air-cooled condenser a = 0.77127580 b = -0.02218018 c = 0.00074086 d = 0.01306849 e = 0.00039124 f = -0.00082052 edb and wb data points were taken from the first two columns of Table 1-6c of specification. Energy input data points for corresponding pairs of edb and wb were taken from column labeled “Compressor Power” in Table 1-6c with an additional 108 W added to them for outdoor fan power. EIR is energy input ratio
Testing with HVAC BESTEST 16 October 2004

[(compressor + outdoor fan power)/cooling capacity] normalized to ARI rated conditions, i.e. EIRFT = 1.0 at 19.4 C wb and 35.0 C edb.
• Relaxed the min/max limits of the performance curve independent variables, wb and edb, to allow extrapolation of CoolCapFT and EIRFT outside the bounds of the equipment performance data given in the specification in accordance with comments in Section 1.3.2.2.3.2 of Volume 1.
• The BESTEST CDF curve was determined based on net total capacities of the unit while the EnergyPlus DX Coil model requires that the part load curve be expressed on the basis of gross sensible capacities. A new CDF curve was developed which was intended to be on a gross capacity basis, but a later review of this curve showed an error in the derivation. Further review showed that there is really little difference between net part load and gross part load, so the revised curve was then removed and the original CDF curve was used.
• The CDF curve (part load curve) was applied to the indoor fan operation where previously there was no input available for this. This change also required using the FAN:SIMPLE:ONOFF object instead of FAN:SIMPLE:CONSTVOLUME which has been used previously.
• Added one week of infiltration to the beginning of the Case E120 run period to prevent overdrying of the zone during the simulation warmup period. (See the results discussion below for more details.)
Relevant source code changes from Version 1.0.0.011 to Version 1.0.0.023:
• Standard air conditions for converting volume flow to mass flow in the indoor fan calculations were changed. HVAC BESTEST specifies that the volume flow rate is for dry air at 20C. EnergyPlus was using a dry-bulb of 25C at the initial outdoor barometric pressure with a humidity ratio of 0.014 kg/kg, although the EnergyPlus documentation indicated 21C and 101325 Pa was being used. EnergyPlus now calculates the initial air mass flow based on dry air at 20C at the standard barometric pressure for the specified altitude, and the documentation reflects this change.
• The specific heat for air throughout the air-side HVAC simulation was changed from a dry cp basis to a moist cp basis. Previously, a mixture of dry and moist cp had been used for various HVAC calculations.
• The heat of vaporization (hfg) for converting a zone latent load into a load in the HVAC system was changed.
• A new input field was added to FAN:SIMPLE:ONOFF to allow a CDF curve (part load curve) to be applied to the indoor fan operation where previously part load adjustments could only be applied to the compressor and outdoor fan.
Testing with HVAC BESTEST 17 October 2004

• Changed the moisture initialization to use the initial outdoor humidity ratio to initialize all HVAC air nodes.
The following changes in results were observed:
• The sensible and latent coil loads improved and now track very close to the analytical results.
• The mean indoor temperature for Case E200 improved and now, along with rest of the cases, matches exactly with the analytical results.
• The mean indoor humidity ratio tracks the analytical values better, especially for the wet coil cases. For Case E120 however, the EnergyPlus humidity ratio (0.0038) was much less than the analytical value (0.0079). Introducing infiltration for the first week of January only and then turning infiltration off, eliminates this problem and gives a mean indoor humidity ratio for the month of February of 0.0081. Even though all nodes are initialized to the outdoor humidity ratio at the beginning of the simulation, conditions during the simulation warmup days overdry the zone for this case. Without the infiltration during the first week, there is no source of moisture to overcome the overdrying and establish the desired equilibrium.
• Indoor fan power consumption and fan heat match analytical results in most cases or are slightly less than analytical results.
• COP results changed but are still mixed. One problem may have to do with the basis of the CDF curve in BESTEST versus what EnergyPlus requires. The BESTEST CDF curve was determined based on net total capacities of the unit while the EnergyPlus DX Coil model requires that the part load curve be expressed on the basis of gross sensible capacities.
2.12 Results – Round 4
Results from the fourth round of simulations with EnergyPlus Version 1.0.0.023 are presented in Table 5.
Testing with HVAC BESTEST 18 October 2004

Table 5 – HVAC BESTEST Results for EnergyPlus Version 1.0.0 Build 023
Supply Condenser Humidity Humidity HumidityCases Total Compressor Fan Fan Total Sensible Latent Total Sensible Latent COP IDB Ratio COP IDB Ratio COP IDB Ratio
(kWh) (kWh) (kWh) (kWh) (kWh) (kWh) (kWh) (kWh) (kWh) (kWh) (°C) (kg/kg) (°C) (kg/kg) (°C) (kg/kg)E100 1520.0 143.6 3797.6 3797.6 0.0 3654.1 3654.1 0.0 2.40 22.2 0.0075 2.41 22.2 0.0075 2.40 22.2 0.0075E110 1069.1 127.5 3763.1 3763.1 0.0 3635.5 3635.5 0.0 3.40 22.2 0.0066 3.40 22.2 0.0066 3.40 22.2 0.0066E120 1006.4 116.4 3746.9 3746.9 0.0 3630.5 3630.5 0.0 3.61 26.7 0.0080 3.61 26.7 0.0080 3.60 26.7 0.0080E130 108.6 10.3 217.0 217.0 0.0 206.7 206.7 0.0 1.90 22.2 0.0075 1.91 22.2 0.0075 1.90 22.2 0.0075E140 67.9 8.1 196.3 196.3 0.0 188.2 188.2 0.0 2.77 22.2 0.0066 2.78 22.2 0.0066 2.77 22.2 0.0066E150 1197.1 140.2 4508.7 3776.0 732.7 4374.7 3635.6 739.2 3.65 22.2 0.0084 3.68 22.2 0.0084 3.64 22.2 0.0083E160 1131.7 128.3 4491.0 3759.0 732.0 4369.7 3630.5 739.2 3.86 26.7 0.0103 3.88 26.7 0.0103 3.84 26.7 0.0102E165 1491.1 148.5 4528.7 3795.5 733.2 4385.9 3646.7 739.2 2.94 23.3 0.0094 2.96 23.3 0.0094 2.93 23.3 0.0093E170 635.4 73.0 2224.9 1491.2 733.6 2157.1 1417.9 739.2 3.40 22.2 0.0106 3.42 22.2 0.0106 3.37 22.2 0.0105E180 1082.0 118.4 4481.2 1537.3 2943.9 4374.7 1418.0 2956.8 4.04 22.2 0.0162 4.11 22.2 0.0162 3.99 22.2 0.0161E185 1540.4 139.1 4522.6 1576.6 2946.0 4393.3 1436.5 2956.8 2.85 22.2 0.0161 2.90 22.2 0.0161 2.80 22.2 0.0159E190 164.3 18.0 574.3 206.4 367.9 557.8 188.2 369.6 3.39 22.2 0.0159 3.45 22.2 0.0159 3.32 22.2 0.0157E195 250.2 22.7 597.7 229.6 368.1 576.3 206.7 369.6 2.30 22.2 0.0154 2.35 22.2 0.0155 2.25 22.2 0.0153E200 1464.6 153.4 5484.5 4274.3 1210.2 5341.5 4120.5 1221.0 3.65 26.7 0.0115 3.67 26.7 0.0115 3.63 26.7 0.0113
February Mean February Maximum February Minimum
Cooling Energy Consumption Evaporator Coil Load Zone Load
February Totals
Testing with HVAC BESTEST 19 October 2004

2.13 Comparison of Changes that Occurred with Early Versions of EnergyPlus
This section documents the comparative changes that took place in results (see Figures 2 through 9) as modifications were made to the EnergyPlus code or changes were made in the modeling approach (see Table 6). The analytical results shown in Figures 2 –9 represent the baseline against which all EnergyPlus results were compared. Results for other intermediate versions of EnergyPlus not discussed above have been included. EnergyPlus Version 1.0.0.023 (June 2001) was the most current public release of the software at the time this section of the report was written.
Table 6 – Summary of Pertinent EnergyPlus Changes that were Implemented
Version Input File Changes Code Changes Beta 5-12
thru Beta 5-14
DX coil calculations modified to account for cycling Modified method of calculating SHR and coil bypass
factor Beta 5-15
thru Beta 5-18
Changed DX coil object names Changed name of DX coil object from COIL:DX:DOE2 to COIL:DX:BF-Empirical to better represent its algorithmic basis (no impact on results)
Ver 1.0.0.001 thru
Ver 1.0.0.011
Changed from blow-thru to draw-thru fan configuration
Changed to double precision Modified method of calculating coil outlet conditions Added draw-thru fan option to WindowAC model
Ver 1.0.0.012 thru
Ver 1.0.0.014
New equipment performance curves Adjusted fan mass flow and efficiency to achieve
desired mass flow and fan power
Ver 1.0.0.015 thru
Ver 1.0.0.017
Went back to specified values for fan mass flow and efficiency
Partial implementation of moist cp
Fan power calculated using a standard initial density for volume to mass flow conversion
Ver 1.0.0.018 thru
Ver 1.0.0.019
Changed basis of CDF curve from net to gross Opened up min/max limits for performance curves
Complete implementation of moist cp hfg calculation modified for latent loads
Ver 1.0.0.020 thru
Ver 1.0.0.023
Went back to original CDF curve (modified curve used with Ver 1-19 was incorrect)
Changed from FAN:SIMPLE:CONSTVOLUME to FAN:SIMPLE:ONOFF
Used CDF curve for fan power to account for cycling
Implemented optional PLR curve for fan cycling Changed moisture initializations to use outdoor humidity
ratio
Testing with HVAC BESTEST 20 October 2004

IEA HVAC BESTEST Comparison
Indoor Fan Electricity ConsumptionE-Plus Output Variable: Fan Power[W]
-
20
40
60
80
100
120
140
160
180
E100 E110 E120 E130 E140 E150 E160 E165 E170 E180 E185 E190 E195 E200
HVAC BESTEST Case
Elec
tric
ity U
se (k
Wh)
Analytical/TUD
Analytical/HTAL1
Analytical/HTAL2
EnergyPlus Beta 5-07
EnergyPlus Beta 5-14
EnergyPlus Beta 5-18
EnergyPlus Ver 1-11
EnergyPlus Ver 1-14
EnergyPlus Ver 1-17
EnergyPlus Ver 1-19
EnergyPlus Ver 1-23
Figure 2 Indoor Fan Power Results for Early Versions of EnergyPlus
IEA HVAC BESTEST ComparisonDX Coil Electricity Consumption(includes Compressor + OD Fan)
E-Plus Output Variable: DX Coil Elec Power Cons[W]
-
200
400
600
800
1,000
1,200
1,400
1,600
E100 E110 E120 E130 E140 E150 E160 E165 E170 E180 E185 E190 E195 E200
HVAC BESTEST Case
Elec
tric
ity U
se (k
Wh)
Analytical/TUD
Analytical/HTAL1
Analytical/HTAL2
EnergyPlus Beta 5-07
EnergyPlus Beta 5-14
EnergyPlus Beta 5-18
EnergyPlus Ver 1-11
EnergyPlus Ver 1-14
EnergyPlus Ver 1-17
EnergyPlus Ver 1-19
EnergyPlus Ver 1-23
Figure 3 Compressor Plus Outdoor Fan Electricity Consumption Results for Early
Versions of EnergyPlus
Testing with HVAC BESTEST 21 October 2004

IEA HVAC BESTEST ComparisonSensible Cooling Coil Load
E-Plus Output Variable: (DX Coil Sens Cooling Energy[J])/3600/1000
-
1,000
2,000
3,000
4,000
5,000
6,000
E100 E110 E120 E130 E140 E150 E160 E165 E170 E180 E185 E190 E195 E200
HVAC BESTEST Case
Coo
ling
Coi
l Loa
d (k
Wh)
Analytical/TUD
Analytical/HTAL1
Analytical/HTAL2
EnergyPlus Beta 5-07
EnergyPlus Beta 5-14
EnergyPlus Beta 5-18
EnergyPlus Ver 1-11
EnergyPlus Ver 1-14
EnergyPlus Ver 1-17
EnergyPlus Ver 1-19
EnergyPlus Ver 1-23
Figure 4 Sensible Cooling Coil Load Results for Early Versions of EnergyPlus
IEA HVAC BESTEST ComparisonLatent Cooling Coil Load
-500
0
500
1,000
1,500
2,000
2,500
3,000
3,500
4,000
4,500
E100 E110 E120 E130 E140 E150 E160 E165 E170 E180 E185 E190 E195 E200
HVAC BESTEST Case
Coo
ling
Coi
l Loa
d (k
Wh)
Analytical/TUD
Analytical/HTAL1
Analytical/HTAL2
EnergyPlus Beta 5-07
EnergyPlus Beta 5-14
EnergyPlus Beta 5-18
EnergyPlus Ver 1-11
EnergyPlus Ver 1-14
EnergyPlus Ver 1-17
EnergyPlus Ver 1-19
EnergyPlus Ver 1-23
Figure 5 Latent Cooling Coil Load Results for Early Versions of EnergyPlus
Testing with HVAC BESTEST 22 October 2004

IEA HVAC BESTEST ComparisonTotal Cooling Coil Load
E-Plus Output Variable: (DX Coil Tot Cooling Energy[J])/3600/1000
-
1,000
2,000
3,000
4,000
5,000
6,000
7,000
E100 E110 E120 E130 E140 E150 E160 E165 E170 E180 E185 E190 E195 E200
HVAC BESTEST Case
Coo
ling
Coi
l Loa
d (k
Wh)
Analytical/TUD
Analytical/HTAL1
Analytical/HTAL2
EnergyPlus Beta 5-07
EnergyPlus Beta 5-14
EnergyPlus Beta 5-18
EnergyPlus Ver 1-11
EnergyPlus Ver 1-14
EnergyPlus Ver 1-17
EnergyPlus Ver 1-19
EnergyPlus Ver 1-23
Figure 6 Total Cooling Coil Load Results for Early Versions of EnergyPlus
IEA HVAC BESTEST ComparisonCoefficient of Performance
E-Plus Output Variables: (Zone/Sys Sensible Cooling Energy[J] + Zone-Total Latent Gain[J])/3600/ Window AC Elec Power Cons[W]
0.00
0.50
1.00
1.50
2.00
2.50
3.00
3.50
4.00
4.50
E100 E110 E120 E130 E140 E150 E160 E165 E170 E180 E185 E190 E195 E200
HVAC BESTEST Case
Coe
ffici
ent o
f Per
form
ance
(CO
P)
Analytical/TUD
Analytical/HTAL1
Analytical/HTAL2
EnergyPlus Beta 5-07
EnergyPlus Beta 5-14
EnergyPlus Beta 5-18
EnergyPlus Ver 1-11
EnergyPlus Ver 1-14
EnergyPlus Ver 1-17
EnergyPlus Ver 1-19
EnergyPlus Ver 1-23
Figure 7 Coefficient of Performance Results for Early Versions of EnergyPlus
Testing with HVAC BESTEST 23 October 2004

IEA HVAC BESTEST ComparisonMean Indoor Drybulb Temperature
E-Plus Output Variable: Mean Air Temperature[C]
0.0
5.0
10.0
15.0
20.0
25.0
30.0
E100 E110 E120 E130 E140 E150 E160 E165 E170 E180 E185 E190 E195 E200
HVAC BESTEST Case
Indo
or D
rybu
lb T
empe
ratu
re (C
)
Analytical/TUD
Analytical/HTAL1
Analytical/HTAL2
EnergyPlus Beta 5-07
EnergyPlus Beta 5-14
EnergyPlus Beta 5-18
EnergyPlus Ver 1-11
EnergyPlus Ver 1-14
EnergyPlus Ver 1-17
EnergyPlus Ver 1-19
EnergyPlus Ver 1-23
Figure 8 Indoor Dry-Bulb Temperature for Early Versions of EnergyPlus
IEA HVAC BESTEST ComparisonMean Indoor Humidity Ratio
E-Plus Output Variable: Zone Air Humidity Ratio[kg/kg]
0.0000
0.0020
0.0040
0.0060
0.0080
0.0100
0.0120
0.0140
0.0160
0.0180
E100 E110 E120 E130 E140 E150 E160 E165 E170 E180 E185 E190 E195 E200
HVAC BESTEST Case
Indo
or H
umid
ity R
atio
(kg/
kg)
Analytical/TUD
Analytical/HTAL1
Analytical/HTAL2
EnergyPlus Beta 5-07
EnergyPlus Beta 5-14
EnergyPlus Beta 5-18
EnergyPlus Ver 1-11
EnergyPlus Ver 1-14
EnergyPlus Ver 1-17
EnergyPlus Ver 1-19
EnergyPlus Ver 1-23
Figure 9 Indoor Humidity Ratio Results for Early Versions of EnergyPlus
Testing with HVAC BESTEST 24 October 2004

2.14 Results with Subsequent Releases of EnergyPlus
The IEA HVAC BESTEST workgroup has completed their activities and final results are recorded in a report authored and released by NREL in January 2002 (Neymark & Judkoff 2002). Since the completion of that study, further capabilities and improvements have been added to EnergyPlus with new releases occurring in June 2002 (version 1.0.1), August 2002 (version 1.0.2), December 2002 (version 1.0.3), April 2003 (version 1.1.0), September 2003 (version 1.1.1), May 2004 (version 1.2.0) and October 2004 (version 1.2.1.012). The results for the HVAC BESTEST series with these six new releases of EnergyPlus along with the analytical results and results for the last test series reported in the IEA HVAC BESTEST final report (version 1.0.0.023) are presented in the charts below. Although some minor changes took place in version 1.0.2 and were later reversed in version 1.0.3 (see Table 7), the results for all subsequent releases have remained unchanged.
Table 7 - Summary of Pertinent EnergyPlus Changes that were Implemented After EnergyPlus 1.0.0.023
Version Input File Changes Code Changes 1.0.2.003
thru 1.0.2.006
Reformatted and changed the Hfg psychrometric function to conform with ASHRAE equations
1.0.3.001 thru
1.0.3.013
Added Hg psychrometric function as per ASHRAE equations and now use this for latent gain conversion to humidity ratio
IEA HVAC BESTEST ComparisonIndoor Fan Electricity Consumption
E-Plus Output Variable: Fan Electric Power[W]
-
20
40
60
80
100
120
140
160
180
E100 E110 E120 E130 E140 E150 E160 E165 E170 E180 E185 E190 E195 E200
HVAC BESTEST Case
Elec
tric
ity U
se (k
Wh)
EnergyPlus Ver1.0.0.023
EnergyPlus Ver1.0.1.042
EnergyPlus Ver1.0.2.008
EnergyPlus Ver1.0.3.019 thru1.2.1.012Analytical/TUD
Analytical/HTAL1
Analytical/HTAL2
Figure 10 Indoor Fan Power Results for Later Versions of EnergyPlus
Testing with HVAC BESTEST 25 October 2004

IEA HVAC BESTEST ComparisonDX Coil Electricity Consumption(includes Compressor + OD Fan)
E-Plus Output Variable: DX Cooling Coil Electric Power[W]
-
200
400
600
800
1,000
1,200
1,400
1,600
E100 E110 E120 E130 E140 E150 E160 E165 E170 E180 E185 E190 E195 E200
HVAC BESTEST Case
Elec
tric
ity U
se (k
Wh)
EnergyPlus Ver1.0.0.023
EnergyPlus Ver1.0.1.042
EnergyPlus Ver1.0.2.008
EnergyPlus Ver1.0.3.019 thru1.2.1.012Analytical/TUD
Analytical/HTAL1
Analytical/HTAL2
Figure 11 Compressor Plus Outdoor Fan Electricity Consumption Results for Later
Versions of EnergyPlus
IEA HVAC BESTEST ComparisonSensible Cooling Coil Load
E-Plus Output Variable: (DX Coil Sensible Cooling Energy[J])/3600/1000
-
500
1,000
1,500
2,000
2,500
3,000
3,500
4,000
4,500
E100 E110 E120 E130 E140 E150 E160 E165 E170 E180 E185 E190 E195 E200
HVAC BESTEST Case
Coo
ling
Coi
l Loa
d (k
Wh)
EnergyPlus Ver1.0.0.023
EnergyPlus Ver1.0.1.042
EnergyPlus Ver1.0.2.008
EnergyPlus Ver1.0.3.019 thru1.2.1.012Analytical/TUD
Analytical/HTAL1
Analytical/HTAL2
Figure 12 Sensible Cooling Coil Load Results for Later Versions of EnergyPlus
Testing with HVAC BESTEST 26 October 2004

IEA HVAC BESTEST ComparisonLatent Cooling Coil Load
E-Plus Output Variable: (DX Coil Latent Cooling Energy[J])/3600/1000
-500
0
500
1,000
1,500
2,000
2,500
3,000
3,500
E100 E110 E120 E130 E140 E150 E160 E165 E170 E180 E185 E190 E195 E200
HVAC BESTEST Case
Coo
ling
Coi
l Loa
d (k
Wh)
EnergyPlus Ver1.0.0.023
EnergyPlus Ver1.0.1.042
EnergyPlus Ver1.0.2.008
EnergyPlus Ver1.0.3.019 thru1.2.1.012Analytical/TUD
Analytical/HTAL1
Analytical/HTAL2
Figure 13 Latent Cooling Coil Load Results for Later Versions of EnergyPlus
IEA HVAC BESTEST ComparisonTotal Cooling Coil Load
E-Plus Output Variable: (DX Coil Total Cooling Energy[J])/3600/1000
-
1,000
2,000
3,000
4,000
5,000
6,000
E100 E110 E120 E130 E140 E150 E160 E165 E170 E180 E185 E190 E195 E200
HVAC BESTEST Case
Coo
ling
Coi
l Loa
d (k
Wh)
EnergyPlus Ver1.0.0.023
EnergyPlus Ver1.0.1.042
EnergyPlus Ver1.0.2.008
EnergyPlus Ver1.0.3.019 thru1.2.1.012Analytical/TUD
Analytical/HTAL1
Analytical/HTAL2
Figure 14 Total Cooling Coil Load Results for Later Versions of EnergyPlus
Testing with HVAC BESTEST 27 October 2004

IEA HVAC BESTEST ComparisonCoefficient of Performance
E-Plus Output Variables: (Zone/Sys Sensible Cooling Energy[J] + Zone-Total Internal Latent Gain[J])/3600/ Window AC Electric Power[W]
0.00
0.50
1.00
1.50
2.00
2.50
3.00
3.50
4.00
4.50
E100 E110 E120 E130 E140 E150 E160 E165 E170 E180 E185 E190 E195 E200
HVAC BESTEST Case
Coe
ffici
ent o
f Per
form
ance
(CO
P)
EnergyPlus Ver1.0.0.023
EnergyPlus Ver1.0.1.042
EnergyPlus Ver1.0.2.008
EnergyPlus Ver1.0.3.019 thru1.2.1.012Analytical/TUD
Analytical/HTAL1
Analytical/HTAL2
Figure 15 Coefficient of Performance Results for Later Versions of EnergyPlus
IEA HVAC BESTEST ComparisonMean Indoor Drybulb Temperature
E-Plus Output Variable: Mean Air Temperature[C]
0.0
5.0
10.0
15.0
20.0
25.0
30.0
E100 E110 E120 E130 E140 E150 E160 E165 E170 E180 E185 E190 E195 E200
HVAC BESTEST Case
Indo
or D
rybu
lb T
empe
ratu
re (C
)
EnergyPlus Ver1.0.0.023
EnergyPlus Ver1.0.1.042
EnergyPlus Ver1.0.2.008
EnergyPlus Ver1.0.3.019 thru1.2.1.012Analytical/TUD
Analytical/HTAL1
Analytical/HTAL2
Figure 16 Indoor Dry-Bulb Temperature for Later Versions of EnergyPlus
Testing with HVAC BESTEST 28 October 2004

IEA HVAC BESTEST ComparisonMean Indoor Humidity Ratio
E-Plus Output Variable: Zone Air Humidity Ratio[kg/kg]
0.0000
0.0020
0.0040
0.0060
0.0080
0.0100
0.0120
0.0140
0.0160
0.0180
E100 E110 E120 E130 E140 E150 E160 E165 E170 E180 E185 E190 E195 E200
HVAC BESTEST Case
Indo
or H
umid
ity R
atio
(kg/
kg)
EnergyPlus Ver1.0.0.023
EnergyPlus Ver1.0.1.042
EnergyPlus Ver1.0.2.008
EnergyPlus Ver1.0.3.019 thru1.2.1.012Analytical/TUD
Analytical/HTAL1
Analytical/HTAL2
Figure 17 Indoor Humidity Ratio Results for Later Versions of EnergyPlus
Testing with HVAC BESTEST 29 October 2004

Testing with HVAC BESTEST 30 October 2004

3 RESULTS AND DISCUSSION
The results of the EnergyPlus HVAC comparison with other whole building energy analysis programs that participated in the HVAC BESTEST Comparison are summarized on a set of charts which follow in this section. The nomenclature for the various programs referred to on these charts along with the program author and modeler responsible for using the program as part of the HVAC BESTEST project are presented below.
Code Name Authoring Organization Implemented by Abbreviation
CA-SIS V1 Electricite de France, France Electricite de France, France CASIS/EDF
CLIM2000 2.1.6 Electricite de France, France Electricite de France, France CLIM2000/EDF
DOE-2.1E-088 LANL/LBNL/ESTSC, U.S. CIEMAT, Spain DOE21E/CIEMAT
DOE-2.1E-133 LANL/LBNL/JJH, U.S NREL/JNA, U.S. DOE21E/NREL
PROMETHEUS Klimasystemtechnik, Germany Klimasystemtechnik, Germany PROKST/KST
TRNSYS 14.2-TUD with ideal controller model
University of Wisconsin, U.S.; Technische Univ. Dresden, Germany
Technische Univ. Dresden, Germany
TRNSYS-ideal/TUD
TRNSYS 14.2-TUD with real controller model
University of Wisc., U.S.; Technische Univ. Dresden, Germany
Technische Univ. Dresden, Germany
TRNYS-real/TUD
Analytical Solution Hochschule Technik & Architektur, Luzern, Switzerland
Hochschule Technik & Architektur, Luzern, Switzerland
Analytical/HTAL1
Analytical Solution with realistic controller model
Hochschule Technik & Architektur, Luzern, Switzerland
Hochschule Technik & Architektur, Luzern, Switzerland
Analytical/HTAL2
Analytical Solution Technische Univ. Dresden, Germany
Technische Univ. Dresden, Germany
Analytical/TUD
ENERGYPLUS 1.2.1.012
U.S. Dept. of Energy GARD Analytics, Inc., U.S. EnergyPlus Ver 1.2.1.012
LANL/LBNL: Los Alamos National Laboratory/Lawrence Berkeley Laboratory ESTAC: Energy Science & Technology Software Center (at Oak Ridge National Laboratory) CIEMAT: Centro de Investigaciones Energeticas, Medioambientales y Tecnologicas JJH: James J. Hirsch & Associates NREL/JNA: National Renewable Energy Laboratory/J. Neymark & Associates
Testing with HVAC BESTEST 31 October 2004

Appendix A contains a series of charts that compare the results of EnergyPlus with other programs. The charts are presented in the following order:
Space Cooling Electricity Consumption (compressor + outdoor fan + indoor fan) Indoor Fan Electricity Consumption DX Coil Electricity Consumption (compressor + outdoor fan) Coefficient of Performance Total Cooling Coil Load Sensible Cooling Coil Load Latent Cooling Coil Load Zone Load (fan heat) Zone Total Cooling Load Zone Sensible Cooling Load Zone Latent Cooling Load Mean Indoor Dry-bulb Temperature Mean Indoor Humidity Ratio.
A visual inspection of the charts in Appendix A indicates that EnergyPlus compares very well to the analytical results for all of the charts. Quantitatively, the percent difference between EnergyPlus and average analytical results were as follows:
Max. % Difference
Space Cooling Electricity Consumption 1.15 Indoor Fan Electricity Consumption 0.78 DX Coil Electricity Consumption 1.16 Coefficient of Performance 0.74 Total Cooling Coil Load 1.04 Sensible Cooling Coil Load 1.04 Latent Cooling Coil Load 0.97 Zone Load 1.19 Zone Total Cooling Load 1.07 Zone Sensible Cooling Load 1.07 Zone Latent Cooling Load 0.0 Mean Indoor Dry-bulb Temperature 0.02 Mean Indoor Humidity Ratio. 3.28
Testing with HVAC BESTEST 32 October 2004

4 CONCLUSIONS
EnergyPlus Version 1.0.0.023 and subsequent versions up through the most recent release, EnergyPlus 1.2.1.012, were used to model a range of HVAC equipment load specifications as specified in International Energy Agency Building Energy Simulation Test and Diagnostic Method for HVAC Equipment Models (HVAC BESTEST). The ability of EnergyPlus to predict zone loads, cooling coil loads, cooling equipment energy consumption and resulting zone environment was tested using a test suite of 14 cases which included varying internal loads and outdoor conditions. The results predicted by EnergyPlus for 14 different cases were compared to results from 7 other whole building energy simulation programs that participated in an International Energy Agency (IEA) project which concluded in January 2002. Comparisons were also made with the results from three analytical solutions. EnergyPlus results generally agreed to within 1% of the analytical results except for the mean zone humidity ratio which agreed to within 3% for high SHR cases but was within 0.20% for low SHR cases.
Although not modeled as part of this exercise, EnergyPlus has another type of applicable system that could have been used, i.e., a unitary furnace with DX cooling coil. This system is currently modeled in EnergyPlus with only a blow-through fan configuration. When the draw-through option becomes available, this system type should also be tested.
For another discussion of EnergyPlus results, please refer to Appendix B where pertinent sections were extracted from the HVAC BESTEST Final Report (Neymark & Judkoff 2001) prepared by Joel Neymark, J. Neymark & Associates, October 2001.
The HVAC BESTEST suite is a very valuable testing tool which provides excellent benchmarks for testing HVAC system and equipment algorithms versus the results of other international building simulation programs. As discussed above, HVAC BESTEST allowed the developers of EnergyPlus to identify errors in algorithms and improve simulation accuracy.
Testing with HVAC BESTEST 33 October 2004

Testing with HVAC BESTEST 34 October 2004

5 REFERENCES
Crawley, Drury B, Linda K. Lawrie, Curtis O. Pedersen, and Frederick C. Winkelmann. 2000. “EnergyPlus: Energy Simulation Program,” in ASHRAE Journal, Vol. 42, No. 4 (April), pp. 49-56.
Crawley, D. B., L. K. Lawrie, F. C. Winkelmann, W. F. Buhl, A. E. Erdem, C. O. Pedersen, R. J. Liesen, and D. E. Fisher. 1997. “The Next-Generation in Building Energy Simulation—A Glimpse of the Future,” in Proceedings of Building Simulation ‘97, Volume II, pp. 395-402, September 1997, Prague, Czech Republic, IBPSA.
EnergyPlus 2004. U.S. Department of Energy, Energy Efficiency and Renewable Energy, Office of Building Techologies. www.energyplus.gov
Fisher, Daniel E, Russell D. Taylor, Fred Buhl, Richard J Liesen, and Richard K Strand. 1999. “A Modular, Loop-Based Approach to HVAC Energy Simulation And Its Implementation in EnergyPlus,” in Proceedings of Building Simulation ’99, September 1999, Kyoto, Japan, IBPSA.
Huang, Joe, Fred Winkelmann, Fred Buhl, Curtis Pedersen, Daniel Fisher, Richard Liesen, Russell Taylor, Richard Strand, Drury Crawley, and Linda Lawrie. 1999. “Linking the COMIS Multi-Zone Airflow Model With the EnergyPlus Building Energy Simulation Program,” in Proceedings of Building Simulation’99, September 1999, Kyoto, Japan, IBPSA.
Neymark, J., and R. Judkoff. 2001. International Energy Agency Solar Heating and Cooling Programme Task 22 Building Energy Simulation Test and Diagnostic Method for HVAC Equipment Models (HVAC BESTEST), National Renewable Energy Laboratory, Golden, Colorado, October 2001.
Neymark, J., and R. Judkoff. 2002. International Energy Agency Solar Heating and Cooling Programme Task 22 Building Energy Simulation Test and Diagnostic Method for HVAC Equipment Models (HVAC BESTEST), National Renewable Energy Laboratory, Golden, Colorado, NREL/TP-550-30152, January 2002.
Strand, Richard, Fred Winkelmann, Fred Buhl, Joe Huang, Richard Liesen, Curtis Pedersen, Daniel Fisher, Russell Taylor, Drury Crawley, and Linda Lawrie. 1999. “Enhancing and Extending the Capabilities of the Building Heat Balance Simulation Technique for use in EnergyPlus,” in Proceedings of Building Simulation ’99, September 1999, Kyoto, Japan, IBPSA.
Taylor, R. D, C. O. Pedersen, and L. K. Lawrie. 1990. "Simultaneous Simulation of Buildings and Mechanical Systems in Heat Balance Based Energy Analysis Programs," in Proceedings of the 3rd International Conference on System Simulation in Buildings, December 1990, Liege, Belgium.
Testing with HVAC BESTEST 35 October 2004

Taylor R. D., C. E. Pedersen, D. E. Fisher, R. J. Liesen, and L. K. Lawrie. 1991. "Impact of Simultaneous Simulation of Building and Mechanical Systems in Heat Balance Based Energy Analysis Programs on System Response and Control," in Proceedings of Building Simulation '91, August 1991, Nice, France, IBPSA.
Witte, M. J., Henninger, R.H., Glazer, J., and D. B. Crawley. 2001. "Testing and Validation of a New Building Energy Simulation Program," Proceedings of Building Simulation 2001, August 2001, Rio de Janeiro, Brazil, International Building Performance Simulation Association (IBPSA).
Testing with HVAC BESTEST 36 October 2004

Appendix A
Charts Comparing EnergyPlus Results with Other Whole Building Energy Simulation Programs


IEA HVAC BESTEST ComparisonSpace Cooling Electricity Consumption
(includes Compressor + OD Fan + ID Fan)E-Plus Output Variable: Window AC Electric Power[W]
0
200
400
600
800
1,000
1,200
1,400
1,600
1,800
E100 E110 E120 E130 E140 E150 E160 E165 E170 E180 E185 E190 E195 E200
HVAC BESTEST Case
Elec
tric
ity U
se (k
Wh)
CASIS/EDF
CLIM2000/EDF
DOE21E/CIEMAT
DOE21E/NREL
PROKST/KST
TRNSYS-ideal/TUD
TRNYS-real/TUD
Analytical/TUD
Analytical/HTAL1
Analytical/HTAL2
EnergyPlus Ver1.2.1.012

IEA HVAC BESTEST ComparisonIndoor Fan Electricity Consumption
E-Plus Output Variable: Fan Electric Power[W]
0
20
40
60
80
100
120
140
160
180
E100 E110 E120 E130 E140 E150 E160 E165 E170 E180 E185 E190 E195 E200
HVAC BESTEST Case
Elec
tric
ity U
se (k
Wh)
CASIS/EDF
CLIM2000/EDF
DOE21E/CIEMAT
DOE21E/NREL
PROKST/KST
TRNSYS-ideal/TUD
TRNYS-real/TUD
Analytical/TUD
Analytical/HTAL1
Analytical/HTAL2
EnergyPlus Ver1.2.1.012

IEA HVAC BESTEST ComparisonDX Coil Electricity Consumption(includes Compressor + OD Fan)
E-Plus Output Variable: DX Cooling Coil Electric Power[W]
0
200
400
600
800
1,000
1,200
1,400
1,600
E100 E110 E120 E130 E140 E150 E160 E165 E170 E180 E185 E190 E195 E200
HVAC BESTEST Case
Elec
tric
ity U
se (k
Wh)
CASIS/EDF
CLIM2000/EDF
DOE21E/CIEMAT
DOE21E/NREL
PROKST/KST
TRNSYS-ideal/TUD
TRNYS-real/TUD
Analytical/TUD
Analytical/HTAL1
Analytical/HTAL2
EnergyPlus Ver1.2.1.012

IEA HVAC BESTEST ComparisonCoefficient of Performance
E-Plus Output Variables: (Zone/Sys Sensible Cooling Energy[J]+Zone-Total Internal Latent Gain[J])/3600/ Window AC Electric Power[W]
0.00
0.50
1.00
1.50
2.00
2.50
3.00
3.50
4.00
4.50
E100 E110 E120 E130 E140 E150 E160 E165 E170 E180 E185 E190 E195 E200
HVAC BESTEST Case
Coe
ffici
ent o
f Per
form
ance
(CO
P) CASIS/EDF
CLIM2000/EDF
DOE21E/CIEMAT
DOE21E/NREL
PROKST/KST
TRNSYS-ideal/TUD
TRNYS-real/TUD
Analytical/TUD
Analytical/HTAL1
Analytical/HTAL2
EnergyPlus Ver1.2.1.012

IEA HVAC BESTEST ComparisonTotal Cooling Coil Load
E-Plus Output Variable: (DX Coil Total Cooling Energy[J])/3600/1000
0
1,000
2,000
3,000
4,000
5,000
6,000
E100 E110 E120 E130 E140 E150 E160 E165 E170 E180 E185 E190 E195 E200
HVAC BESTEST Case
Coo
ling
Coi
l Loa
d (k
Wh)
CASIS/EDF
CLIM2000/EDF
DOE21E/CIEMAT
DOE21E/NREL
PROKST/KST
TRNSYS-ideal/TUD
TRNYS-real/TUD
Analytical/TUD
Analytical/HTAL1
Analytical/HTAL2
EnergyPlus Ver1.2.1.012

IEA HVAC BESTEST ComparisonSensible Cooling Coil Load
E-Plus Output Variable: (DX Coil Sensible Cooling Energy[J])/3600/1000
0
500
1,000
1,500
2,000
2,500
3,000
3,500
4,000
4,500
5,000
E100 E110 E120 E130 E140 E150 E160 E165 E170 E180 E185 E190 E195 E200
HVAC BESTEST Case
Coo
ling
Coi
l Loa
d (k
Wh)
CASIS/EDF
CLIM2000/EDF
DOE21E/CIEMAT
DOE21E/NREL
PROKST/KST
TRNSYS-ideal/TUD
TRNYS-real/TUD
Analytical/TUD
Analytical/HTAL1
Analytical/HTAL2
EnergyPlus Ver1.2.1.012

IEA HVAC BESTEST ComparisonLatent Cooling Coil Load
E-Plus Output Variable: (DX Coil Latent Cooling Energy[J])/3600/1000
0
500
1,000
1,500
2,000
2,500
3,000
3,500
E100 E110 E120 E130 E140 E150 E160 E165 E170 E180 E185 E190 E195 E200
HVAC BESTEST Case
Coo
ling
Coi
l Loa
d (k
Wh)
CASIS/EDF
CLIM2000/EDF
DOE21E/CIEMAT
DOE21E/NREL
PROKST/KST
TRNSYS-ideal/TUD
TRNYS-real/TUD
Analytical/TUD
Analytical/HTAL1
Analytical/HTAL2
EnergyPlus Ver1.2.1.012

IEA HVAC BESTEST ComparisonZone Load (Fan Heat)
E-Plus Output Variable: (Fan Electric Consumption[J])/3600/1000
0
50
100
150
200
250
E100 E110 E120 E130 E140 E150 E160 E165 E170 E180 E185 E190 E195 E200
HVAC BESTEST Case
Fan
Hea
t (kW
h)
CASIS/EDF
CLIM2000/EDF
DOE21E/CIEMAT
DOE21E/NREL
PROKST/KST
TRNSYS-ideal/TUD
TRNYS-real/TUD
Analytical/TUD
Analytical/HTAL1
Analytical/HTAL2
EnergyPlus Ver1.2.1.012

IEA HVAC BESTEST ComparisonZone Total Cooling Load
0
1,000
2,000
3,000
4,000
5,000
6,000
E100 E110 E120 E130 E140 E150 E160 E165 E170 E180 E185 E190 E195 E200
HVAC BESTEST Comparison
Zone
Loa
d (k
Wh)
CASIS/EDF
CLIM2000/EDF
DOE21E/CIEMAT
DOE21E/NREL
PROKST/KST
TRNSYS-ideal/TUD
TRNYS-real/TUD
Analytical/TUD
Analytical/HTAL1
Analytical/HTAL2
EnergyPlus Ver1.2.1.012
E-Plus zone total cooling load not available as output variable; calculated as (Zone Sensible Load + Zone Latent Load)

IEA HVAC BESTEST ComparisonZone Sensible Cooling Load
E-Plus Output Variable: (Zone/Sys Sensible Cooling Energy[J])/3600/1000
0
500
1,000
1,500
2,000
2,500
3,000
3,500
4,000
4,500
E100 E110 E120 E130 E140 E150 E160 E165 E170 E180 E185 E190 E195 E200
HVAC BESTEST Case
Zone
Loa
d (k
Wh)
CASIS/EDF
CLIM2000/EDF
DOE21E/CIEMAT
DOE21E/NREL
PROKST/KST
TRNSYS-ideal/TUD
TRNYS-real/TUD
Analytical/TUD
Analytical/HTAL1
Analytical/HTAL2
EnergyPlus Ver1.2.1.012

IEA HVAC BESTEST ComparisonZone Latent Cooling Load
E-Plus Output Variable: (Zone-Total Internal Latent Gain[J])/3600/1000
0
500
1,000
1,500
2,000
2,500
3,000
3,500
E100 E110 E120 E130 E140 E150 E160 E165 E170 E180 E185 E190 E195 E200
HVAC BESTEST Case
Zone
Loa
d (k
Wh)
CASIS/EDF
CLIM2000/EDF
DOE21E/CIEMAT
DOE21E/NREL
PROKST/KST
TRNSYS-ideal/TUD
TRNYS-real/TUD
Analytical/TUD
Analytical/HTAL1
Analytical/HTAL2
EnergyPlus Ver1.2.1.012

IEA HVAC BESTEST ComparisonMean Indoor Drybulb Temperature
E-Plus Output Variable: Mean Air Temperature[C]
0.0
5.0
10.0
15.0
20.0
25.0
30.0
E100 E110 E120 E130 E140 E150 E160 E165 E170 E180 E185 E190 E195 E200
HVAC BESTEST Case
Indo
or D
rybu
lb T
empe
ratu
re (C
) CASIS/EDF
CLIM2000/EDF
DOE21E/CIEMAT
DOE21E/NREL
PROKST/KST
TRNSYS-ideal/TUD
TRNYS-real/TUD
Analytical/TUD
Analytical/HTAL1
Analytical/HTAL2
EnergyPlus Ver1.2.1.012

IEA HVAC BESTEST ComparisonMean Indoor Humidity Ratio
E-Plus Output Variable: Zone Air Humidity Ratio[kg/kg]
0.000
0.002
0.004
0.006
0.008
0.010
0.012
0.014
0.016
0.018
E100 E110 E120 E130 E140 E150 E160 E165 E170 E180 E185 E190 E195 E200
HVAC BESTEST Case
Indo
or H
umid
ity R
atio
(kg/
kg)
CASIS/EDF
CLIM2000/EDF
DOE21E/CIEMAT
DOE21E/NREL
PROKST/KST
TRNSYS-ideal/TUD
TRNYS-real/TUD
Analytical/TUD
Analytical/HTAL1
Analytical/HTAL2
EnergyPlus Ver1.2.1.012


Appendix B
EnergyPlus Discussion excerpted from HVAC BESTEST Final Report, (Neymark & Judkoff 2002)


(Note: The excerpted discussion that follows is based on HVAC BESTEST results produced with EnergyPlus 1.0.0.023.) 3.4.7 EnergyPlus (GARD Analytics)
EnergyPlus is the program recently released by DOE, and is the building energy simulation program that will be supported by DOE. GARD Analytics (GARD) used EnergyPlus’s “Window Air-Conditioner” system for its model.
GARD submitted eight iterations of simulation results. Table 3-4 describes input file and software modifications for each iteration; a single results set was submitted corresponding to changes described in each row of the table. Version Beta 5-07 was used for the initial results set.
Table 3-4. Summary of EnergyPlus Changes that were Implemented
Version Input File Changes Code Changes Beta 5-07 Beta 5-12 thru Beta
5-14
DX coil calculations modified to account for cycling Modified method of calculating SHR and coil bypass
factor Beta 5-15 thru Beta
5-18
Changed DX coil object names Changed name of DX coil object from to better represent its algorithmic basis (no impact on results)
Ver 1-01 thru
Ver 1-11
Changed from blow-thru to draw-thru fan configuration
Changed to double precision Modified method of calculating coil outlet conditions Added draw-thru fan option to WindowAC model
Ver 1-12 thru
Ver 1-14
New equipment performance curves Adjusted fan mass flow and efficiency to achieve
desired mass flow and fan power
Ver 1-15 thru
Ver 1-17
Went back to specified values for fan mass flow and efficiency
Partial implementation of moist cp
Fan power calculated using a standard initial density for volume to mass flow conversion
Ver 1-18 thru
Ver 1-19
Changed basis of CDF curve from net to gross Opened up min/max limits for performance curves
Complete implementation of moist cp hfg calculation modified for latent loads
Ver 1-20 thru
Ver 1-23
Went back to original CDF curve (modified curve used with Ver 1-19 was incorrect)
Changed from FAN:SIMPLE:CONSTVOLUME to FAN:SIMPLE:ONOFF
Used CDF curve for fan power to account for cycling
Implemented optional PLR curve for fan cycling Changed moisture initializations to use outdoor humidity
ratio
The COP results for selected cases are summarized in Figure 3-9 for the EnergyPlus simulations and the TUD/HTAL analytical solution results. Note that the differences in results have been magnified in this figure by increasing the minimum value on the y-axis. Figure 3-10 includes specific results used to diagnose the causes of various disagreements. For the initial run with Beta 5-07, a number of disagreements with the analytical solution results were identified:
B-1

• Low indoor fan electrical power and fan heat; see Figure 3-10 results labeled “E170 Q ID Fan x 50”
• Reported cooling coil loads apparently not adjusted for part load cycling (although actual load removed from the zone appears to have been adjusted); see Figure 3-10 results labeled “E140 Q Coil Total”
• Sensible coil load about 1% higher than total coil load in the dry-coil cases.
The process of correcting these disagreements engendered the improvements to EnergyPlus described below.
B-2

3.4.7.1 Reported Cooling Coil Loads Not Adjusted for Part Load Operation (up to 2500% effect on total coil load, negligible effect on energy consumption)
In Figure 3-10 it is apparent from the Beta 5-07 results for total coil load (designated by the results labeled “Q Coil Total” for cases E140, E170, and E200) that the total cooling coil load is in error, with the greatest error found in cases with lower PLR. For Beta 5-14 the reporting of cooling coil loads was corrected to account for run time during cycling operation. Because for Beta 5-07 the actual load extracted from the space was already being adjusted for cycling (similar magnitude disagreements do not exist for COP of cases E140 and E170 in Figure 3-9), it appears that this problem had a negligible effect on COP and energy consumption.
3.4.7.2 Modified Calculation of SHR and BF (1%–2% total consumption effect)
The problem of sensible coil loads being greater than total coil loads was addressed by modifying the methods of calculating SHR and BF. With the reasonable assumption that the coil load reporting error had negligible effect on energy consumption, the difference in COP between Beta 5-14 and Beta 5-07 (shown in Figure 3-9) illustrates the 1%–2% energy consumption effect of this modification, with a similar degree of change for all cases.
Along with the remaining differences in COP that are apparent from Figure 3-9 for Beta 5-14, GARD noted a number of other disagreements that were previously masked:
• Total coil loads were generally greater than for the analytical solutions (see “E200 Q Coil Total” results in Figure 3-10), and were 1%–2% greater than the sums of total zone load plus fan energy consumption
• The mean IDB for E200 moved from 26.7°C (good) to 27.1°C (high)
• Previous Beta 5-07 disagreements in terms of low ID fan power remain (see “E170 Q ID Fan × 50” results in Figure 3-10).
These disagreements with the analytical solutions prompted further improvements, described below.
3.4.7.3 Draw-through Fan, Double-Precision Variables, and Modified Calculation of Coil Outlet Conditions (0.1%–0.7% total consumption effect)
Changes leading up to Version 1-11 included:
• Modified method for calculating coil outlet conditions
• Use of double precision throughout EnergyPlus (this change was prompted by other issues not related to HVAC BESTEST)
• Addition of draw-through fan option to the window air-conditioner system.
Unfortunately, the effects of each of these changes were not disaggregated in the testing. The combined effects of these changes are illustrated in Figure 3-10, where the results for Beta 5-14 are compared to those from Ver 1-11 for the set of results labeled “E200 Qsens Coil-Zone × 20”
B-3
(the difference between sensible coil loads and sensible zone loads, magnified by a factor of 20). This set of results indicates a 5% change in the loads-based calculated fan heat. The overall effect of these changes on COP (and consumption) is <1% as illustrated in Figure 3-9 comparing the difference between results of Ver 1-11 and Beta 5-14.
Along with remaining differences in COP apparent for Ver 1-11 in Figure 3-9, GARD noted other remaining disagreements:
• Total coil load remained 1%–2% greater than total zone load plus fan heat; similarly, the latent coil loads were 3% greater than for the analytical solution results—see “E180 Q Coil Latent” results in Figure 3-10
• The mean IDB for E200 moved from 27.1°C (high) to 27.5°C (higher)
• Previous Beta 5-07 disagreements of low ID fan power became worse compared with analytical solution results (see “E170 Q ID Fan × 50” results in Figure 3-10).
3.4.7.4 Change to Standard Air Density for Fan Power Calculation (1% decrease in sensible coil load)
For versions 1-12 through 1-17, results for changes to the software were aggregated with input file changes (notably the revision of system performance curves) so that assessing the effect of software revisions—including the implementation of moist air specific heat and the use of standard air properties for calculating supply air mass flow rates—was difficult. However, in Figure 3-10 (for the set of results labeled “E200 Qsens Coil-Zone × 20” for Ver 1-17 versus Ver 1-11), the bulk of the remaining fan heat discrepancy appears to have been addressed in version 1-17 when the fan power calculation was changed to incorporate standard air density. This change appears to have resulted in a 1% change in sensible and total coil load (see results for “E200 Q Coil Total” in Figure 3-10). The effect on ID fan energy appears to be about 3% (see results for “E170 ID Fan Q × 50” for Ver 1-17 versus Ver 1-11 in Figure 3-10), which translates to a 0.3% total power effect. The total electricity consumption effect would be greater in cases where the fan is running continuously (e.g. because of outside air requirements) even though the compressor is operating at lower part loads.
3.4.7.5 Modified Heat of Vaporization for Converting Zone Latent Load into HVAC
System Latent Load (0.4%–2.5% total consumption effect for wet coil cases only) For versions 1-18 and 1-19, the effects of input file changes were likely negligible (CDF curve revision), or the changes may have only affected specific cases. Enabling extrapolation of performance curves appears to have had the greatest effect in E120—see Figure 3-9 results for E120, Ver 1-19 versus Ver 1-17. Therefore, changes in results for the wet coil cases are likely caused primarily by changes to the software. Versions 1-18 through 1-19 include the following changes to the software:
• Changed heat of vaporization (hfg) used for converting a zone latent load into a coil load
• Changed airside HVAC-model specific heat (cp) from dry air to moist air basis.
B-4

From Figure 3-10, the case E180 latent coil load results (designated by “E180 Q Coil Latent”) for Ver 1-19 versus Ver 1-17 indicate that the fixes to the software improved the latent coil load results, with a 4% effect on latent coil load for E180 and the other wet coil cases (not shown here). In Figure 3-9, the difference between Ver 1-19 and Ver 1-17 illustrates the effect on COP, with the greatest effect (2.2%–2.5%) seen for cases with the lowest SHR (e.g., cases E180 and E190). GARD also noted that changing the airside HVAC model specific heat (cp) from a dry air to a moist air basis improved consistency between coil and zone loads and removed other small discrepancies.
3.4.7.6 ID Fan Power Did Not Include COP f(PLR) Degradation (2% total consumption effect at mid PLR)
In Figure 3-10, using the set of results labeled “E170 Q ID Fan × 50” (fan energy use magnified by a factor of 50), it is apparent that indoor fan consumption was about 15% lower than the analytical solution results for case E170. This difference was traced to CDF not being accounted for in the ID fan consumption. Application of COP=f(PLR) was implemented by Ver 1-23, and better agreement with the analytical solution indoor fan energy consumption was the result. The difference in results for Ver 1-23 and Ver 1-19 in Figure 3-9 indicates a 2% effect on total energy consumption for the mid-PLR case E170, with a higher percentage of effect as PLR decreases (e.g., see Figure 3-9 results for case E140 or E190).
3.4.7.7 General Comment About Improvements to EnergyPlus
Each individual error found in EnergyPlus by itself did not have >3% effect on consumption results. However, these multiple errors do not necessarily compensate each other, and may be cumulative in some cases. Furthermore, some errors that have small effect on total consumption for these cases (e.g. fan model errors when the indoor fan is cycling with the compressor) could have larger effects on total consumption for other cases (e.g., if the indoor fan is operating continuously while the compressor cycles). Therefore, correcting these errors was important.
B-5

Appendix C
EnergyPlus Program Characteristics Summary “Proforma” as prepared for HVAC BESTEST Final Report
(Neymark & Judkoff 2002)


C-1
Program name (please include version number)
EnergyPlus Version 1.2.1.012
Your name, organisation, and country
Michael J. Witte, GARD Analytics, Inc., United States
Program status Public domain Commercial: Research x Other (please specify): Government-sponsored, end-user license is no charge, other license types
have fees associated with them Solution method for unitary space cooling equipment x Overall Performance Maps Individual Component Models Constant Performance (no possible variation with entering or ambient conditions) Other (please specify) Interaction between loads and systems calculations x Both are calculated during the same timestep First, loads are calculated for the entire simulation period, then equipment performance is
calculated separately Other (please specify) Time step Fixed within code (please specify time step): x User-specified (please specify time step): one hour for envelope x Other (please specify): program automatically adjusts HVAC time step, <= envelope time step
Timing convention for meteorological data : sampling interval Fixed within code (please specify interval): x User-specified: one hour
Timing convention for meteorological data : period covered by first record x Fixed within code (please specify period or time which meteorological record covers): 0:00 - 1:00 User-specified

C-2
Meteorological data reconstitution scheme Climate assumed stepwise constant over sampling interval x Linear interpolation used over climate sampling interval Other (please specify)
Output timing conventions Produces spot predictions at the end of each time step Produces spot output at end of each hour x Produces average outputs for each hour (please specify period to which value relates): user-
specified, hourly data is average or sum for previous hour, can specify output at each time step
Treatment of zone air x Single temperature (i.e. good mixing assumed) Stratified model Simplified distribution model Full CFD model Other (please specify)
Zone air initial conditions x Same as outside air Other (please specify)
Internal gains output characteristics Purely convective Radiative/Convective split fixed within code x Radiative/Convective split specified by user: 100% convective for these tests Detailed modeling of source output
Mechanical systems output characteristics x Purely convective Radiative/Convective split fixed within code a Radiative/Convective split specified by user: for types of equipment not used in these tests Detailed modeling of source output
Control temperature x Air temperature Combination of air and radiant temperatures fixed within the code User-specified combination of air and radiant temperatures User-specified construction surface temperatures User-specified temperatures within construction Other (please specify)

C-3
Control properties x Ideal control as specified in the user's manual On/Off thermostat control On/Off thermostat control with hysteresis On/Off thermostat control with minimum equipment on and/or off durations Proportional control More comprehensive controls (please specify)
Performance Map: characteristics Default curves x Custom curve fitting Detailed mapping not available Other (please specify)
Performance Map: independent variables Entering Drybulb Temperature: program calculates adjustments internally x Entering Wetbulb Temperature x Outdoor Drybulb Temperature x Part Load Ratio a Indoor Fan Air Flow Rate: always=1, because fan always operates at rated conditions Other (please specify)
Performance Map: dependent variables x Coefficient of Performance (or other ratio of load to electricity consumption) x Total Capacity Sensible Capacity: program calculates internally based on user-specified nominal SHR Bypass Factor: program calculates internally based on nominal SHR and current conditions x Other (please specify): indoor fan power (function of PLR)
Performance Map: available curve fit techniques x Linear, f(one independent variable): flow fraction curves set to constant=1 x Quadratic, f(one independent variable) : PLF-FPLR (cycling loss) a Cubic, f(one independent variable): a Bi-Linear, f(two independent variables) x Bi-Quadratic, f(two independent variables): CAP-FT, EIR-FT Other (please specify)
Performance Map: extrapolation limits x Limits independent variables: 27.4 <= ODB <=48.1; 13.0 <= EWB <= 23.7, 0.0 <= PLR <= 1.0 Limits dependent variables No extrapolation limits

C-4
Extrapolation not allowed Other (please specify)
Cooling coil and supply air conditions model
Supply air temperature = apparatus dew point (ADP); supply air humidity ratio = humidity ratio of saturated air at ADP
Bypass factor model using listed ADP data x Bypass factor model with ADP calculated from extending condition line: nominal BF is calculated
from user-specified nominal SHR x Fan heat included More comprehensive model (please specify)
Disaggregation of fans' electricity use directly in the simulation and output x Indoor fan only Outdoor fan only Both indoor and outdoor fans disaggregated in the output None - disaggregation of fan outputs with separate calculations by the user
Economizer settings available (for E400 series) a Temperature (E400 series not run) a Enthalpy (E400 series not run) a Compressor Lockout (E400 series not run) Other (please specify)