Embed Size (px)
Citation preview

23/06/2013
1
Vatsal Bhatt, [email protected]
Paul (Chip) Friley, [email protected]
Savvas Politis, [email protected]
ETSAP Workshop at IEA
Jun 17-18, 2013
Energy-Water Nexus
Policy Modeling

23/06/2013
2
Growing Limitations on Fresh Surface and Ground Water Availability
Little increase in surface water
storage capacity since 1980
Concerns over climate impacts
on surface water supplies
• Many major ground water
aquifers seeing reductions in
water quality and yield
( Based on USGS WSP-2250 1984 and Alley 2007)
(Shannon 2007)
(Slide Source: Hightower 2009)
Discussion Outline
USDOE National Labs Activities for national support
Brookhaven Energy-Water Nexus Policy Analysis
• National – Water Needs for Electricity Production
• Regional – North-East Corridor Regional Earth Systems
Modeling
• Carbon Storage Interaction with Sub-surface Liabilities
• Urban – New York City and Long Island

23/06/2013
3
U.S. National Laboratories Energy-Water Nexus Team
Joint 12 Laboratory effort that was initiated in 2004
A Report to Congress from DOE - January 2007
A Roadmapping effort and Five Pilot Projects
• Three regional integrated and collaborative Energy-Water planning projects
- Columbia/Yakima River (PNNL/INL)
- Cumberland/Tennessee River (ORNL)
- Metropolitan New York (BNL)
• Existing systems analysis and decision support tool identification and evaluation project for Energy-Water planning applications (LBNL/LLNL)
• Electric grid upgrade study project, optimizing cost, energy reliability, and reduced fresh water use in the West (SNL/LANL/ANL)
GAO Report on the Energy-Water Nexus 2012 recommended DOE to “take the
actions necessary to establish a program to address the energy-water nexus,
with involvement from other federal agencies, as described in the Energy
Policy Act of 2005.” In December 2012, the DOE Undersecretary established a
Water-Energy Tech Team.
National – Water Needs for Electricity Production
Brookhaven Energy-Water Nexus Policy Analysis

23/06/2013
4
Resource
Extraction
Refining &
ConversionTransport Generation
Transmission
& Distribution
Utilization
DevicesEnd-use
Renewables
Crude Oil
Coal
Natural Gas
Refined Products
OtherSources
Nuclear
Electrolysis
Hydrogen Fuel-Cell
Electricity
Air-conditioning
Space Heating
Water Heating
Office Equipment
Misc. Electric Building
Misc. Electric Industrial
Process Heat
Petro/Biochemicals
Other Transportation
Passenger Travel
Refined Products
DG
GHG Emissions Analysis for All Stages
*
*
U.S. MARKAL Analysis Focused on Water needs of Electricity Generation
Currently Modeled Water Systems Possibilities of Adding w IPIECA Collaboration
10 Region US MARKAL with12 Timeslices – S/W/I-DAM/DPM/DPK/NGT
Accounts for water withdrawals and water consumption for electricity
production from:
• Fossil fuels (Coal, Nat. Gas, Oil)
• Nuclear power
• Renewable energy (Geothermal, Biomass, Solar Thermal and PV)
Detailed water use factors provided by the National Renewable Energy
Laboratory (NREL), have been applied to the technology- rich base of the
model.
• Regional factors for existing power plants
• Uniform factors for future technologies
Allows for the analysis of the impact which technology investment and
policy choices related to the development of the energy system affect
water use.
Model was calibrated to the Energy Information Administration’s 2010
Annual Energy Outlook. 8
10-Region US MARKAL Energy-Water Nexus

23/06/2013
5
Regional Results: 2005 USGS vs. 2010 MARKAL
NJ
Pacific
California
Mountain West North
Central
West South
Central
East North
Central Mid Atlantic
East South
Central
New England
South Atlantic
0
10
20
30
40
50 CAL
USGS MARKAL
0
10
20
30
40
50 ESC
USGS MARKAL
0
10
20
30
40
50 MDA
USGS MARKAL USGS MARKAL
0
10
20
30
40
50MTN
USGS MARKAL
0
10
20
30
40
50 NEC
USGS MARKAL
0
10
20
30
40
50 NEE
USGS MARKAL
0
10
20
30
40
50 PAC
USGS MARKAL
0
10
20
30
40
50 SAT
USGS MARKAL
0
10
20
30
40
50 WNC
USGS MARKAL
0
10
20
30
40
50 WSC
USGS MARKAL
10-Region US MARKAL Energy-Water Nexus
Studied the potential impact of carbon prices at $50 and $100 per ton of CO2
on total water use.
Identified significant reductions potentials in water use under the carbon policy
scenarios.
Reductions are driven by a shift to less carbon intensive technologies as
compared to our base case; such technologies also happen to be less water
intensive.
10
2.5
3.0
3.5
4.0
4.5
5.0
5.5
6.0BGal/day Total Water Consumption
BAU
C 50
C 100
0.30
0.35
0.40
0.45
0.50Gal/kWh Water Consumption Intensity
BAU
C 50
C 100

23/06/2013
6
Total Water Withdrawals by technology
0
50
100
150
200
250
BG
al/d
ay
Withdrawals by Technology - BAU vs. C 50 & C 100
Oil
Nat. Gas Turbine
Nat. Gas CC w CCS
Biogas
IGCC w CCS
IGCC
CSP
Biomass
Nat. Gas CC
Geothermal
Nuclear
Co-Firing
Coal
2010 2020 2030 2040 2050 2010 2020 2030 2040 2050 2010 2020 2030 2040 2050 2010 2020 2030 2040 2050
Total Water Consumption by technology
0.000
0.001
0.002
0.003
0.004
0.005
0.006
BG
al/
day
Consumption by Feedstock - BAU vs C 50 & C 100
Oil
Nat. Gas Turbine
Nat. Gas CC w CCS
Nat. Gas CC
Biogas
IGCC w CCS
IGCC
CSP
Biomass
Geothermal
Nuclear
Co-Firing
Coal
2010 2020 2030 2040 2050 2010 2020 2030 2040 2050
23/06/2013
7
Regional – North-East Corridor Regional Earth Systems Modeling
Brookhaven Energy-Water Nexus Policy Analysis
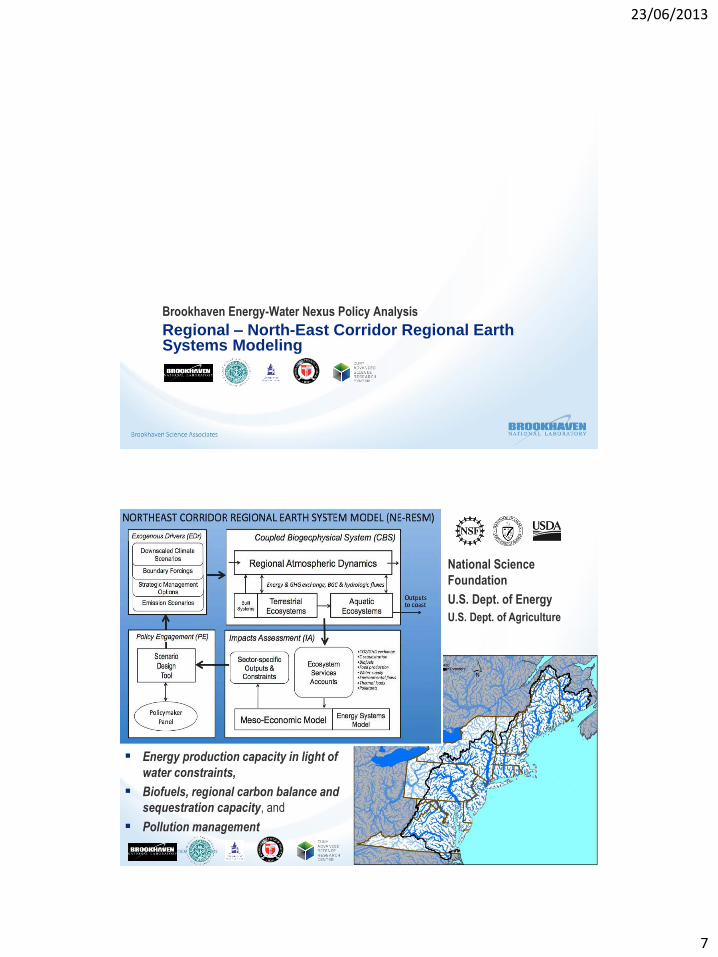
NE-RESM Project Overview
Energy production capacity in light of
water constraints,
Biofuels, regional carbon balance and
sequestration capacity, and
Pollution management
National Science
Foundation
U.S. Dept. of Energy
U.S. Dept. of Agriculture

23/06/2013
8
15
Expert Panel Suggested Scenario Analysis
16
DOE-EIA
AEO BAU
Upscaling NYS
80by50
Deutsche
Bank and
others
NREL-ReEDS
CES/ETI
• Analyze RCPs 2.6, 4.5, 6, 8.5 and below scenarios
23/06/2013
9
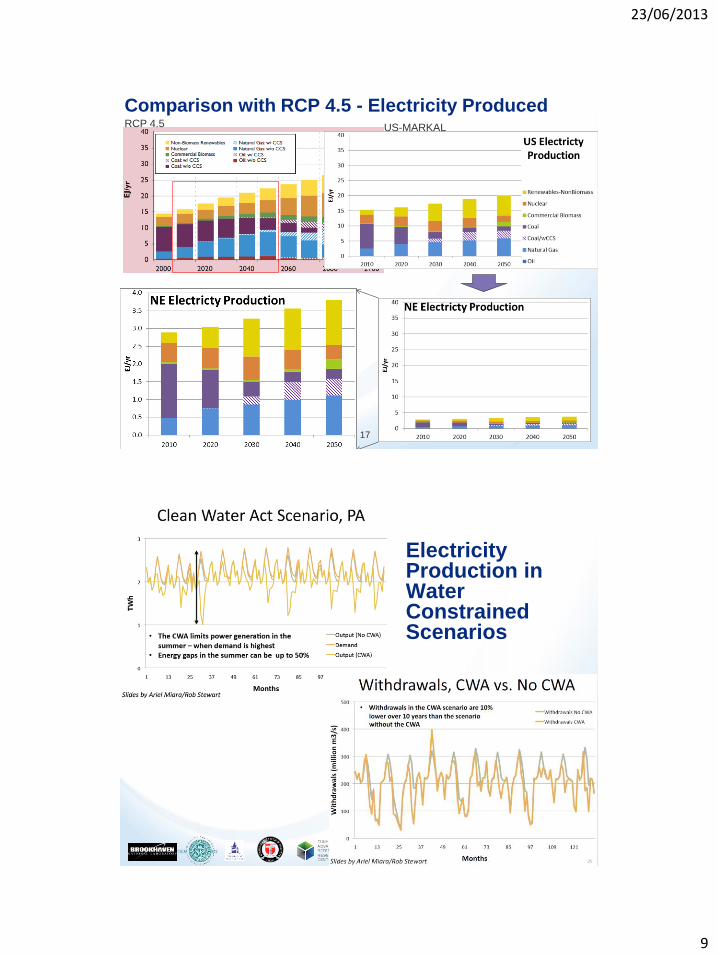
Comparison with RCP 4.5 - Electricity Produced
17
RCP 4.5 US-MARKAL
Electricity Production in Water Constrained Scenarios
18
23/06/2013
10
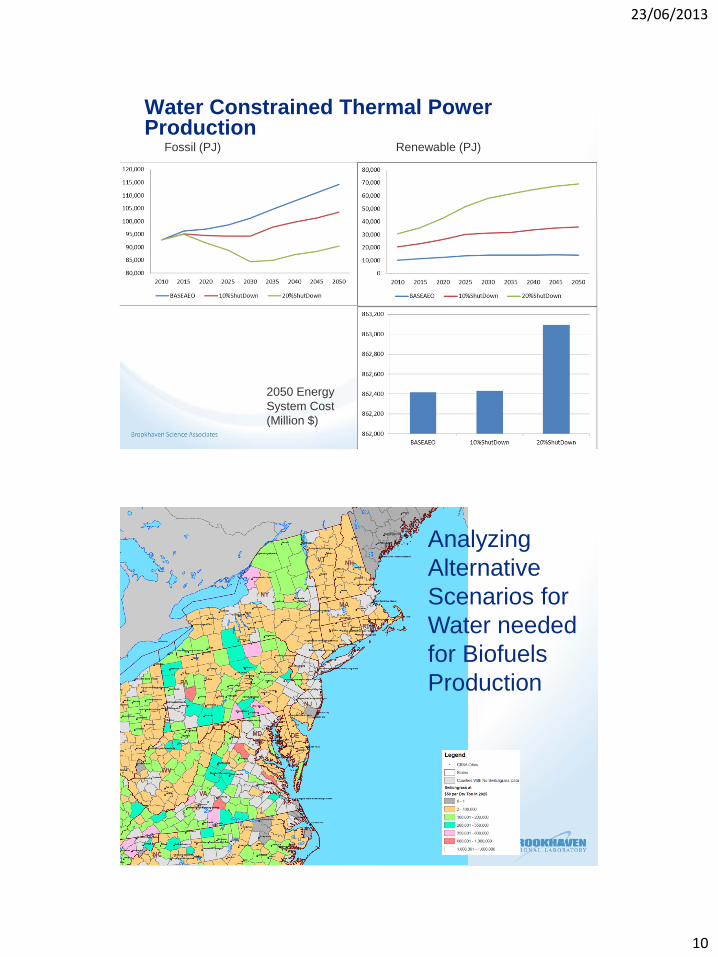
Water Constrained Thermal Power Production
19
Fossil (PJ)
2050 Energy
System Cost
(Million $)
Renewable (PJ)
Analyzing
Alternative
Scenarios for
Water needed
for Biofuels
Production

23/06/2013
11
Carbon Storage Interaction with Sub-surface Liabilities
Brookhaven Energy-Water Nexus Policy Analysis
A Collaborative Project

23/06/2013
12
7. Oil or Gas – In Progress (54) 8. Mineral Wells (35) 9. Injection – UIC Class I (25) 10. Other (6) 11. Plugged (30,484) 12. Dry Hole (38)
1. Natural Gas Production (9,756) 2. Oil Production (3,442) 3. Storage – Natural Gas (1,726) 4. Injection – Waste (727) 5. Injection – Enhanced Recovery (516) 6. Observation (490)
Vertical Exaggeration: 40x
Deepest Unit Penetrated Natural Gas Storage
(1,726) Natural Gas Production
(9,756) Oil Production
(3,442)

23/06/2013
13
Groundwater is Not Contaminated by Brine
“Critical Pressure” not exceeded.
Injection Unit
Top-Most Unit Impacted
USDW Units (10,000 ppm)
Injection Location

23/06/2013
14
Sequestration Technologies in CCS-MARKAL
Detailed CCS
technologies and
information specifically
for Mt. Simon deep
saline aquifer (Ottawa
County, Michigan)
CO2 Sources/Plants
Capture
Transportation
Sequestration
(Detailed)
CCS-MARKAL Modeled Sequestration Options
Fuel Sources - Coal, Refinery Residue or Biomass - Oil, Natural Gas or Landfill Gas
Energy Conversion Power Plant, Industries, etc.
CO2 Recovery
CO2 Transportation
CO2 Sequestration
1) Oil and Gas Reservoirs
- Basin Type 1, 2, 3. … n
2) Coal Bed Methane/
Unmineable Coal Seams
- Mine Type 1, 2, 3 . … n
3) Deep Saline Formations
- Formation Type 1, 2, 3 . … n
• Basalt
• Depleted Gas Reservoirs
• Depleted Oil Reservoirs
• Enhanced Coal-bed Methane Recovery
• Enhanced Oil Recovery
• Shale Gas
• Mt. Simon Aquifer
05
16
3037 37 37
0
13
41
73
93 93 93
0 3
34
59
9298 98
0 0
2430 31 31 31
0
20
40
60
80
100
120
2020 2025 2030 2035 2040 2045 2050
CCS (11% DR) at 1% Leakage Rate (GW)
Preliminary Calculations for CCS Penetration
05
16
3037 37 37
5
18
46
78
98 9893
7 10
41
66
99105
98
12 12
3542 42 41
31
0
20
40
60
80
100
120
2020 2025 2030 2035 2040 2045 2050
CCS at 11% Discount Rate (GW)
23/06/2013
15
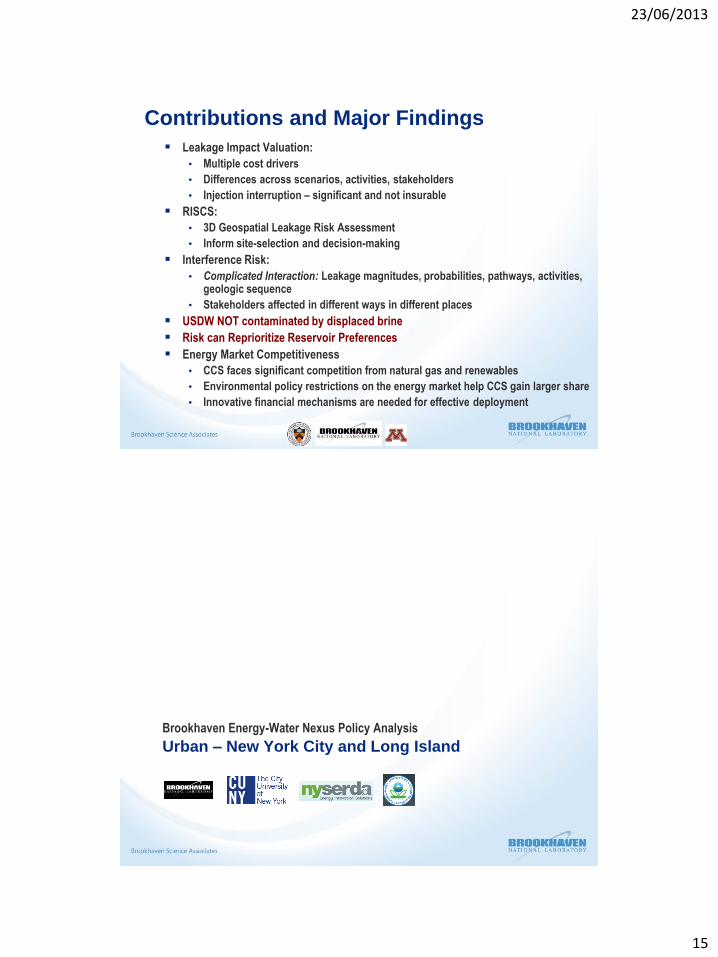
Contributions and Major Findings
Leakage Impact Valuation:
• Multiple cost drivers
• Differences across scenarios, activities, stakeholders
• Injection interruption – significant and not insurable
RISCS:
• 3D Geospatial Leakage Risk Assessment
• Inform site-selection and decision-making
Interference Risk:
• Complicated Interaction: Leakage magnitudes, probabilities, pathways, activities, geologic sequence
• Stakeholders affected in different ways in different places
USDW NOT contaminated by displaced brine
Risk can Reprioritize Reservoir Preferences
Energy Market Competitiveness
• CCS faces significant competition from natural gas and renewables
• Environmental policy restrictions on the energy market help CCS gain larger share
• Innovative financial mechanisms are needed for effective deployment
Urban – New York City and Long Island
Brookhaven Energy-Water Nexus Policy Analysis

23/06/2013
16
New York City Integrated Resources Planning Pilot Study
NYC Energy Policy Task Force (2004): Summer electricity peak demand in 2003 ~ 11,000 MW, by 2008 need 4,000 MW of new electric power
FERC desired goal for NYC: 80% of peak generation in-city
•1.3 BGD supplied
•19 reservoirs, 3
controlled lakes
•3 aqueducts
•2 distribution
reservoirs
•3 rock tunnels in the
city (1, 2, 3)
•Network of risers
and 6000 miles of
distribution mains
• 1.4 BGD treated
• 14 wastewater pollution
control plants
• 93 pumping stations
• 494 permitted outfalls
Facilitating Comprehensive Strategic EWN Decision Making
MARKAL provides comprehensive and integrated long-term infrastructure investment
decisions methodology (2005-2050)
• Evaluates impacts of environmental, technological and policy restrictions on
current and future decisions (e.g. State Implementation Plans, carbon reduction or vehicle
efficiency/cleaner standards)
• Assesses long-term economic and environmental benefits and measurable
payouts of technology and infrastructure decisions (e.g. County, City, Investment banking
or Insurance industry decisions based on risk, adaptation and mitigation benefits or Socially
Responsible Investment Pools)
• Identifies the most cost-effective pattern of technology deployment and resource
use (e.g. energy efficient or clean energy techs), including synergies, tradeoffs and fuel switching
(e.g. Alternative Fuels, Carbon Pricing)
• Guides investment decisions based on technology and investment additionality of
competing alternatives (e.g. renewable technologies or EPA Clean Water Revolving Fund
decisions)

23/06/2013
17
0
50 000
100 000
150 000
200 000
250 000
300 000
350 000
400 000
2010 2015 2020 2025 2030 2035 2040 2045 2050
Millio
n G
allo
ns
/ Y
ear
Total NYC Water Consumption, with and without "fast adoption"
SlowAdoption
FastAdoption
EWN Scenario Analysis: Low Water Consuming Techs
0
5 000
10 000
15 000
20 000
25 000
2010 2015 2020 2025 2030 2035 2040 2045 2050Millio
n G
allo
ns /
Year
Reduction in Water Consumtion
0
1,000,000
2,000,000
3,000,000
4,000,000
2010 2015 2020 2025 2030 2035 2040 2045 2050
kW
h /
Year
Reduction in primary Energy counsumption
23/06/2013
18
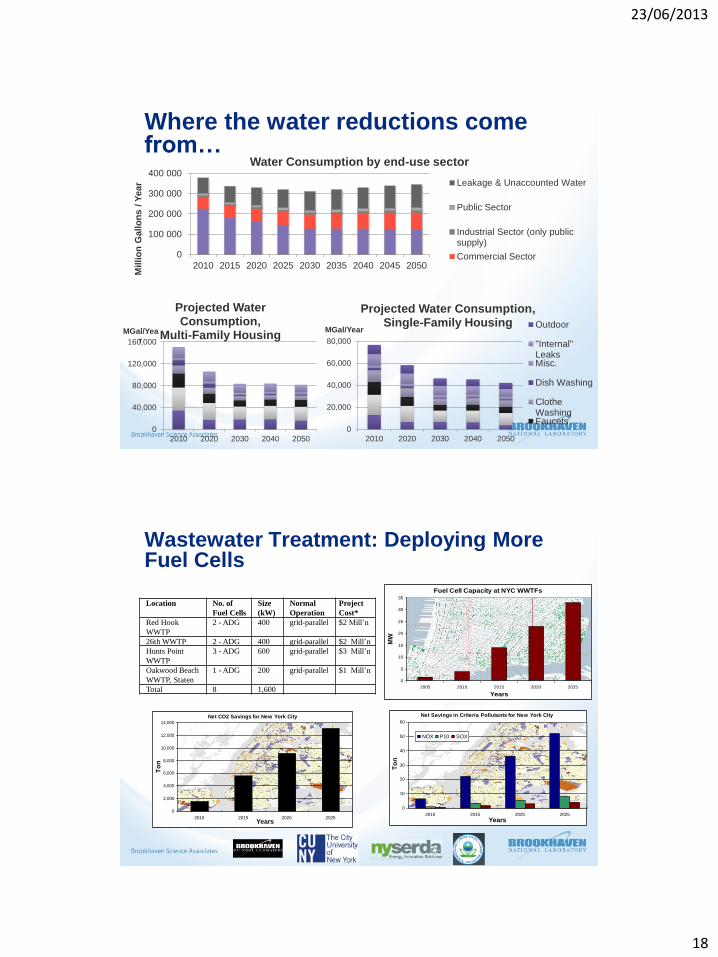
Where the water reductions come from…
0
100 000
200 000
300 000
400 000
2010 2015 2020 2025 2030 2035 2040 2045 2050
Millio
n G
allo
ns /
Year
Water Consumption by end-use sector
Leakage & Unaccounted Water
Public Sector
Industrial Sector (only publicsupply)
Commercial Sector
0
40,000
80,000
120,000
160,000
2010 2020 2030 2040 2050
MGal/Year
Projected Water Consumption,
Multi-Family Housing
0
20,000
40,000
60,000
80,000
2010 2020 2030 2040 2050
MGal/Year
Projected Water Consumption, Single-Family Housing Outdoor
"Internal"LeaksMisc.
Dish Washing
ClotheWashingFaucets
Wastewater Treatment: Deploying More Fuel Cells
Location No. of
Fuel Cells
Size
(kW)
Normal
Operation
Project
Cost*
Red Hook
WWTP
2 - ADG 400 grid-parallel $2 Mill’n
26th WWTP 2 - ADG 400 grid-parallel $2 Mill’n
Hunts Point
WWTP
3 - ADG 600 grid-parallel $3 Mill’n
Oakwood Beach
WWTP, Staten
1 - ADG 200 grid-parallel $1 Mill’n
Total 8 1,600
Fuel Cell Capacity at NYC WWTFs
0
5
10
15
20
25
30
35
2005 2010 2015 2020 2025
Years
MW
Net CO2 Savings for New York City
0
2,000
4,000
6,000
8,000
10,000
12,000
14,000
2010 2015 2020 2025Years
To
n
Net Savings in Criteria Pollutants for New York City
0
10
20
30
40
50
60
2010 2015 2020 2025
Years
To
n
NOX P10 SOX

23/06/2013
19
Thank You
Contacts:
Vatsal Bhatt [email protected]
Paul Friley [email protected]
Savvas Politis [email protected]
William Horak [email protected]