Embed Size (px)
Citation preview
Energy Use of Subway Networks in the Sustainability era
1
Sybil Derrible, Ph.D. Candidate, [email protected] of Civil Engineering, University of Toronto
CORS-INFORMS International Conference – Toronto, ON June 15, 2009

2
Rationale
Current Work: Networks Effects – Coverage, Directness, Connectivity
y = 59.613Ln(x) + 258.27
R2 = 0.4672
0.00
50.00
100.00
150.00
200.00
250.00
0.0000 0.0500 0.1000 0.1500 0.2000 0.2500 0.3000
Coverage Area / Total Area
Bo
ard
ing
s p
er c
apit
a
3
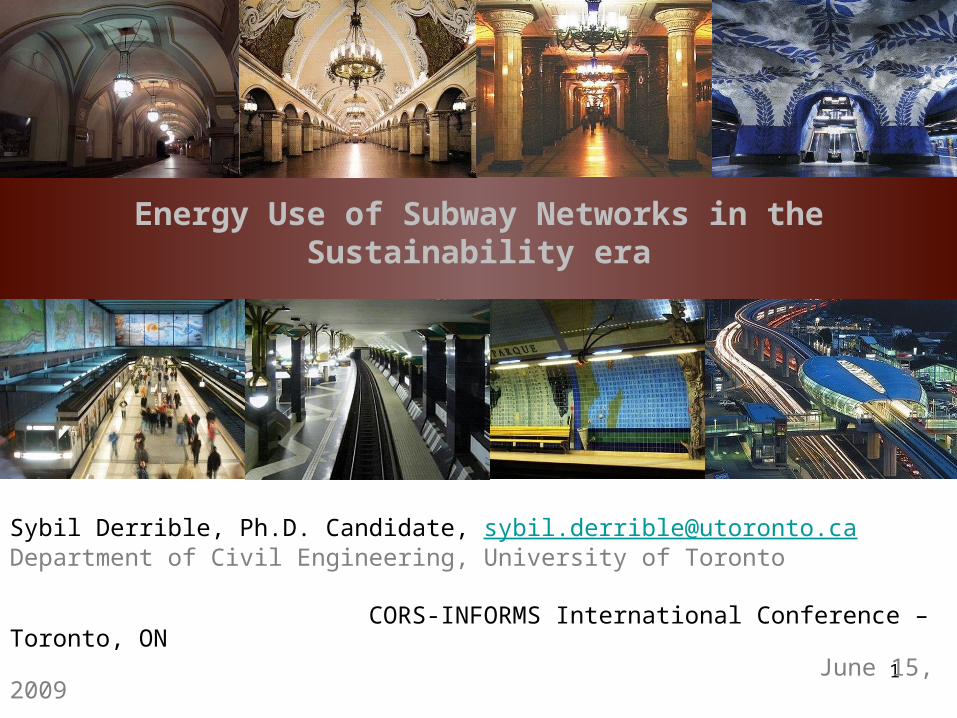
Rationale
Networks Effects - Applied
Getting to Carbon Neutral:
- Best Practices
- Rules of thumb
TTC Network in 25 years?

4
Context
- In the battle towards reducing GHG emissions, cities are of paramount importance (Copenhagen climate conference, December 2009)
- Transportation is one of the core issues
- Due to their environmental benefits, public transit systems are likely to grow
- It is clear that public transit is most often more environmentally sustainable than private automobiles, but:
What is the impact of network growth on energy use of
subway networks?

5
Framework
What does energy use mean?
- A larger network will emit more because it carries more riders, is it more sustainable or less?
- If we account for passengers: should we use energy per ride (boarding) or per passenger kilometres travelled (PKT)?
- Note: talk about energy use, not emissions of tCO2e because the energy grid is not known, and does not add information about the sustainability of subway networks
→ prefer to use energy use per ride (total boardings or boardings per capita)
Energy-use per PKT (MJ/PKT) Streetcar LRT Subway Commuter Rail Toronto 0.31 0.69 0.96 Montreal 0.41 2.25 Ottawa Calgary 0.25 Vancouver 0.38 0.73 European Avg 0.58 0.69 0.48 0.87 North-American Avg 0.65 0.60 0.60 1.37

6
Framework
What directly influences energy use?
- Size of the network (route length)
Tokyo (292km) vs. Toronto (69km)
- Number of operating subway/metro units (wagons)
London (3900) vs. Athens (216)
- Vehicle Technology

7
Framework
How to use network characteristics- Absolute Values (as collected)
- Relative Values (route length by population, metro units by population)
→ prefer absolute although consider differences during the analysis
PKT per track-km Streetcar LRT Subway Commuter Rail Toronto 13,309,671 15,364,738 1,969,227 Montreal 42,702,148 966,966 Ottawa 3,369,765 Calgary 10,007,934 Vancouver 19,130,976 800,175 European Avg 3,383,406 26,339,997 5,875,131 North-American Avg 7,935,681 16,166,881 1,817,752
City Route length (km) Metro UnitsToronto 68.747 641.98Montreal 60.858 758.99….. ….. …..
Subway

8
Dataset and Sources
Dataset:
- Originally planned to study 19 subway networks in the workd
- Narrowed down to 15 cities due to data availability
Sources:
- Route length: from each individual transit authorities (2008 data)
- Energy Use and Metro Units: Millennium Cities Database (1995 data)
Note: consider systems that have undergone few changes only

9
Results - partial
CityBoardings (million)
Route length (km)
Metro Units
Total Energy Use in TJ
Energy per unit (MJ/km)
Toronto 265.3 68.747 641.98 893.43 13.22
Montreal 278.2 60.858 758.99 573.90 9.57
Chicago 186.8 173.075 1133.99 1102.99 15.13
Washington DC 259.4 171.143 763.98 1246.98 18.63
San Francisco 99.3 182.252 610.99 773.54 10.96
Mexico City 1417 177.1 2540.95 3009.24 9.69
London 1078 438.725 3901.06 2212.03 6.32
Paris 1860.9 256.8 3419.90 1705.23 9.11
Lyon 96.5 29.3 184.00 117.02 9.43
Berlin 475 216.967 1513.99 995.07 7.65
Athens 92 52.003 216.00 103.97 6.93
Stockholm 297 109.48 873.01 843.27 10.10
Tokyo 2974 292.376 3241.06 2529.49 7.94
Osaka 912 125.419 1414.96 1179.41 9.64
Seoul 2264 287 2119.97 2397.30 10.22
10
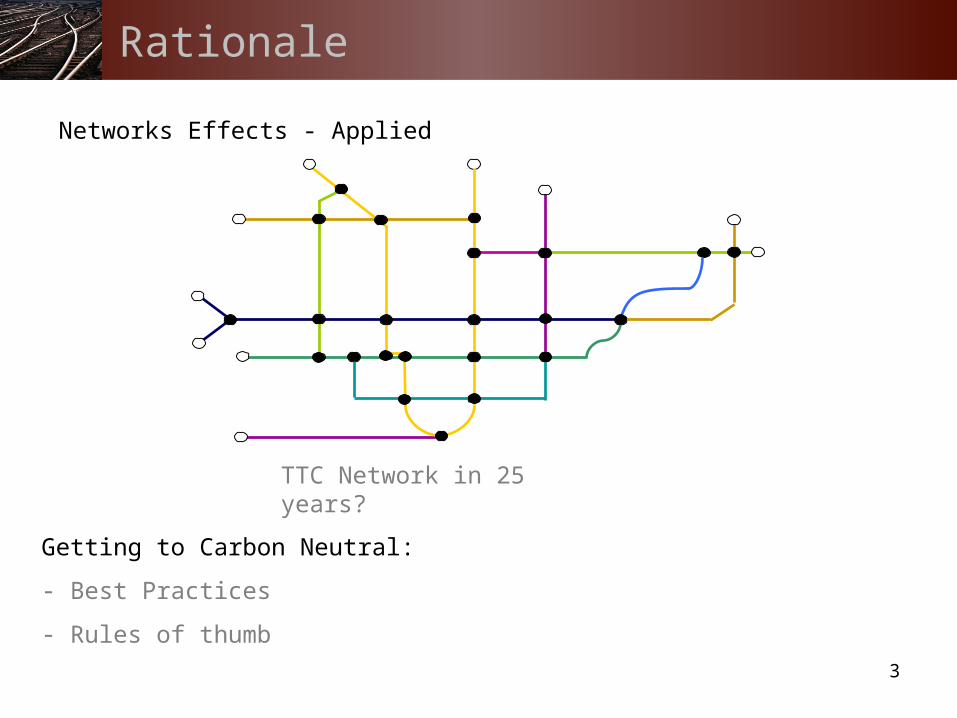
Vehicle Technology
13.22
15.13
18.63
10.96
6.32
9.119.43
7.656.93
7.94
10.22
9.57 9.69
10.1
9.64
0
2
4
6
8
10
12
14
16
18
20
En
erg
y u
se
pe
r w
ag
on
km
Average = 10.30
Should we take it in account?
We will see that network characteristics are more relevant

11
Boardings and Network Characteristics
0.00
50.00
100.00
150.00
200.00
250.00
0 50 100 150 200 250 300 350 400 450 500
Route Length (km)
Bo
ard
ing
s p
er c
apit
a
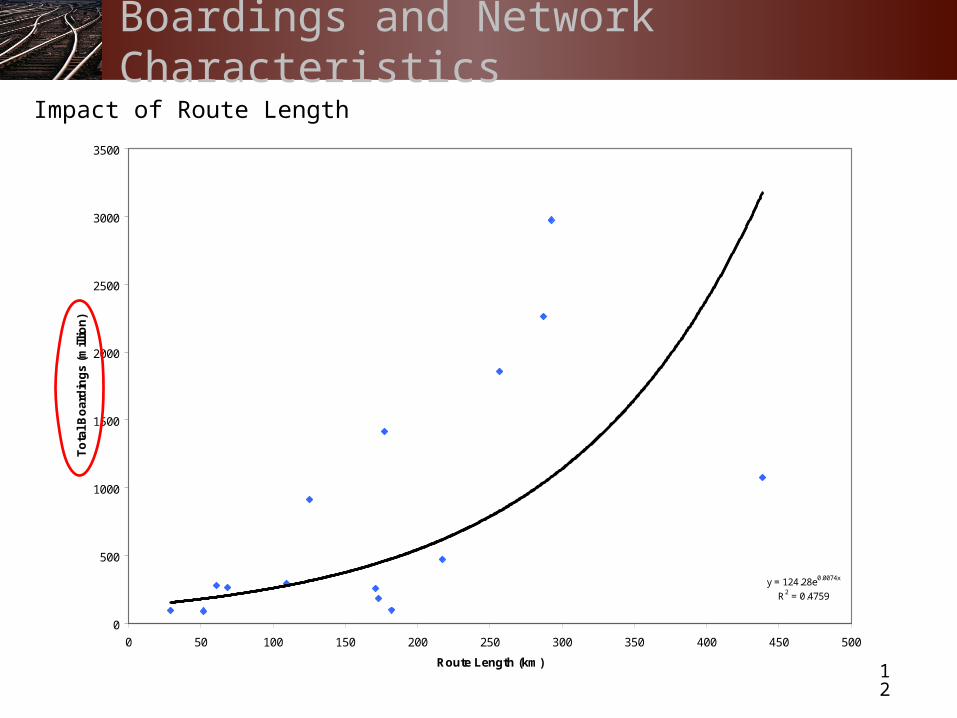
Impact of Route Length
12
Boardings and Network Characteristics
y = 124.28e0.0074x
R2 = 0.4759
0
500
1000
1500
2000
2500
3000
3500
0 50 100 150 200 250 300 350 400 450 500
Route Length (km)
To
tal B
oar
din
gs
(mill
ion
)
Impact of Route Length

13
Boardings and Network Characteristics
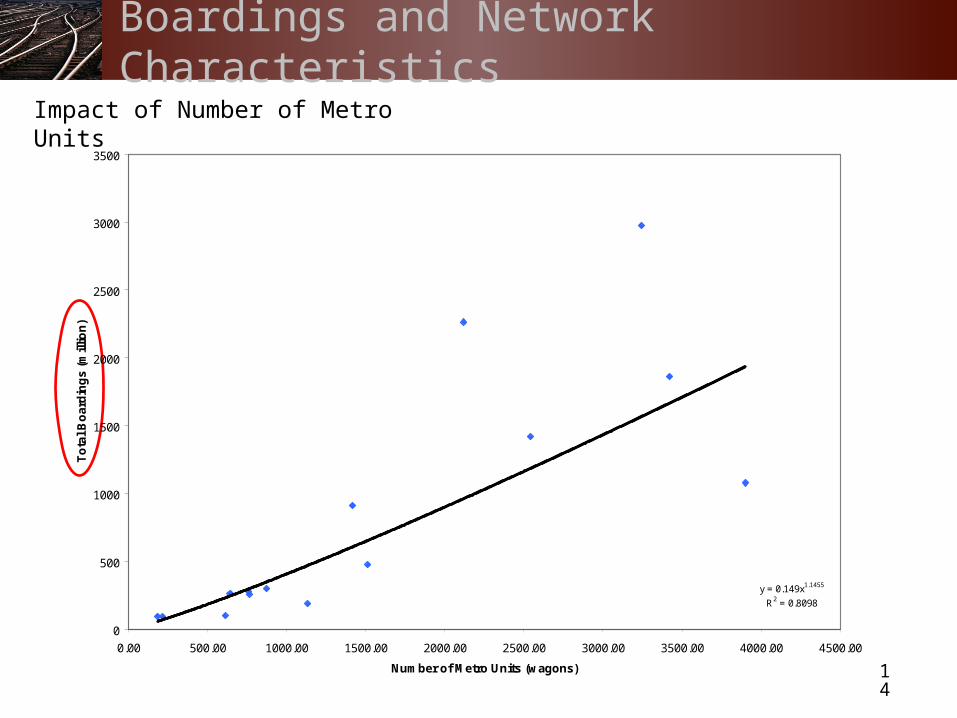
Impact of Number of Metro Units
0.00
50.00
100.00
150.00
200.00
250.00
0.00 500.00 1000.00 1500.00 2000.00 2500.00 3000.00 3500.00 4000.00 4500.00
Metro Units (wagon)
Bo
ard
ing
s p
er c
apit
a
14
Boardings and Network Characteristics
Impact of Number of Metro Units
y = 0.149x1.1455
R2 = 0.8098
0
500
1000
1500
2000
2500
3000
3500
0.00 500.00 1000.00 1500.00 2000.00 2500.00 3000.00 3500.00 4000.00 4500.00
Number of Metro Units (wagons)
To
tal B
oar
din
gs
(mill
ion
)

15
Network Characteristics
Route Length vs. Number of Metro Units
Seoul
Osaka
Tokyo
Stockholm
Athens
Berlin
Lyon
Paris
London
Mexico City
San Francisco
Washington DC
Chicago
Montreal
Toronto
y = 9.5091x - 118.73
R2 = 0.7602
0.00
500.00
1000.00
1500.00
2000.00
2500.00
3000.00
3500.00
4000.00
4500.00
0 50 100 150 200 250 300 350 400 450 500
Route length (km)
Nu
mb
er o
f m
etro
un
its
(wag
on
)

Seoul
Osaka
Tokyo
Stockholm
Athens
Berlin
Lyon
Paris
London
Mexico City
San Francisco
Washington DC
Chicago
Montreal
Toronto
0.00
500.00
1000.00
1500.00
2000.00
2500.00
3000.00
3500.00
0 50 100 150 200 250 300 350 400 450 500
Route Length (km)
To
tal E
ner
gy
Use
(T
J)
16
Energy Use and Network Characteristics
Energy and Route Length

Seoul
Osaka
Tokyo
Stockholm
Athens
Berlin
Lyon
Paris
London
Mexico City
San Francisco
Washington DC
Chicago
Montreal
Toronto
0.00
500.00
1000.00
1500.00
2000.00
2500.00
3000.00
3500.00
0.00 500.00 1000.00 1500.00 2000.00 2500.00 3000.00 3500.00 4000.00 4500.00
Metro Units (wagons)
To
tal E
ner
gy
Use
(T
J)
17
Energy Use and Network Characteristics
Energy and Number of Metro Units

Seoul
Osaka
Tokyo
Stockholm
Athens
Berlin
Lyon
Paris
London
Mexico City
San Francisco
Washington DC
Chicago
Montreal
Toronto
0
500
1000
1500
2000
2500
3000
3500
0.00 500.00 1000.00 1500.00 2000.00 2500.00 3000.00 3500.00
Total Energy Use in TJ
To
tal B
oar
din
gs
(mill
ion
)
18
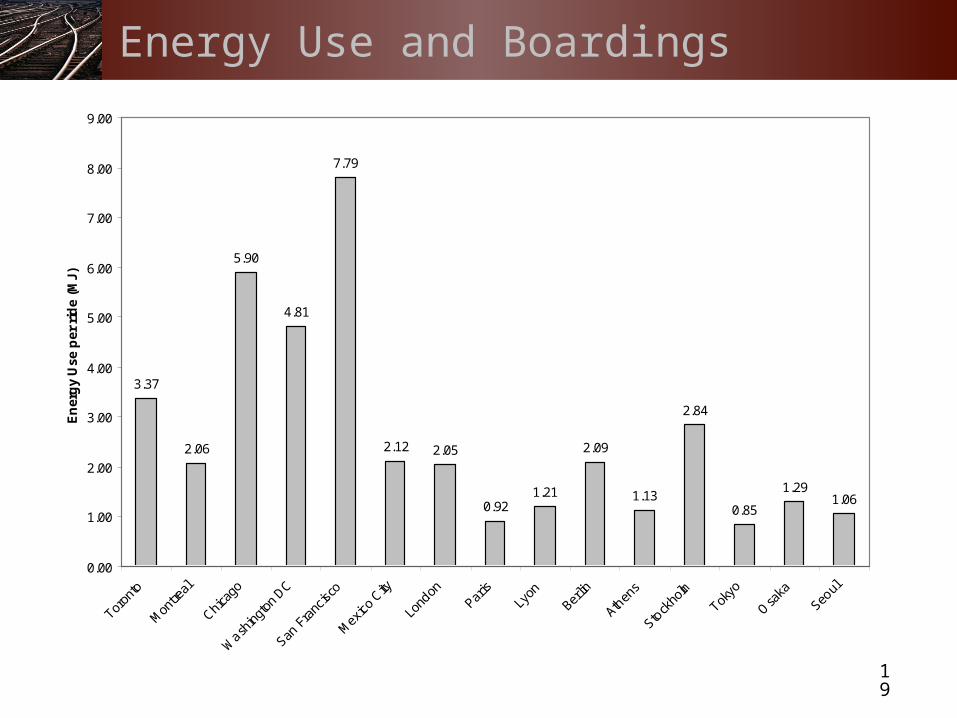
Energy Use and Boardings
Energy and Boardings
Is there a Relationship?
19
Energy Use and Boardings
3.37
2.06
5.90
4.81
7.79
2.12 2.05
0.921.21
2.09
1.13
2.84
0.85
1.291.06
0.00
1.00
2.00
3.00
4.00
5.00
6.00
7.00
8.00
9.00
Toron
to
Mon
treal
Chica
go
Wash
ingt
on D
C
San F
ranc
isco
Mex
ico C
ity
Lond
onPar
isLy
onBer
lin
Athen
s
Stock
holm
Tokyo
Osa
ka
Seoul
En
erg
y U
se p
er r
ide
(MJ)

3.37
2.06
5.90
4.81
7.79
2.12 2.05
0.921.21
2.09
1.13
2.84
0.85
1.291.06
0.00
1.00
2.00
3.00
4.00
5.00
6.00
7.00
8.00
9.00
Toron
to
Mon
treal
Chica
go
Wash
ingt
on D
C
San F
ranc
isco
Mex
ico C
ity
Lond
onPar
isLy
onBer
lin
Athen
s
Stock
holm
Tokyo
Osa
ka
Seoul
En
erg
y U
se p
er r
ide
(MJ)
20
Energy Use and Boardings
Perhaps the San Francisco BART is too long or network design could be optimized

3.37
2.06
5.90
4.81
7.79
2.12 2.05
0.921.21
2.09
1.13
2.84
0.85
1.291.06
0.00
1.00
2.00
3.00
4.00
5.00
6.00
7.00
8.00
9.00
Toron
to
Mon
treal
Chica
go
Wash
ingt
on D
C
San F
ranc
isco
Mex
ico C
ity
Lond
onPar
isLy
onBer
lin
Athen
s
Stock
holm
Tokyo
Osa
ka
Seoul
En
erg
y U
se p
er r
ide
(MJ)
21
Energy Use and Boardings
Perhaps Chicago is too “long”, similar to San Francisco
But still, it is has long as Mexico city, are there any other reasons
3.37
2.06
5.90
4.81
7.79
2.12 2.05
0.921.21
2.09
1.13
2.84
0.85
1.291.06
0.00
1.00
2.00
3.00
4.00
5.00
6.00
7.00
8.00
9.00
Toron
to
Mon
treal
Chica
go
Wash
ingt
on D
C
San F
ranc
isco
Mex
ico C
ity
Lond
onPar
isLy
onBer
lin
Athen
s
Stock
holm
Tokyo
Osa
ka
Seoul
En
erg
y U
se p
er r
ide
(MJ)
22
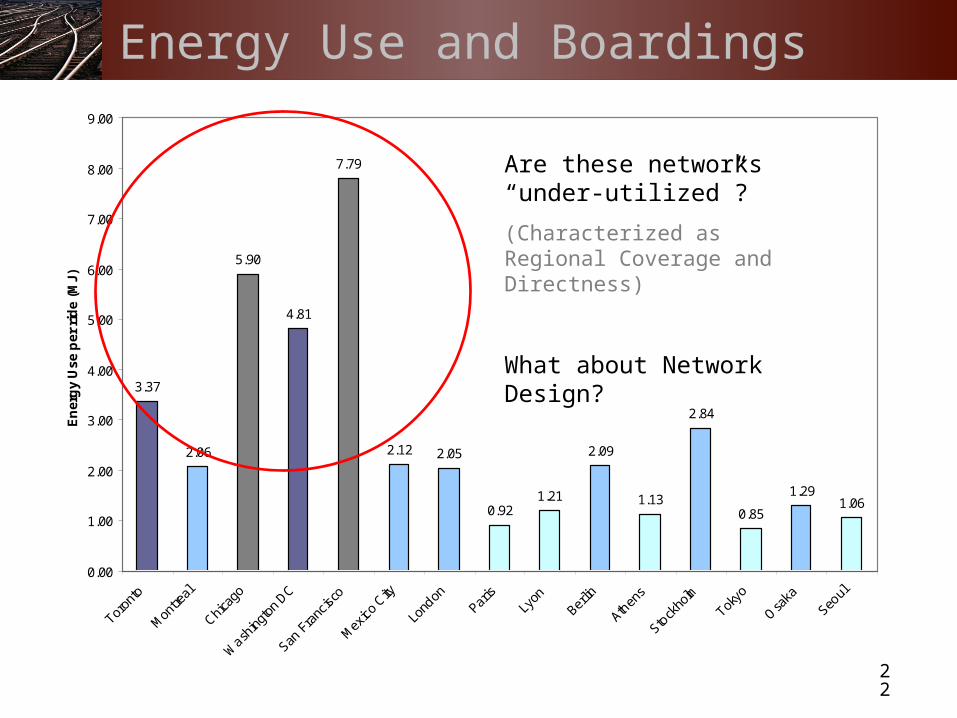
Energy Use and Boardings
Are these networks “under-utilized”?
(Characterized as Regional Coverage and Directness)
What about Network Design?

3.37
2.06
5.90
4.81
7.79
2.12 2.05
0.921.21
2.09
1.13
2.84
0.85
1.291.06
0.00
1.00
2.00
3.00
4.00
5.00
6.00
7.00
8.00
9.00
Toron
to
Mon
treal
Chica
go
Wash
ingt
on D
C
San F
ranc
isco
Mex
ico C
ity
Lond
onPar
isLy
onBer
lin
Athen
s
Stock
holm
Tokyo
Osa
ka
Seoul
En
erg
y U
se p
er r
ide
(MJ)
23
Energy Use and Boardings
Could these networks be “over-utilized”?
The smallest systems (Athens and Lyon are along with the largest (Tokyo, Paris).
What about their design?

3.37
2.06
5.90
4.81
7.79
2.12 2.05
0.921.21
2.09
1.13
2.84
0.85
1.291.06
0.00
1.00
2.00
3.00
4.00
5.00
6.00
7.00
8.00
9.00
Toron
to
Mon
treal
Chica
go
Wash
ingt
on D
C
San F
ranc
isco
Mex
ico C
ity
Lond
onPar
isLy
onBer
lin
Athen
s
Stock
holm
Tokyo
Osa
ka
Seoul
En
erg
y U
se p
er r
ide
(MJ)
24
Energy Use and Boardings
What about these networks?

25
Conclusion
- We looked at 15 subway networks in the world to investigate the impact of network size on energy use
- Evidently, Total Energy Use of Subway systems is highly correlated with network size
- However Energy Use per Ride seems to be relatively independent of network size
- Emphasis is put on NETWORK DESIGN since it is correlated with Ridership
- New projects should therefore focus on network design in order to favour ridership, which will in turn minimize energy use per ride


![A Moving Target Defense Mechanism for MANETs Based on ...ksun/publications/Sybil-cns2013.pdfmechanism – the Sybil attack [4] – into an effective defense mechanism. In Sybil, a](https://img.dokumen.tips/doc/110x75/5f1d03dc1e983c31d16f21c7/a-moving-target-defense-mechanism-for-manets-based-on-ksunpublicationssybil-.jpg)