Embed Size (px)
Citation preview
Bioresource Technology 100 (2009) 3497–3505
Contents lists available at ScienceDirect
Bioresource Technology
journal homepage: www.elsevier .com/locate /b ior tech
Energy use and recovery strategies within wastewater treatment and sludgehandling at pulp and paper mills
Alina Stoica *, Maria Sandberg, Ola HolbyDepartment for Energy, Environmental and Building Technology, Karlstad University, 651 88 Karlstad, Sweden
a r t i c l e i n f o a b s t r a c t
Article history:Received 28 November 2008Received in revised form 20 February 2009Accepted 23 February 2009
Keywords:Pulp and paper millsWastewater treatmentSludge handlingBioenergySustainability
0960-8524/$ - see front matter � 2009 Elsevier Ltd. Adoi:10.1016/j.biortech.2009.02.041
* Corresponding author. Tel.: +46 54 700 2357; faxE-mail address: [email protected] (A. Stoica).
This paper presents an inclusive approach with focus on energy use and recovery in wastewater manage-ment, including wastewater treatment (WWT) and sludge handling. Process data from three Swedishmills and a mathematical model were used to evaluate seven sludge handling strategies. The results indi-cate that excess energy use in WWT processes counters the potential energy recovery in the sludge han-dling systems. Energy use in WWT processes is recommended to aim for sufficient effluent treatment, notfor sludge reduction. Increased secondary sludge production is favourable from an energy point of viewprovided it is used as a substrate for heat, biogas or electricity production.
� 2009 Elsevier Ltd. All rights reserved.
1. Introduction
This is a new and inclusive approach to pulp and paper millwastewater management, including wastewater treatment(WWT) and sludge handling. It is of practical importance for theidentification of energy efficient strategies.
WWT is necessary for a forest industry, however, the productsthat bring income are pulp and/or paper. WWT is associated withhigh investment and running costs. Final disposal of solid wastein the form of sludge, is costly and for this reason efforts have beenmade to decrease sludge production in the WWT plant (Mahmoodand Elliott, 2006; Wei et al., 2003). Mahmood and Elliott (2006)concluded that it is more appealing to reduce sludge formationthrough changes in the WWT processes than to reduce the amountof sludge for disposal by post-treatment of excess waste activatedsludge. This conclusion was partly based on high disposal prices.Among other factors the currently increasing energy prices shiftthe focus from regarding sludge as a disposal problem to utilisingsludge as a substrate for energy recovery. Three mill cases arecompared here with regard to theoretical biosolids productionand oxygen demand in WWT. The potential energy recovery fromthe produced sludge was estimated using a mathematical modelproposed by Stoica (2007), which is further developed in this paper.The sludge handling model was used to compare seven commer-cially available sludge handling strategies. The processes involved
ll rights reserved.
: +46 54 700 1165.
in wastewater management are discussed in this study using a sus-tainable development perspective.
This work aims to identify where and how within the system ofwastewater management, the greatest potential for energy savingand recovery can be achieved.
2. Background
2.1. Description of sludge from pulp and paper WWT
Primary sedimentation is essential for pulp and paper WWT asit removes cellulosic fibres, lignin and sand from the effluent. In or-der to save raw material, the fibres in the PS can be recovered tocertain types of pulp processes.
Internationally, aerobic biological WWT is common for treat-ment of pulp and paper mill effluents. Most Swedish mills have abiological WWT unit. Aeration in biological WWT often requiresmore than 50% of the electricity used in the entire WWT plant.The alternative is using anaerobic treatment methods that requireno oxygen and produce methane. An additional characteristic isthat anaerobic biological WWT produces ten times less sludge thanaerobic WWT. The process is slower and more sensitive to distur-bances compared with conventional aerobic biological WWT. It isused by a small number of mills. Anaerobic WWT is not dealt within this paper since the studied mills do not apply the technology.
Chemical WWT requires less electricity than aerobic biologicalWWT, and the sludge production is five to ten times greater perCOD reduced (Almemark et al., 1991). Biological and chemical
Nomenclature
WWT Wastewater treatmentPS Primary sludgeSS Secondary sludgeTS Total solidsVS Volatile solidsSRT Solids retention timeCOD Chemical oxygen demandDO Dissolved oxygenLSP Low sludge productionNSSC Pulp neutral sulphite semi chemical pulpCTMP Chemo thermo mechanical pulpTMP Thermo mechanical pulptSRT Solids retention time (h)kd Decay coefficient (0.12 h�1)fd Fraction of biomass left after cell decay (0.15 g/g biomass)S0 � S Substrate reduction (g/m3)Y Biomass yield (0.4 g biomass/g substrate)Yn Biomass yield for nitrificationNOx Amount of reduced NO3–NQ Process water flow (m3/h)PX;VSS Biomass production (g/h)h Temperature activity coefficient (1.04)T Temperature (�C)R0 Oxygen required (kg/day)Px;bio Biomass outtake per day (kg/day)P Percent volatile solids reductionxVS1 Mass VS per mass TS in feed (kgVS/kgTS)xVS2 Mass VS per mass TS in digested sludge (kgVS/kgTS)_msludge Mass flux of sludge (kg/year)_mgas Mass flux of biogas (kg/year)
cp;s Heat capacity of sludge, approx. 1.05 (J/kg K) (Kjellénand Andersson, 2002)
cp;w Heat capacity of water, approx. 3.18 (J/kg K)
cp;g Heat capacity of biogas, approx. 1.6 (J/kg K)xTS1 Total solids from reactor (kg of dry sludge/kg of moist
sludge)xTS2 Total solids to reactor (kg of dry sludge/kg of moist
sludge)DT1 Outlet sludge temperature minus standard temperature
of 0 K (K)DT2 Inlet sludge temperature minus standard temperature
of 0 K (K)DT3 Reactor temperature minus temperature outside of the
reactor (K)DT4 Reactor temperature minus standard temperature of 0 K
(K)DT5 Reactor temperature minus inlet sludge temperature (K)Uroof Heat transfer coefficient of fixed concrete cover 100 mm
thick and insulated with a 25 mm insulating board, ap-prox. 1.4 (W/m2 K) (Tchobanoglous et al., 2003)
Uwall Heat transfer coefficient of a 300 mm thick concretewall with insulation, approx. 0.7 (W/m2 K) (Tchobanog-lous et al., 2003)
Ufloor Heat transfer coefficient of a 300 mm thick concretefloor on dry earth, approx. 1.7 (W/m2 K) (Tchobanoglouset al., 2003)
An Surface area of unit (m2)Un Heat transfer coefficient for roof, wall or floor.qp:net:m Net calorific value at constant pressure for moist sample
(kJ/kg of moist sludge)qp:net:d Net calorific value at constant pressure for dry and ash
free sample (kJ/kg of dry ash free sludge)hevap Enthalpy of vaporisation at 25 �C and 1 bar, 2443 (kJ/kg
of water)A Content of ash (kg of ash/kg of dry sludge)xTS Total solids (kg of dry sludge/kg of moist sludge)
3498 A. Stoica et al. / Bioresource Technology 100 (2009) 3497–3505
WWT reduces to some extent different fractions of COD and com-plement each other (Engström and Gytel, 2000).
2.2. Low sludge production in biological treatment processes
Many of the techniques for low sludge production build on ex-tended aeration. Wei et al. (2003) describe techniques that areused to influence microorganism metabolism in the direction ofdecreasing sludge production. In a biological system with long sol-ids retention time (SRT) and low food to biomass ratio, the mainte-nance metabolism predominates. The substrate is limited, forcingmicroorganisms to use the substrate for maintenance rather thanfor biosynthesis. By adapting the environment in the bacterialtreatment stages to suit protozoa and metazoa, the food chain isprolonged and the bacteria are degraded, and hence sludge produc-tion decreases.
The low sludge production (LSP) approach is enhanced by usingaerobic biological treatment in two steps. In the first step, fastgrowing dispersed bacteria are promoted by a short SRT and a highBOD load. In the second step, predators such as protozoa and met-azoa consume bacteria and reduce the sludge volume (Werkeret al., 2004). Several concepts where the microbial food chain hasbeen extended by two or more treatment steps are found amongnew treatment plants (Asplind, 2002; Lindh and Mårtensson,2005; Rodden, 2005).
The disadvantage with an increased SRT and a prolonged foodchain is the increased use of oxygen. Higher organisms need alonger SRT and a higher concentration of dissolved oxygen (DO)
than bacteria do. The oxygen consumption and consequently theelectricity demand increase as the sludge production decreases.Mahmood and Elliott (2006) studied the effect of modifying a con-ventional activated sludge (AS) process into a LSP process. The LSPprocess consumed 25% more oxygen while producing 36% lesssludge.
2.3. Sludge handling
Solid residue from wastewater management at pulp and papermills in Sweden is most often considered as solid waste. The solidresidue that crosses the plant gates will be referred to as solidwaste in this paper with reference to the chosen system bound-ary. Some mills are considering an approach to the disposal prob-lem where the solid waste is reused as soil amendment or forestfertilisation. The two dominating sludge handling strategies are(1) mechanical dewatering and composting to make soil amend-ment or landfill covering material and (2) mechanical dewateringand incineration with landfill application of the ashes. For bothstrategies the cost is directly proportional to the mass of solidwaste.
Mechanical dewatering is the most energy efficient way to re-move large quantities of water, thereby increasing the heating va-lue and decreasing the mass of sludge. However the sludge canonly reach dry content levels of maximum 18–50% (Krogeruset al, 1999), depending on the sludge type and dewatering unit.
Composting is seldom accompanied by energy recovery andgenerates a larger amount of solid residue than incineration.
A. Stoica et al. / Bioresource Technology 100 (2009) 3497–3505 3499
The main drawback of incinerating mechanically dewateredsludge is a low net calorific value of 2–6 MJ/kg due to a high con-tent of water, compared with the net calorific value of bark andblack liquor, which are the predominant biofuels in mills. Thesevalues are approximately 7 and 12 MJ/kg, respectively. Thereare two fundamentally different approaches to the incinerationof sludge in pulp and paper industry. Sludge can be incineratedwith black liquor in a black liquor recovery boiler (Harila andKivilinna, 1999), or it can be mixed with biofuel, for examplebark, and incinerated in a biofuel boiler of fluidised bed or rostertype. In the course of this work the two approaches will not beseparated. The main operational problems with sludge incinera-tion include ash fusion, scaling and high emission levels of SO2
and NOx. Decreased bed temperatures and difficulties with boilerfeeding are additional problems associated with wet sludgeincineration.
2.4. Case description
Three Swedish pulp mills with different treatment technologies,amounts of water treated, electricity demands for WWT andamounts of sludge produced were studied. At the time of sampling,the WWT processes of the three mills reduced 26–32 tonnes ofCOD per day. Average operation data from three months to oneyear were used for evaluation. The mills were selected with thepurpose of obtaining data from different types of WWT processes,sludge yields and sludge handling strategies.
In Table 1 WWT and sludge handling data from the three millsis compared. The amount of sludge produced and the electricityneeded varied due to differences in the WWT process.
Table 1Descriptive process data for case mills.
Mill 1
Pulp process NSSCa and kraft pulpPulp production (t/year) 570,000Paper and board production (t/
year)517,000
Wastewater treatment Primary sed. MultiBio
Sludge handling strategy Mech. dew., thermal dew. and incineration withblack liquor
Spent process water flow (m3/day) 45,600Total COD red. (t/day) 30
Bio 30Chemical –
SRT in Bio stage with sludgerecirculation
6
Total sludge produced (t TS/day) 11Primary sludge –Bio sludge 11Chemical sludge –
Mixed sludge yield (t/t COD red.) 0.36Secondary sludge yield (t/t COD
red.)0.36
Bio 0.36Chemical –
Electrical power WWT (kW) 1778Aeration in bio 1130Flocculation and flotation –
Total for WWT (kWh/t COD red.) 1390Bio 884Chemical –
Total for WWT (kWh/t sludge) 3885Aeration in bio 2469Flocculation and flotation
a NSSC = Neutral sulphite semi chemical.b CTMP = Chemo thermo mechanical pulp.c TMP = Thermo mechanical pulp.d AS = Active sludge treatment.
Mill 1 is an integrated pulp and paper mill that produces kraftpulp, neutral sulphite semi chemical (NSSC) pulp, fluting andstrong papers. PS is reused in the pulp process. At Mill 1, a MultiBioconcept is used for secondary treatment. In a MultiBio concept, thebiological processes are divided (Sandberg and Holby, 2008). Withthis concept, high treatment efficiency and a comparatively lowsludge yield is achieved. The SS is treated in a black liquor recoverysystem comprising four evaporation stages and one recoveryboiler.
Mill 2 produces CTMP and kraft pulp used for board production.The board is produced to make liquid food packages, making fibrerecovery unsuitable for reasons of hygiene. Process effluents fromthe two pulp production plants are treated in a converted aerated la-goon. A conventional aerated lagoon is usually designed to have aprolonged hydraulic retention time without continuous sludge re-moval. Therefore, it has the lowest sludge yield among the tech-niques compared in this study. The studied aerated lagoon hasbeen converted and today it runs with sludge recirculation. Approx-imately 30% of the flow through the lagoon is recirculated to achievea biosolid concentration of between 1–2 g/l. Part of the sludge isrecirculated to reach higher sludge concentration and higher effi-ciency. The biologically treated effluent is then treated together withpaper machine effluents using chemical flocculation. The excesssludge from the bio-treatment and chemical treatment is dewateredmechanically with parts of the PS and then co-incinerated with therest of the PS and the bark in a fluidised bed biofuel boiler.
Mill 3 produces TMP and CTMP pulp. The process effluent istreated with a conventional activated sludge (AS) as well as withchemical flocculation with flotation. The sludge is mechanicallydewatered and sent to a secondary producer for composting.
Mill 2 Mill 3
CTMPb and kraft pulp TMPc and CTMPb pulp524,000 147,000692,000 –
Primary sed. Aerated lagoon with sludge return,chem.floc.
Primary sed. ASd, chem.floc.
Mech. dew. and incineration with bark Mech. dew., sludge handlingoff-site
58,000 820032 2630 212 521 4
49 3231 68 910 161.52 1.200.54 0.96
0.25 0.455.21 3.071873 7621300 442
1001357 6741000 486
455947 6474162 486
455
3500 A. Stoica et al. / Bioresource Technology 100 (2009) 3497–3505
In Table 1 it is shown how the reuse of primary sludge in thepulp process affects the total amount of sludge. Mill 1 producesless sludge than Mill 2 and Mill 3. Chemical flocculation has a largeimpact on the amount of sludge. As Almemark et al. (1991) re-ported, chemical treatment methods produces approximately tentimes more sludge than conventional biological treatment meth-ods. For the mills studied in this paper, the bio-sludge productionvaries with treatment technology.
It was not possible to obtain data on the energy requirement forchemical treatment at Mill 2, and Mill 1 does not use chemical sec-ondary treatment.
3. Method
3.1. Sludge production and oxygen demand
Theoretical sludge production and oxygen demand were calcu-lated according to Tchobanoglous et al. (2003). Bio-sludge produc-tion (PX) can be divided into three parts due to different substrates.A represents biomass produced by the amount of substrate used,i.e., the COD reduction. B represents biomass produced by sub-strate from decomposed biomass. C represents biomass from nitri-fication. As pulp and paper effluents are often low in nutrients partC in Eq. (1) is not used for further evaluation.
PX;VSS ¼QYðS0 � SÞ1þ ðkdÞtSRT
ðAÞ
þ fdðkdÞQYðS0 � SÞtSRT
1þ ðkdÞtSRTðBÞ
þ QYnðNOxÞ1þ ðkdÞtSRT
ðCÞ
ð1Þ
The decay coefficient is temperature dependent (see Section 2).h = 1.04 was used to adjust kd in Eq. (2):
kdðTÞ ¼ kdð20 �CÞhT�20 �C ð2Þ
The oxygen needed to reduce COD and build biomass is theoret-ically estimated by Eq. (3):
R0 ¼ QðS0 � SÞ � 1:42Px;bio ð3Þ
3.2. Sludge handling model
The sludge handling model compares the energy use and recov-ery as well as the solid waste production of seven commerciallyavailable sludge handling strategies in Sweden. The system bound-aries are modified from those used in previous work (Stoica, 2007)to include the treatment process from spent process water to theplant gates. The outline of the sludge handling model and the se-ven sludge handling strategies compared in this paper are pre-sented in Fig. 1. Each separate computational unit is described inthe following sections. The energy balances account for the energythat is utilised in the computational units as well as for the energyproducts resulting from the sludge handling strategies. The massbalances correspond to the solid waste that leaves the plant gates.The software used for the calculations was Matlab. Each computa-tional unit was modelled in a separate function file and called onfrom one coordinating m-file.
3.3. Mechanical dewatering
Pure SS and anaerobically digested SS are assumed to reach20% TS (Tchobanoglous et al., 2003). The electricity demand is as-sumed to be 1 kWh/m3 of water removed. After the mechanicaldewatering, it is assumed that all solid material is found in thewet sludge. The required input data is; mass of sludge, dry con-tent and sludge type (SS:PS ratio or digestate). The computationalunit will answer with mass of sludge, dry content and electricalenergy use.
3.4. Thermal dewatering
If there is no thermal dewatering at the mill, the model assumesa depressurised indirect contact rotating drum dryer, run in batchwith a pressure of approximately 0.2 bars and water at 70 �C as aheat source. The electricity demand was approximated as19 kWh/tonne of water removed in accordance with the resultsof Eklund and Eriksson (2002). The heat required in the moduleis approximated to be the sum of the heat required for heatingthe wet sludge to 60 �C and the heat of evaporation (for purewater) at 0.2 bars. The heat capacity of the sludge used was1.05 kJ/kg K (Kjellén and Andersson, 2002). For water, a heat capac-ity of 4.2 kJ/kg K was used. It is assumed that the resulting ther-mally dewatered sludge/digestate has a TS content of 68%(identical for all three mills) and that no solid material is lost fromthe dry sludge in the process. The required input data is mass ofsludge and dry content. The computational unit will answer withmass of sludge, dry content, heat use and electrical energy use.
3.5. Anaerobic digestion
The interest in biogas production has grown considerably in theindustry. Volatile solids reduction and gas production for anaerobicdigestion of secondary sludge was calculated using the results fromPuhakka et al. (1992). They used an active digester volume of 2.5 m3
for mesophilic anaerobic digestion of secondary sludge from a kraftpulp mill. The SRT was 25 days and a recycle ratio of 1.0 was used.The temperature was kept at 36 �C and the optimal feed ratio wasfound to be 2.2 kgVS per m3 and day. They recorded a volatile solidsreduction (P) of 55% (see Eq. (4)), and a gas production term of0.360 m3 per kgVSadded. The methane content was 56–57%.
P ¼ 100xVS1 � xVS2
xVS1 � xVS1 xVS2
ðPuhakka et al:; 1992Þ ð4Þ
The eight most significant flows regarding heat and electricityas well as the production of biogas that comprise the energy bal-ance model of the anaerobic digestion computational unit are:
(1) Heat loss due to the outflow of sludge:
q1 ¼ _msludge;outDT1ðcp;sxTS1 þ cp;wð1� xTS1 ÞÞ ð5Þ
(2) Heat addition through incoming sludge:
q2 ¼ _msludge;inDT2ðcp;sxTS2 þ cp;wð1� xTS2 ÞÞ ð6Þ
(3) Heat losses through the reactor walls:
q3 ¼ DT3
XUnAn ð7Þ
(4) Heat losses caused by removal of biogas:
q4 ¼ _mgascp;gDT4 ð8Þ
(5) Heating to reactor temperature:
q5 ¼ _msludge;inDT5ðcp;sxTS2 þ cp;wð1� xTS2 ÞÞ ð9Þ
(6) Electricity for mixing, pumping, etc.:(7) Approximately 5% of the energy content of produced biogas
(Dalemo et al., 1997).(8) Heat losses in piping between the heat exchanger and the
reactor:Negligible.(9) Biogas production:Energy content of produced biogas
according to the mass balance model.
The required input data is mass of sludge, dry content and ashcontent. The computational unit will answer with mass of sludge,dry content, ash content, type of sludge (digestate), heat use, elec-trical energy use and amount of energy as biogas.
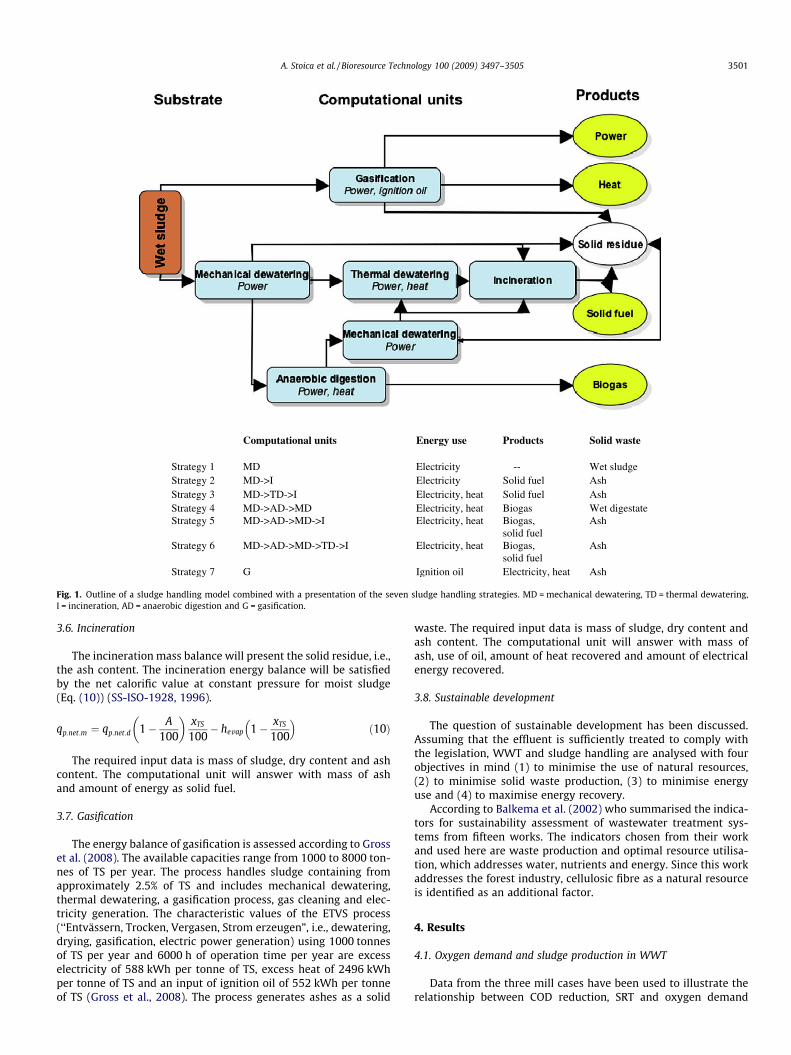
Computational units Energy use Products Solid waste
Strategy 1 MD Electricity -- Wet sludgeStrategy 2 MD->I Electricity Solid fuel AshStrategy 3 MD->TD->I Electricity, heat Solid fuel AshStrategy 4 MD->AD->MD Electricity, heat Biogas Wet digestateStrategy 5 MD->AD->MD->I Electricity, heat Biogas,
solid fuelAsh
Strategy 6 MD->AD->MD->TD->I Electricity, heat Biogas,solid fuel
Ash
Strategy 7 G Ignition oil Electricity, heat Ash
Fig. 1. Outline of a sludge handling model combined with a presentation of the seven sludge handling strategies. MD = mechanical dewatering, TD = thermal dewatering,I = incineration, AD = anaerobic digestion and G = gasification.
A. Stoica et al. / Bioresource Technology 100 (2009) 3497–3505 3501
3.6. Incineration
The incineration mass balance will present the solid residue, i.e.,the ash content. The incineration energy balance will be satisfiedby the net calorific value at constant pressure for moist sludge(Eq. (10)) (SS-ISO-1928, 1996).
qp:net:m ¼ qp:net:d 1� A100
� �xTS
100� hevap 1� xTS
100
� �ð10Þ
The required input data is mass of sludge, dry content and ashcontent. The computational unit will answer with mass of ashand amount of energy as solid fuel.
3.7. Gasification
The energy balance of gasification is assessed according to Grosset al. (2008). The available capacities range from 1000 to 8000 ton-nes of TS per year. The process handles sludge containing fromapproximately 2.5% of TS and includes mechanical dewatering,thermal dewatering, a gasification process, gas cleaning and elec-tricity generation. The characteristic values of the ETVS process(‘‘Entvässern, Trocken, Vergasen, Strom erzeugen”, i.e., dewatering,drying, gasification, electric power generation) using 1000 tonnesof TS per year and 6000 h of operation time per year are excesselectricity of 588 kWh per tonne of TS, excess heat of 2496 kWhper tonne of TS and an input of ignition oil of 552 kWh per tonneof TS (Gross et al., 2008). The process generates ashes as a solid
waste. The required input data is mass of sludge, dry content andash content. The computational unit will answer with mass ofash, use of oil, amount of heat recovered and amount of electricalenergy recovered.
3.8. Sustainable development
The question of sustainable development has been discussed.Assuming that the effluent is sufficiently treated to comply withthe legislation, WWT and sludge handling are analysed with fourobjectives in mind (1) to minimise the use of natural resources,(2) to minimise solid waste production, (3) to minimise energyuse and (4) to maximise energy recovery.
According to Balkema et al. (2002) who summarised the indica-tors for sustainability assessment of wastewater treatment sys-tems from fifteen works. The indicators chosen from their workand used here are waste production and optimal resource utilisa-tion, which addresses water, nutrients and energy. Since this workaddresses the forest industry, cellulosic fibre as a natural resourceis identified as an additional factor.
4. Results
4.1. Oxygen demand and sludge production in WWT
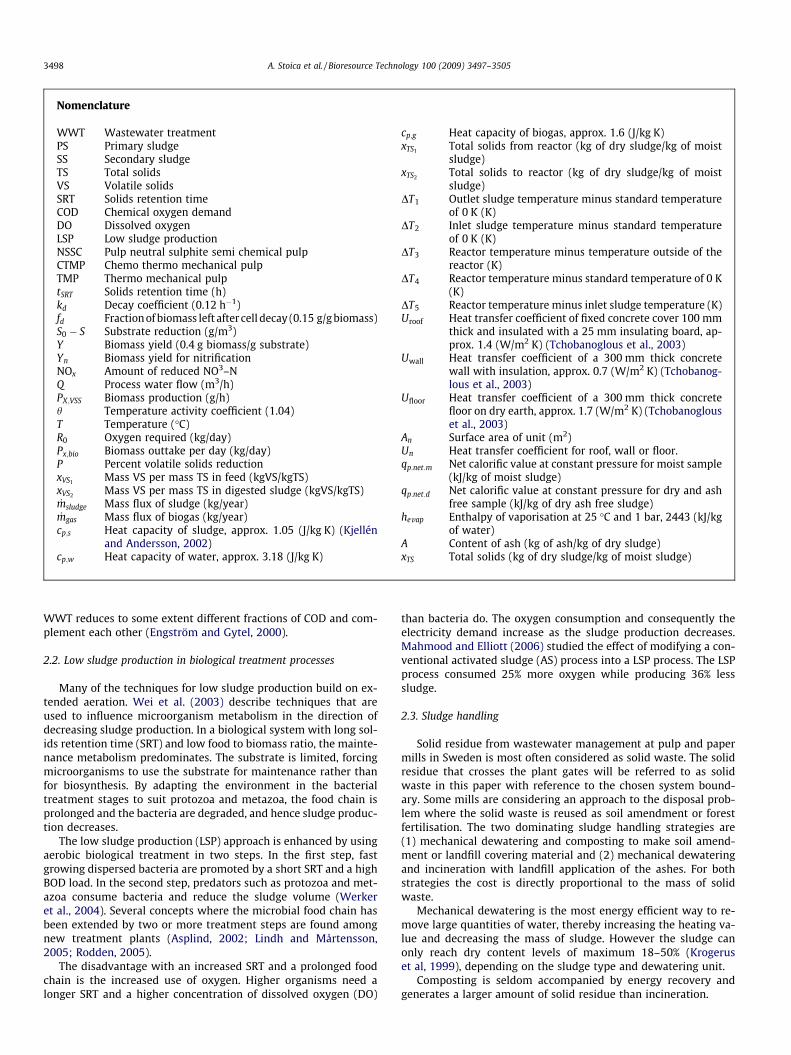
Data from the three mill cases have been used to illustrate therelationship between COD reduction, SRT and oxygen demand

Fig. 2. The influence of solids retention time (SRT) and temperature on bio-sludgeproduction (PX) and oxygen demand (Ro) for Mills 1, 2 and 3 that reduce 30, 32 and26 tonnes of COD per day. The Mill 2 calculations are based on biological treatmentat 20 �C, whereas the other two are based at 37 �C.
-4
-3
-2
-1
0
1
2
3
WW
T
MD
TD I WW
T
MD
AD
MW
h/tC
OD
red
Mill 1 (s3)Mill 2 (s3)Mill 3 (s3)Mill 1 (s4)Mill 2 (s4)Mill 3 (s4)
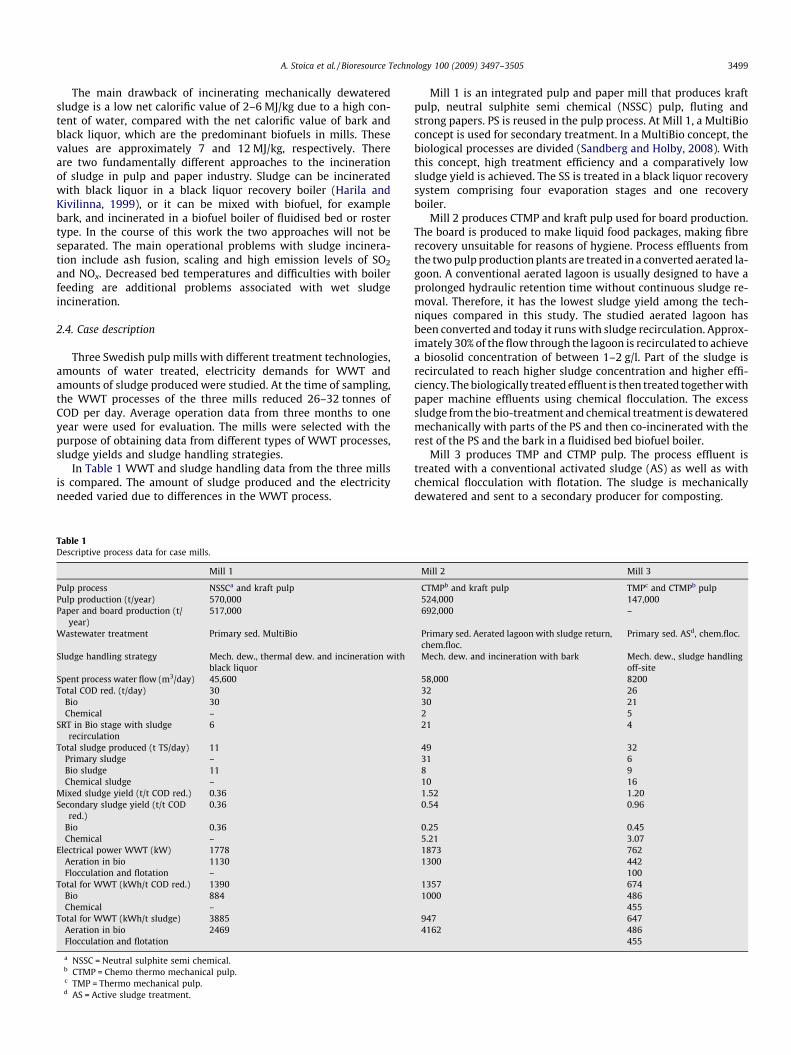
Fig. 4. Results from secondary sludge energy simulations on the current wastewa-ter treatment combined with sludge handling Strategies 3 and 4, expressed asenergy per tonne of reduced COD. (WWT = wastewater treatment, MD = mechanicaldewatering, TD = thermal dewatering, I = incineration, AD = anaerobic digestion).
3502 A. Stoica et al. / Bioresource Technology 100 (2009) 3497–3505
presented in Fig. 2. When the SRT is prolonged, a large portion ofthe sludge is degraded to substrate for the next generation ofmicroorganisms. For every generation, one part of the substrateis used for biosynthesis, the other part for respiration. Thereforethe oxygen need will increase with prolonged SRT. Sludge decaysslowly, at low temperatures, and the release of nutrients for thenext generation of microorganisms is slow. As a result, less bioso-lids is produced and less oxygen is needed.
4.2. Energy use and recovery
The total energy use and recovery from actual sludge mix withthe current sludge management at the case mills per tonne of CODreduced is presented in Fig. 3. Normalisation with regard to CODreduction is done to make the three mills comparable with eachother. Mill 1 has mechanical dewatering to 8% TS with subsequentthermal dewatering in a series of evaporators together with blackliquor followed by incineration. Mill 2 has 63% PS and usesmechanical dewatering and incineration. Mill 3 has mechanicaldewatering and no energy recovery from sludge.
The total energy use and recovery by the current WWT andsludge handling Strategies 3 and 4 as regards SS is presented inFig. 4. With Strategy 3, SS is mechanically and thermally dewateredand incinerated. It should be noted that this is secondary sludgeonly and not the actual mix of sludge currently produced by themills. The mechanical dewatering is restricted to 20% TS, and ther-mal dewatering is required for operational purposes in the inciner-
-3
-2
-1
0
1
2
3
4
5
6
WWT MD TD IMW
h/tC
OD
red
Mill 1Mill 2Mill 3
Fig. 3. Results from actual sludge mix energy calculations for the current sludgemanagement of the three mills, expressed as energy per tonne of reduced COD.(WWT = wastewater treatment, MD = mechanical dewatering, TD = thermal dewa-tering, I = incineration).
ation. Mill 1 employs energy efficient thermal drying since it usesfour drying effects in series. Mill 3 requires more energy for thethermal drying than Mill 2 as it has a higher SS yield per COD re-duced. The SS yield per COD reduced is proportional to the energyrecovered by incineration.
Fig. 4 also represents the total energy use and recovery for SS bythe current WWT and sludge handling Strategy 4. Strategy 4 in-cludes mechanical dewatering and anaerobic digestion. The SSyield per COD reduced is proportional to the energy recovered byanaerobic digestion.
Fig. 5 is a presentation of the total energy use and recovery bythe current WWT and sludge handling Strategies 1–6 for the actualsludge mix of Mill 3. Currently, sludge handling follows Strategy 1:mechanical dewatering and no energy recovery.
Table 2 presents the energy use and recovery of sludge handlingStrategies 1–6 for the actual sludge mixes of the three mills. Theenergy results are presented per tonne of dry solids in order to en-able a comparison between Strategies 1–7 for each mill. The differ-ences between solid waste productions in Strategy 1 are explainedby the different TS of the sludges (20%, 30%, and 21%, respectively).The different amounts of solid fuel in Strategy 2 are explained bythe different TS and ash contents. Mill 1 uses more electricityand less heat for thermal dewatering since it uses four drying ef-fects in series (see Strategies 3 and 6). Incineration of wet digestatefrom Mill 3 is not favourable because of the high ash contents. Thereason behind the difference in biogas production is the differencein ash contents.
-50
-40
-30
-20
-10
0
10
20
30
WW
TM
D
WW
TM
DI W
WT
MD
TD I WW
TM
DAD W
WT
MD
AD I WW
TM
DAD TD I
GW
h/y
CurrentStrategy 2Strategy 3Strategy 4Strategy 5Strategy 6
Fig. 5. Results from energy simulations of the actual sludge mix of Mill 3.(WWT = wastewater treatment, MD = mechanical dewatering, TD = thermal dewa-tering, I = incineration and AD = anaerobic digestion).

Table 2Results from mixed-sludge energy simulations performed with the sludge handlingmodel for the three mills and Strategies 1–6 (S1–S6). Results are presented per tonneof dry untreated mixed sludge.
Mill 1 S1 S2 S3a S4 S5 S6
Electricity (MWh/t) �0.1 �0.1 �0.3 �0.2 �0.2 �0.3Heat (MWh/t) – – �1.0 �0.2 �0.2 �0.3Solid fuel (MWh/t) – 2.6 5.0 – 0.9 2.2Biogas production (MWh/t) – – – 1.7 1.7 1.7Solid waste (t/t) 5.0 0.16 0.16 2.7 0.16 0.16
Mill 2 S1 S2a S3 S4 S5 S6
Electricity (MWh/t) �0.1 �0.1 �0.1 �0.2 �0.2 �0.2Heat (MWh/t) – – �1.4 �0.1 �0.2 �1.4Solid fuel (MWh/t) – 3.6 4.9 – 1.0 2.2Biogas production (MWh/t) – – – 2.1 2.1 2.1Solid waste (t/t) 3.3 0.11 0.11 2.5 0.11 0.11
Mill 3 S1a S2 S3 S4 S5 S6
Electricity (MWh/t) �0.1 �0.1 �0.1 �0.2 �0.2 �0.2Heat (MWh/t) – – �2.4 �0.1 �0.1 �1.5Solid fuel (MWh/t) – 1.7 4.1 – 0.4 1.8Biogas production (MWh/t) – – – 1.5 1.5 1.5Solid waste (t/t) 4.9 0.25 0.25 2.9 0.25 0.25
a Current strategy.
A. Stoica et al. / Bioresource Technology 100 (2009) 3497–3505 3503
5. Discussion
From an energy point of view, the electricity used for WWTshould primarily be used for clean water production, not for sludgereduction. This holds true when sludge is treated as a bioenergy re-source. When aerobic biological WWT is used, aeration often con-sumes more than 50% of the electricity used by the entire WWTplant. Aeration is necessary to achieve sufficient COD reductionand the required sludge properties. It is questionable to use ex-tended aeration to achieve sludge reduction. Complementarychemical treatment is energy efficient for COD reduction. The highSS yield can promote energy recovery. If SS is used for energyrecovery, Mill 3, having the highest SS yield, has the greatest po-tential to recover energy as heat or biogas. Combined with a com-parably low energy use in the WWT process, Mill 3 can achieve apositive total energy result on wastewater and sludgemanagement.
5.1. Energy use and sludge production in secondary WWT
Energy use and amounts of sludge produced varied between thestudied mills even though they all achieved approximately thesame cleaning result, i.e., 26–32 tonnes of COD per day. All millsmet the legislated requirements for discharges. Therefore, theeffluent water quality can be considered to be equally and suffi-ciently clean. Mill 3 requires less than 50% of the electrical powerneeded for WWT as compared to Mills 1 and 2. The main reason forthis is less aeration. Using chemical treatment and a comparativelyshort SRT in the biological treatment, the mill’s need for aeration isminimised and the secondary sludge yield is higher. As comparedto Mill 3, and from the point of view that sludge is an energysource, Mills 1 and 2 use 5 and 10 times more electricity per tonneof produced sludge, respectively.
The amount of oxygen used by the three mills was not possibleto measure during this study. The differences in the electricity re-quired for aeration follows the expected pattern. The electricity re-quired for aeration, measured as kWh per tonne of COD reduced,increases with the SRT (see Table 1). There are other reasons, how-ever, for the differences shown regarding the power required foraeration. Mills 1 and 3 use diffuser aerators with coarse and finebubbles, respectively. Mill 2 uses surface aerators.
A long SRT not only reduces the mass of sludge, it also affectssludge properties. A prolonged SRT improves the flocc settleability
of the sludge, which is critical for efficient biological treatment.Therefore, the SRT cannot be reduced below a certain level uniqueto every treatment plant. Chemical treatment can compensate forpoor settleability to some extent.
5.2. Improved energy recovery from SS with increased secondarysludge yield
The energy simulations are carried out using data from SS only,the resulting energy balances from Strategies 3 and 4 is shown inFig. 4. Mill 3 has a higher SS yield factor compared with the othermills, and therefore it has more biosolids for energy recovery. Thisentails energy results where Mill 3 outperforms the other millswith regard to Strategies 3 and 4.
Mill 2 achieves a better energy result according to Strategy 4compared with Mill 1 as it utilises chemical treatment in additionto biological treatment. The end results in Fig. 4 depend on the SSyield as shown in Table 1. It shows that the production of more SSper COD reduction will have a positive effect on the energy balancewhen thermal dewatering is not employed. When dealing with SS,a high SS yield and low ash contents will lead to higher energyrecovery from incineration of wet sludge. The use of several dryingeffects in series makes the thermal dewatering process of Mill 1more efficient than the thermal dewatering process of the othermills. The energy balance of Mill 1 in Strategy 3 shows a higher en-ergy result as compared to Mill 2 although the energy recovery pertonne of COD reduced is smaller.
Biogas production with anaerobic digestion of SS depends onthe SS yield factor (see Table 1) as shown in Fig. 4. Anaerobic diges-tion has several advantages over incineration of SS. SS is difficult todewater mechanically and wet SS causes operational problemsincluding feed and decreased bed temperatures. An additional ben-efit from anaerobic digestion is that the filtrate from dewateringdigestate is rich in nutrients. These are needed in the forest indus-try WWT, and the total amount of nutrients added to the aerobicWWT process can thus be reduced.
5.3. Current strategies
The extraordinarily high energy balance result of Mill 2 is due toa 63% content of easily dewatered PS. As previously stated, PS issuited for incineration. In this case, it completely overshadowsthe impact of SS on incineration.
Mill 3 has no energy recovery that can compensate for the en-ergy use in the WWT. It has, however, the lowest electricity usein the WWT per COD reduced. The saved energy is expensive andversatile as compared to solid fuel.
Mill 1 is currently using the second most favourable sludge han-dling strategy available from an energy point of view (see Table 2).This strategy requires a continued mixing of sludge with black li-quor for thermal dewatering and incineration.
5.4. Potential for improvements on mill cases
From an energy point of view, the current sludge handling strat-egy of Mill 3 is the least favourable of the seven studied strategies.Energy recovery of any kind would improve the total energy result(see Fig. 5). The current strategy also generates the greatestamount of solid waste of all strategies (see Table 2).
Strategy 7, gasification, is not presented in Section 4. The energyuse and recovery have already been presented in Section 3.7 in thesame form as for Strategies 1–6 in Table 2. It can be seen that Strat-egy 7 requires almost as much energy from ignition oil as the elec-tricity it generates. The total amount of energy recovered from thesludge using gasification is less than the energy recovered usingthe current strategies of Mills 1 and 2. Mill 3, however, would

3504 A. Stoica et al. / Bioresource Technology 100 (2009) 3497–3505
achieve the best total energy balance using Strategy 7. Strategy 7 ismodelled after one pilot scale study (Gross et al., 2008) and re-quires further work.
Mill 3 has the greatest potential for improvement, and the re-sults show a positive energy result of 7–19 GWh per year regard-less of which sludge handling strategy – other than the currentone – is implemented (see Figs. 1 and 4). Mills 1 and 2 have no sig-nificant potential to increase their energy recovery and solid wastereduction through a change of sludge handling strategy. Other rea-sons are required to change the strategies of these mills, for exam-ple, incrustation problems in evaporation units for Mill 1 ormaterial recovery of PS in Mill 2. The current sludge handling strat-egies of Mills 1 and 2 are satisfactory. However, changing the WWTtowards less energy use and greater SS yield implies an improve-ment of the total energy balance.
Mill 3 is able to recover 14–26 GWh per year by using any strat-egy including incineration and/or anaerobic digestion.
Single-stage thermal dewatering offers no advantage from anenergy point of view. Because of the low content of dry solids thatcan be obtained with mechanical dewatering of SS, thermal dewa-tering may be required to avoid operational problems in the boiler.
5.5. The sludge handling model
The sludge handling model is a rough model intended for gen-eral estimations. All modules first use the data available on-site.The anaerobic digestion, the thermal dewatering and the gasifica-tion modules are all based on data from trials made with similarsubstrates on a pilot scale. The model can be used as a tool for com-paring several sludge handling strategies. It can be expanded to in-clude more details, for example, the incineration module is easy toadjust to an existing boiler. However, further investigations are re-quired before a new strategy can be implemented at a mill. Themain disadvantage of the model when it comes to aiding in thedecision-making process is its lack of tools for economic analysis.
The amount of electricity used in the mechanical dewateringdepends highly on the type and performance of the process equip-ment, the sludge type, the initial and final content of dry solids. Thetotal amount of energy required for mechanical dewatering ismuch smaller than is the case with the other units, which makesthe error involved negligible.
It should be noted that the sludge handling model is not basedon a specific boiler. It presents the energy recovery as the energycontent of a solid fuel (sludge or digestate). However, when pureSS is incinerated, it is advisable to use thermal dewatering to in-crease the content of dry solids and avoid operational problems.
The final content of dry solids in the thermal dewatering unitwas chosen to be 68% in all three mills so they could be easily com-pared. This complied with the final content of dry solids of the cur-rent strategy of Mill 1. The sludge will reach a net calorific valuethat is close to the net calorific value of dewatered black liquor,and the risk of operational problems associated with incinerationof wet sludge is reduced.
Strategy 7, including gasification, was chosen according to Grosset al. (2008) in an effort to present a strategy that is readily availablefor industrial application. Gasification is a promising energy recov-ery process and should also be taken into consideration. Up to now,gasification has not been modelled in the same manner as is thecase with Strategies 1–6. When the results presented in Table 2are compared with the energy balance of gasification, it is evidentthat gasification is a process of importance (Gross et al., 2008).
5.6. General strategy for sustainable wastewater management
If PS can be used as raw material, natural resources such as cel-lulosic fibres can be spared.
Sludge handling requires less energy than WWT does (see Figs.4 and 5). When the objective is to minimise the total energy useof wastewater management, it is efficient to target aeration inWWT provided that a sufficiently clean effluent is produced.Anaerobic WWT changes the outcome and needs to be addressedseparately.
WWT sludge minimisation costs energy, whilst efficient sludgehandling generates usable energy products. From a sustainabledevelopment point of view solid waste minimisation should beachieved using sludge handling strategies that include energyrecovery. There is no conclusive answer to the question of whetherincineration, gasification or anaerobic digestion is preferable. Thedecision must be based on the final use of the energy productand potential operational difficulties.
Additional nutrients are often needed in biological treatment offorest industry wastewater. Phosphorous is a limited natural re-source and it is therefore important to economise its use. If thesludge is incinerated, phosphorus remains in the ashes and thenutrients are only usable in forest soil. A new dose of nutrientsmust then be added to the WWT process. Chemical treatment re-quires no nutrients. On the other hand, it seldom reaches sufficienteffluent quality on its own, and it consumes resources such as me-tal salts, etc. Low sludge production can save nutrients that areneeded for biosynthesis. If sludge is anaerobically digested, how-ever, the major part of the nutrients can be recirculated. A pro-longed cycle for nutrients within the wastewater managementprocess reduces the demand for industrially produced nutrientsand is preferable from a sustainable development point of view.
The least amount of solid waste is produced by incineration.Anaerobic digestion reduces the amount of solid waste to a greaterextent than sludge minimisation does through prolonged aerationin the WWT process.
Many Swedish mills are struggling to replace the fossil fuelsused on-site. Both sludge and biogas can replace oil for steam pro-duction. Only biogas can replace oil used to heat a lime kiln. Biogascan also be upgraded for use in vehicles to replace petrol. For thesereasons, biogas is in general more valuable than sludge as a fuel.Electricity as an energy carrier is more valuable than biogas andsludge.
The economic aspects of sustainability are reduced to valuingrunning costs such as energy use and waste disposal as well as rev-enue from energy recovery. Investment costs are not discussedhere because of the large variation between the cases. Strategiesthat promote low energy use, small amounts of solid waste andan efficient energy recovery agree with economically sustainablestrategies. The socio-cultural aspects of sustainable developmentare not much affected as long as the treatment technologies con-tribute to a clean recipient and only have minor effects on workingconditions for employees at the mills.
6. Conclusions
� The greatest potential for energy saving is aeration in the WWT.� Electricity used for aeration in the WWT should aim at a suffi-
ciently clean effluent and not at sludge reduction.� A high yield of secondary sludge increases the potential for
energy recovery.� Primary sludge is preferably treated separately from secondary
sludge.� Primary sludge should be used for material recovery rather than
energy recovery.� Secondary sludge is technically better suited for anaerobic
digestion than incineration.� The sludge handling model is a useful tool for comparing differ-
ent sludge handling strategies.
A. Stoica et al. / Bioresource Technology 100 (2009) 3497–3505 3505
Acknowledgements
The authors would like to thank Billerud Gruvön AB, Stora EnsoSkoghall AB and Rottneros AB for process data. This paper waspartly financed by SWX-Energy (European Commission Develop-ment Fund).
References
Almemark, M., Finnveden, G., Frostell, B., 1991. Treatment technologies fororganochlorine-containing sludges and concentrates of pulp and paperwastewaters. Water Science and Technology 24, 319–329.
Asplind, B., 2002. New external purification at Sodra Morrum. Nordisk Papper ochMassa 4, 47–50.
Balkema, A.J., Preisiga, H.A., Otterpohlb, R., Lambert, F.J.D., 2002. Indicators for thesustainability assessment of wastewater treatment systems. Urban Water 4,153–161.
Dalemo, M., Sonesson, U., Björklund, A., Mingarini, K., Frostell, B., Jönsson, H.,Nybrant, T., Sundqvist, J.O., Thyselius, L., 1997. ORWARE – a simulation modelfor organic waste handling systems. Part 1: model description. Resources,Conservation and Recycling 21, 17–37.
Eklund, A., Eriksson, L., 2002. Processlösning för vakuumtorkning avskogsindustriellt bioslam, Värmeforsk.
Engström, T., Gytel, U., 2000. Different treatment methods for effluent from a pulpmill and their influence on fish health and propagation. In: Hoffmann, E.,Ødegaard, H., Hahn, H.H. (Eds.), Chemical Water and Wastewater Treatment.Springer-Verlag, pp. 317–323.
Gross, B., Eder, C., Grziwa, P., Horst, J., Kimmerle, K., 2008. Energy recovery fromsewage sludge by means of fluidised bed gasification. Waste Management 28,1819–1826.
Harila, P., Kivilinna, V., 1999. Biosludge incineration in a recovery boiler. WaterScience and Technology 40, 195–200.
Kjellén, B.J., Andersson, A.-C., 2002. Energihandbok för avloppsreningsverk. VA-forsk.
Krogerus, M., Tennander, E., Sivard, Å., 1999. Sammanställning av erfarenheter frånhantering av slam inom skogsindustrin, Värmeforsk.
Lindh, H., Mårtensson, G., 2005. New multibio purification reduces environmentaleffects. Nordisk Papper och Massa 6, 55–56.
Mahmood, T., Elliott, A., 2006. A review of secondary sludge reduction technologiesfor the pulp and paper industry. Water Research 40, 2093–2112.
Puhakka, J.A., Alavakeri, M., Shieh, W.K., 1992. Anaerobic treatment of kraft pulp-mill waste activated-sludge: gas production and solids reduction. BioresourceTechnology 39, 61–68.
Rodden, G., 2005. SCA Östrand builds a ‘‘natural eco-system”. Pulp and PaperInternational 47, 22–27.
Sandberg, M., Holby, O., 2008. Black liquor and alkaline shocks in a multiple stagesbiological treatment plant. Journal of Environmental Engineering and Science 7,335–344.
SS-ISO-1928, 1996. Fasta bränslen – Bestämning av kalorimetriskt värmevärdemed bombkalorimeter och beräkning av effektivt värmevärde SS ISO1928.
Stoica, A., 2007. Handling strategies for mixed sludge from pulp and paper industry.In: Proceedings of the 12th European Biosolids and Organic ResourcesConference, Workshop and Exhibision, Aqua Enviro, Manchester, UK.
Tchobanoglous, G., Burton, F.L., Stensel, H.D., 2003. In: Eddy, M. (Ed.), WastewaterEngineering Treatment and Reuse, fourth ed.
Wei, Y., VanHouten, R.T., Borger, A.R., Eikelboom, D.H., Fan, Y., 2003. Minimizationof excess sludge production for biological wastewater treatment. WaterResearch 37, 4453–4467.
Werker, A.G., Malmqvist, A., Welander, T., 2004. A comparison of conventionalactivated sludge and low sludge production strategies for advanced treatmentof kraft pulp mill effluent. Water Science and Technology 50, 103–110.


![Pulp Mill Sludge Ethanol Project[1]](https://img.dokumen.tips/doc/110x75/55b065261a28aba0288b4848/pulp-mill-sludge-ethanol-project1.jpg)