Embed Size (px)
Citation preview
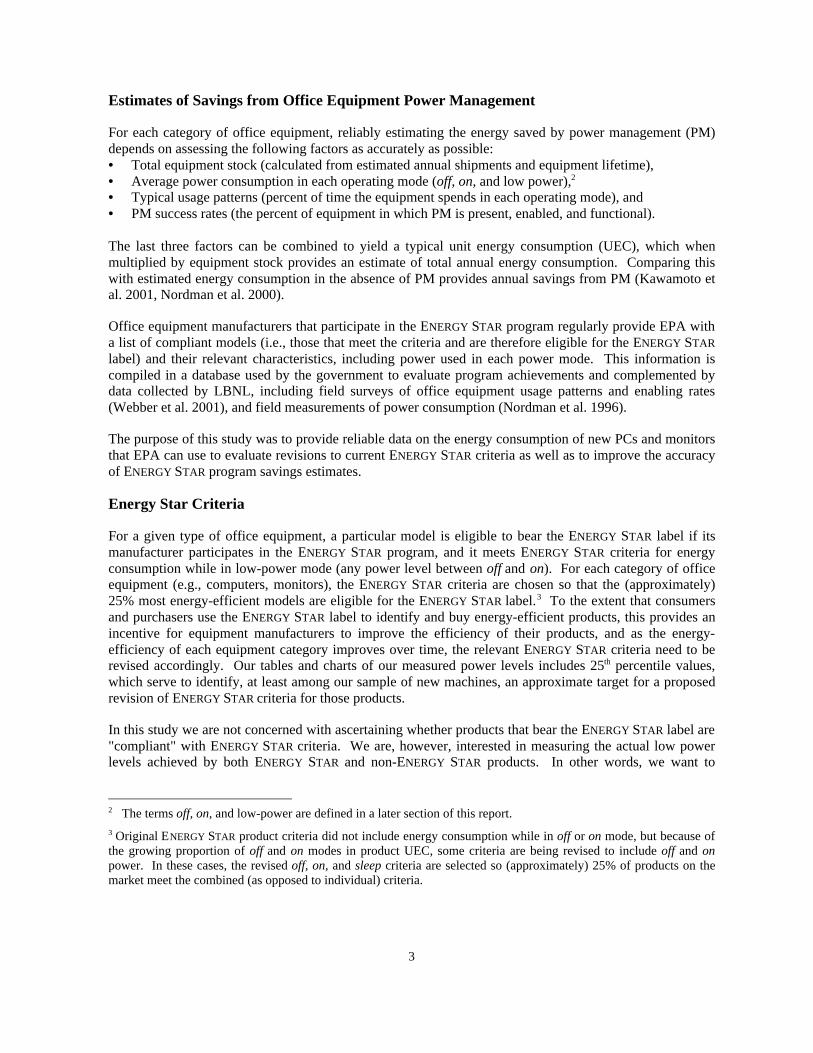
LBNL-48581
Energy Use and Power Levels inNew Monitors and Personal Computers
Judy A. Roberson, Gregory K. Homan,Akshay Mahajan, Bruce Nordman,
Carrie A. Webber, Richard E. Brown,Marla McWhinney, and Jonathan G. Koomey
Energy Analysis DepartmentEnvironmental Energy Technologies Division
Ernest Orlando Lawrence Berkeley National LaboratoryUniversity of California
Berkeley CA 94720, USA
July 2002
To download this paper and related data go to:http://enduse.lbl.gov/Projects/OffEqpt.html
The work described in this paper was supported by the Office of Atmospheric Programs, ClimateProtection Partnerships Division of the U.S. Environmental Protection Agency and prepared for the U.S.Department of Energy under Contract No. DE-AC03-76SF00098.
ii
Table of ContentsTABLE OF CONTENTS ............................................................................................................................................. ii
LIST OF TABLES, LIST OF FIGURES ................................................................................................................... iii
ABBREVIATIONS AND ACRONYMS, ACKNOWLEDGEMENTS ..................................................................... iv
ABSTRACT .....................................................................................................................................................................1
INTRODUCTION ...........................................................................................................................................................2
BACKGROUND..............................................................................................................................................................2
ESTIMATES OF SAVINGS FROM OFFICE EQUIPMENT POWER MANAGEMENT..................................................................3ENERGY STAR CRITERIA ................................................................................................................................................3POWER MANAGEMENT: TECHNOLOGY ..........................................................................................................................5POWER MANAGEMENT: TERMINOLOGY ........................................................................................................................5
DESCRIPTION OF SAMPLE .......................................................................................................................................7
MONITORS .....................................................................................................................................................................7PERSONAL COMPUTERS .................................................................................................................................................8
METHODOLOGY ..........................................................................................................................................................9
METERING EQUIPMENT..................................................................................................................................................9FIELD MEASUREMENTS..................................................................................................................................................9
RESULTS AND DISCUSSION....................................................................................................................................10
MONITORS: LOW-POWER LEVELS................................................................................................................................10MONITORS: RECOVERY TIME FROM LOW-POWER LEVELS ..........................................................................................11MONITORS: EFFECT OF OPERATING SYSTEM ON LOW-POWER LEVELS .......................................................................13MONITORS: OFF POWER ..............................................................................................................................................14MONITORS: ON POWER ................................................................................................................................................15MONITORS: REVISED ON POWER ESTIMATES ..............................................................................................................18DESKTOP COMPUTERS .................................................................................................................................................20DESKTOP COMPUTERS: OFF & ON POWER ..................................................................................................................21DESKTOP COMPUTERS: LOW-POWER LEVELS..............................................................................................................22LAPTOP COMPUTERS....................................................................................................................................................22INTEGRATED COMPUTER SYSTEMS ..............................................................................................................................23
CONCLUSIONS AND FUTURE WORK...................................................................................................................24
MONITORS ...................................................................................................................................................................24PERSONAL COMPUTERS ...............................................................................................................................................25
REFERENCES ..............................................................................................................................................................26
APPENDIX A: METERING PROTOCOL ................................................................................................................28
GENERAL .....................................................................................................................................................................28MONITORS ...................................................................................................................................................................28PERSONAL COMPUTERS ...............................................................................................................................................29
APPENDIX B: METERING RESULTS .....................................................................................................................30
APPENDIX C: STATISTICAL ANALYSIS OF MONITOR POWER LEVELS, BY TYPE & SIZE ................32

iii
List of TablesTable 1. Key Product Criteria for ENERGY STAR Labeled Computers.............................................................4
Table 2. Definition of Power Management Terms As Used in this Report .....................................................6
Table 3. Distribution of Monitors in Sample, by Type and Size .....................................................................8
Table 4. Statistical Analysis of All Monitors, All Power Levels...................................................................11
Table 5. Comparison of Off Power for Monitors that Consume Power when Off .........................................14
Table 6a. Average Monitor On Power per Unit Display Area (W/in2, approximate).....................................17
Table 6b. Average Monitor On Power per Unit Display Area (W/cm2, approximate)....................................17
Table 7. Median Monitor Power Consumption by Monitor Type and Size...................................................17
Table 8. Variation in Monitor On Power (W), for Selected Monitors ...........................................................19
Table 9. Statistical Analysis of Desktop Computer Power Levels ................................................................20
Table 10. Measured Desktop Computer On Power by CPU Brand, Model, and Speed..................................21
Table 11. Statistical Analysis of Laptop Computer Power Levels ..................................................................23
Table B-1. Monitor Metering Results (Sorted by Monitor Type & Size).........................................................30
Table B-2. Desktop Computer Metering Results (Sorted by On Power)..........................................................31
Table B-3. Laptop Computer Metering Results (Sorted by On Power)............................................................31
Table B-4. Integrated Computer System Metering Results (Sorted by On Power) ..........................................31
Table C1. Monitor Off Power (W), by Monitor Type & Size..........................................................................32
Table C2. Monitor On Power (with PC Off), by Monitor Type & Size...........................................................32
Table C3. Monitor On Power (with PC On), by Monitor Type & Size...........................................................32
Table C4. Monitor Deep Sleep Power, by Monitor Type & Size ....................................................................32
List of Figures
Figure 1. Monitor Sample by Type and Size .....................................................................................................8
Figure 2. Statistical Analysis of All Monitors, Most Power Levels ................................................................11
Figure 3. Monitor Recovery Time by Monitor Type and Deep Sleep Power Savings (W).............................12
Figure 4. Average Monitor On Power Consumption (W) per Approximate Display Area .............................16
Figure 5. Statistical Monitor On Power Consumption by Type and Size ........................................................16
Figure 6. Statistical Analysis of Desktop Computer Power Levels .................................................................20
Figure 7. Measured Desktop Computer On Power by CPU Brand, Model, and Speed...................................21
Figure 8. Statistical Analysis of Laptop Computer Power Levels ...................................................................23
iv
Abbreviations and AcronymsAs Used in This Report
ACPI Advanced Configuration and Power Interface
APM Advanced Power Management
CPU central processing unit
CRT cathode ray tube
ICS integrated computer system
LBNL Lawrence Berkeley National Laboratory
LCD liquid crystal display
OS operating system
PC personal computer (a generic term that includes laptop computers, desktop computers andintegrated computer systems; it includes both Apple and Intel-architecture machines)
PLM power line meter
PM power management
UC University of California
AcknowledgementsWe Thank the Following
Reviewers: Chris Calwell (Ecos Consulting);Joe Eto, Jeff Harris, Karen Herter, Alan Meier (LBNL)
Individuals: Kevin Gauna, Steve Greenberg, and Erik Page (LBNL)
Institutions: UC Berkeley Building Science Lab, Chancellors Office, and The Scholars Workstation;City of Berkeley Dept of Information TechnologySan Jose State University Spartan Book Store
Manufacturers: Gateway, Phillips, ViewSonic
Retailers: Best Buy, Circuit City, Gateway Country Stores, Office Depot
1
Energy Use and Power Management inNew Personal Computers and Monitors
Judy A. Roberson, Gregory K. Homan, Akshay Mahajan, Carrie A. Webber, Bruce Nordman, Richard E. Brown,
Marla McWhinney, and Jonathan G. KoomeyLawrence Berkeley National Laboratory
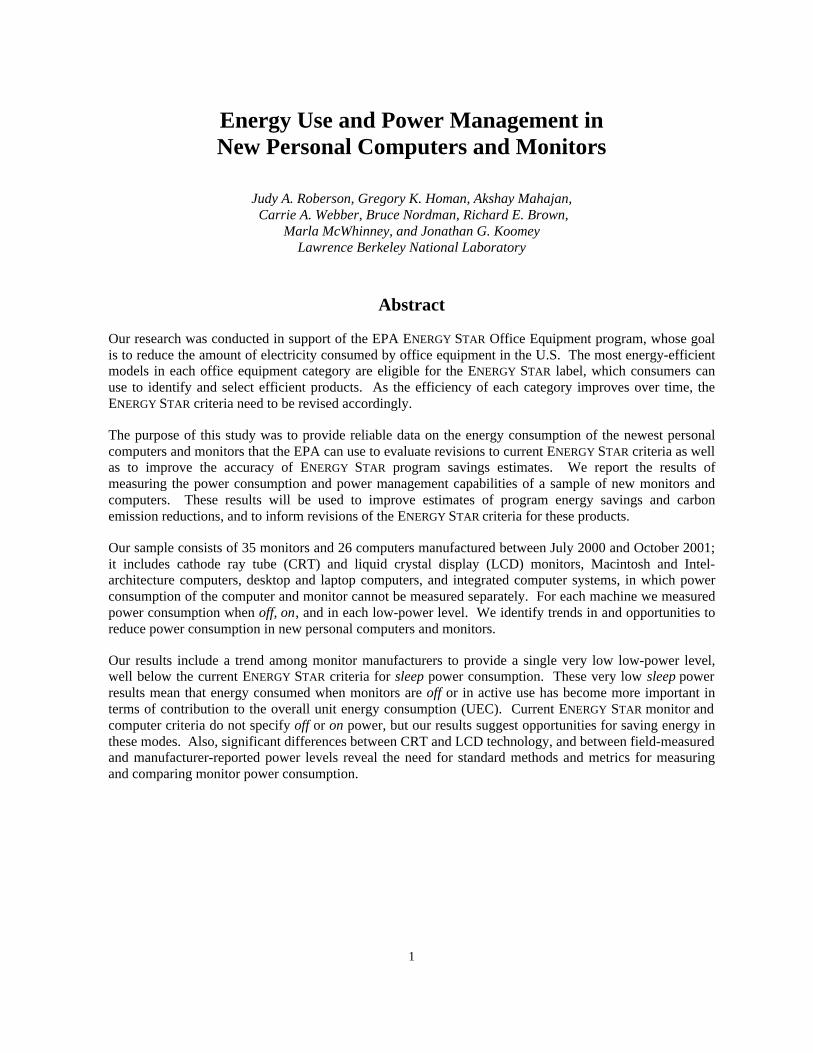
Abstract
Our research was conducted in support of the EPA ENERGY STAR Office Equipment program, whose goalis to reduce the amount of electricity consumed by office equipment in the U.S. The most energy-efficientmodels in each office equipment category are eligible for the ENERGY STAR label, which consumers canuse to identify and select efficient products. As the efficiency of each category improves over time, theENERGY STAR criteria need to be revised accordingly.
The purpose of this study was to provide reliable data on the energy consumption of the newest personalcomputers and monitors that the EPA can use to evaluate revisions to current ENERGY STAR criteria as wellas to improve the accuracy of ENERGY STAR program savings estimates. We report the results ofmeasuring the power consumption and power management capabilities of a sample of new monitors andcomputers. These results will be used to improve estimates of program energy savings and carbonemission reductions, and to inform revisions of the ENERGY STAR criteria for these products.
Our sample consists of 35 monitors and 26 computers manufactured between July 2000 and October 2001;it includes cathode ray tube (CRT) and liquid crystal display (LCD) monitors, Macintosh and Intel-architecture computers, desktop and laptop computers, and integrated computer systems, in which powerconsumption of the computer and monitor cannot be measured separately. For each machine we measuredpower consumption when off, on , and in each low-power level. We identify trends in and opportunities toreduce power consumption in new personal computers and monitors.
Our results include a trend among monitor manufacturers to provide a single very low low-power level,well below the current ENERGY STAR criteria for sleep power consumption. These very low sleep powerresults mean that energy consumed when monitors are off or in active use has become more important interms of contribution to the overall unit energy consumption (UEC). Current ENERGY STAR monitor andcomputer criteria do not specify off or on power, but our results suggest opportunities for saving energy inthese modes. Also, significant differences between CRT and LCD technology, and between field-measuredand manufacturer-reported power levels reveal the need for standard methods and metrics for measuringand comparing monitor power consumption.
2
Introduction
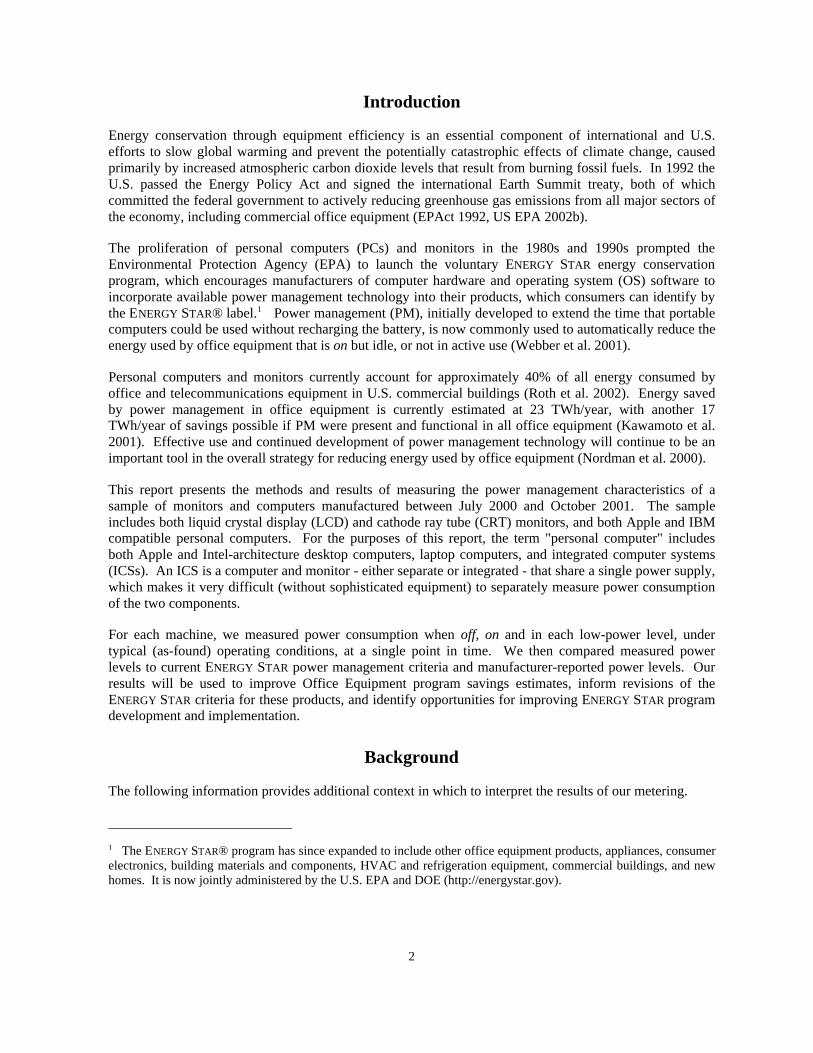
Energy conservation through equipment efficiency is an essential component of international and U.S.efforts to slow global warming and prevent the potentially catastrophic effects of climate change, causedprimarily by increased atmospheric carbon dioxide levels that result from burning fossil fuels. In 1992 theU.S. passed the Energy Policy Act and signed the international Earth Summit treaty, both of whichcommitted the federal government to actively reducing greenhouse gas emissions from all major sectors ofthe economy, including commercial office equipment (EPAct 1992, US EPA 2002b).
The proliferation of personal computers (PCs) and monitors in the 1980s and 1990s prompted theEnvironmental Protection Agency (EPA) to launch the voluntary ENERGY STAR energy conservationprogram, which encourages manufacturers of computer hardware and operating system (OS) software toincorporate available power management technology into their products, which consumers can identify bythe ENERGY STAR® label.1 Power management (PM), initially developed to extend the time that portablecomputers could be used without recharging the battery, is now commonly used to automatically reduce theenergy used by office equipment that is on but idle, or not in active use (Webber et al. 2001).
Personal computers and monitors currently account for approximately 40% of all energy consumed byoffice and telecommunications equipment in U.S. commercial buildings (Roth et al. 2002). Energy savedby power management in office equipment is currently estimated at 23 TWh/year, with another 17TWh/year of savings possible if PM were present and functional in all office equipment (Kawamoto et al.2001). Effective use and continued development of power management technology will continue to be animportant tool in the overall strategy for reducing energy used by office equipment (Nordman et al. 2000).
This report presents the methods and results of measuring the power management characteristics of asample of monitors and computers manufactured between July 2000 and October 2001. The sampleincludes both liquid crystal display (LCD) and cathode ray tube (CRT) monitors, and both Apple and IBMcompatible personal computers. For the purposes of this report, the term "personal computer" includesboth Apple and Intel-architecture desktop computers, laptop computers, and integrated computer systems(ICSs). An ICS is a computer and monitor - either separate or integrated - that share a single power supply,which makes it very difficult (without sophisticated equipment) to separately measure power consumptionof the two components.
For each machine, we measured power consumption when off, on and in each low-power level, undertypical (as-found) operating conditions, at a single point in time. We then compared measured powerlevels to current ENERGY STAR power management criteria and manufacturer-reported power levels. Ourresults will be used to improve Office Equipment program savings estimates, inform revisions of theENERGY STAR criteria for these products, and identify opportunities for improving ENERGY STAR programdevelopment and implementation.
Background
The following information provides additional context in which to interpret the results of our metering.
1 The ENERGY STAR® program has since expanded to include other office equipment products, appliances, consumerelectronics, building materials and components, HVAC and refrigeration equipment, commercial buildings, and newhomes. It is now jointly administered by the U.S. EPA and DOE (http://energystar.gov).
3
Estimates of Savings from Office Equipment Power Management
For each category of office equipment, reliably estimating the energy saved by power management (PM)depends on assessing the following factors as accurately as possible:• Total equipment stock (calculated from estimated annual shipments and equipment lifetime),• Average power consumption in each operating mode (off, on, and low power),2
• Typical usage patterns (percent of time the equipment spends in each operating mode), and• PM success rates (the percent of equipment in which PM is present, enabled, and functional).
The last three factors can be combined to yield a typical unit energy consumption (UEC), which whenmultiplied by equipment stock provides an estimate of total annual energy consumption. Comparing thiswith estimated energy consumption in the absence of PM provides annual savings from PM (Kawamoto etal. 2001, Nordman et al. 2000).
Office equipment manufacturers that participate in the ENERGY STAR program regularly provide EPA witha list of compliant models (i.e., those that meet the criteria and are therefore eligible for the ENERGY STAR
label) and their relevant characteristics, including power used in each power mode. This information iscompiled in a database used by the government to evaluate program achievements and complemented bydata collected by LBNL, including field surveys of office equipment usage patterns and enabling rates(Webber et al. 2001), and field measurements of power consumption (Nordman et al. 1996).
The purpose of this study was to provide reliable data on the energy consumption of new PCs and monitorsthat EPA can use to evaluate revisions to current ENERGY STAR criteria as well as to improve the accuracyof ENERGY STAR program savings estimates.
Energy Star Criteria
For a given type of office equipment, a particular model is eligible to bear the ENERGY STAR label if itsmanufacturer participates in the ENERGY STAR program, and it meets ENERGY STAR criteria for energyconsumption while in low-power mode (any power level between off and on). For each category of officeequipment (e.g., computers, monitors), the ENERGY STAR criteria are chosen so that the (approximately)25% most energy-efficient models are eligible for the ENERGY STAR label.3 To the extent that consumersand purchasers use the ENERGY STAR label to identify and buy energy-efficient products, this provides anincentive for equipment manufacturers to improve the efficiency of their products, and as the energy-efficiency of each equipment category improves over time, the relevant ENERGY STAR criteria need to berevised accordingly. Our tables and charts of our measured power levels includes 25th percentile values,which serve to identify, at least among our sample of new machines, an approximate target for a proposedrevision of ENERGY STAR criteria for those products.
In this study we are not concerned with ascertaining whether products that bear the ENERGY STAR label are"compliant" with ENERGY STAR criteria. We are, however, interested in measuring the actual low powerlevels achieved by both ENERGY STAR and non-ENERGY STAR products. In other words, we want to
2 The terms off, on, and low-power are defined in a later section of this report.3 Original ENERGY STAR product criteria did not include energy consumption while in off or on mode, but because ofthe growing proportion of off and on modes in product UEC, some criteria are being revised to include off and onpower. In these cases, the revised off, on, and sleep criteria are selected so (approximately) 25% of products on themarket meet the combined (as opposed to individual) criteria.

4
evaluate the impacts of the ENERGY STAR program on the industry as a whole, not to evaluate the degree ofindividual partner compliance with the program.
Monitors
The ENERGY STAR monitor Memorandum of Understanding (MOU) (US EPA 1999b) defines a monitoras:
"a cathode-ray tube (CRT), flat panel display (e.g., a liquid crystal display) or other display device and itsassociated electronics. A monitor may be sold separately or integrated into the computer chassis. Thisdefinition is intended primarily to cover standard monitors designed for use with personal computers. Thefollowing may also be considered a monitor: mainframe terminals, and physically separate display units".
Current ENERGY STAR monitor criteria (Version 3.0, effective July 1, 1999) specify two low-power modes:≤ 15W in sleep, and ≤ 8W in deep sleep, regardless of monitor size or type (US EPA 2002a). The ENERGY
STAR terms sleep and deep sleep do not necessarily correspond to the terms used by monitor or OSsoftware manufacturers to describe low-power levels. In effect, deep sleep is a monitor’s lowest low-powerlevel (above off), while sleep refers to a second, higher power level, if any.
Computers
The ENERGY STAR computer MOU (US EPA 1999a) defines a computer as:"a desktop, tower or mini-tower, or portable unit…To qualify the unit must be capable of being poweredfrom a wall outlet, but this does not preclude units that are capable of being powered from a wall outlet andalso from a battery…"
The same computer MOU defines integrated computer systems (ICS) as:"(s)ystems in which the computer and visual display monitor are combined into a single unit. Such systemsmust meet all of the following criteria: it is not possible to measure the power consumption of the twocomponents separately; and the system is connected to the wall outlet through a single power cable".
Current ENERGY STAR computer criteria (Version 3.0, Tier 2, effective July 1, 2000) specify a single low-power mode – sleep – according to the maximum continuous output rating of the computer’s power supply,as seen in Table 1. Guideline A applies to most computers (including all desktop computers in oursample), which are not on a network or whose network connectivity does not interfere with their ability tosleep. Guideline B applies to computers whose network connectivity in sleep requires involvement of theprocessor and/or memory (US EPA 1999a)(US EPA 2002a).
Table 1. Key Product Criteria for Energy Star Labeled ComputersPower Consumption in Sleep Mode
Guideline A:Power Supply Output Rating (W)
≤ 200201-300301-350351-400
> 400OR
≤ 15 W≤ 20 W≤ 25 W≤ 30 W≤ 10% of power supply's maximum continuous output rating (W)
Guideline B: ≤ 15% of power supply's maximum continuous output rating (W)
4 Whether Guideline A or B applies to a given computer model is determined by the manufacturer of that computer.
5
Current criteria for ENERGY STAR integrated computer systems (ICSs) is that they use ≤ 35W in sleep (USEPA 2002a).
Currently, the EPA considers laptop (a.k.a. mobile, notebook, or portable) computers to be covered by itscomputer criteria. However, the technology and power characteristics of laptop computer are distinctenough from desktop computers that in this report we will treat desktop computers, laptop computers, andintegrated computer systems are separate equipment categories, and refer to them collectively as PCs(personal computers).
Power Management: Technology
Power management introduces one or more power levels that are intermediate between on and off. In eachsuccessive low-power level, more internal hardware devices are slowed down or turned off, and more timeis required for the equipment to recover, or wake up. Terms used to describe low-power levels varyextensively between hardware and software manufacturers and versions. Efforts are underway tostandardize PM terminology (Nordman et al. 2002).
In general, power management in monitors is simpler, more reliable, and more important (in terms ofpotential energy savings) than in PCs. Though most new monitors are capable of PM, they require that asignal be sent from the PC through the video card before PM can be initiated (Nordman et al. 1997).
Power management in personal computers (PCs) involves effective communication between the BIOS(Basic Input-Output System), hardware (the processor and peripheral devices), and software, primarily theoperating system. According to Nordman et al (1997), four conditions must be satisfied in order for PM tobe accomplished:
“The first is to monitor activity levels of the processor, input devices (such as the keyboard and mouse),and communication peripherals (network or modem). The second component is to utilize timers to decidewhen to initiate the shift to a lower power mode. Third, changes in power management status need to becommunicated to the correct device and actually occur. Finally, power management needs to recognizewhen activity resumes and return to a higher power (or full-power) mode.”
Early versions of PM, including APM (Advanced Power Management, which was introduced in 1993),were controlled primarily by the BIOS, with minimal involvement of the operating system. Enabling PMwas often difficult because (1) PM settings vary widely between BIOS manufacturer and version, (2) theBIOS is usually only accessible during boot-up, and (3) numerous conditions had to be met in order for PMto function, while a failure of any single condition would prevent PM from occurring.
When Intel introduced ACPI (Advanced Configuration and Power Interface) in 1998, primary control ofPM features shifted from the BIOS to the operating system (OS). This change meant that PM settingscould be changed during normal computer operation, not just during boot-up. Also, PM interfaces in theOS were simpler than those in the BIOS, although there was still significant variation between OSs. ACPIeffectively standardized PM technology among Intel-architecture PCs; Apple PCs employ PM technologythat is distinct from but similar to ACPI (Nordman et al. 1996, Nordman et al. 1997).
Power Management: Terminology
Power management is complicated by the confusion of terminology used to describe low-power levels.Manufacturers of hardware, BIOS, and operating systems all provide some PM functionality and use theirown terminology in the user interface. Because of the complex and evolving nature of system interaction(e.g., BIOS and OS, computer and monitor), and endless possible equipment combinations, the PM

6
functionality that actually results in PC-monitor systems is both unpredictable and inconsistent, and there isno consensus on the definitions or use of power management terms.
Consider for example, the seemingly simple terms on and off. Power used by a PC when on depends on thelevel of processor activity, so it is often useful to distinguish "on-active" (when the computer is actuallycomputing) from "on-idle" (when computing functions are fully available but not in use, so the processorcan be stopped). Similarly, off in PCs can be either a "hard off," in which the computer consumes no powerbecause the power button is on the high voltage side of the power supply, or "soft off," in which thecomputer consumes some power because the power button is on the low voltage side of the power supply.Associated with "soft off," "hibernate" is not a separate power mode but rather a process in which thesystem state is saved to disk before turning off, allowing the computer to be turned on without restarting theoperating system or applications.
The terms just defined here for PCs can serve to describe their on and off power levels, but still other termsare needed to describe PC low-power levels (between on and off). Further complexity is added because thenumber of on, off, and low-power levels varies with each type of office equipment.
Given the lack of any standardized definitions or use of PM terminology, it is all the more important thatPM terms be carefully defined and consistently used, at least within each research project or report. In thisreport, terminology used in a BIOS or OS interface is placed in quotes (e.g., "standby") but we do notattempt to directly correlate the low-power levels that we measured to any of these PM terms. Rather, weare primarily concerned with measuring the power consumed in all available low-power levels, andcomparing the power used at each level to the power used when the equipment is off and on. In addition, inorder to inform EPA's revision of relevant ENERGY STAR criteria, we must also establish somecorrespondence between measured low-power levels and the criteria for monitors and PCs.
For purposes of this report, we use the italicized terms off, on, sleep, and deep sleep to refer to measuredpower levels. Sleep and deep sleep are based on terms used in the E NERGY STAR criteria. Table 2 providesour definitions.
Table 2. Definition of Power Management Terms As Used in this Report
Personal Computers Monitors
Off The unit is plugged in (powered), the power button is in off position and the power indicator is dark.
DeepSleep
Not applicable The lowest low-power level between on and off.
Sleep5 The lowest power level between on and off.
The lowest low-power level between on and deepsleep.
OnThe power button is in the on position, the powerindicator is green. *
The power button is in the on position, the powerindicator is green, and the screen display is an "emptydesktop" (as-found on bootup)
*Note: Computer on power can vary considerably depending on the degree of processor activity. In this report, wemeasured on power when the processor was idle, so our measurements represent minimal computer on power.
5 Because it is confusing to have two definitions for sleep, we considered defining sleep as the lowest power level inmonitors as well as computers. However, that would require eliminating EPA's term deep sleep for monitors andintroducing another term (e.g., light sleep ) for the higher low-power level, introducing an additional element ofconfusion that we thought would effectively offset any benefit.

7
Description of Sample
To characterize the energy category, we selected and metered a sample that reflects (but is not necessarilyrepresentative of) the range of brands, cost, size, and type of models in the US market. To obtain oursample, we visited local offices and office equipment retailers; from models available to us in thoselocations, we selectively metered the number and type of units that we estimated to reflect the market,based on available data about market share by equipment manufacturer. We present a statistical analysis ofthe data, but recognize that because of the small sample size, particularly for the computer categories, ourresults may not be statistically significant.
Our sample includes only one unit of each model. We did not attempt to evaluate the consistency of powerconsumption between units of the same model. We did meter duplicate units of one model; the resultingvalues for each power mode were within 1W; only one set of results is included in our sample.
We report data for 35 monitors and 26 PCs, of which 14 are desktop computers, nine are laptops, and threeare integrated computer systems. All units were manufactured between July 2000 and October 2001. Formodels that did not exhibit a manufacturing date on their nameplate, we estimated the date by subtracting amonth from the date purchased (if the unit was metered in an office) or acquired (if metered in a retailshowroom). About halfway the through the metering we began recording unit cost (if it was in an office)or retail price (if it was in a showroom). We used this information to ensure the diversity of that sample.
Monitors
Monitor size is measured diagonally and rounded to the nearest inch. For CRT monitors, actual size isusually about an inch less than nominal (manufacturer list) size because the visible area of the tube isreduced when surrounded by (set into) the housing. Unless otherwise noted, this report describes CRTmonitors by their nominal size. For LCD monitors there is no distinction between actual and nominal size.Our sample includes four CRT sizes: 15", 17", 19", 21;" and three LCD sizes: 15", 17" and 18."
The sample of 35 monitors is characterized as follows:
Type: Nineteen (54%) are cathode ray tube (CRT); sixteen (46%) are liquid crystal display (LCD). 6
Brand: Acer, Compaq, Dell, Gateway, HP, KDS, Micron, NEC, Philips, Samsung, Sony, ViewSonic.
Price: Of eight CRTs for which we have costs, the range was $270 to $1,000;of the six LCDs for which we have costs, the range was $380 to $920.
Year: Ten of the monitors were manufactured in 2000; 25 were manufactured in 2001.Five did not exhibit a manufacturing date; we estimated the date as described above.
Location: Fifteen monitors were metered in retail showrooms, and twenty were metered in offices either atLBNL, the UC Berkeley campus, or the City of Berkeley.
Operating System: Three monitors were used with Macintosh desktop computers; the other 32 wereconnected to desktop computers with a Windows OS. Of the latter, eight used Windows 98, oneused Windows NT, eleven used Windows 2000, five used Windows ME, and seven Windows XP.
6 A potential source of confusion is that some new CRT monitors have flat (as opposed to slightly convex) screensand are variously advertised as "flat-screen" or "flat-display" monitors. These flat CRT screens should not be (but areeasily) confused with "flat-panel" technology, which includes both LCD and plasma monitors.
8
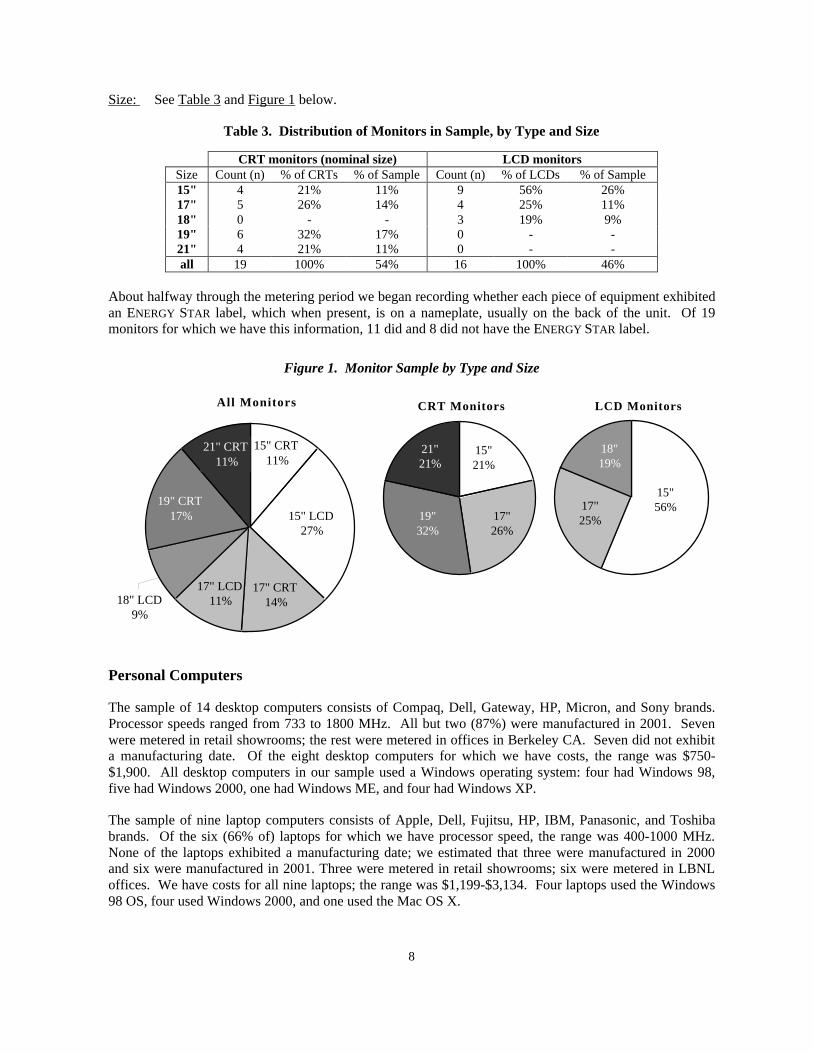
Size: See Table 3 and Figure 1 below.
Table 3. Distribution of Monitors in Sample, by Type and Size
CRT monitors (nominal size) LCD monitorsSize Count (n) % of CRTs % of Sample Count (n) % of LCDs % of Sample15" 4 21% 11% 9 56% 26%17" 5 26% 14% 4 25% 11%18" 0 - - 3 19% 9%19" 6 32% 17% 0 - -21" 4 21% 11% 0 - -all 19 100% 54% 16 100% 46%
About halfway through the metering period we began recording whether each piece of equipment exhibitedan ENERGY STAR label, which when present, is on a nameplate, usually on the back of the unit. Of 19monitors for which we have this information, 11 did and 8 did not have the ENERGY STAR label.
Figure 1. Monitor Sample by Type and Size
Personal Computers
The sample of 14 desktop computers consists of Compaq, Dell, Gateway, HP, Micron, and Sony brands.Processor speeds ranged from 733 to 1800 MHz. All but two (87%) were manufactured in 2001. Sevenwere metered in retail showrooms; the rest were metered in offices in Berkeley CA. Seven did not exhibita manufacturing date. Of the eight desktop computers for which we have costs, the range was $750-$1,900. All desktop computers in our sample used a Windows operating system: four had Windows 98,five had Windows 2000, one had Windows ME, and four had Windows XP.
The sample of nine laptop computers consists of Apple, Dell, Fujitsu, HP, IBM, Panasonic, and Toshibabrands. Of the six (66% of) laptops for which we have processor speed, the range was 400-1000 MHz.None of the laptops exhibited a manufacturing date; we estimated that three were manufactured in 2000and six were manufactured in 2001. Three were metered in retail showrooms; six were metered in LBNLoffices. We have costs for all nine laptops; the range was $1,199-$3,134. Four laptops used the Windows98 OS, four used Windows 2000, and one used the Mac OS X.
All Monitors
18" LCD9%
17" LCD11%
17" CRT14%
15" LCD27%
19" CRT17%
15" CRT11%
21" CRT11%
CRT Monitors
15"21%
17"26%
19"32%
21"21%
LCD Monitors
18"19%
17"25%
15"56%
9
The three ICSs (integrated computer systems) in our sample are:• An Apple iMac, in which a computer and CRT monitor are integrated into the same housing,• A Gateway Profile, in which a computer and LCD monitor are integrated in the same housing, and• An Apple G4 PC power-linked to an Apple Studio Display LCD monitor, in which the computer and
monitor are connected by a single cable that carries power, and video and USB signals. The monitorcannot be plugged into an outlet, and the two components cannot be metered separately.
Of the three ICSs, only one unit (the Apple G4) bore a manufacturing date; their costs ranged from $949(for the iMac) to $3,308 (for the Apple G4 with Studio Display monitor).
None of the eight PCs for which we looked for an ENERGY STAR label bore the label.
Methodology
Metering Equipment
Six field power line meters (PLMs) were used in our study; three model PLM-1-LP and three model PLM-1-PK. All are from Electronic Product Design, Inc. (EPDI, Springfield OR), which tested and calibratedthem in July and August 2000. At the end of our study in December 2001, two of the PLMs were tested atthe LBNL Lighting Laboratory against a bench model Voltech PM3000A Universal Power Analyzer. ThePLMs accurately measured a no-load at 0W, and measured the "real" power load from a nominal "75W"incandescent lamp at 72.6W and 72.7W, compared to the bench model's measurement of 72.4W; i.e., thePLMs were accurate to within 0.4%.
Field Measurements
Power measurement was conducted by "spot metering," in which each machine is plugged into a powermeter and "real RMS" power consumption in watts (W) is measured for each power level at a single pointin time. Whenever a machine entered a new power level, we waited at least 15 seconds for the power tostabilize, observed the readout for 30 seconds, and recorded the range and mode (most frequent reading) ofthe power readout in watts.7 Refer to Appendix A for a detailed description of our metering protocols.
Power measurements were recorded in tenths of a watt, and the results of our calculations are reported tothe nearest watt.
Our measurements of monitor on power were made just after the computer booted-up and the displayshowed an empty (as-found, user-defined) desktop. Monitor on power actually varies considerablydepending on the image displayed, and this issue is discussed in detail later in this report. Our spotmeasurements are intended to capture "typical" on power, but they are not standardized to a specific displayand they do not capture the full range or a full duty-cycle of monitor on power consumption.
Because external USB devices (keyboard, mouse, etc.) affect power consumption, power measurementsand standard test procedures should account for devices connected to USB ports. For each machine in oursample, we recorded the type of equipment (if any) connected to its USB ports, and for most machines wealso recorded the number of USB ports.
7 PLM measurements and calculations are updated every second.

10
Measurements of the time required for a monitor display to recover or wake from (PC or monitor) low-power levels are necessarily subjective and therefore should be considered as rough estimates. Recoverytimes were estimated to the nearest second, and the minimum recovery time recorded was 1 second, evenwhen a display appeared to recover instantaneously. Recovery timing started with the wake event andended when there were no further changes in brightness of the display. Recovery times are not availablefor many units in our sample for a variety of reasons, including the difficulty of immediately ascertainingwhether a particular wake event actually initiated a recovery from low-power.
Wake events vary with the low-power level and type of communication between computer, monitor, andOS. In order of increasing "difficulty," the wake events for both personal computers and monitors are: (1)mouse movement, (2) mouse click, (3) keyboard action (hitting any key), and (4) pressing the PC powerbutton.8 If in addition to the monitor, the computer has also entered a low-power level, a more "difficult"wake event is usually required, and the time it takes the display to recover will increase by the time it takesthe computer to respond to the wake event. Estimated monitor recovery times reported in our data do notinclude computer recovery times.
Results and Discussion
Monitors: Low-power Levels
The current criteria for ENERGY STAR monitors specifies power consumption in two low-power modes: ≤15W in sleep, and ≤ 8W in deep sleep. However, 83% of monitors in our sample exhibited only one low-power level, 94% of which were low enough to meet ENERGY STAR criteria for monitor deep sleep. Thissuggests a clear trend among monitor manufacturers to provide a single very low low-power level.
Table 6 below shows that among monitors in our sample, average deep sleep power for CRTs was 7W, butaverage deep sleep power for LCDs was 2W, which is indistinguishable from average LCD off power.
As described earlier, two objectives of our metering were to (1) identify and measure all low-power levels(between off and on), and (2) to establish some correspondence between these and the ENERGY STAR sleepand deep sleep criteria for monitors. As defined in Table 2, we determined that if a monitor exhibited onelow-power level, it corresponded to the ENERGY STAR deep sleep level, and if a monitor exhibited two low-power levels, the higher low-power level corresponded to sleep.
Based on these definitions, 34 (97% of) monitors in our sample exhibited a deep sleep power level, and ofthese, 32 (94%) met the ENERGY STAR criterion of ≤ 8W in deep sleep. Thus, 32 of 35 (91% of) monitorsin our sample met the ENERGY STAR deep sleep criterion. On the other hand, only six (17% of) monitors inour sample exhibited a sleep mode. Of these, four (67%) met the ENERGY STAR criterion of ≤ 15W; therange was 6W-10W.
Of the three (9% of) monitors that did not meet ENERGY STAR criteria for sleep or deep sleep powerconsumption, two were used with computers run by the Windows ME operating system. Both of theseexhibited two low-power modes corresponding to sleep (69W and 79W) and deep sleep (28W and 61W,respectively), all of which are well above the ENERGY STAR sleep and deep sleep criteria for monitors. Thethird monitor was used with a computer run by the Windows NT operating system, which does not allowpower management; however, this monitor did power manage when the computer was turned off.
8 In this paper the term "mouse" includes mouse equivalents such as a trackball or touch pad.

11
To inform EPA's revision of ENERGY STAR criteria for monitor power management, we calculatedminimum, maximum, average, median and quartile values for power consumption in each power level.Table 4 and Figure 2 below show the statistical analysis for all monitors in our sample; Figure 2 does notinclude sleep power because so few monitors in our sample exhibited sleep mode. The 25th percentile ofdeep sleep power consumption is 2W, which is also the 50th and 75th percentile value. In other words, 75%of monitors in our sample used ≤ 2W in deep sleep. The 25th percentile of deep sleep power is the same(2W) for both CRT and LCD monitors, as seen in Appendix C: Statistical Analysis of Monitor PowerLevels, which show results by monitor type and size.
Table 4. Statistical Analysis of All Monitors, All Power Levels
Count (n) 35 34 6 28 35
All Monitors Off (W) Deep Sleep(W)
Sleep(W)
Monitor On (W),with PC Off
Monitor On (W),with PC On
Minimum 0 1 6 1 1425th percentile 0 2 9 2 33
Median/50th percentile 1 2 10 2 56Average/Mean 1 5 30 12 5575th percentile 2 2 54 3 74
Maximum 9 61 79 78 110
Figure 2. Statistical Analysis of All Monitors, Most Power Levels
Note: The top and bottom of each box correspond to Mean and 25th percentile values, respectively.The vertical line through each box shows the range (maximum and minimum) of measured values.
Monitors: Recovery Time from Low-Power Levels
A central issue in power management is the time it takes a machine to recover from low-power levels.Therefore, besides recording monitor low-power levels, we recorded the minimal action (wake event)required to initiate recovery from each low-power level, and the estimated time, in seconds, that it tookeach display to fully recover. Timing of monitor recovery began with the wake event and ended when
0
20
40
60
80
100
120
Off Deep Sleep On (PC Off) On (PC On)
W

12
there was no apparent change in the brightness of the display, and although some monitors appeared torecover instantaneously, the minimum time we recorded was 1 second. Because these observations arenecessarily subjective and approximate, our resulting times should be considered to be rough estimates.
Individual results of estimated monitor recovery times are in Appendix B, Table B1. The range of recoverytime from deep sleep was 1-12 seconds for CRTs, and 1-3 seconds for LCDs; the median time from deepsleep was 8 seconds for CRTs, and 2 seconds for LCDs. Figure 3 presents recovery time from deep sleepby monitor type and deep sleep power savings (or on power minus deep sleep power).
Although there is variability within the CRT and LCD samples, in general, the more power that is saved bypowering down from on to deep sleep, the longer it takes a monitor to recover from deep sleep; CRTs savemore power (relative to on) but take more time to recover from deep sleep than LCDs. CRTs saved 40-110W in deep sleep and took 3-12 seconds to recovery; LCDs saved 10-40 W and took 1-3 seconds to recover.
Figure 3. Monitor Recovery Time by Monitor Type and Deep Sleep Power Savings (W)
Without exception in our metering, the wake event for the automatic PM level "Turn off monitor"(Windows) and "display sleep" (Macs) was mouse movement; recovery time varied from 1-11 seconds.Although some monitors appeared to recover instantly, the minimum time recorded was "1 second."
Of three monitors in our sample run by a Mac OS, the wake event for "system sleep," both automatic andmanual, was the keyboard. However, among monitors connected to desktop computers using a WindowsOS, wake events from the "standby" power level varied widely among monitor brands, computer brands,and even depending on whether "standby" was initiated automatically (through the control panel) ormanually. We found no correlation between "standby" wake events and monitor brand, computer brand, orWindows OS version. Of 17 desktop computers using with a Windows OS and "hibernate" mode, thecomputer power button was the wake event for all but one (an LCD monitor used with a computer usingWindows 2000), which required only a mouse move. These observations suggest the complexity ofinteraction between power management features in the hardware and the OS.
0
2
4
6
8
10
12
0 20 40 60 80 100 120
Deep Sleep Savings (On minus Deep Sleep) (W)
Wak
e fr
om D
eep
Slee
p (s
econ
ds)
CRTs
LCDs

13
Monitors: Effect of Operating System on Low-Power Levels
Monitors depend on the computer to initiate power management (PM) through the video card. Formonitors in our sample, we recorded the desktop computer operating system (OS) and the PM features andsettings as-found in the appropriate OS control panel. Some operating systems (including Windows NT, aswell as some Linux and Unix) do not natively9 support or allow PM. Among operating systems that dosupport PM, availability and nomenclature of power management (PM) features varies considerably,although PM features and terms tend to be relatively consistent among different versions of the same OS.
In the Macintosh (Mac) OS, automatic PM settings in the "energy saver" control panel are called "(system)sleep", "display sleep", and "hard disk sleep." "(System) sleep" can also be manually initiated from the"special" menu. In Macintosh PCs the BIOS is not accessible. Windows operating systems usually (butnot always) have the same "turn off monitor", "turn off hard disks" and "system standby" automatic PMdelay settings available in a control panel that is called "power management" in Windows 98 and "poweroptions" beginning with Windows 2000. The "hibernate" feature, also new in Windows 2000,10 must beenabled in the "power options" control panel in order for its automatic delay settings to be available in thatcontrol panel, or for it to be available for manual selection from the "start" menu.
The single (17" CRT) monitor connected to a desktop computer using Windows NT (which does not allowPM), did not sleep (power manage) when the computer was on; however, this monitor powered down to1W when the computer was off. (When the computer and monitor were both off, the monitor used 0W.) Inthis case, the Windows NT OS clearly prevents PM in a monitor that is otherwise capable of PM. Otherthan this discussion, this monitor's deep sleep PM level is excluded from our results and analysis, which areconcerned with monitor power levels measured when the computer to which it is connected is not off.
One desktop computer that used the Windows 98 OS could also be booted up using a Linux 6.2 OS. Wemetered its 21" CRT monitor using both operating systems and found identical power levels (including a2W deep sleep) except on, which measured 110W with Windows 98 and 118W with Linux. This 8Wdifference can be attributed to differences in color between the desktop displays of each OS. Although thismonitor was metered twice (once with each OS), we used one set of results (those corresponding to theWindows 98 OS) in our subsequent analysis.
Only two (6% of) monitors – a 19" CRT and a 21" CRT – failed to achieve ENERGY STAR power levels;both were connected to computers using Windows ME. In response to PM settings in the control panel,both monitors exhibited two successive power levels between on and off, but neither level was ≤ 15W.Sleep and deep sleep were 69W and 61W in the 19" CRT, and 79W and 28W in the 21" CRT monitor.
In our monitor sample, we found one Windows 2000 and two Windows 98 desktop computers for which"standby" settings were not available in the control panel. Although their monitors could sleep, thesecomputers were unable to automatically or manually enter "standby" mode. In one 17" LCD monitorconnected to a Windows 98 desktop computer, we manipulated BIOS PM settings in an unsuccessfulattempt to enable "standby" settings in the OS control panel. In three other monitors connected to desktopcomputer using various Windows OSs, "standby" was available wither manually or automatically, but notboth. These observations reflect the inconsistency and unpredictability of PM.
9 For Windows NT, add-on software is available that enables monitor power management.
10 Before 2000, proprietary software was available to enable some laptop computers to "hibernate."

14
Monitors: Off Power
In our sample, two-thirds (68%) of CRTs used 0W when off, compared to only 12% of LCD monitors. Onaverage, CRT monitors in our sample used 1W when off, while LCD monitors used 2W when off. Theseresults agree with those of Groot and Siderius (2000), who found that while some CRT and LCD monitorsused 0W when off, CRTs use 1.2W on average and LCDs use 2.5W on average when off. However, for allmonitors in our sample, including CRTs and LCDs, the 25th percentile of off power was 0W.11 Theseresults indicate an opportunity to reduce off power consumption, particularly in LCDs.
In discussing monitor off power, it is important to note that our results are reported to the nearest watt. Oncloser inspection of the measurements, which were recorded in tenths of a watt (according to the PLMreadout), almost half (9) of the 19 CRTs measured 0.0W when off, but none of the 16 LCDs did.
These differences between CRT and LCD off power are attributable not to their display technology, butrather to the location of the power switch relative to the power supply. A power supply receives high(~115V) voltage from the power main and sends low(er) voltage to the electronic components of themonitor; the monitor power switch (or button) is located either on the "high" or "low" side of the powersupply. If the monitor power switch is on the high (wall) side of the power supply, the monitor is said tohave a "hard off" feature because it draws no power (0.0W with our metering protocol) when switched off.If the switch is on the low side, the power supply is said to have a "soft off" feature because is draws somepower ( ≥ 0.1W with our protocol) from the wall outlet even when the switch is off. The power supply ofCRTs is internal (within the monitor housing) but to reduce the weight and size of LCDs, their powersupply is often external, with the power supply incorporated into either the plug or the power cord.Monitors with an internal power supply (e.g., CRTs) can have either a "hard off" or "soft off" switch, whilemonitors with an external power supply (most LCDs) use power when off because their switch is a "softoff." The amount of off power used by monitors with external power supplies depends on the efficiency orquality of their external power supply, which varies considerably.
The nine CRT monitors in our sample that measured 0.0W when off clearly had a "hard off" feature. Table5 compares off power of the remaining 26 monitors (10 CRTs, 16 LCDs) that had measurable (≥ 0.1W) offpower consumption, i.e., those monitors whose switch is on the low side of the power supply.
Table 5. Comparison of Off Power for Monitors that Consume Power when Off
Off Power Consumption (W)Monitor type Count Range Average Median
CRT 10 0.2-9.3 2.1 1.7LCD 16 0.1-3.6 1.8 1.8
When CRTs and LCDs whose power switch is on the low side of the power supply are compared, their offpower consumption is similar; both average and median values for CRTs and LCDs round to 2W.
Off power consumption is eliminated by placing the power switch on the high side of the power supply,which requires an internal power supply. Although most LCDs currently have external power supplies, it ispossible to incorporate internal power supplies, particularly in larger LCDs. Even among LCDs withexternal power supplies in our sample, the wide range of off power (0.1-3.6W) indicates that some external
11 Note that because of rounding, "0W" means 0.0-0.4W, "1W" means 0.5-1.4W, and "2W" means 1.5-2.4W.

15
power supplies use much less off power than others; this indicates an opportunity to reduce off powerconsumption in LCD with external power supplies by installing more efficient power supplies.
Monitors: On Power
Current ENERGY STAR monitor criteria do not specify power consumption in off or on mode, but to theextent that monitor size (and percent time on) continue to increase, reducing monitor on powerconsumption becomes more important in efforts to reduce office equipment energy use (Groot & Siderius2000).
The amount of power consumed by a monitor when on is primarily a function of its type (CRT, LCD),screen size, and the image displayed. LCD monitors use less energy when on than CRT monitors of similarsize. The larger the screen size, the more power a monitor uses when on; this applies to both CRT andLCD monitors (Nordman et al. 1997). Image displayed is primarily a function of the user's color settingsand desktop graphics, as well as the color and size of open application windows; a given monitor requiresmore power to display a white (or light) screen than a black (or dark) screen. Displayed image affects onpower more in CRTs than LCDs, as discussed in detail below. However, brightness and contrast (whichcan be adjusted using controls on the front of the monitor), as well as refresh rate and resolution settings(which can be changed in the computer’s OS control panels) also affect the amount of power a monitoruses when on. (These factors are further discussed below, in the section Monitors: Revised On PowerEstimates.)
Comparing the energy use of monitors on the basis of screen size is problematic for several reasons. First,the actual diagonal size of the display on a nominal 19" CRT monitor is closer to 18" than 19", but thedifference (whether absolute or relative) between actual and nominal CRT size is not consistent, so the onlyway to accurately determine the diagonal size of a CRT's actual display is to measure each CRT monitor.Second, LCD sizes do not always correspond to actual CRT sizes; e.g., our sample consists of 15", 17", and18" LCDs, while actual sizes of CRTs in our sample are approximately 14", 16", 18", and 20" (nominalsizes 15", 17", 19", and 21", respectively); i.e., LCDs and CRTs don’t always have the same diagonal sizes.Third, a given diagonal screen size has several possible aspect ratios, or height and width combinations,each with a slightly different display area. Fourth, for a given display area, there are many possiblecombinations of brightness, contrast, and resolution settings, all of which affect on power consumption.
Clearly, accurate comparison of monitor on power consumption requires a better metric than diagonal size;the ideal metric would normalize monitor on power consumption by unit display area. In a recent report toEPA, ECOS Consulting (Callwell & Reeder 2002) recommends normalizing monitor on power (W) usingpixel count, which is the product of horizontal and vertical resolution. “ Pixels per watt” has severaladvantages as a basis for normalizing monitor on power consumption; besides being able to makecomparisons between monitor technology and size, incongruities in resolution or aspect ratio also becomeirrelevant.
Unfortunately, in this study we did not record resolution settings, and so we do not have pixel counts formonitors in our sample. Nor did we record horizontal and vertical screen measurements of the actualdisplay of each CRT, which would provide the accurate screen areas. Therefore, we instead calculate anapproximate display area based on the nominal diagonal size of the monitors, assuming each monitor hasan aspect ratio of 3:4 (height:width) and that CRT actual size is one inch less that its nominal size.
Table 6a presents monitor on power as a function of approximate display area in square inches, and Table6b presents monitor on power as a function of approximate display area in square centimeters. Figures 4and 5 display these results graphically.

16
Figure 4. Average Monitor On Power Consumption (W per Approximate Display Area)
Figure 5. Statistical Monitor On Power Consumption by Type and Size
Note: The top and bottom of each box correspond to Mean and 25th percentile values, respectively.The vertical lines through each box show the range (maximum and minimum) of measured values.
0.0
0.1
0.2
0.3
0.4
0.5
0.6
0.7
14 15 16 17 18 19 20 21 22
Monitor Size (diagonal inches)
On
Pow
er (
W p
er s
q in
)
CRT LCD
17
Table 6a. Average Monitor On Power per Unit Display Area (W/in2, approximate)
Nominal Diagonal Size (in) 15" 17" 18" 19" 21" All sizesCRT On Power (W/in2) 0.61 0.50 - 0.53 0.53 0.54LCD On Power (W/in2) 0.18 0.25 0.34 - - 0.23
LCD (W/in2) ÷ CRT (W/in2) (%) 30% 51% - - - 43%
Table 6b. Average Monitor On Power per Unit Display Area (W/cm2, approximate)
Nominal Diagonal Size (in) 15" 17" 18" 19" 21" All sizesCRT On Power (W/cm2) 0.10 0.08 - 0.08 0.08 0.08LCD On Power (W/cm2) 0.03 0.04 0.05 - - 0.04
LCD (W/cm2) ÷ CRT (W/cm2) (%) 30% 51% - - - 43%
Even with the uncertainties involved in our calculation of display areas, the differences between CRT andLCD on power are robust enough to confirm that LCDs consume significantly less power when on thanCRTs of similar size. On average, for monitors in our sample, 15" LCDs consume 30% as much powerwhen on as 15" CRTs, and 17" LCDs consume 51% as much power when on as 17" CRTs.
The data also suggest that LCD on power per unit display area increases slightly with LCD size; in otherwords, that the difference between CRT and LCD on power decreases as monitors get larger. Based onapproximate display areas for monitors in our sample, and on average, 18" LCDs used 36% more on powerper unit area than 17" LCDs, and 88% more on power per unit area than 15" LCDs. A possible explanationfor these results is that larger LCDs have higher resolution as well as smaller pixels (higher pixel density),which require more backlighting to achieve the same level of brightness (Callwell 2002). In any case,further investigation is needed to determine if these results are borne out with a larger sample size.
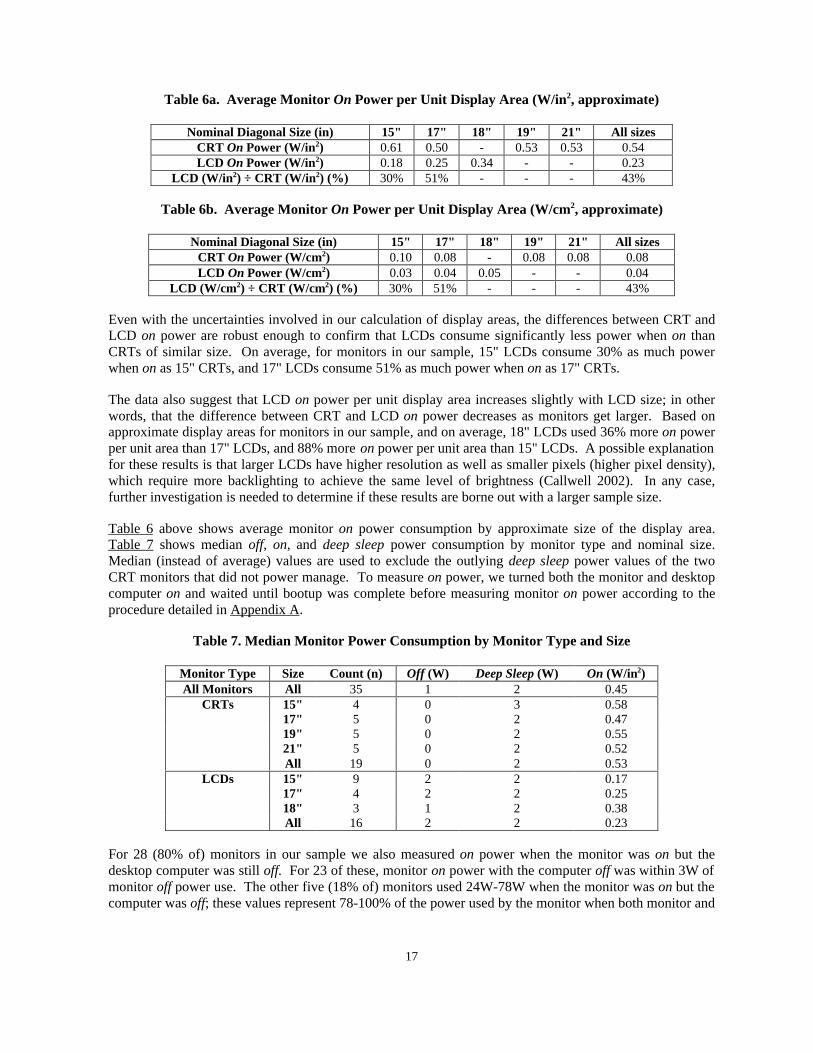
Table 6 above shows average monitor on power consumption by approximate size of the display area.Table 7 shows median off, on, and deep sleep power consumption by monitor type and nominal size.Median (instead of average) values are used to exclude the outlying deep sleep power values of the twoCRT monitors that did not power manage. To measure on power, we turned both the monitor and desktopcomputer on and waited until bootup was complete before measuring monitor on power according to theprocedure detailed in Appendix A.
Table 7. Median Monitor Power Consumption by Monitor Type and Size
Monitor Type Size Count (n) Off (W) Deep Sleep (W) On (W/in2)All Monitors All 35 1 2 0.45
15" 4 0 3 0.5817" 5 0 2 0.4719" 5 0 2 0.55
CRTs
21" 5 0 2 0.52All 19 0 2 0.5315" 9 2 2 0.1717" 4 2 2 0.2518" 3 1 2 0.38
LCDs
All 16 2 2 0.23
For 28 (80% of) monitors in our sample we also measured on power when the monitor was on but thedesktop computer was still off. For 23 of these, monitor on power with the computer off was within 3W ofmonitor off power use. The other five (18% of) monitors used 24W-78W when the monitor was on but thecomputer was off; these values represent 78-100% of the power used by the monitor when both monitor and
18
computer are on. The results (listed in Appendix B, Table B.1 Monitor Metering Results) suggest thatsome monitors left on are unable to power manage when the computer to which they are connected is off.The significance of this observation is uncertain, however, because it is possible that some of thesemonitors would have powered down given more time than we allowed (about a minute); some monitorstake up to 15 minutes to respond to the absence of a signal from the computer.
Monitors: Revised On Power Estimates
Monitors and PCs were the first products labeled by the ENERGY STAR Office Equipment program, andenergy saved by power management of monitors has been and remains important to program success. Asdescribed above, the ENERGY STAR program evaluates its success by calculating the energy saved by powermanagement of office equipment, and reliable estimates of energy savings depend in large part on accurateassessments of the power used by each product in each power level.
Based on our metering results, we estimate that monitors sold in 2001 have an average on power of 65W(using data on shipments-by-type-and-size to weight the power levels resulting from this study).Previously, ENERGY STAR monitor savings estimates were based on an on value of 85W, which is a simpleaverage of on power levels reported by participating manufacturers. Use of the lower (65W) on powervalue has considerable negative impact on ENERGY STAR program savings estimates and created a situationthat required us to investigate the discrepancy between measured and manufacturer-reported on power.
First we verified that our measurement techniques were generating accurate and reproducible results. Asdiscussed earlier, our meters were tested to be accurate within 1% of the measured power level. Moreover,repeat measurement of several machines yielded results very close to our original values. We thereforeconcluded that our measurements accurately represent real power levels in the conditions in which wemetered. Next we looked at the nature of the data reported to EPA by the manufacturers. We identified 15monitor models in our sample that are also on EPA's list of ENERGY STAR monitors, and for which thereare manufacturer-reported data. This subset includes CRTs and LCDs of a range of sizes. Withoutexception, manufacturer-reported on power was higher than our measured value, indicating a consistentdifference in the way manufacturers either measured or reported the power data.
To determine the source of this bias, we contacted five major monitor manufacturers, three of whomresponded with information. Each manufacturer used a different method to measure monitor power, but inall cases the values reported to EPA were based on a "worst case scenario;" which in the case of on powermeans maximum brightness and resolution, and a white screen. Also, of the manufacturers that testedmultiple units of a given model, all decided to report their highest individual measurement.
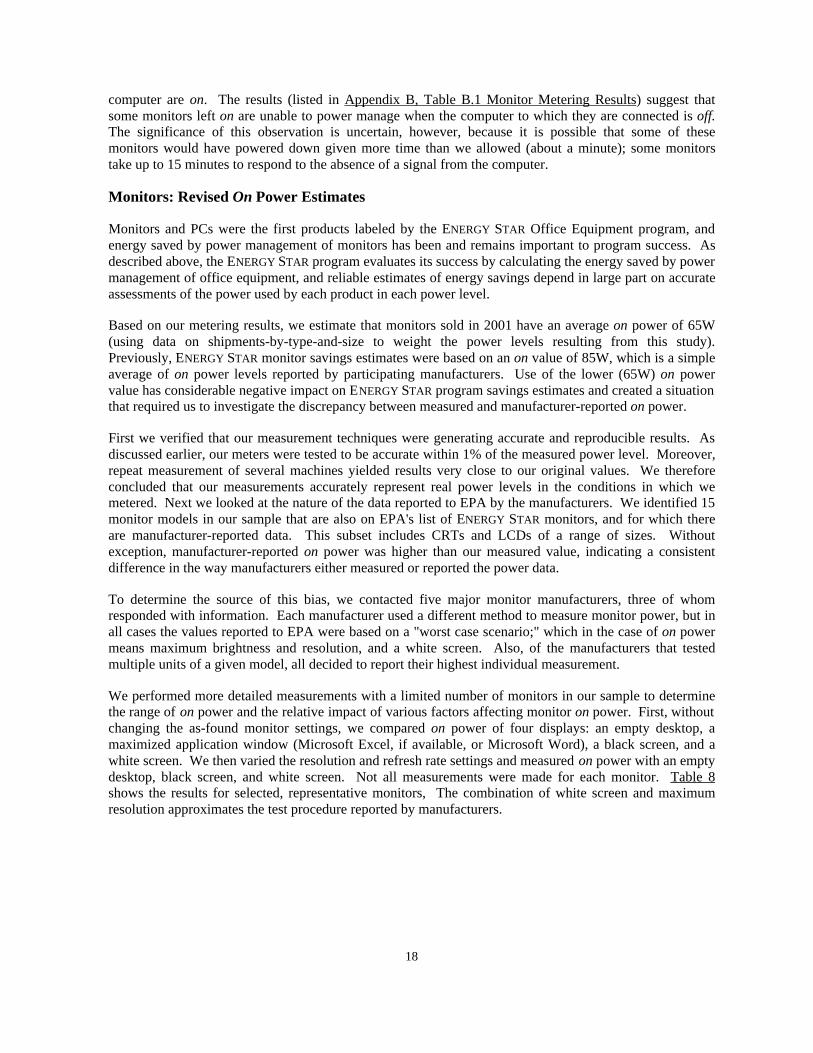
We performed more detailed measurements with a limited number of monitors in our sample to determinethe range of on power and the relative impact of various factors affecting monitor on power. First, withoutchanging the as-found monitor settings, we compared on power of four displays: an empty desktop, amaximized application window (Microsoft Excel, if available, or Microsoft Word), a black screen, and awhite screen. We then varied the resolution and refresh rate settings and measured on power with an emptydesktop, black screen, and white screen. Not all measurements were made for each monitor. Table 8shows the results for selected, representative monitors, The combination of white screen and maximumresolution approximates the test procedure reported by manufacturers.
19
Table 8. Variation in Monitor On Power (W), for Selected Monitors
Monitor On Power (W)Display Desktop Application Black White Desktop Black White
Resolution As-found Min Max Min MaxRatio of max tomin On W (%)
15" 63 66 62 66 58 57 67 11815" 56 48 57 11917" 86 97 75 93 82 86 74 96 13117" 96 104 74 104 14019" 90 86 103 12019" 91 99 69 97 82 99 59 111 18821" 118 123 103 128 116 125 124
CRT
21" 99 93 111 11915" 17 16 16 10615" 33 32 33 33 10318" 59 57 59 104
LCD
18" 40 37 40 40 37 108
The data in Table 8 seem to indicate that on power is more variable in CRTs than LCDs (the ratio ofmaximum to minimum on power ranges from 118-188% in CRTs, compared to 103-108% in LCDs.Among CRTs, maximum on power appears to be associated with a white display, or a maximum-sizedapplication window (which approximates a white display). Among the few LCD monitors in the table, thepower used to display a white screen is indistinguishable from power used to display the desktop. Thus, itappears that display color is a significant determinant of on power for CRTs, but not for LCDs.
However, we did not measure the full effect of brightness and contrast settings on monitor on power.Another researcher observed that these settings (whose controls are on the front of each monitor), have agreater impact on the range of LCD on power than do resolution or screen color, because a brighter LCDrequires more backlighting, the most energy-intensive component of LCDs (Callwell 2002). Morethorough testing is needed to characterize and quantify the effect of all these variables (monitor brightness,contrast, refresh rate, resolution, and screen color) on the range of CRT and LCD on power.
In summary, manufacturers made a good faith effort to provide accurate data to EPA, but the absence of astandard protocol for measuring and reporting power data meant that each manufacturer had to developtheir own method, and each reported their worst case results for a variety of practical reasons. (Worst-caseconditions are routinely used for purposes of documenting product functionality, liability, and consumerprotection.)
By comparison, LBNL's metering protocols were designed to reflect typical operating conditions, on whichENERGY STAR program savings estimates are supposed to be based. As a result of our investigation intothe discrepancy between measured and reported power, LBNL's measured values have replacedmanufacturer-reported values for use in estimating overall energy savings from ENERGY STAR monitors.
Although the ENERGY STAR program intended to use the manufacturer-reported data to evaluate its ownsuccess in terms of energy savings, manufacturers (understandably) assumed that information they reportedwould or could be used to evaluate their own "compliance" with the ENERGY STAR program.13 Clearly,there is a need to more effectively communicate the program's data collection goals to participatingmanufacturers.
13 ENERGY STAR is a voluntary - not regulatory - program.
20
Desktop Computers
Our computer sample consists of 14 desktops, nine laptops, and three integrated computer systems. Whilesuch small sample sizes may not be statistically significant, but their analysis may nevertheless provideuseful insights into power use and trends among the newest generation of personal computers.
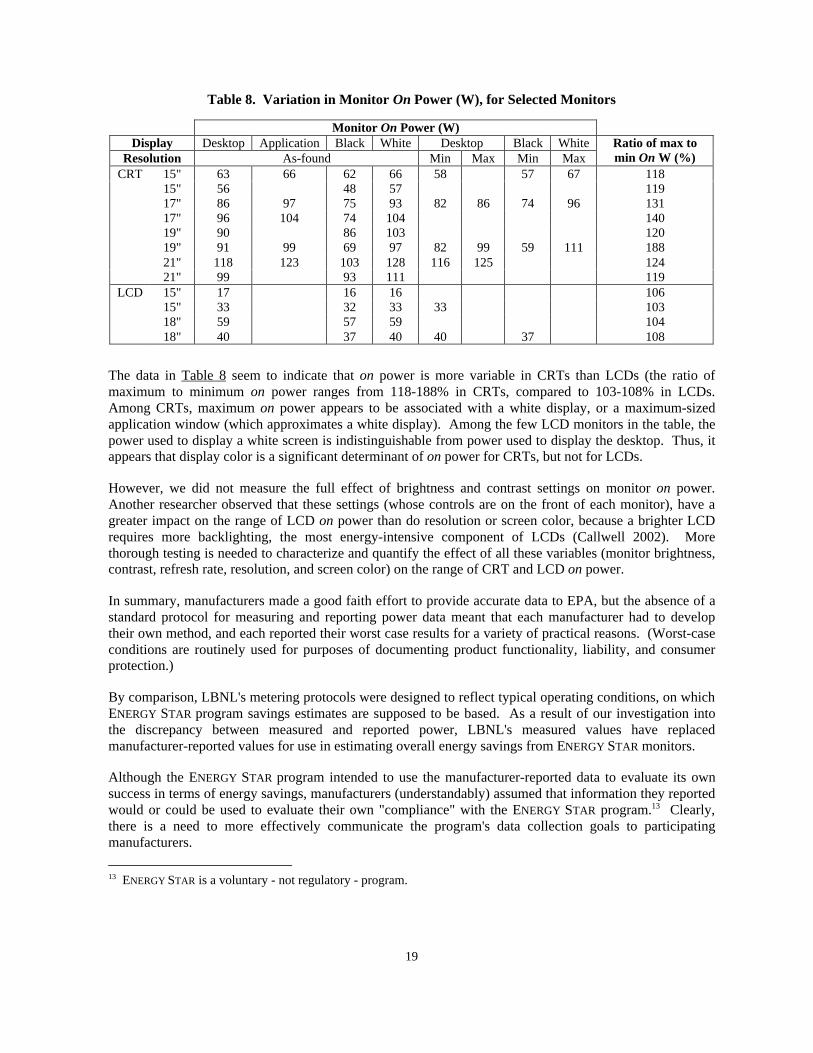
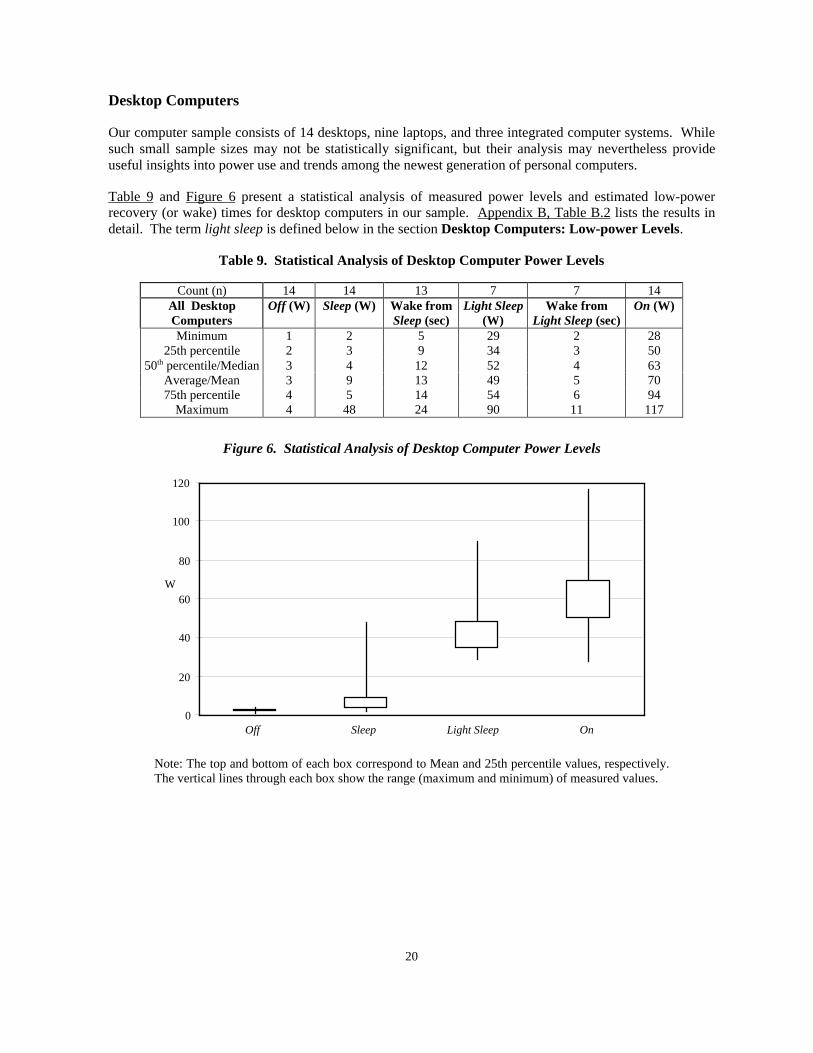
Table 9 and Figure 6 present a statistical analysis of measured power levels and estimated low-powerrecovery (or wake) times for desktop computers in our sample. Appendix B, Table B.2 lists the results indetail. The term light sleep is defined below in the section Desktop Computers: Low-power Levels.
Table 9. Statistical Analysis of Desktop Computer Power Levels
Count (n) 14 14 13 7 7 14All DesktopComputers
Off (W) Sleep (W) Wake fromSleep (sec)
Light Sleep(W)
Wake fromLight Sleep (sec)
On (W)
Minimum 1 2 5 29 2 2825th percentile 2 3 9 34 3 50
50th percentile/Median 3 4 12 52 4 63Average/Mean 3 9 13 49 5 7075th percentile 4 5 14 54 6 94
Maximum 4 48 24 90 11 117
Figure 6. Statistical Analysis of Desktop Computer Power Levels
Note: The top and bottom of each box correspond to Mean and 25th percentile values, respectively.The vertical lines through each box show the range (maximum and minimum) of measured values.
0
20
40
60
80
100
120
Off Sleep Light Sleep On
W

21
Desktop Computers: Off & On Power
None of the desktop computers used 0W when off; the range of off power was 1-4W, the average andmedian were 3W, and the 25th percentile was 2W.
Desktop computer on power ranged from 28-117W; the 25th percentile was 50W. Table B2, which is sortedby on W, suggests desktop computer on power is more closely correlated with CPU make and model thanwith CPU speed. Although the two desktop computers with the slowest CPUs (733 MHz) also had thelowest on power (28W and 36W), on power of the two computers with the fastest CPUs (1800 MHz) were63W and 94W; these values correspond to the 50th and 75th percentile, respectively, but are not among thehighest on values, which are over 100W.
Table 10 and Figure 7 show the relationship between desktop computer on power and CPU make, model,and speed. In our sample, desktop computers with Intel Pentium 3 CPUs averaged 38W when on,compared to an average 67W for desktop computers with Intel Pentium 4 CPUs, and an average of 104Wfor desktop computers with AMD Athlon CPUs. However, these results are not necessarily a completeindicator of processor efficiency, because CPU performance is affected by factors other than processorspeed (MHz).
Table 10. Measured Desktop Computer On Power by CPU Brand, Model, and Speed
CPU Measured On Power (W)Count (n) Brand, Model Speed Range Range Average
4 Intel Pentium 3 733-1000 MHz 28-47 386 Intel Pentium 4 1300-1800 MHz 59-94 674 AMD Athlon 1000-1400 MHz 93-117 104
Figure 7. Measured Desktop Computer On Power by CPU Brand, Model, and Speed
0
20
40
60
80
100
120
600 800 1000 1200 1400 1600 1800 2000
Processor Speed (MHz)
On
Pow
er (
W)
Intel Pentium 3 Intel Pentium 4 AMD Athlon
22
Desktop Computers: Low-power Levels
As seen in Table 1, the current criteria for ENERGY STAR computers specifies a single low-power level –sleep – depending on the rated output of the power supply, in watts. In practice, is very difficult to identifythe size of the rated power supply of a given computer without opening the computer housing, which wasbeyond the scope of our field metering protocol. We were therefore unable to determine the size of thepower supply for any of the desktop computers in our sample, and discussion of our metering results inrelation to ENERGY STAR computer criteria is necessarily limited to a suggestion that revisions of thecomputer criteria be based on a computer specification that is more readily apparent.
As with monitors, we needed to correlate measured desktop computer low-power levels with ENERGY
STAR'S sleep mode, which we defined as the lowest low-power level between off and on. However, seven(50% of) our sample exhibited at least two low-power levels, and one exhibited three low-power levels.Therefore, for the purpose of this discussion, we define a second, higher low-power level – light sleep.
Based on this definition, sleep power consumption among all 14 desktop computers in our sample(regardless of the size of their power supplies, which we could not ascertain) ranged from 2-48W. Averagesleep power was 9W, the median 4W, and the 25th percentile was 3W, which is far below the lowestENERGY STAR sleep criterion in Table 1 (15W for computers whose power supply is ≤ 200W). Thisindicates that the ENERGY STAR criteria for computer sleep power needs to be revised downward.
In an attempt to correlate sleep power with a computer characteristic other than power supply, we lookedfor a correlation between sleep power levels and CPU brand and speed (MHz), but found none. In oursample, the range of CPU speed was 733-1800 MHz, but the two desktop computers that used the leastpower (2W) in sleep both had 1700 MHz CPUs, while two of the three desktop computers that used themost power in sleep had 733 MHz CPUs.
Based on our definition of light sleep, the seven desktop computers that exhibited a light sleep mode usedfrom 29-90W in light sleep, and the 25th percentile for power consumption in light sleep was 34W.
Of 13 desktop computers for which we estimated recovery time from sleep, the range was 5-24 seconds, theaverage 13 seconds, and the 25th percentile 9 seconds. Of the seven desktops for which we estimatedrecovery time from light sleep, the range was 2-11 seconds, the average 5 seconds, and the 25th percentile 3seconds.
Laptop Computers
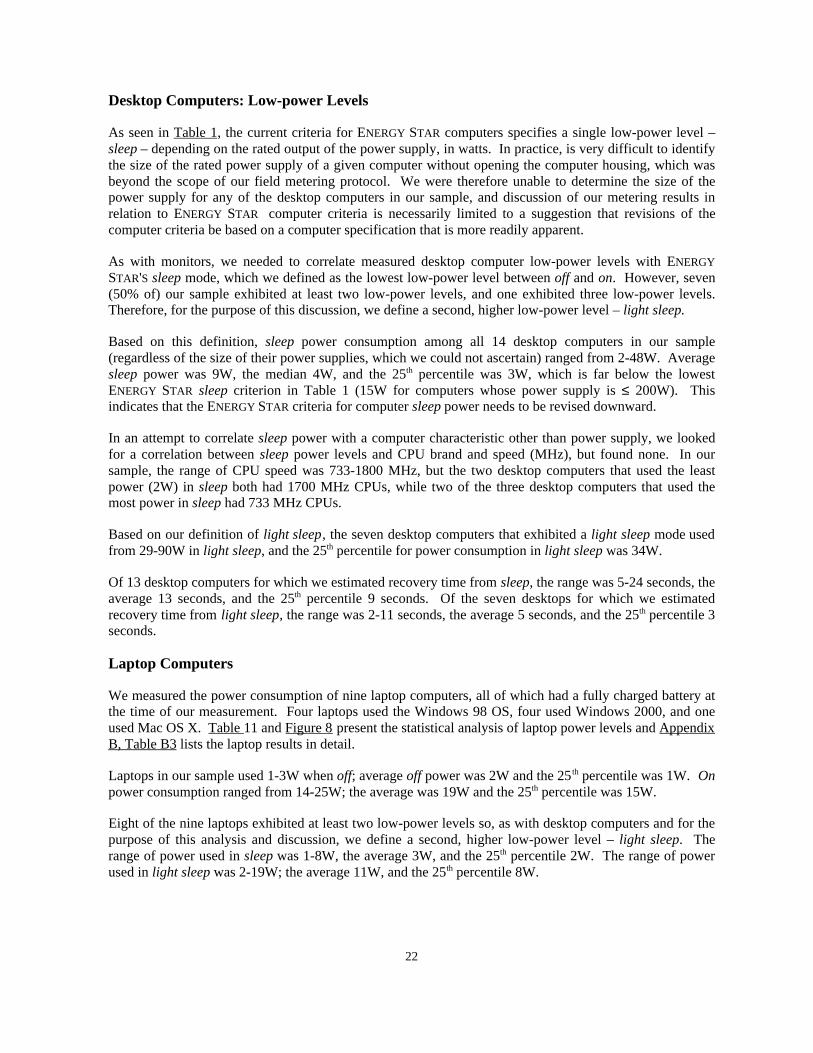
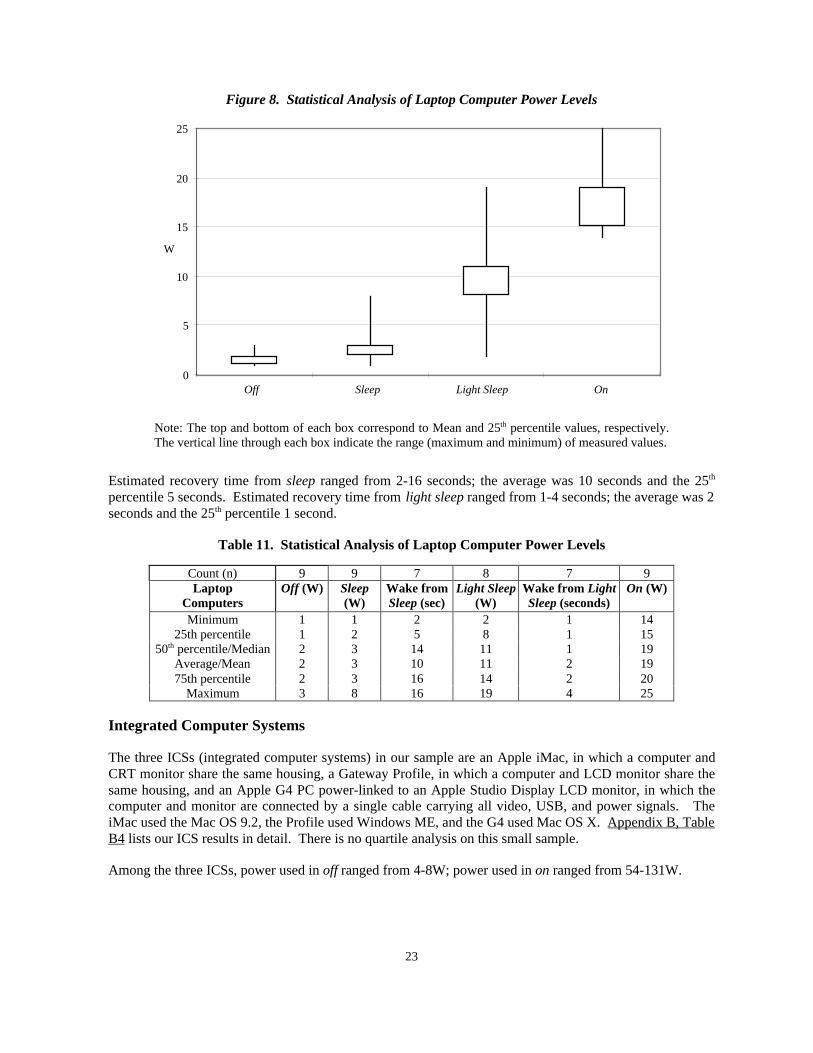
We measured the power consumption of nine laptop computers, all of which had a fully charged battery atthe time of our measurement. Four laptops used the Windows 98 OS, four used Windows 2000, and oneused Mac OS X. Table 11 and Figure 8 present the statistical analysis of laptop power levels and AppendixB, Table B3 lists the laptop results in detail.
Laptops in our sample used 1-3W when off; average off power was 2W and the 25 th percentile was 1W. Onpower consumption ranged from 14-25W; the average was 19W and the 25th percentile was 15W.
Eight of the nine laptops exhibited at least two low-power levels so, as with desktop computers and for thepurpose of this analysis and discussion, we define a second, higher low-power level – light sleep. Therange of power used in sleep was 1-8W, the average 3W, and the 25th percentile 2W. The range of powerused in light sleep was 2-19W; the average 11W, and the 25th percentile 8W.
23
Figure 8. Statistical Analysis of Laptop Computer Power Levels
Note: The top and bottom of each box correspond to Mean and 25th percentile values, respectively.The vertical line through each box indicate the range (maximum and minimum) of measured values.
Estimated recovery time from sleep ranged from 2-16 seconds; the average was 10 seconds and the 25th
percentile 5 seconds. Estimated recovery time from light sleep ranged from 1-4 seconds; the average was 2seconds and the 25th percentile 1 second.
Table 11. Statistical Analysis of Laptop Computer Power Levels
Count (n) 9 9 7 8 7 9Laptop
ComputersOff (W) Sleep
(W)Wake fromSleep (sec)
Light Sleep(W)
Wake from LightSleep (seconds)
On (W)
Minimum 1 1 2 2 1 1425th percentile 1 2 5 8 1 15
50th percentile/Median 2 3 14 11 1 19Average/Mean 2 3 10 11 2 1975th percentile 2 3 16 14 2 20
Maximum 3 8 16 19 4 25
Integrated Computer Systems
The three ICSs (integrated computer systems) in our sample are an Apple iMac, in which a computer andCRT monitor share the same housing, a Gateway Profile, in which a computer and LCD monitor share thesame housing, and an Apple G4 PC power-linked to an Apple Studio Display LCD monitor, in which thecomputer and monitor are connected by a single cable carrying all video, USB, and power signals. TheiMac used the Mac OS 9.2, the Profile used Windows ME, and the G4 used Mac OS X. Appendix B, TableB4 lists our ICS results in detail. There is no quartile analysis on this small sample.
Among the three ICSs, power used in off ranged from 4-8W; power used in on ranged from 54-131W.
0
5
10
15
20
25
Off Sleep Light Sleep On
W
24
As with desktop and laptop computers, we define sleep in ICSs as the lowest low-power level between offand on, and we also, for purposes of this analysis and discussion, define a second, higher low-power level –light sleep . The range of sleep power in ICSs was 4-31W; the range of light sleep power was 25-102W.Current criteria for ENERGY STAR integrated computer systems is that they use ≤ 35W in sleep. Based onour definition of sleep, all ICSs in our sample met the ENERGY STAR criteria. ICS recovery from sleepranged from 7-16 seconds; recovery from light sleep ranged from 1-4 seconds.
Conclusions and Future Work
Continued improvement of the ENERGY STAR Office Equipment program depends on identifying newopportunities for saving energy, which requires ongoing field measurements to supplement data reported bymanufacturers and to characterize emerging power trends as they relate to ENERGY STAR criteria.Summarized below are the primary observations resulting from our latest field measurements.
ENERGY STAR criteria have been so effective at reducing energy use by monitors and PCs that are on butidle that the energy consumed when they are off or in active use (on) has become more important in termsof contribution to the typical unit energy consumption (UEC). Current ENERGY STAR criteria do notspecify off or on power, but our results suggest opportunities for saving energy in these modes.
Monitors
Trends in the monitor market are toward larger screen sizes (because they are easier to read and can displaymore information) and LCD monitors, which (although more expensive) require less space, use less energyfor display, and recover from low-power levels more quickly than CRT monitors. Based on our sample,CRTs predominate among monitors larger than 17”, while LCDs predominate within the 15” size category.
Our results reveal a clear trend among monitor manufacturers to provide a single very low low-power level.In our sample of 35 CRTs and LCDs, both the median and the 25th percentile were 2W – well below thecurrent ENERGY STAR monitor criterion of ≤ 8W in deep sleep. Among LCD monitors, average deep sleeppower was indistinguishable from off. We suggest the current monitor criteria (which specifies two low-power levels) be revised to specify a single low-power level – sleep, which is the term used to describe thesingle low-power level in other ENERGY STAR office equipment products.
Our difficulty in measuring recovery times from low-power levels highlights the fact that – to the extentthat recovery time is considered as an element in future product criteria – the ENERGY STAR program needsto establish clear and consistent methods for measuring recovery time for any given product category.
On average, LCD monitors in our sample use 1W more when off than CRT monitors. Although 1W permonitor may seem insignificant, the cumulative impact on the UEC of this product category is not.Because the 25th percentile of off power consumption in our sample was 0W, we suggest that the revisedENERGY STAR monitor specification include a 0W off power criterion. This would provide monitormanufacturers with an incentive to install more efficient power supplies or use internal power supplies.
Regarding on power, our results confirm that LCDs consume less power per unit area than CRT monitors,but they also suggest that LCD on power consumption per unit area increases slightly with LCD size.Considering the uncertainties in our calculation of monitor display areas and the small size of our sample,the latter result is far from conclusive. We suggest that on power in LCDs merits further investigation.
25
Our difficulty in comparing on power consumption among monitors in our sample highlights the need for ametric capable of normalizing on power consumption across all monitor types and sizes. We suggest theENERGY STAR program continue to develop the proposed “pixels per watt” metric for monitor on power.
The process of resolving the discrepancy between measured and reported monitor on power revealedopportunities for improving ENERGY STAR Office Equipment program design and implementation. As aresult, the EPA is now working with researchers and manufacturers to develop standard methods for testingand reporting typical (not worst-case) power consumption of new monitors in all power modes. Whenthese procedures have been agreed upon, participating manufacturers will use them to generate reliabledata, which EPA will use to establish criteria for the revised ENERGY STAR monitor specification.
Personal Computers
Current ENERGY STAR computer criteria specify sleep power according to the power supply’s maximumcontinuous output rating, which, besides being difficult to determine, says nothing about actual power use.We suggest that revisions to the computer criteria be based on a more appropriate and identifiable metric.
When the data for all desktop computers in our sample was analyzed as a whole, the results indicate thatactual desktop computer sleep power levels are far below even the lowest ENERGY STAR sleep criteria(based on the maximum continuous output rating of the computer’s power supply), which therefore need tobe revised downward if they are to apply only to the 25% most energy-efficient models on the market.
Half of the desktop computers in our sample exhibited a second, higher low-power level. To the extent thatcomputers spend time in low-power levels other than the lowest (sleep) level, it may be worthwhile tospecify a second, higher ENERGY STAR low-power level called, for example, light sleep. We do not,however, have an estimate of the percentage of time computers spend in intermediate low-power levels.
The range of off power consumption among desktop computers in our sample was small (1-4W), and doesnot suggest a need for an off power criteria for ENERGY STAR computers. Desktop on power consumptionranged widely, but appeared to be more closely associated with processor brand than with processor speed.We suggest that the trend toward increasing desktop computer on power be investigated with regard tominimizing computer on power without affecting functionality.
Integrated computer systems exist in a variety of configurations, but as yet are relatively few in number,although we can expect that to change. All three ICSs in our sample met the ENERGY STAR ICS criteria of≤ 35W in sleep, suggesting that the current criteria may eventually need to be revised downward. Wesuggest that more data needs to be collected on this category of computers as it continues to evolve.
By necessity and design, laptops are already much more energy-efficient than their desktop counterparts.However, because the power used by laptops includes that of the display as well as the computer processor,it is more appropriate to compare laptops to integrated computer systems. The 25th percentile of sleeppower among laptops in our sample was 2W, compared to the ENERGY STAR ICS sleep criteria of ≤ 35W.We suggest laptops deserve further investigation, not as much in regard to reducing laptop power use as inapplying laptop technology to minimizing the power used by desktops and integrated computer systems.
In summary, we propose continued metering of new personal computers, both to improve the size androbustness of the sample, and to identify and evaluate the factors that affect energy use in all power modes,with the goal of identifying savings opportunities and informing revisions to the ENERGY STAR criteria.
26
References
Callwell, Chris, ECOS Consulting. 2002. Personal communication. July 8, 2002.
Callwell, Chris, and Travis Reeder. 2002. Recommended Approach to Revising Energy Star MonitorSpecification and Summary of Process to Date. ECOS Consulting. Feb 15, 2002.
EPAct. 1992. Energy Policy Act of 1992. Conference Report 102-1018 to accompany H.R. 776. USGovernment Printing Office. Washington, DC: US House of Representatives. October 5th.
Groot, M. I., and P. J. S. Siderius. 2000. Monitors Statistical Analysis: on-mode power consumption. Delft,Netherlands: Van Holsteijn en Kemna BV, on behalf of Novem BV. April.
Kawamoto, Kaoru, J. Koomey, M. Ting, B. Nordman, R.E. Brown, M. Piette, A. Meier. 2001. ElectricityUsed by Office Equipment and Network Equipment in the U.S.: Detailed Report and Appendices.LBNL-45917. Lawrence Berkeley National Laboratory, Berkeley CA. February. Available at:http://enduse.lbl.gov/Projects/InfoTech.html
Nordman, Bruce, Alan Meier, and Don Aumann. 2002. "Even Electronics Deserve a Good Night's Sleep:Toward Standard Power User Interface Elements". In Proceedings of the 2002 ACEEE SummerStudy on Energy Efficiency in Buildings (in press), American Council for an Energy EfficientEconomy, Washington, DC
Nordman, Bruce, A. Meier, and M.A. Piette. 2000. PC and Monitor Night Status: Power ManagementEnabling and Manual Turn-off. LBNL-46099. Lawrence Berkeley National Lab, Berkeley, CA.
Nordman, Bruce, Mary Ann Piette, and Kris Kinney. 1996. Measured Energy Savings and Performance ofPower-Managed Personal Computers and Monitors. LBL-38057. Lawrence Berkeley NationalLaboratory, Berkeley, CA. Available at: http://eetd.lbl.gov/EA/Reports/38057/
Nordman, Bruce, Mary Ann Piette, Kris Kinney, and Carrie Webber. 1997. User Guide to PowerManagement for PCs and Monitors. LBNL-39466. Lawrence Berkeley National Laboratory,Berkeley, CA. Available at: http://eetd.lbl.gov/EA/Reports/39466/
Roth, Kurt, Fred Goldstein, and Jonathan Kleinman. 2002. Energy Consumption by Office andTelecommunications Equipment in Commercial Buildings--Volume I: Energy ConsumptionBaseline. A.D. Little no. 72895-00. Prepared by Arthur D. Little for the U.S. Dept of Energy,Washington, DC. January. Available at: http://www.eren.doe.gov/buildings/documents
US EPA. 1999a. Computer Memorandum of Understanding (Version 3.0). U.S. Environmental ProtectionAgency, Climate Protection Partnerships Division, Washington, DC. July 1. Available at:http://estar4.energystar.gov/estar/ESPartnerLogos.nsf/PDF/Files/$File/Computer.MOU.V3.pdf
US EPA. 1999b. Monitor Memorandum of Understanding (Version 3.0). U.S. Environmental ProtectionAgency, Climate Protection Partnerships Division. July 1. Available at:http://estar4.energystar.gov/estar/espartnerlogos.nsf/PDF/Files/$File/Monitor.MOU.V3.pdf
US EPA. 2002a. Energy Star Labeled Computers and Monitors: Key Product Criteria [cited 2001].Available at: http://www.epa.gov/nrgystar/purchasing/6a_c&m.html#specs_cm

27
US EPA. 2002b. US EPA Global Warming Site [cited 2001]. Available at:http://www.epa.gov/globalwarming/
Webber, Carrie A., J.A. Roberson, R.E. Brown, C.T. Payne, B. Nordman, and J.G. Koomey. 2001. FieldSurveys of Office Equipment Operating Patterns. LBNL-46930. Lawrence Berkeley NationalLaboratory, Berkeley, CA. September. Available at: http://enduse.lbl.gov/info/LBNL-46930.pdf

28
Appendix A: Metering Protocol
General (applies to all monitors and personal computers)
After getting permission of the primary user or retailer, meter the equipment when it is not being used.Record the brand, model number, date of manufacture, and whether it exhibits an ENERGY STAR label (thisinformation is usually found on a metal nameplate on the back or underside of the equipment). In a retailsetting, record the price (with and without any discount); if in an office, inquire of its cost. For each pieceof equipment, record the number of USB ports and any devices connected to them.
Record the power state in which the equipment is found, based on the power indicator, which is usuallydark when off, green when on, and amber and/or blinking when in low power.
With the equipment on, record the PC operating system (OS) type and version (e.g., Windows 2000), aswell as any automatic power management (PM) features and settings found in the OS control panel.Restore these settings when metering is complete. Record any unusual circumstances about the equipmentor setup that could affect its power consumption or measurement.
Plug the power line meter (PLM) into an outlet and verify that the baseline power readout is zero watts; (ifit isn't zero, subtract this measurement from subsequent measurements).
Now you are ready to measure on, off, and low-power levels, using the following guidelines. Whenever theequipment enters a new power level, wait at least 15 seconds for the reading to stabilize, then observe thereadout for 30 seconds. Record the range and mode (most frequent number) to 0.1 W.
For each low-power level measured, record the following:• Whether the low-power level is activated automatically (via delay settings in the control panel) or
manually (requiring that the user select the low-power level from a menu). Low-power levels thatcan be activated either manually or automatically (e.g., "Standby" in Windows) should be initiatedand measured both ways.
• Appearance of the power indicator while the unit is in the low-power level (i.e., whether the light isgreen or amber, and whether it is flashing).
• The minimum level of action required to wake the unit up from its low-power level, tried in thissequence: mouse move, mouse click, keyboard action, or pushing a hard power button, and
• The measured time (in seconds) it takes the equipment to fully recover from the low-power level.
Monitors
In addition to the data described above, record actual screen size (measured diagonally) to the nearest inch,and the brand of desktop computer with which the monitor is being used.
If the monitor and computer are not already off, turn them both off. Plug the monitor into the PLM andmeasure monitor off power. Turn the monitor on and record monitor on power with the computer off. Turnthe computer on; during boot-up record the OS and version. When boot-up is complete and the monitordisplays the normal user-defined desktop, record monitor on power with the computer on.
In the power control panel, enable any PM options that are not already enabled (e.g., with the Windows2000 OS, "Hibernate" is enabled via a checkbox). If you aren't sure whether a given low-power levelaffects the monitor, initiate the low-power level and measure monitor power consumption to find out.

29
For each monitor low-power level, select the minimum delay setting (e.g. "1 min") so the monitorautomatically enters that low-power level as soon as possible after cessation of user activity. Wait for themonitor to enter the low-power level and measure monitor power as described above. Record theappearance of the monitor power indicator, then initiate and record the wake event and recovery time.
After measuring each automatic low-power level, initiate and measure any manual low-power level(s) (e.g.,in Windows, selecting "Suspend" from the "Start" menu). After measuring all power levels, monitormetering is complete. Restore as-found PM settings in the control panel. Turn the monitor off, unplug itfrom the PLM, and reconnect it to its power source.
Personal Computers
Record the data described above under General. If the PC is a laptop or ICS, record the actual screen size,measured diagonally, to the nearest inch. If it is an ICS, record the monitor type (CRT or LCD).
If the PC is not off, turn it off. If it is a laptop, the battery should be either fully charged, removed, ordisconnected in order to prevent the power consumption measurements from including power used torecharge the battery. Plug the PC into the PLM and measure PC off power.
Turn the PC and monitor on. During boot-up, record the OS and version, CPU make and speed (in MHz),RAM size (in MB), and hard disk size (in GB). When the desktop is displayed, record on power.
In the power control panel, enable any PM options that are not already enabled (e.g., with the Windows2000 OS, "Hibernate" is enabled via a checkbox). If you aren't sure whether a given low-power levelaffects the PC, initiate the low-power level and measure PC power consumption to find out.
For each PC low-power level, select the minimum time delay setting so the PC automatically enters thatlow-power level as soon as possible after cessation of user activity. Wait for the PC to enter the low-powerlevel and measure PC power consumption as described above under General. Record the appearance ofthe PC power indicator, then initiate and record the wake event and recovery time. Also record if the PCdoes not enter a low-power level after the specified time. As with monitors, low-power levels that can beinduced manually or automatically (e.g., "Suspend" in Windows 2000) should be initiated and measuredboth ways.
After measuring each automatic PC low-power level, initiate and measure any manual low-power level(e.g., "Suspend" from the "Start" menu). After measuring all power levels, PC metering is complete.Restore the as-found PM settings in the control panel. Turn the PC off, unplug it from the PLM, andreconnect it to its power source.
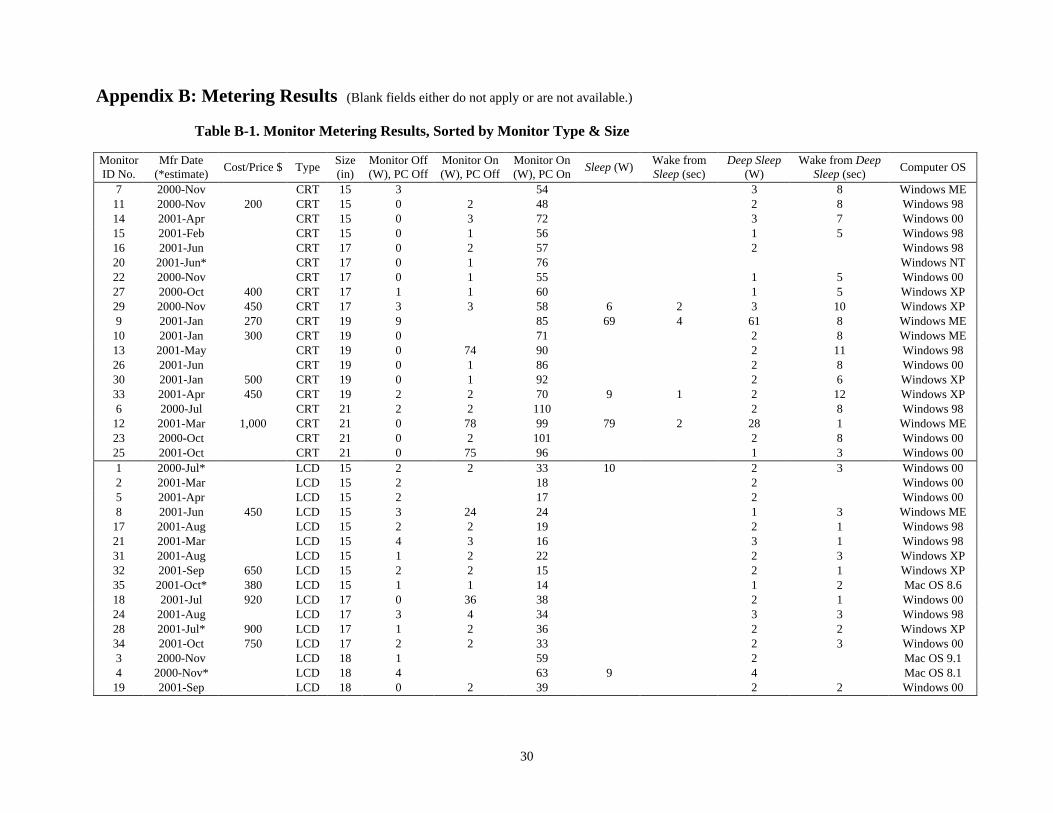
30
Appendix B: Metering Results (Blank fields either do not apply or are not available.)
Table B-1. Monitor Metering Results, Sorted by Monitor Type & Size
MonitorID No.
Mfr Date(*estimate)
Cost/Price $ TypeSize(in)
Monitor Off(W), PC Off
Monitor On(W), PC Off
Monitor On(W), PC On
Sleep (W)Wake fromSleep (sec)
Deep Sleep(W)
Wake from DeepSleep (sec)
Computer OS
7 2000-Nov CRT 15 3 54 3 8 Windows ME11 2000-Nov 200 CRT 15 0 2 48 2 8 Windows 9814 2001-Apr CRT 15 0 3 72 3 7 Windows 0015 2001-Feb CRT 15 0 1 56 1 5 Windows 9816 2001-Jun CRT 17 0 2 57 2 Windows 9820 2001-Jun* CRT 17 0 1 76 Windows NT22 2000-Nov CRT 17 0 1 55 1 5 Windows 0027 2000-Oct 400 CRT 17 1 1 60 1 5 Windows XP29 2000-Nov 450 CRT 17 3 3 58 6 2 3 10 Windows XP9 2001-Jan 270 CRT 19 9 85 69 4 61 8 Windows ME10 2001-Jan 300 CRT 19 0 71 2 8 Windows ME13 2001-May CRT 19 0 74 90 2 11 Windows 9826 2001-Jun CRT 19 0 1 86 2 8 Windows 0030 2001-Jan 500 CRT 19 0 1 92 2 6 Windows XP33 2001-Apr 450 CRT 19 2 2 70 9 1 2 12 Windows XP6 2000-Jul CRT 21 2 2 110 2 8 Windows 9812 2001-Mar 1,000 CRT 21 0 78 99 79 2 28 1 Windows ME23 2000-Oct CRT 21 0 2 101 2 8 Windows 0025 2001-Oct CRT 21 0 75 96 1 3 Windows 001 2000-Jul* LCD 15 2 2 33 10 2 3 Windows 002 2001-Mar LCD 15 2 18 2 Windows 005 2001-Apr LCD 15 2 17 2 Windows 008 2001-Jun 450 LCD 15 3 24 24 1 3 Windows ME17 2001-Aug LCD 15 2 2 19 2 1 Windows 9821 2001-Mar LCD 15 4 3 16 3 1 Windows 9831 2001-Aug LCD 15 1 2 22 2 3 Windows XP32 2001-Sep 650 LCD 15 2 2 15 2 1 Windows XP35 2001-Oct* 380 LCD 15 1 1 14 1 2 Mac OS 8.618 2001-Jul 920 LCD 17 0 36 38 2 1 Windows 0024 2001-Aug LCD 17 3 4 34 3 3 Windows 9828 2001-Jul* 900 LCD 17 1 2 36 2 2 Windows XP34 2001-Oct 750 LCD 17 2 2 33 2 3 Windows 003 2000-Nov LCD 18 1 59 2 Mac OS 9.14 2000-Nov* LCD 18 4 63 9 4 Mac OS 8.119 2001-Sep LCD 18 0 2 39 2 2 Windows 00
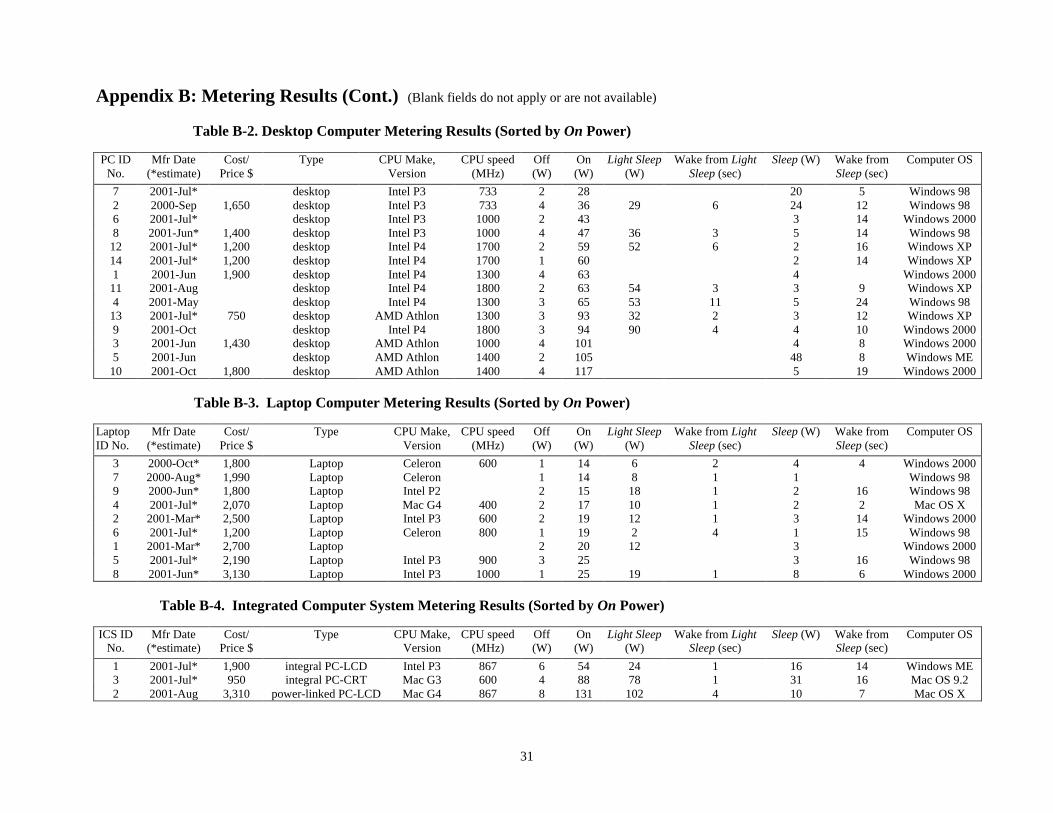
31
Appendix B: Metering Results (Cont.) (Blank fields do not apply or are not available)
Table B-2. Desktop Computer Metering Results (Sorted by On Power)
PC IDNo.
Mfr Date(*estimate)
Cost/Price $
Type CPU Make,Version
CPU speed(MHz)
Off(W)
On(W)
Light Sleep(W)
Wake from LightSleep (sec)
Sleep (W) Wake fromSleep (sec)
Computer OS
7 2001-Jul* desktop Intel P3 733 2 28 20 5 Windows 982 2000-Sep 1,650 desktop Intel P3 733 4 36 29 6 24 12 Windows 986 2001-Jul* desktop Intel P3 1000 2 43 3 14 Windows 20008 2001-Jun* 1,400 desktop Intel P3 1000 4 47 36 3 5 14 Windows 9812 2001-Jul* 1,200 desktop Intel P4 1700 2 59 52 6 2 16 Windows XP14 2001-Jul* 1,200 desktop Intel P4 1700 1 60 2 14 Windows XP1 2001-Jun 1,900 desktop Intel P4 1300 4 63 4 Windows 200011 2001-Aug desktop Intel P4 1800 2 63 54 3 3 9 Windows XP4 2001-May desktop Intel P4 1300 3 65 53 11 5 24 Windows 9813 2001-Jul* 750 desktop AMD Athlon 1300 3 93 32 2 3 12 Windows XP9 2001-Oct desktop Intel P4 1800 3 94 90 4 4 10 Windows 20003 2001-Jun 1,430 desktop AMD Athlon 1000 4 101 4 8 Windows 20005 2001-Jun desktop AMD Athlon 1400 2 105 48 8 Windows ME10 2001-Oct 1,800 desktop AMD Athlon 1400 4 117 5 19 Windows 2000
Table B-3. Laptop Computer Metering Results (Sorted by On Power)
LaptopID No.
Mfr Date(*estimate)
Cost/Price $
Type CPU Make,Version
CPU speed(MHz)
Off(W)
On(W)
Light Sleep(W)
Wake from LightSleep (sec)
Sleep (W) Wake fromSleep (sec)
Computer OS
3 2000-Oct* 1,800 Laptop Celeron 600 1 14 6 2 4 4 Windows 20007 2000-Aug* 1,990 Laptop Celeron 1 14 8 1 1 Windows 989 2000-Jun* 1,800 Laptop Intel P2 2 15 18 1 2 16 Windows 984 2001-Jul* 2,070 Laptop Mac G4 400 2 17 10 1 2 2 Mac OS X2 2001-Mar* 2,500 Laptop Intel P3 600 2 19 12 1 3 14 Windows 20006 2001-Jul* 1,200 Laptop Celeron 800 1 19 2 4 1 15 Windows 981 2001-Mar* 2,700 Laptop 2 20 12 3 Windows 20005 2001-Jul* 2,190 Laptop Intel P3 900 3 25 3 16 Windows 988 2001-Jun* 3,130 Laptop Intel P3 1000 1 25 19 1 8 6 Windows 2000
Table B-4. Integrated Computer System Metering Results (Sorted by On Power)
ICS IDNo.
Mfr Date(*estimate)
Cost/Price $
Type CPU Make,Version
CPU speed(MHz)
Off(W)
On(W)
Light Sleep(W)
Wake from LightSleep (sec)
Sleep (W) Wake fromSleep (sec)
Computer OS
1 2001-Jul* 1,900 integral PC-LCD Intel P3 867 6 54 24 1 16 14 Windows ME3 2001-Jul* 950 integral PC-CRT Mac G3 600 4 88 78 1 31 16 Mac OS 9.22 2001-Aug 3,310 power-linked PC-LCD Mac G4 867 8 131 102 4 10 7 Mac OS X
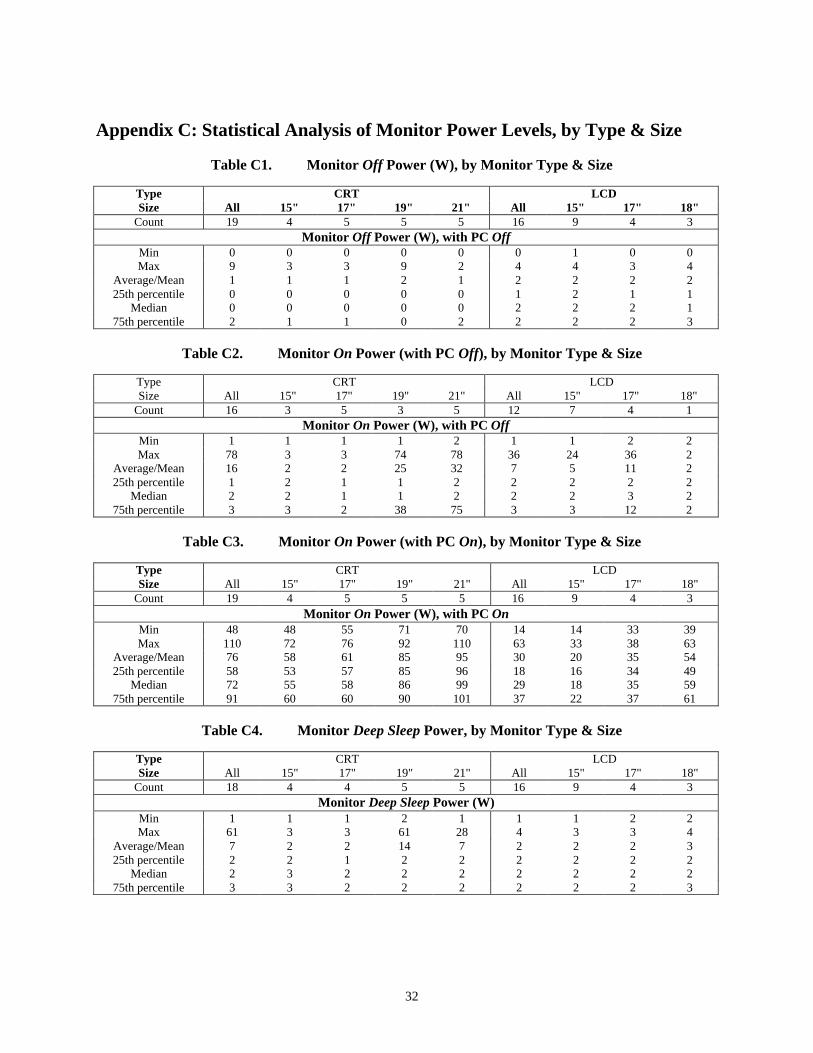
32
Appendix C: Statistical Analysis of Monitor Power Levels, by Type & Size
Table C1. Monitor Off Power (W), by Monitor Type & Size
Type CRT LCDSize All 15" 17" 19" 21" All 15" 17" 18"
Count 19 4 5 5 5 16 9 4 3Monitor Off Power (W), with PC Off
Min 0 0 0 0 0 0 1 0 0Max 9 3 3 9 2 4 4 3 4
Average/Mean 1 1 1 2 1 2 2 2 225th percentile 0 0 0 0 0 1 2 1 1
Median 0 0 0 0 0 2 2 2 175th percentile 2 1 1 0 2 2 2 2 3
Table C2. Monitor On Power (with PC Off), by Monitor Type & Size
Type CRT LCDSize All 15" 17" 19" 21" All 15" 17" 18"
Count 16 3 5 3 5 12 7 4 1Monitor On Power (W), with PC Off
Min 1 1 1 1 2 1 1 2 2Max 78 3 3 74 78 36 24 36 2
Average/Mean 16 2 2 25 32 7 5 11 225th percentile 1 2 1 1 2 2 2 2 2
Median 2 2 1 1 2 2 2 3 275th percentile 3 3 2 38 75 3 3 12 2
Table C3. Monitor On Power (with PC On), by Monitor Type & Size
Type CRT LCDSize All 15" 17" 19" 21" All 15" 17" 18"
Count 19 4 5 5 5 16 9 4 3Monitor On Power (W), with PC On
Min 48 48 55 71 70 14 14 33 39Max 110 72 76 92 110 63 33 38 63
Average/Mean 76 58 61 85 95 30 20 35 5425th percentile 58 53 57 85 96 18 16 34 49
Median 72 55 58 86 99 29 18 35 5975th percentile 91 60 60 90 101 37 22 37 61
Table C4. Monitor Deep Sleep Power, by Monitor Type & Size
Type CRT LCDSize All 15" 17" 19" 21" All 15" 17" 18"
Count 18 4 4 5 5 16 9 4 3Monitor Deep Sleep Power (W)
Min 1 1 1 2 1 1 1 2 2Max 61 3 3 61 28 4 3 3 4
Average/Mean 7 2 2 14 7 2 2 2 325th percentile 2 2 1 2 2 2 2 2 2
Median 2 3 2 2 2 2 2 2 275th percentile 3 3 2 2 2 2 2 2 3