Embed Size (px)
Citation preview

Energy Use and CO2 Emissions in
Canadian Iron and Steel and Ferro-Alloy
Manufacturing Industries
1990 to 2017
Prepared for:
Canadian Steel Producers Association
Prepared by:
Bradford Griffin
February 2019

i
Executive Summary
The Canadian Industrial Energy End-use Data and Analysis Centre (CEEDC) is part of the School
of Resource and Environmental Management at Simon Fraser University and houses extensive
energy information relevant to Canada’s industrial sectors. One of CEEDC's primary goals is to
expand and improve the information on energy use and greenhouse gas (GHG) emissions by
regularly collecting reliable data. This report for the Canadian Steel Producers Association
(CSPA) provides detailed information for the Iron and Steel Mills and Ferro Alloy Manufacturing
Industry (NAICS 3311).
This report reviews data on energy use, GHG emissions and production within the iron and steel
industry. Energy use data are gathered from several sources. The Industrial Consumption of
Energy (ICE) survey, conducted by Statistics Canada (StatCan), records the use of energy in
physical units and is considered the most reliable source for energy analysis. Data for 1991 to
1994 have not been updated to NAICS categories and, while they can be obtained from the
Report on Energy Supply and Demand (RESD), are presented for reference only.
Emissions data are calculated by multiplying the energy use of each fuel by CO2 conversion
factors obtained from Environment and Climate Change Canada. Physical production data were
historically collected by StatCan in their monthly Steel Primary Forms, Steel Castings and Pig
Iron (SPF) survey and the Disposition of Shipments of Ingots and Rolled Steel Products survey.
These series (and associated surveys) have been terminated and the data now come from the
Worldsteel Association. Economic data (GDP) are available from StatCan.
In 1990, the steel industry experienced a protracted strike which resulted in an atypical energy
and production year. Since 1990 has historically been used as the baseline, CEEDC conducted a
regression analysis to generate adjusted values that reflect those estimated by the industry.
These adjusted 1990 values are used in calculations for industry trends and intensity changes.
Activity in the iron and steel industry dropped sharply following the 2007/2008 economic
recession reaching record lows in both production and energy use in 2009. The national picture
suggests that the industry is beginning to recover, with both production and energy
consumption generally increasing since then. Overall, energy consumption has dropped 18%
from 1990 levels, and GHG (and CO2) emissions are down over 23% (and down almost 5% from
2005). Intensity indicators, then, have dropped significantly over the period; the intensity of
generating one tonne of steel (i.e., disposition data) has gone from 21 GJ/t in 1990 to just over
18 GJ/t in 2017, an improvement of 12%. This appears to be due to changes in efficiency as well
as some change in process (i.e., while the proportion of electric arc furnace (EAF) steel was
around 41% of total production up until 2010, it increased to 47% by 2017).
A provincial breakdown of data has been included for Ontario in this report. This is the first
time that CEEDC has provided data at a provincial level in the iron and steel sector. Due to the

ii
higher level of confidential data in the provincial sections of the RESD, we have had to make
more assumptions on energy use and estimate a higher number of values. Some caution should
be used when applying these estimates, but the data provided gives a good indication of the
trends for Ontario. Overall, energy use in 2017 is 14% lower than in 1990 and 11% below 2005,
while GHG emissions are 13% below 1990 and 8% below 2005. Energy and GHG intensities
based on physical production have returned to their 1990 levels after being about 10% higher
over the past few years.
While data from the Canadian steel industry have been reviewed and updated, improvement is
needed in some areas including increasing consistency in the historically reported values for
coke oven gas, and reassessing production values used in the development of the indicators.
That said, StatCan has updated RESD values to resemble data more closely from ICE. While this
process is not complete, the first indications are that the variation between RESD and ICE is
diminishing.

iii
Acknowledgments
This report is funded primarily through the support of CEEDC by the Canadian Steel Producers
Association, as well as other industry associations and government agencies such as Natural
Resources Canada and Environment and Climate Change Canada.

iv
Contents
Executive Summary .......................................................................................................................... i
Introduction .................................................................................................................................... 1
Objectives........................................................................................................................................ 1
Iron and Steel Industry .................................................................................................................... 2
Data Sources ................................................................................................................................ 2
Surveys of the Iron and Steel Industry .................................................................................... 2
Publicly Released Data ............................................................................................................. 3
Key Indicators .............................................................................................................................. 5
Performance Metrics ................................................................................................................... 5
Boundary Protocols for Intensity Comparison ........................................................................ 6
Unit Protocols: Heating Values ................................................................................................ 7
Non-Energetic Use of Fuels ..................................................................................................... 7
Production Protocols ............................................................................................................... 7
Comparisons to Other Jurisdictions ............................................................................................ 8
National Trends ............................................................................................................................... 9
Production ................................................................................................................................... 9
Limitations and Issues ........................................................................................................... 11
Energy Use and CO2 Emissions .................................................................................................. 12
Intensity Indicators .................................................................................................................... 13
Limitations and Issues ........................................................................................................... 16
Focus on Ontario ........................................................................................................................... 17
Production ................................................................................................................................. 17
Energy Use and CO2 Emissions .................................................................................................. 18
Intensity Indicators .................................................................................................................... 20
Data Issues and Solutions ............................................................................................................. 22
Summary ....................................................................................................................................... 25
Quantity and Quality of Data Available for the Canadian Steel Industry ................................. 25
Energy Use ............................................................................................................................. 25
Greenhouse Gases ................................................................................................................. 25

v
Production Data ..................................................................................................................... 26
Trends in Energy Use, Energy Intensity, and CO2 Emissions ..................................................... 26
Data Limitations and Issues ....................................................................................................... 26
References .................................................................................................................................... 28
Acronyms ...................................................................................................................................... 29
Appendices .................................................................................................................................... 30
1
Energy Use and CO2 Emissions in
Canadian Iron and Steel and Ferro-Alloy
Manufacturing Industries
1990 to 2017
Introduction
Canadian industry increasingly sees the need for accurate data on energy use. The Canadian
Energy and Emissions Data Centre (CEEDC) focuses on gathering energy and greenhouse gas
(GHG) information relevant to Canada’s industrial, residential, and transport sectors. In this
capacity, one of CEEDC's primary goals is to expand and improve the existing knowledge on
energy use through regular and timely collection of reliable data. These data can be used to:
• Reveal trends in energy use within Canada to determine the impacts of technology,
processes, or attitudes about energy;
• Compare Canadian industry performance to other jurisdictions; and
• Monitor environmental impacts of energy use in industry, such as GHG emissions.
This report, in response to increased industry interest, defines the Canadian iron and steel
industry, discusses current data sources and availability, and presents the most up-to-date
energy use and GHG data for the industry. Data limitations, conflicts, and other issues are also
highlighted and discussed.
Objectives
The objectives of this report are to:
• Demonstrate explicitly the quantity and quality of data available for the Canadian iron
and steel industry;
• Discuss trends in energy use, energy intensity performance and CO2 emissions for the
steel industry;
• Identify limitations with respect to the data and the impact they have on portraying a
consistent and accurate picture of the iron and steel industry; and
• Identify and prioritize data issues that could be used in discussion between the iron and
steel industry and data collection agencies aiming to improve quality of data.

2
Iron and Steel Industry
Since 2001, data on the steel industry have been provided according to the North American
Industry Classification System (NAICS). NAICS, which classifies establishments based on process
or economic activity, is compatible to at least the two-digit code with the International
Standard Industrial Classification (ISIC) system used by the United Nations. The number of digits
in the NAICS categories indicates the level of detail in that group. The code for the Iron and
Steel Mills and Ferro Alloy Manufacturing Industry is 3311.
NAICS 3311 comprises establishments primarily engaged in smelting iron ore and steel scrap to
produce pig iron in molten or solid form; converting pig iron into steel by the removal, through
combustion in furnaces, of the carbon in the iron. These establishments may cast ingots only, or
produce basic shapes, such as plates, sheets, strips, rods, bars and other fabricated products.
Electric arc furnace mini-mills are included, as are establishments primarily engaged in
producing ferro-alloys.1
Data Sources
Publicly available data on energy use for the Iron and Steel industry are collected by Statistics
Canada (StatCan) using a variety of surveys that are completed by selected industry
respondents and energy distribution agencies. Production data were collected by StatCan until
May 2013 and are now obtained from the Worldsteel Association. GHG emissions data are
calculated by multiplying the energy use of each fuel by Environment and Climate Change
Canada’s CO2 conversion factors as published in their annual National Inventory Report.2
Surveys of the Iron and Steel Industry
Industrial Consumption of Energy
The Industrial Consumption of Energy survey is collected annually and provides estimates of
energy use by manufacturing establishments in Canada classified to NAICS 31, 32, and 33. The
survey questionnaire is sent to selected respondents and requests data on the use of various
energy commodities such as electricity, natural gas, propane, diesel, wood and steam. The
survey also asks for information on the different usages for these commodities. In the large
energy consuming industries, the survey is a census; response levels vary from year to year and
data are imputed for non-respondents.
1 Statistics Canada, North American Industry Classification (NAICS) 2012, http://www.statcan.gc.ca/eng/subjects/standard/naics/2012/index 2 See Appendix A.

3
Coke Monthly
The Coke Monthly survey is a mandatory census survey conducted by StatCan that collects
information via monthly questionnaire from all coal coke plants in Canada on coal coke
production and disposition, and coal charged to coke ovens.
Steel Primary Forms, Steel Castings and Pig Iron
This mandatory survey measured the quantities of steel products produced and shipped by
Canadian manufacturers of steel primary forms, steel castings, and pig iron. Data on process
(e.g., electric arc vs. basic oxygen furnaces) were also obtained. Data were collected monthly
directly from survey respondents. This survey was discontinued May 2013.
Disposition of Shipments of Ingots and Rolled Steel Products
The Disposition of Shipments of Ingots and Rolled Steel Products survey measured monthly
quantities of net shipments of ingots and rolled steel products to end-use markets by Canadian
manufacturers. This was a mandatory census survey and data were collected directly from
survey respondents. This survey was discontinued May 2013.
Annual Survey of Manufacturers
The ASM (also known as the Annual Survey of Manufacturers and Logging, ASML) is a survey of
the manufacturing and logging industries in Canada intended to cover all establishments
primarily engaged in manufacturing and logging activities, as well as the sales offices and
warehouses which support these establishments. The details collected include principal
industrial statistics (such as revenue, employment, salaries and wages, cost of materials and
supplies used, cost of energy and water utility, inventories, etc.), as well as information about
the commodities produced and consumed.
Publicly Released Data
Industrial Consumption of Energy
Data from the Industrial Consumption of Energy (ICE) survey are reviewed by CEEDC and by
industry representatives prior to their public release. The previous year’s data are also updated
at this time (e.g., updated 2009 data are released with new 2010 data). Data are available on
the StatCan website.
Coal and Coke Statistics
Changes in the Coal survey and the Coke Monthly survey resulted in a new data table for 2008
and later. The old data set contained only total coke production while the new table provides
considerably more detail on coke production including the quantities of coal used.
Report on Energy Supply and Demand
Data from several surveys are compiled to form an energy balance table. Of these, data from
the ICE survey, more fine-grained than the RESD, play the most important role as far as the iron
4
and steel industries are concerned. Unfortunately, the iron and steel industry as defined in the
RESD does not match any specific NAICS definition of the industry (i.e., it is an amalgam of 3311
and part of 3312). In 2012, the RESD data for the years 2003 to 2010 were revised to
incorporate more completely data from the ICE survey.
Pig Iron and Scrap Products Charged to Furnace
Collected on the Steel Primary Forms survey, data are available for 2004 to 2012. These data
are in physical units (tonnes) and useful in understanding energy intensity of production. This
data series was discontinued May 2013.
Steel Casting and Primary Form Steel Products
The Steel Primary Forms survey provides data (2004 to 2012) on the production and shipments
of steel casting and primary forms steel products in physical units. It distinguishes between
production and shipments, electric arc and basic oxygen furnaces, and provides some data on
continuously cast steel products. These data are also useful in understanding energy intensities.
This data series was discontinued May 2013.
Steel Tubular Products and Wire
The Steel Pipe and Tubing Survey, sent monthly, measured the quantities of steel pipe and
tubular products that are produced and shipped by Canadian manufacturers. Data were
reported for 2004 to 2012. This data series was discontinued May 2013.
The Steel Wire and Specified Wire Products Survey, sent monthly, measured the quantities of
steel wire produced and shipped by Canadian manufacturers. Data were reported for 2004 to
2012. The data include information on wire fencing, nails, staples, galvanized wire, wire rope,
and all other forms of wire. This data series was discontinued May 2013.
Iron and Steel Gross Domestic Product
The ASM provides data related to economic parameters associated with the iron and steel
industry in Canada. While economic production data is less useful for understanding industry
energy or GHG intensity, these data are often used for inter-industry and international
comparisons. An industry’s GDP is equivalent to the value it adds to the national GDP (i.e., it
excludes value added by upstream industries). These data, as well as data on sales, can be used
to calculate gross output (GO), defined as the total value of goods and services produced by an
industry, a sum of its shipments including the change in value due to labour and capital
investment (i.e., it includes the value added by all upstream industries). GO is larger than GDP.
GO is an economic value preferred for analysis by StatCan. Unfortunately, GO values are
released three years after GDP values.
Since the ICE survey focuses primarily on energy, is specific to the industry definition, and is a
primary source (directly from the plants), its data are considered dependable and useful for
energy analysis. Survey and data verification procedures are designed to reflect energy issues,
5
and data on non-purchased and atypical energy forms (i.e., self-generated electricity, coal to
coke transformations, wood waste, etc.) are included.
Worldsteel Association, Steel Statistical Yearbook
StatCan collected data on production in the Iron and Steel industry until 2013. To replace these
data, CEEDC currently uses data available from the Worldsteel Association as outlined in their
annual Steel Statistical Yearbook.
Worldsteel Association obtains its data from the Canadian Steel Producers Association. Detailed
data have not been made publicly available, but those data that are available from Worldsteel
are the best available representation of production in the Canadian iron and steel industry.
Because primary production and disposition data are available, both are used in this analysis.
Greenhouse Gas Data and the National Inventory Report
By and large, GHG data are derived from energy data. However, process emissions related to
industrial production must be measured or calculated more directly. CEEDC uses information
from Environment and Climate Change Canada for process emissions and to confirm fuel-based
combustion emissions. The National Inventory Report is the official Canadian submission of
GHG data to the United Nations Framework Convention on Climate Change. Fuel-based
emissions associated with Canada’s iron and steel industries are derived from RESD tables on
energy use. In addition to this, large emitters that surpass a 50 Mt emission threshold (10 Mt
for 2017 data) must report their facility level emissions to the Greenhouse Gas Reporting
Program, where data is available for each facility (but process and combustion emissions are
combined).
Key Indicators
Two indicators, Energy Intensity and Emissions Intensity, provide an assessment of an industry’s
energy use and emissions trends. Associated with these indicators, an index provides an
understanding of trends relative to a reference year. For these, one must have available good
annual data on energy by fuel type, energy and emissions coefficients, and production data
useful for representative intensities. Additional indicators, such as Fuel Emissions Intensity
(CO2/GJ), and Energy Mix (GJ or %) can also be determined from these data.
Other indicators that help define energy and emissions intensity parameters include Industry
Structure, the ratio of electric arc furnaces to integrated mills using basic oxygen furnaces and
the Coke Rate, the ratio of coke to blast furnaces/iron produced to understand integrated mill
energy intensities.
Performance Metrics
Intensities are dependent on a number of factors that include defining plant boundaries,
process type, production unit in the denominator, energy content of fuels (i.e., fuel types and

6
heating values), state of input of raw materials, and more. Some are easy to determine (process
used) while others may be more difficult to ascertain (plant boundaries) from publications.
Boundary Protocols for Intensity Comparison
The International Energy Agency (IEA), in their publication Assessing Measures of Energy
Efficiency Performance and Their Application in Industry, underlines the importance of defining
plant boundaries in order to establish useful metrics on energy intensity (IEA, 2008). Figure 3.1
demonstrates that a simple comparison of intensities could lead to very different results (e.g.,
IEA, 2008, p 30) because the calculation of intensities is affected by the degree to which one
includes energy and supply generation facilities within the plant boundaries (coke generation,
cogeneration, oxygen production, etc.). Comparison of intensities between plants or regions
requires an understanding of how boundaries are drawn. IPCC guidelines, for example, exclude
by-product gases that leave the plant boundary as defined below, while the EU Emissions
Trading System includes these. While no absolute determination could be found in the
literature, the Asia Pacific Partnership, in their 2007 report, found it necessary to gather data in
order to prepare common boundary definitions and to solve the problems of boundaries to carry
out sector relevant benchmark and performance indicators (APP, 2007). They propose a
boundary relationship much like the large box in Figure 3.1, with GHG accounting of incoming
and outgoing energy.
Figure 1: Possible system boundaries for the Iron and Steel industry
7
Unit Protocols: Heating Values
Views on the energy content of fuels vary. Some, like StatCan, use higher heating values (HHV)
while others, like the IEA, use lower heating values (LHV). Estimates of LHV exclude the energy
lost to the vaporisation of water generated during combustion. Some industry groups in Canada
(cement and petroleum refining) also prefer to use LHV. This value can be up to 15% less than
the HHV, depending on the hydrogen content of the fuel, and assumes that the latent heat of
vaporisation cannot be captured and should not be included in the analysis. Others suggest that
a use can be found for this heat, even if it is for space heating, and so should be included.
Unfortunately, when one reads statistics on energy use, heating value, LHV or HHV, are seldom
defined.
Non-Energetic Use of Fuels
Fuels that are not used for energy purposes may or may not be identified and may or may not
be included in the energy statistics. The coking process, for example, generates products that
can be sold or used in the plant.
Production Protocols
Even when dealing with one specific industry like steel manufacturing, changes in product mix
can affect the amount of energy used independent of changes in efficiency. Thus, to develop a
true picture of intensity, we need to know both the mix of products and the energy used in
their production. While we have production data on many steel products, detailed energy data
by product are not available. Therefore, to generate a physical intensity indicator, we need a
more aggregate physical unit. As described above, data on at least two useful physical units of
output are available, production of primary forms and disposition.
• Production of Primary Forms refers to the quantity of primary steel or tonnes raw steel generated. The ASM survey form directs respondents to list pig iron, direct reduced iron, and all types of scrap, reflecting the total tonnage of steel that has been cast.3 Production serves as a good measure of overall output because it includes all steel produced domestically, and because the bulk of the energy used in making steel products occurs in the production of primary steel. It does not, however, reflect the production of actual usable steel or finished products.
• Disposition values reflect the production and distribution of final steel forms (wire, rails, heavy, intermediate and light structural steel, concrete reinforcement steel, etc.) to end-use markets. While disposition includes all finished products ready for end-use, its magnitude is considerably less than the production value of steel because “home” scrap is excluded from the disposition total. The magnitude of the “home” scrap is not known. If the goal of the indicator is to establish the energy intensity of finished steel products
3 This includes “home” scrap, all scrap from the manufacture of steel mill products, “prompt” scrap from other primary manufacturing industries, and “obsolete” scrap from discarded durables.

8
(those which leave the mill for an end use), then this could be the preferred proxy for a denominator because it assumes that energy used to recycle “home” scrap is simply part of the process in the production of steel.
An additional complication is that the ASM survey form does not determine if the goods
shipped are made of imported or domestic steel; that is, imported steel may be included in the
disposition sum. As mentioned above, each tonne of imported steel deflates the intensity value
of an indicator (the effect can be as great as 8%) because Canadian mills invested no energy in
its primary production.
Internationally, steel production is measured in several different ways. The Worldsteel
Association, for example, considers the primary unit as tonnes of liquid steel, measured when
the steel has left the ladle and enters the caster. Steel cooled in its primary form is known as
tonnes of raw steel – slabs, billets, blooms or semi-finished products; such data are gathered by
StatCan. Government agencies in the US use production of finished products. The CSPA prefers
to use shipments of finished products or disposition (similar to the United States’ definition
except for inventory differences).
Phylipsen et al., (1998) suggest two possible denominators for the iron and steel industry’s
physical intensity indicator: total steel produced (crude or raw steel) and total steel produced
(crude steel) plus the net amount of iron exported. Total steel produced is the denominator
used most often.
With international comparisons important in this highly competitive industry, one must be sure
that physical energy intensity indicators are comparable across countries. Worldsteel reports
total steel as provided by various countries including Canada. To ensure comparability, CEEDC
generates intensity indicators using both disposition and total raw steel.
Comparisons to Other Jurisdictions
The Iron and Steel Industry is one of the most important industrial activities from an energy
perspective (5% of the world’s energy demand), so it is important to consider and compare
energy intensity indicators between countries. Developing comparable indicators is difficult
because of the ways in which the industry can be aggregated (Figure 3.1). In this document, the
industry includes all processes found in the largest box of Figure 1. Thus, this assessment varies
from that used by the IEA and Worldsteel.
There are studies that compare regions, in a limited way (e.g., Kim and Worrell, 2002; IEA,
2008), but there is no single, easily accessible data source that would provide such
comparisons. The Worldsteel Association has details on steel production worldwide but little
energy data. Databases containing energy use by industry exist but are not free.

9
National Trends
This section provides detailed information about energy use, CO2 emissions, and materials
production within the Canadian iron and steel industry. Data is shown for the Iron and Steel
Mills and Ferro-Alloy Manufacturing Industry (NAICS 3311) unless indicated otherwise.
In 1990, the steel industry experienced a six-month labour disruption at its two largest plants.
Lower overall production and a higher shipment-to-production ratio led to reduced CO2
emissions and lower energy intensity indicators than in a “normal” year. To establish efficiency
and CO2 targets, the CSPA and CEEDC developed adjusted values for 1990 to normalize energy
use and CO2 emissions for this reference year. This modified value is used in our trend analyses.
For details on methods and calculation see CIEEDAC 2007, Baseline 1990 Data for the Canadian
Iron and Steel Manufacturing Industries.
Production
Industry production in monetary terms is measured by the industry’s annual contribution to
gross domestic product (GDP) and the industry’s gross output (GO). In physical terms, the iron
and steel industry’s outputs are the quantity of steel produced and the quantity of steel
shipped annually (i.e., disposition). The difference between production (primary forms) and
disposition includes the amount of stockpiled steel and the quantity of recycled steel from
within the plant included in production.
Figure 2 shows physical and monetary output measures. Physical production generally showed
steady growth to 2000 where it peaked at 16.5 million tonnes of total molten steel. After a drop
in 2001, physical production fluctuated between 15 and 16 million tonnes annually until it
showed a considerable decline in 2009 – likely impacted by the preceding economic recession –
reaching a level 36% below the adjusted 1990 level and 40% below 2005. Production levels
increased in 2010, but physical production of molten steel has remained relatively flat since
then; production of primary forms in 2017 was 6% below 1990 adjusted levels and 11% below
2005.

10
Figure 2: Output measures for the Iron and Steel industry
Source: StatCan and Worldsteel.
GDP fluctuates over the period, showing a steady increase to 2007 when it was 18% above 1990
before falling dramatically in 2009. After recovering from this decline, GDP in 2017 is 10%
below 1990 levels and 23% below 2005.
CEEDC reviewed production data in terms of primary forms and disposition and determined
that the quantity of primary forms was always slightly higher than disposition (see Table 1).
Over the period, some discrepancies are observed; for example, in 2008, disposition matched
production, likely due to little or no stockpiling of steel made in the previous year.
Table 1: Steel production and disposition
kt 1990 1995 2000 2005 2010 2014 2015 2016 2017
Steel, primary forms 14,531 14,414 16,597 15,327 13,003 12,730 12,473 12,646 13,614
Steel, disposition 12,696 13,349 14,865 14,197 12,423 11,984 11,954 11,977 11,860
Ratio D/P 87% 93% 90% 93% 96% 94% 96% 95% 87%
Note: Calculated 1990 adjusted values shown in italics. Source: StatCan and Worldsteel.

11
Figure 3 illustrates the variations in the disposition to production ratio over time.
Figure 3: Ratio of steel disposition to production
Note: Calculated adjusted values shown for 1990. Source: StatCan and Worldsteel.
Limitations and Issues
A review of the values presented here with StatCan and CSPA produced the following
assessment:
1. Canadian plants provide data on tonnes of raw steel (TRS); production values reflect the
tonnes of metal cast. This is typically about 1% less than tonnes of liquid steel (TLS) (i.e.,
a 1% loss occurs in the process of pouring and forming the castings). TLS is not
measured or reported.
2. The processing of primary steel forms (TRS) at a mill to generate finished products for
disposition generates scrap material that is recycled, or “home scrap”. Table 1 presents
the ratio of disposition of finished products to production of primary forms. In StatCan’s
assessment, such recycling does occur and could account for the difference. This
assessment was corroborated by CSPA, but they too were unable to verify the
percentage differences. Dr. Ernst Worrell of Utrecht University further supported this
hypothesis, indicating that there is an approximately 8% difference between total crude
steel production and total steel production (shipments minus change in stocks) due to
the use of home scrap in the casting and rolling process and the loss of the carbon in pig
iron.
3. The role of imported steel in the disposition values of Table 1 is not confirmed. Our goal
in this report is to use a denominator for intensity that is related to energy used (i.e.,

12
how much energy was used to make how much steel). It seems unlikely that imports are
included with the production data, but they find their way into disposition data.
4. Product trade between firms within Canada and the U.S. may influence our data. A firm
may ship a semi-finished product to another firm for finishing or may even ship a
product out for processing only to have it come back for a final step. However, since
only one firm will report this as a final product double counting is unlikely.
Energy Use and CO2 Emissions
National trends in energy use for this report are developed using ICE data – considered most
reliable and used wherever available – supplemented by data from the RESD and ASM. CO2
emissions were calculated by multiplying the energy use of each fuel by the fuel’s CO2
conversion factor, obtained from Environment and Climate Change Canada. CEEDC has
estimated suppressed energy values based on assumptions related to the consistency of
historical fuel shares and the balance of fuels over the whole of the primary metals industry.
Figure 4 shows the total energy use and CO2 emissions for the iron and steel industry. Data for
1991 to 1994 have not been updated to reflect the NAICS format and are omitted from this
report. Note from the figure that both energy use and CO2 emissions follow a similar pattern
indicating the degree to which emissions are tied to fuel use.
Figure 4: Energy Use and CO2 Emissions
Note: CO2 emissions from coke use are presented here as fuel combustion (StatCan convention) but use the emission factor from the ECCC NIR to be consistent with total emissions. Source: StatCan; ECCC; CEEDC estimates of suppressed energy values.
13
All the sudden decreases in energy and emissions (1990, 2001, and 2009) are related to
declines in production. As previously discussed, an industry strike was responsible for the
decrease in 1990. Economic conditions were responsible for the 2001 and 2009 decreases.
Since 2009, energy consumption and emissions have been rising, albeit inconsistently.
Nevertheless, in 2017 energy consumption remains 7% below 2005 levels, while GHG emissions
are 5% below 2005.
Different surveys use different criteria in the collection of energy data, especially as it relates to
how fuels are used (as feedstock or fuel) and energy content of fuels whether purchased or
self-generated. The iron and steel industry produces some of its own fuel when it takes coking
coal and generates coke from it for use in blast furnaces. In the conversion process, some by-
products are made and sold, and coke oven gas is generated and used throughout the plant as
a fuel alternative. The coke is used to reduce iron oxides to iron and is considered by some a
feedstock and by others a fuel.4 Because of the dominance of coke and coke oven gas in the
process, these issues have some impact on the calculation of energy use and emissions
generation, as well as energy and emissions intensity indicators.
Intensity Indicators
Data on energy use, CO2 emissions, and production are used by CEEDC to calculate intensity
ratios (energy or emissions over output). These ratios indicate general trends useful to monitor
progress in efficiency, identify market trends and efficiency improvement opportunities, do
cross-country comparisons, and provide a basis for energy-focused policies and regulations.5
Two types of intensity indicators can be generated from the available data:
1. An indicator based on production measured in monetary terms (i.e., GDP or GO), is known as economic intensity. Because monetary data tend to be readily available in most countries that collect data on industry, this is the more common of the international indicators; and
2. An indicator using physical units in the denominator generates a physical intensity indicator. Because there is a strong link between making a unit of product and the energy required in its manufacture, this is the preferred measure.
4 Environment and Climate Change Canada follows United Nations Framework Convention on Climate Change good practice guidelines and assumes a value for coking coal as a feedstock that considers the carbon content of both the iron ore and the resultant pig iron after reduction of iron oxide has occurred. StatCan, however, considers coke inputs a fuel. 5 Intensity is the inverse of efficiency. Intensity refers to the amount of energy required to make a product (e.g. Energy/Product), while efficiency refers to the amount of product one can make with a unit of energy (e.g. Product/Energy). That said, in much of the literature, references to efficiency are equated with intensity.

14
Indicators based on physical rather than monetary units tend to be a better proxy for
technological or process innovations; monetary units are affected by many factors not
associated with energy, such as labour costs or selling price of the product.6
Energy and CO2 intensity indicators are presented in Figure 5 and Figure 7. Intensity indicators,
obtained by dividing energy use and CO2 emissions by the various output measures, are shown
as indices (normalized to the adjusted 1990 data). Using an index helps to demonstrate changes
from a baseline.
Figure 5: Energy intensity indicators
Note: Calculated adjusted values shown for 1990. Source: StatCan; Worldsteel; CEEDC estimates of suppressed energy values.
Energy per tonne of disposed steel decreased from 1990 to its lowest point in 2002, fluctuating
thereafter around 78% of the adjusted 1990 value. After an anomalous spike in 2009 (energy
use diminished but not nearly as much as production), intensity based on disposed steel has
averaged 84% of the adjusted 1990 value. Recent analysis by researchers at NRCan's Office of
Energy Efficiency shows that the spike in 2009 was due to decreased capacity utilization; plants
were still running and technologies, such as coke ovens and blast furnaces, remained active to
maintain functionality even though less iron was produced.7
6 See CIEEDAC (1993) for more information on the issues of physical versus monetary units for calculating intensity indicators and on CEEDC's recommendations of appropriate units. 7 Research was completed by Michael Warbanski (OEE, NRCan) and supported by comments from Andy Mahut (U.S. Steel Canada, Inc.).
15
Indicators based on GDP show the same general trend. The lowest Energy/GDP intensity occurs
in 2002 after which the index has had a general upwards trend reaching in 2017 to 9% below
1990.
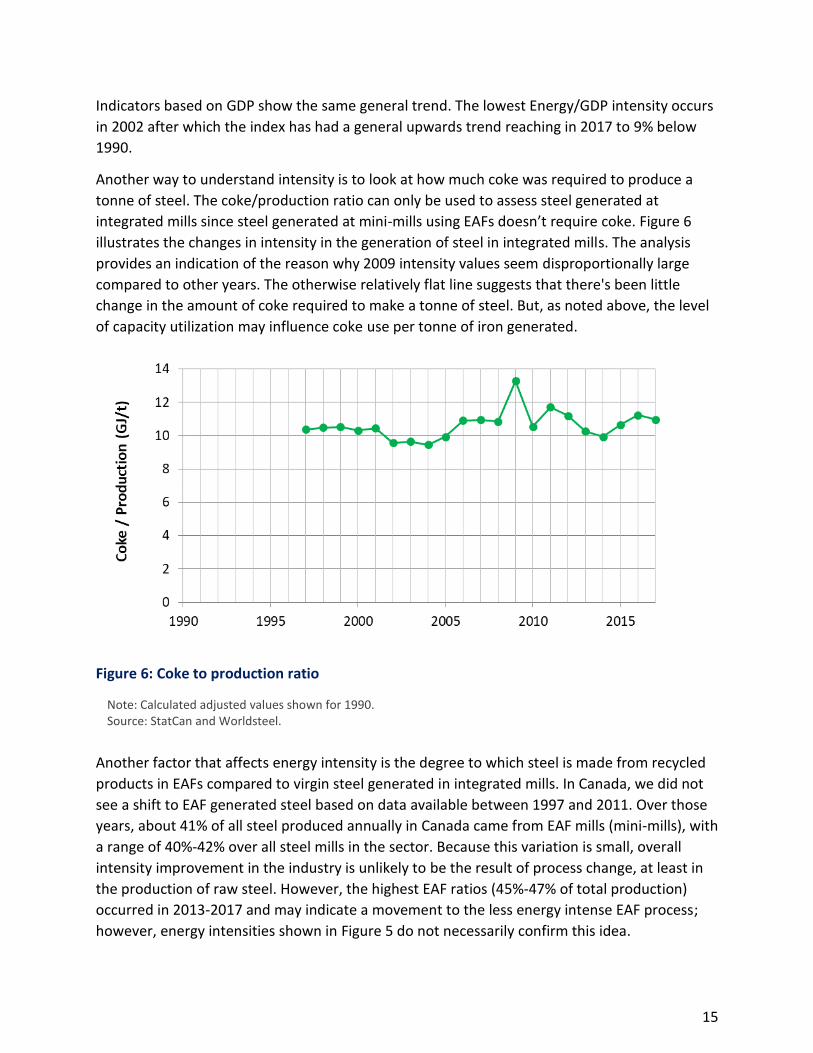
Another way to understand intensity is to look at how much coke was required to produce a
tonne of steel. The coke/production ratio can only be used to assess steel generated at
integrated mills since steel generated at mini-mills using EAFs doesn’t require coke. Figure 6
illustrates the changes in intensity in the generation of steel in integrated mills. The analysis
provides an indication of the reason why 2009 intensity values seem disproportionally large
compared to other years. The otherwise relatively flat line suggests that there's been little
change in the amount of coke required to make a tonne of steel. But, as noted above, the level
of capacity utilization may influence coke use per tonne of iron generated.
Figure 6: Coke to production ratio
Note: Calculated adjusted values shown for 1990. Source: StatCan and Worldsteel.
Another factor that affects energy intensity is the degree to which steel is made from recycled
products in EAFs compared to virgin steel generated in integrated mills. In Canada, we did not
see a shift to EAF generated steel based on data available between 1997 and 2011. Over those
years, about 41% of all steel produced annually in Canada came from EAF mills (mini-mills), with
a range of 40%-42% over all steel mills in the sector. Because this variation is small, overall
intensity improvement in the industry is unlikely to be the result of process change, at least in
the production of raw steel. However, the highest EAF ratios (45%-47% of total production)
occurred in 2013-2017 and may indicate a movement to the less energy intense EAF process;
however, energy intensities shown in Figure 5 do not necessarily confirm this idea.

16
Data in Figure 7 indicate that CO2 intensity indicators follow trends similar to the energy
intensity indicators. Note that the amount of CO2 generated per unit of energy used is slightly
lower than in 1990. Because some energy data are confidential (coal, HFO, natural gas, and
petcoke are confidential for most recent years), the total CO2 value for years with confidential
data are estimated.
Figure 7: CO2 intensity indicators
Note: Calculated adjusted values shown for 1990. Source: StatCan; Worldsteel; ECCC; CEEDC estimates of suppressed energy values.
Limitations and Issues
1. The physical energy intensity indicators using StatCan’s 1990 values were compared to
indicators based on the industry adjusted 1990 value from CEEDC 2007 (the report in
which the adjusted values were reviewed and updated). While trend lines show
approximately the same pattern, the change in physical energy intensity over time using
adjusted values is larger than the reduction in intensity using the ICE 1990 data. The
indicators based on production values are nearly identical, showing the same trend. The
economic indicators show also similar trends but do not track each other as well. The
adjusted CO2 intensity indicators follow the same trends as the energy intensity
indicators.
In other words, using the adjusted 1990 values not only changes the reference year
value but indicates more improvement from the reference year. This is appropriate for

17
our analysis since we are trying to estimate the changes in the industry from typical
operations in 1990.
2. As noted above, estimates of GHG emissions are determined by analyzing the
confidential numbers for energy in the context of the whole primary metal smelting
industry. We advise caution in the reliability of these values since the uncertainty of the
estimations can be high.
Focus on Ontario
This section provides detailed information about energy use, CO2 emissions, and materials
production within the Ontario iron and steel industry. Ontario has the majority of iron and steel
mills in Canada and represents over 80% of the total energy use for this sector. Data is shown
for the Iron and Steel Mills and Ferro-Alloy Manufacturing Industry (NAICS 3311) unless
indicated otherwise.
As noted above in the “National Trends” section, the CSPA and CEEDC developed adjusted
values for 1990 to normalize energy use and CO2 emissions for this reference year; a labour
disruption in 1990 led to lower the usual energy intensity indicators. The national adjusted
values have been scaled in this section to represent the energy and emissions for Ontario.
Scaling is based on the GDP values for Ontario and Canada since physical production values are
not available at the provincial level.
Production
Industry production in monetary terms is measured by the industry’s annual contribution to
gross domestic product (GDP). In physical terms, the iron and steel industry’s outputs are the
quantity of steel produced and the quantity of steel shipped annually (i.e., disposition). The
difference between production (primary forms) and disposition includes the amount of
stockpiled steel and the quantity of recycled steel from within the plant included in production.
Figure 8 shows representative physical and monetary output measures for Ontario. GDP
fluctuates over the period before falling dramatically in 2009. After recovering from this
decline, GDP in 2017 is 18% below 1990 levels and 26% below 2005.
Physical production is based on Ontario’s share of the iron and steel industry’s GDP each year
applied to the national production (i.e. Ontario’s GDP for the sector divided by Canada’s GDP
for the sector multiplied by the physical output). After a considerable decline in 2009 – likely
impacted by the preceding economic recession – production levels increased in 2010, but
physical production of molten steel has remained relatively flat since then. Production of
primary forms in 2017 was 14% below 1990 adjusted levels and 15% below 2005.

18
Figure 8: Output measures for the Ontario Iron and Steel industry
Source: StatCan and Worldsteel.
Energy Use and CO2 Emissions
Provincial trends in energy use for this report are developed using RESD data and
supplemented by data from the ICE (only available at the national level) and ASM surveys. CO2
emissions were calculated by multiplying the energy use of each fuel by the fuel’s CO2
conversion factor, obtained from Environment and Climate Change Canada. CEEDC has
estimated suppressed energy values based on assumptions related to the consistency of
historical fuel shares and the balance of fuels over the whole of the primary metals industry.
Figure 9 shows the total energy use and CO2 emissions for the iron and steel industry. Note
from the figure that both energy use and CO2 emissions follow a similar pattern indicating the
degree to which emissions are tied to fuel use. Data for 1995 to 2004 and 2006 to 2009 have
not yet been updated but will be included in future reports.

19
Figure 9: Ontario Energy Use and CO2 Emissions
Note: CO2 emissions from coke use are presented here as fuel combustion (StatCan convention) but use the emission factor from the ECCC NIR to be consistent with total emissions. Data for 1995 to 2009 have not yet been updated but will be included in future reports. Source: StatCan; ECCC; CEEDC estimates of suppressed energy values.
In 2017, energy consumption remains 11% below the 2005 level, while total GHG emissions are
8% below 2005.
Different surveys use different criteria in the collection of energy data, especially as it relates to
how fuels are used (as feedstock or fuel) and energy content of fuels whether purchased or
self-generated. The iron and steel industry produces some of its own fuel when it takes coking
coal and generates coke from it for use in blast furnaces. In the conversion process, some by-
products are made and sold, and coke oven gas is generated and used throughout the plant as
a fuel alternative. The coke is used to reduce iron oxides to iron and is considered by some a
feedstock and by others a fuel.8 Because of the dominance of coke and coke oven gas in the
process, these issues have some impact on the calculation of energy use and emissions
generation, as well as energy and emissions intensity indicators.
8 Environment and Climate Change Canada follows United Nations Framework Convention on Climate Change good practice guidelines and assumes a value for coking coal as a feedstock that considers the carbon content of both the iron ore and the resultant pig iron after reduction of iron oxide has occurred. StatCan, however, considers coke inputs a fuel.
20
Intensity Indicators
Data on energy use, CO2 emissions, and production are used by CEEDC to calculate intensity
ratios (energy or emissions over output). These ratios indicate general trends useful to monitor
progress in efficiency, identify market trends and efficiency improvement opportunities, cross-
country comparisons, and provide a basis for energy-focused policies and regulations.9
Indicators based on physical rather than monetary units tend to be a better proxy for
technological or process innovations; monetary units are affected by many factors not
associated with energy, such as labour costs or selling price of the product. The physical
production presented here for Ontario is based on the provincial share of national GDP for the
sector. Any provincial differences in changes to labour costs or product inputs could affect the
reliability of these physical production estimates.
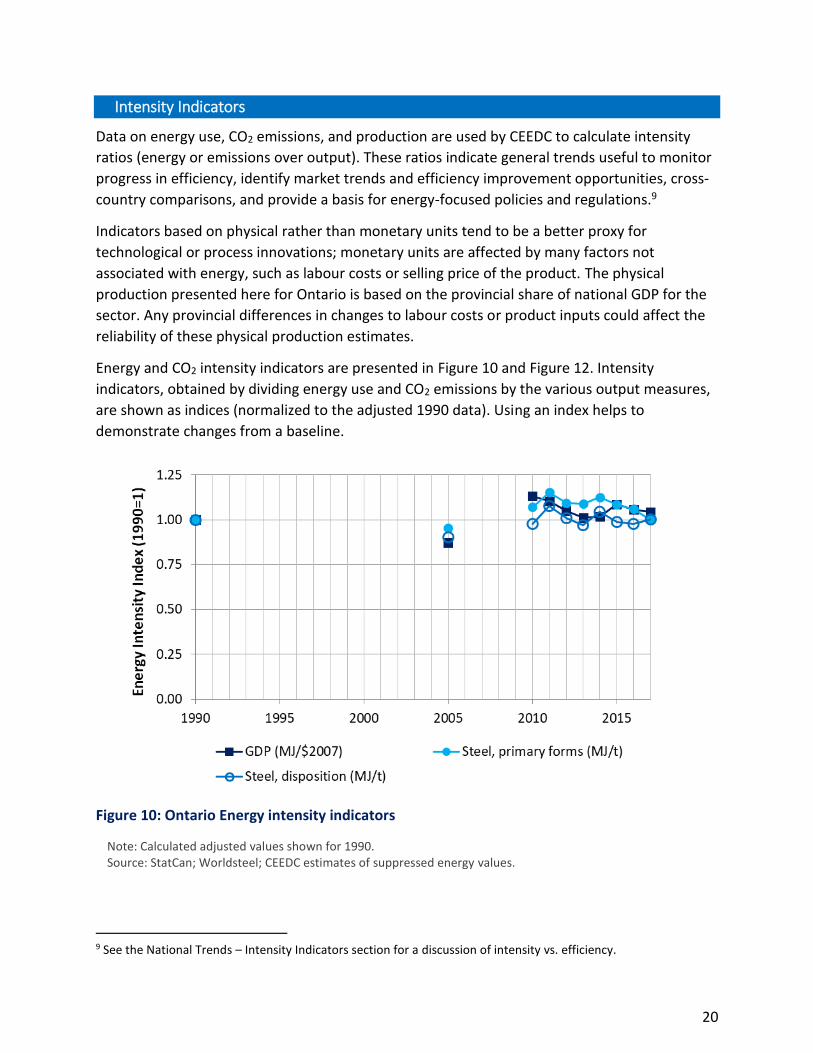
Energy and CO2 intensity indicators are presented in Figure 10 and Figure 12. Intensity
indicators, obtained by dividing energy use and CO2 emissions by the various output measures,
are shown as indices (normalized to the adjusted 1990 data). Using an index helps to
demonstrate changes from a baseline.
Figure 10: Ontario Energy intensity indicators
Note: Calculated adjusted values shown for 1990. Source: StatCan; Worldsteel; CEEDC estimates of suppressed energy values.
9 See the National Trends – Intensity Indicators section for a discussion of intensity vs. efficiency.
21
Energy per tonne of steel produced and disposed has remained relatively flat over the past few
years. Compared to the national average, where energy intensity has decreased to 80%-90% of
its 1990 value, the values for Ontario remain very close to their 1990 values after being 10%
above for the past few years. This could be due to the geographical distribution of basic oxygen
furnaces (for primary steel production) and electric arc furnaces (used primarily for recycled
steel production). The indicator based on GDP shows the same general trend.
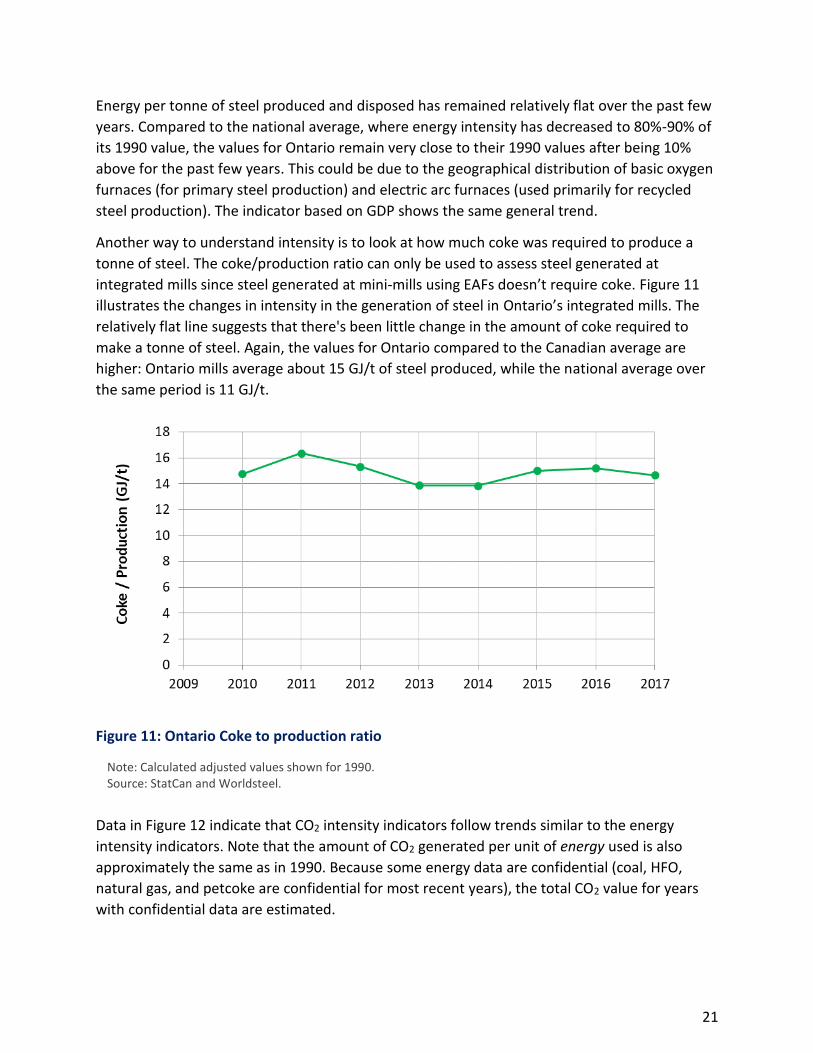
Another way to understand intensity is to look at how much coke was required to produce a
tonne of steel. The coke/production ratio can only be used to assess steel generated at
integrated mills since steel generated at mini-mills using EAFs doesn’t require coke. Figure 11
illustrates the changes in intensity in the generation of steel in Ontario’s integrated mills. The
relatively flat line suggests that there's been little change in the amount of coke required to
make a tonne of steel. Again, the values for Ontario compared to the Canadian average are
higher: Ontario mills average about 15 GJ/t of steel produced, while the national average over
the same period is 11 GJ/t.
Figure 11: Ontario Coke to production ratio
Note: Calculated adjusted values shown for 1990. Source: StatCan and Worldsteel.
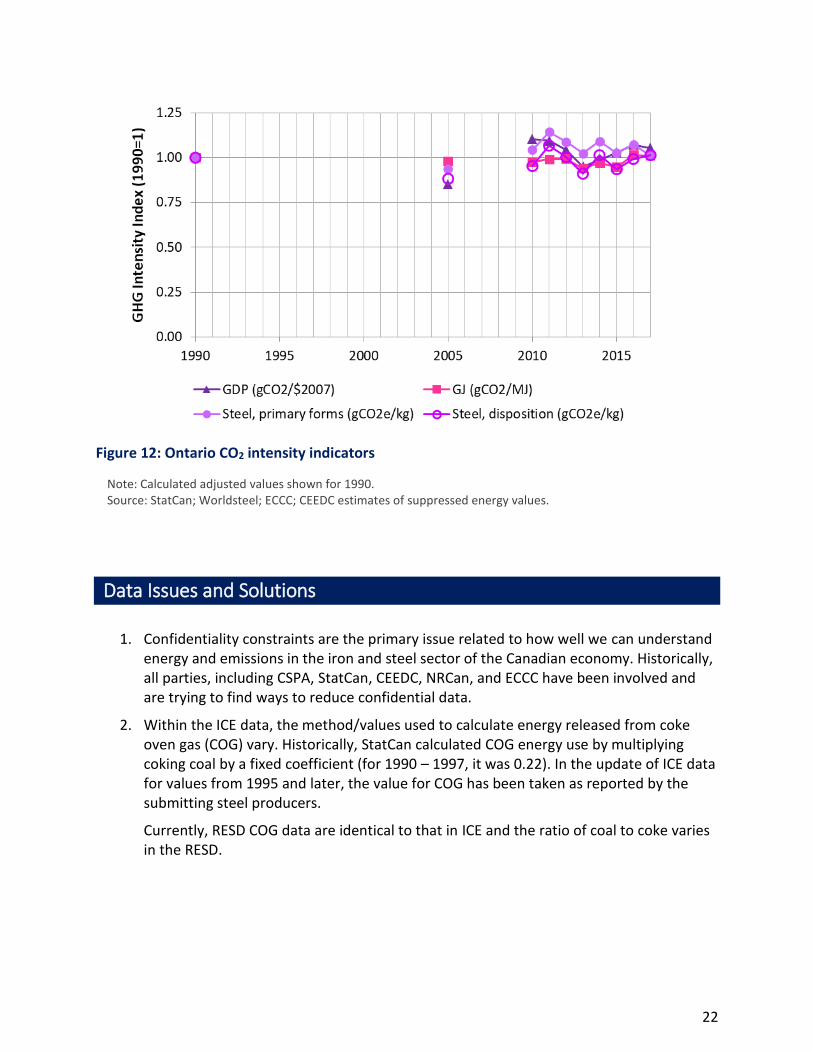
Data in Figure 12 indicate that CO2 intensity indicators follow trends similar to the energy
intensity indicators. Note that the amount of CO2 generated per unit of energy used is also
approximately the same as in 1990. Because some energy data are confidential (coal, HFO,
natural gas, and petcoke are confidential for most recent years), the total CO2 value for years
with confidential data are estimated.
22
Figure 12: Ontario CO2 intensity indicators
Note: Calculated adjusted values shown for 1990. Source: StatCan; Worldsteel; ECCC; CEEDC estimates of suppressed energy values.
Data Issues and Solutions
1. Confidentiality constraints are the primary issue related to how well we can understand energy and emissions in the iron and steel sector of the Canadian economy. Historically, all parties, including CSPA, StatCan, CEEDC, NRCan, and ECCC have been involved and are trying to find ways to reduce confidential data.
2. Within the ICE data, the method/values used to calculate energy released from coke oven gas (COG) vary. Historically, StatCan calculated COG energy use by multiplying coking coal by a fixed coefficient (for 1990 – 1997, it was 0.22). In the update of ICE data for values from 1995 and later, the value for COG has been taken as reported by the submitting steel producers.
Currently, RESD COG data are identical to that in ICE and the ratio of coal to coke varies in the RESD.
23
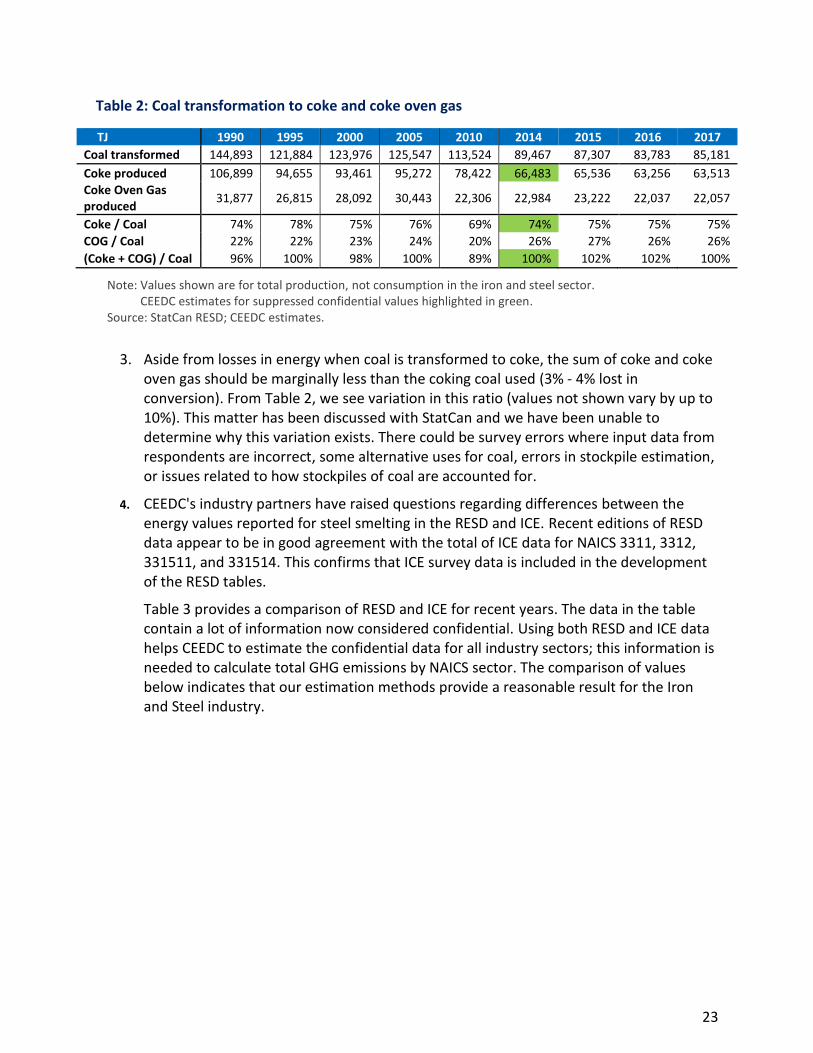
Table 2: Coal transformation to coke and coke oven gas
TJ 1990 1995 2000 2005 2010 2014 2015 2016 2017
Coal transformed 144,893 121,884 123,976 125,547 113,524 89,467 87,307 83,783 85,181
Coke produced 106,899 94,655 93,461 95,272 78,422 66,483 65,536 63,256 63,513
Coke Oven Gas produced
31,877 26,815 28,092 30,443 22,306 22,984 23,222 22,037 22,057
Coke / Coal 74% 78% 75% 76% 69% 74% 75% 75% 75%
COG / Coal 22% 22% 23% 24% 20% 26% 27% 26% 26%
(Coke + COG) / Coal 96% 100% 98% 100% 89% 100% 102% 102% 100%
Note: Values shown are for total production, not consumption in the iron and steel sector. CEEDC estimates for suppressed confidential values highlighted in green. Source: StatCan RESD; CEEDC estimates.
3. Aside from losses in energy when coal is transformed to coke, the sum of coke and coke oven gas should be marginally less than the coking coal used (3% - 4% lost in conversion). From Table 2, we see variation in this ratio (values not shown vary by up to 10%). This matter has been discussed with StatCan and we have been unable to determine why this variation exists. There could be survey errors where input data from respondents are incorrect, some alternative uses for coal, errors in stockpile estimation, or issues related to how stockpiles of coal are accounted for.
4. CEEDC's industry partners have raised questions regarding differences between the energy values reported for steel smelting in the RESD and ICE. Recent editions of RESD data appear to be in good agreement with the total of ICE data for NAICS 3311, 3312, 331511, and 331514. This confirms that ICE survey data is included in the development of the RESD tables.
Table 3 provides a comparison of RESD and ICE for recent years. The data in the table contain a lot of information now considered confidential. Using both RESD and ICE data helps CEEDC to estimate the confidential data for all industry sectors; this information is needed to calculate total GHG emissions by NAICS sector. The comparison of values below indicates that our estimation methods provide a reasonable result for the Iron and Steel industry.

24
Table 3: Comparison of RESD and ICE data for Iron and Steel
2015 2016 2017
TJ RESD ICE RESD ICE RESD ICE
Coal 12,802 13,102 12,408 12,584 14,500 14,736
Coke 71,677 71,537 78,945 78,812 79,808 79,735
Coke Oven Gas 21,181 21,181 19,994 19,994 19,744 19,744
Petcoke 203 105 237 326 200 147
Natural Gas 78,699 73,507 76,600 71,631 79,610 73,510
Electricity 32,303 29,111 31,762 28,984 31,926 28,191
Middles Distillates 595 754 947 869 750 799
Heavy Fuel Oil 305 521 167 117 550 568
Propane 300 4 171 6 168 5
Wood 0 0 0
Total 218,064 209,805 221,230 213,324 227,256 217,435
Confidential 92,903 87,217 122,291 84,659 95,778 88,961
Note: RESD data is for “Iron and Steel”; ICE data includes NAICS 3311, 3312, 331511, and 331514. Shaded cells are considered confidential and show CEEDC estimates. Source: StatCan RESD and ICE; CEEDC estimates.
5. There are issues related to the assessment of GHGs for the industry that require resolution. These issues include the estimation of process emissions in the production of lime, carbon content of pig iron and steel, and allocation of emissions related to cogenerated electricity. Through a discussion between stakeholders, these issues are currently being reviewed.
25
Summary
Quantity and Quality of Data Available for the Canadian Steel Industry
Energy Use
Statistics Canada (StatCan) records the use of energy from two separate sources, of which only
one, the Industrial Consumption of Energy (ICE) survey, provides specific detail on energy use in
physical units. The other source is the Annual Survey of Manufacturers (ASM), which provides
data on energy expenditures, is used minimally in this report.
Relatively good records of use in this industry exist from a unified data set going back to the
mid-1970s from the RESD. Unfortunately, the methodologies used to develop RESD and ICE
data sets were not the same: RESD is an amalgamation of data obtained from a number of
surveys whereas the ICE data are gathered from one survey and the RESD industry boundaries
are different than those in ICE. StatCan has aligned ICE and RESD data for all industries such
that there is far less difference in their values now (once sector boundaries are considered).
To further complicate the issue, the methodologies for obtaining the values for these two data
sets also vary. RESD numbers are primarily tabulations of respondents to the ICE survey.10
However, ICE uses a method known as cut-off sampling, where very small sample units are
estimated based on shipments from the ASM and this adjustment increases the ICE estimate
without affecting the RESD estimate. Additionally, the adjustment is not applied to coal, coal
coke, petroleum coke, and coke oven gas which results in higher estimates for natural gas and
heavy fuel oil in ICE estimates than in the RESD (Grenier, personal communication, 2000). This
report uses ICE data supplemented by RESD data.
Greenhouse Gases
Environment and Climate Change Canada (ECCC) publishes its National Inventory Report
annually. This publication provides data on process emissions, as well as coefficients that can be
used to determine CO2, CH4, and N2O emissions based on fuel use. The coefficients are defined
in Appendix A and GHG specific data can be found in Appendix B.
There are several issues related to the analysis of GHG emissions. These include the
definition/handling of process vs. fuel-based GHG emissions, the degree to which the energy
(and estimated GHG) data are considered confidential, the role of electricity production in the
industry, and difference in levels of energy use. These issues are addressed below under the
appropriate sections.
10 The exceptions are electricity, where supplier data from the Electricity Supply/Disposition Quarterly are used, and middle distillates, where supplier data from the Quarterly End-Use of Refined Petroleum Products are used.

26
Production Data
Data on production of steel come from several sources and are of two types: physical and
monetary. The Annual Survey of Manufacturers (and its monthly corollary, the Monthly Survey
of Manufacturers) provides monetary data including Gross Domestic Product (GDP). These GDP
data, along with data on cost of materials, labour, energy, and other economic indicators, are
used to generate Gross Output (GO) values for the industry. GO is roughly equivalent to the
value of shipments and includes the value added as well as the value of inputs to production.
Unfortunately, StatCan only publishes GO values three years after GDP data.
Physical production data were previously collected by StatCan in a number of different surveys,
all of which were terminated in 2013. Data are now obtained from the Canadian Steel
Producers Association through the Worldsteel Association. The protocols used to collect these
production data mirror the standards set by StatCan to ensure a consistent, robust data series.
Trends in Energy Use, Energy Intensity, and CO2 Emissions
Total energy use and associated emissions in 2017 are around 80% of what they were in 1990.
GDP and physical intensity indicators, which spiked in 2009 due to the economic slowdown,
have returned to typical levels and are 15% lower than they were in 1990 (adjusted). Carbon
intensity of the total fuel has not really changed much in the last 20 years.
A number of points about the energy use, CO2 emissions, and intensities in the Canadian steel
industry are worth discussing.
1. The energy and CO2 curves in Figure 4 track each other closely, suggesting that the lower CO2 intensity of production in this industry is due to overall efficiency improvements with little or no fuel switching (GHG intensity of the fuels has changed little).
2. Coke to production ratios can help to illustrate the efficiency of integrated mills. Based on this simple ratio of coke/production, efficiency changes have been minimal.
3. While large fluctuations are evident, production (TRS) is generally about 5% greater than shipments (disposition).
Data Limitations and Issues
The following data issues need to be addressed:
1. The level of confidential data related to coal, coke, and COG in the RESD and ICE data sets should be reduced wherever possible. These fuels are the key energy sources in the iron and steel industry and are the most crucial to relevant analysis.
2. We have clarified issues related to physical production data in this report. Two primary production indicators can be generated from the data: production and disposition. Analysts

27
should be careful as to which indicator they may wish to use, especially if international comparisons are to be made.
a) Production of primary forms provides an intensity indicator for the most energy intense
function of the steel industry, the smelting of steel. This is similar to the indicator most
often used internationally by the Worldsteel Association. The value of the indicator
slightly overestimates the energy used per tonne of raw steel because energy used in
the manufacture of finished steel products is included in the total energy number.11
b) Disposition data provides an indicator of the embodied energy in the unique set of
products that are made in Canada. This value cannot be easily compared to
international data because each country is unlikely to generate the same mix of
products. In part, this value may be confounded by the degree to which raw steel is
imported to be “finished” domestically. On the other hand, it is an indicator used in
other regions of the world, most notably the United States.
11 As noted earlier, this number is estimated to be small; most of the energy used is in smelting.

28
References
APP (Asia Pacific Partnership). 2007. Steel Task Force of Asia-Pacific Partnership on Clean Development and Climate. www.asiapacificpartnership.org/SteelTF.htm
deBeer, J., E. Worrell, K. Bloc. 1998. Future Technologies for Energy-Efficient Iron and Steel
Making. Annu. Rev. Energy Environ. 23:123-205.
CEEDC. 1993. An Assessment of Data on Output for Industrial Sub-Sectors. Prepared for the
Canadian Industry Program for Energy Conservation. Prepared by J. Nyboer, A. Bailie, CEEDC.
_____. 2007. Baseline 1990 Data for the Canadian Iron and Steel Manufacturing Industries.
Simon Fraser University, Burnaby.
CSPA (Canadian Steel Producers Association). 2002. 1990 Adjustments Canadian Steel Industry.
Appendix II.
ECCC (Environment and Climate Change Canada) 2016. National Inventory Report: Greenhouse
Gas Sources and Sinks in Canada, 1990-2015. http://www.ec.gc.ca/ges-ghg
Farla, J.C.M., K. Blok. 2001. The quality of energy intensity indicators for international
comparison in the iron and steel industry. Energy Policy 29: 523-543.
IEA 2002. Assessing Measures of Energy Efficiency Performance and their Application in
Industry. IEA Information Paper.
Kim, Y., E. Worrell. 2002. International comparison of CO2 emission trends in the iron and steel
industry. Energy Policy 30: 827-838.
NRCan 2007. Benchmarking Energy Intensity in the Canadian Steel Industry. With Natural
Resources Canada, Office of Energy Efficiency, Queen’s Printers, Ottawa.
Phylipsen, G.M.J., K. Blok, and E. Worrell. 1998. Handbook of International Comparisons of
Energy Efficiency in the Manufacturing Industry. Department of Science, Technology and
Society, Utrecht University, Utrecht Netherlands.
Statistics Canada. 1990 – 2001. Quarterly Report on Energy Supply and Demand in Canada, (IV),
Catalogue no. 57-003-XPB, Ottawa. Available through CANSIM.
---. 2002 – 2015. Report on Energy Supply and Demand in Canada, Catalogue no. 57-003-XPB,
Ottawa. Available through CANSIM, Table 127-0016, 127-0017.
Worldsteel Association. 2016. Steel Statistical Yearbook 2016. Worldsteel Committee on
Economic Studies. Brussels.

29
Acronyms
ASM - Annual Survey of Manufacturers
ASML - Annual Survey of Manufacturers and Logging
BOF - basic oxygen furnace
CANSIM - Canadian Socio-economic Information Management
CEEDC - Canadian Industrial Energy End-use Data and Analysis Centre
COG - coke oven gas
CSPA - Canadian Steel Producers Association
DR - direct reduced iron
EAF – electric arc furnace
GDP – Gross Domestic Product
GHG - greenhouse gas
GO – Gross Output
HHV – higher heating value
ICE - Industrial Consumption of Energy
IEA – International Energy Agency
IPCC – Intergovernmental Panel on Climate Change
ISIC - International Standard Industrial Classification
LHV – lower heating value
NAICS - North American Industry Classification System
NIR - National Inventory Report
NRCan - Natural Resources Canada
OHF - open hearth furnace
RESD- Report on Energy Supply and Demand
SPF - primary steel forms
StatCan - Statistics Canada
TLS - tonnes of liquid steel
TRS - tonnes of raw steel
WSA - Worldsteel Association

30
Appendices
Appendix A
• Table 1: Energy coefficients, GJ/physical unit
• Table 2: CO2 emissions coefficients, tonnes/physical unit
• Table 3: CH4 emissions coefficients, kg/physical unit
• Table 4: N2O emissions coefficients, kg/physical unit
Appendix B
The tables in Appendix B are generated from CEEDC’s master database on all industry in
Canada.
• NAICS Energy Use Report
• NAICS Carbon Dioxide Report
• NAICS Methane Report
• NAICS Nitrous Oxide Report
• NAICS Total GHG Report

31
Appendix A – Conversion Coefficients

Fuel Unit Source 1990 1995 2000 2005 2010 2013 2014 2015 2016 2017
Energy
HHV GJ/unit
Aviation gasoline kL RESD 33.5 33.5 33.5 33.5 33.5 33.5 33.5 33.5 33.5 33.5
Aviation turbo kL RESD 36.4 36.4 36.4 37.4 37.4 37.4 37.4 37.4 37.4 37.4
Biodiesel kL AFDC 33.3 33.3 33.3 33.3 33.3 33.3 33.3 33.3 33.3 33.3
Butane kL ICE 28.4 28.4 28.4 28.4 28.4 28.4 28.4 28.4 28.4 28.4
Coal t ICE 27.6 27.8 27.3 26.1 26.8 27.0 27.0 27.1 27.2 26.8
Coke t ICE 28.8 28.8 28.8 28.8 28.8 28.8 28.8 28.8 28.8 28.8
Coke on Cat Crackers t Petcoke 37.1 37.1 38.6 38.6 38.6 38.6 38.6 38.7 38.6 38.6
Coke Oven Gas ML ICE 18.6 18.6 19.1 19.1 19.1 19.1 19.1 19.1 19.1 19.1
Diesel kL RESD 38.7 38.7 38.7 38.3 38.3 38.3 38.3 38.3 38.3 38.3
Ethanol kL AFDC 21.3 21.3 21.3 21.3 21.3 21.3 21.3 21.3 21.3 21.3
Gasoline kL RESD 34.7 34.7 34.7 35.0 35.0 35.0 35.0 35.0 35.0 35.0
Heavy Fuel Oil kL ICE 41.7 41.7 42.5 42.5 42.5 42.5 42.5 42.5 42.5 42.5
Kerosene kL MD 38.7 38.7 38.7 38.7 38.7 38.7 38.5 38.5 38.5 38.4
Light Fuel Oil kL MD 38.7 38.7 38.7 38.7 38.7 38.7 38.5 38.5 38.5 38.4
Liquified Petroleum Gas kL RESD 26.8 26.8 26.8 26.8 26.8 26.8 26.8 26.8 26.8 26.8
Middle Distillates kL ICE 38.7 38.7 38.7 38.7 38.7 38.7 38.5 38.5 38.5 38.4
Natural Gas ML ICE 37.8 38.1 38.0 38.3 38.5 38.9 39.0 39.2 39.0 39.2
Petcoke t ICE 37.1 37.1 38.6 38.6 38.6 38.6 38.6 38.7 38.6 38.6
Propane kL ICE 25.5 25.5 25.3 25.3 25.3 25.3 25.3 25.3 25.3 25.3
Refinery Fuel Gas ML ICE 41.7 41.7 42.5 42.5 42.5 36.1 36.1 36.1 36.1 36.1
Spent Pulping Liquor t ICE 14.0 14.0 14.0 14.0 14.0 14.0 14.0 14.0 14.0 14.0
Still Gas ML RESD 37.3 37.3 36.1 36.1 36.1 36.1 36.1 36.1 36.1 36.1
Wood t ICE 18.0 18.0 18.0 18.0 18.0 18.0 18.0 18.0 18.0 18.0
Uranium kg STC, EPTGD 685.9 648.0 697.7 704.5 704.5 704.5 704.5 704.5 704.5 704.5
CO2 tCO2/unit
Aviation gasoline kL NIR, Table A6-12 2.37 2.37 2.37 2.37 2.37 2.37 2.37 2.37 2.37 2.37
Aviation turbo kL NIR, Table A6-12 2.56 2.56 2.56 2.56 2.56 2.56 2.56 2.56 2.56 2.56
Biodiesel kL NIR, Table A6-12 2.47 2.47 2.47 2.47 2.47 2.47 2.47 2.47 2.47 2.47
Butane kL NIR, Table A6-3 1.75 1.75 1.75 1.75 1.75 1.75 1.75 1.75 1.75 1.75
Coal t NIR, Table A6-8 2.19 2.19 2.19 2.19 2.19 2.19 2.19 2.19 2.19 2.19
Coke t NIR, Table A6-9 3.17 3.17 3.17 3.17 3.17 3.17 3.17 3.17 3.17 3.17
Coke on Cat Crackers t Petcoke 3.67 3.67 3.60 3.74 3.71 3.71 3.71 3.71 3.72 3.72
Coke Oven Gas ML NIR, Table A6-9 0.69 0.69 0.69 0.69 0.69 0.69 0.69 0.69 0.69 0.69
Diesel kL NIR, Table A6-4 2.69 2.69 2.69 2.69 2.69 2.69 2.69 2.69 2.69 2.69
Ethanol kL NIR, Table A6-12 1.51 1.51 1.51 1.51 1.51 1.51 1.51 1.51 1.51 1.51
Gasoline kL NIR, Table A6-4 2.32 2.32 2.32 2.32 2.32 2.32 2.32 2.32 2.32 2.32
Heavy Fuel Oil kL NIR, Table A6-4 3.16 3.16 3.16 3.16 3.16 3.16 3.16 3.16 3.16 3.16
Kerosene kL NIR, Table A6-4 2.56 2.56 2.56 2.56 2.56 2.56 2.56 2.56 2.56 2.56
Light Fuel Oil kL NIR, Table A6-4 2.75 2.75 2.75 2.75 2.75 2.75 2.75 2.75 2.75 2.75
Liquified Petroleum Gas kL Propane 1.52 1.52 1.52 1.52 1.52 1.52 1.52 1.52 1.52 1.52
Middle Distillates kL MD 2.75 2.75 2.75 2.75 2.75 2.75 2.75 2.75 2.75 2.75
Natural Gas ML NIR, Table A6-1 1.92 1.92 1.92 1.92 1.92 1.92 1.92 1.92 1.92 1.92
Petcoke t NIR, CRF 3.67 3.67 3.60 3.74 3.71 3.71 3.71 3.71 3.72 3.72
Propane kL NIR, Table A6-3 1.52 1.52 1.52 1.52 1.52 1.52 1.52 1.52 1.52 1.52
Refinery Fuel Gas ML NIR, CRF 1.88 1.91 1.85 1.89 1.97 2.12 2.12 2.13 2.13 2.13
Spent Pulping Liquor t NIR, Table A6-32 0.89 0.89 0.89 0.89 0.89 0.89 0.89 0.89 0.89 0.89
Still Gas ML RFG 1.88 1.91 1.85 1.89 1.97 2.12 2.12 2.13 2.13 2.13
Wood t NIR, Table A6-32 0.84 0.84 0.84 0.84 0.84 0.84 0.84 0.84 0.84 0.84
Process Coefficients
Cement Clinker t NIR, CRF 0.55 0.55 0.55 0.55 0.55 0.54 0.54 0.54 0.54 0.54
Cement Waste Fuel GJ NIR, Table A6-11 0.08 0.08 0.08 0.08 0.08 0.08 0.08 0.08 0.08 0.08
Lime t NIR, CRF 0.77 0.77 0.76 0.76 0.75 0.75 0.75 0.75 0.76 0.76
Aluminium t NIR, CRF 1.74 1.68 1.64 1.67 1.67 1.66 1.66 1.65 1.63 1.63
Ammonia t NIR, CRF 0.78 0.71 0.66 0.65 0.60 0.68 0.62 0.64 0.61 0.61

Fuel Unit Source 1990 1995 2000 2005 2010 2013 2014 2015 2016 2017
CH4 kgCH4/unit
Aviation gasoline kL NIR, Table A6-12 2.200 2.200 2.200 2.200 2.200 2.200 2.200 2.200 2.200 2.200
Aviation turbo kL NIR, Table A6-12 0.029 0.029 0.029 0.029 0.029 0.029 0.029 0.029 0.029 0.029
Biodiesel kL Diesel 0.133 0.133 0.133 0.133 0.133 0.133 0.133 0.133 0.133 0.133
Butane kL NIR, Table A6-3 0.024 0.024 0.024 0.024 0.024 0.024 0.024 0.024 0.024 0.024
Coal t NIR, Table A6-10 0.030 0.030 0.030 0.030 0.030 0.030 0.030 0.030 0.030 0.030
Coke t NIR, Table A6-10 0.030 0.030 0.030 0.030 0.030 0.030 0.030 0.030 0.030 0.030
Coke on Cat Crackers t Petcoke 0.100 0.100 0.100 0.100 0.100 0.100 0.100 0.100 0.100 0.100
Coke Oven Gas ML NIR, Table A6-10 0.040 0.040 0.040 0.040 0.040 0.040 0.040 0.040 0.040 0.040
Diesel kL NIR, Table A6-4 0.133 0.133 0.133 0.133 0.133 0.133 0.133 0.133 0.133 0.133
Ethanol kL Gasoline 0.100 0.100 0.100 0.100 0.100 0.100 0.100 0.100 0.100 0.100
Gasoline kL NIR, Table A6-4 0.100 0.100 0.100 0.100 0.100 0.100 0.100 0.100 0.100 0.100
Heavy Fuel Oil kL NIR, Table A6-4 0.120 0.120 0.120 0.120 0.120 0.120 0.120 0.120 0.120 0.120
Kerosene kL NIR, Table A6-4 0.006 0.006 0.006 0.006 0.006 0.006 0.006 0.006 0.006 0.006
Light Fuel Oil kL NIR, Table A6-4 0.006 0.006 0.006 0.006 0.006 0.006 0.006 0.006 0.006 0.006
Liquified Petroleum Gas kL Propane 0.024 0.024 0.024 0.024 0.024 0.024 0.024 0.024 0.024 0.024
Middle Distillates kL MD 0.006 0.006 0.006 0.006 0.006 0.006 0.006 0.006 0.006 0.006
Natural Gas ML NIR, Table A6-2 0.037 0.037 0.037 0.037 0.037 0.037 0.037 0.037 0.037 0.037
Petcoke t NIR, Table A6-4 0.100 0.100 0.100 0.100 0.100 0.100 0.100 0.100 0.100 0.100
Propane kL NIR, Table A6-3 0.024 0.024 0.024 0.024 0.024 0.024 0.024 0.024 0.024 0.024
Refinery Fuel Gas ML NIR, Table A6-7 0.033 0.034 0.034 0.032 0.032 0.031 0.031 0.031 0.031 0.031
Spent Pulping Liquor t NIR, Table A6-32 0.020 0.020 0.020 0.020 0.020 0.020 0.020 0.020 0.020 0.020
Still Gas ML RFG 0.033 0.034 0.034 0.032 0.032 0.031 0.031 0.031 0.031 0.031
Wood t NIR, Table A6-32 0.090 0.090 0.090 0.090 0.090 0.090 0.090 0.090 0.090 0.090
Process Coefficients
Cement Waste Fuel GJ NIR, Table A6-11 0.030 0.030 0.030 0.030 0.030 0.030 0.030 0.030 0.030 0.030
N2O kgN2O/unit
Aviation gasoline kL NIR, Table A6-12 0.230 0.230 0.230 0.230 0.230 0.230 0.230 0.230 0.230 0.230
Aviation turbo kL NIR, Table A6-12 0.071 0.071 0.071 0.071 0.071 0.071 0.071 0.071 0.071 0.071
Biodiesel kL Diesel 0.400 0.400 0.400 0.400 0.400 0.400 0.400 0.400 0.400 0.400
Butane kL NIR, Table A6-3 0.108 0.108 0.108 0.108 0.108 0.108 0.108 0.108 0.108 0.108
Coal t NIR, Table A6-10 0.020 0.020 0.020 0.020 0.020 0.020 0.020 0.020 0.020 0.020
Coke t NIR, Table A6-10 0.020 0.020 0.020 0.020 0.020 0.020 0.020 0.020 0.020 0.020
Coke on Cat Crackers t Petcoke 0.021 0.021 0.023 0.023 0.023 0.023 0.023 0.023 0.023 0.023
Coke Oven Gas ML NIR, Table A6-10 0.040 0.040 0.040 0.040 0.040 0.040 0.040 0.040 0.040 0.040
Diesel kL NIR, Table A6-4 0.400 0.400 0.400 0.400 0.400 0.400 0.400 0.400 0.400 0.400
Ethanol kL Gasoline 0.020 0.020 0.020 0.020 0.020 0.020 0.020 0.020 0.020 0.020
Gasoline kL NIR, Table A6-4 0.020 0.020 0.020 0.020 0.020 0.020 0.020 0.020 0.020 0.020
Heavy Fuel Oil kL NIR, Table A6-4 0.064 0.064 0.064 0.064 0.064 0.064 0.064 0.064 0.064 0.064
Kerosene kL NIR, Table A6-4 0.031 0.031 0.031 0.031 0.031 0.031 0.031 0.031 0.031 0.031
Light Fuel Oil kL NIR, Table A6-4 0.031 0.031 0.031 0.031 0.031 0.031 0.031 0.031 0.031 0.031
Liquified Petroleum Gas kL Propane 0.108 0.108 0.108 0.108 0.108 0.108 0.108 0.108 0.108 0.108
Middle Distillates kL MD 0.031 0.031 0.031 0.031 0.031 0.031 0.031 0.031 0.031 0.031
Natural Gas ML NIR, Table A6-2 0.033 0.033 0.033 0.033 0.033 0.033 0.033 0.033 0.033 0.033
Petcoke t NIR, Table A6-6 0.021 0.021 0.023 0.023 0.023 0.023 0.023 0.023 0.023 0.023
Propane kL NIR, Table A6-3 0.108 0.108 0.108 0.108 0.108 0.108 0.108 0.108 0.108 0.108
Refinery Fuel Gas ML Still Gas 0.000 0.000 0.000 0.000 0.000 0.000 0.000 0.000 0.000 0.000
Spent Pulping Liquor t NIR, Table A6-32 0.020 0.020 0.020 0.020 0.020 0.020 0.020 0.020 0.020 0.020
Still Gas ML NIR, Table A6-4 0.000 0.000 0.000 0.000 0.000 0.000 0.000 0.000 0.000 0.000
Wood t NIR, Table A6-32 0.060 0.060 0.060 0.060 0.060 0.060 0.060 0.060 0.060 0.060
Process Coefficients
Cement Waste Fuel GJ NIR, Table A6-11 0.004 0.004 0.004 0.004 0.004 0.004 0.004 0.004 0.004 0.004
Adipic Acid t NIR, Table A6-15 0.300 0.300 0.300 0.300 0.300 0.300 0.300 0.300 0.300 0.300
Nitric Acid t NIR, CRF 3.384 3.269 3.640 3.434 4.121 3.775 3.932 4.197 3.782 3.782
Other GHGs tCO2e/unit
Aluminium t PFCs 4.84 2.90 2.09 1.32 0.62 0.54 0.37 0.33 0.23 0.23
Magnesium t SF6 117.12 41.84 41.50 27.40 43.26 43.26 43.26 43.26 43.26 43.26

32
Appendix B – Production, Energy, and Emissions

NAICS 3311 Iron and steel mills and ferro-alloy manufacturing
Canada
Adjusted 1990 value
Energy 1990 1995 2000 2005 2008 2009 2010 2011 2012 2013 2014 2015 2016 2017
Coal TJ 372 270 486 0 337 3,030 8,719 9,897 11,179 11,280 11,837 13,102 12,584 14,736
Coke Oven Gas TJ 34,984 27,391 27,120 29,530 25,893 19,894 26,813 25,951 26,125 24,249 22,666 21,181 19,994 19,744
Coke TJ 115,664 97,878 99,063 88,965 97,284 73,086 80,697 87,557 87,430 70,292 76,671 71,537 78,812 79,735
Electricity TJ 32,405 32,903 34,976 32,483 29,994 24,163 27,739 27,678 28,464 24,343 29,436 29,111 28,984 28,191
Heavy Fuel Oil TJ 11,457 8,527 7,548 8,817 12,133 2,357 91 31 95 3 50 521 117 568
Middle Distillates TJ 1,117 1,231 959 832 529 1,155 1,144 1,132 643 902 681 754 869 799
Natural Gas TJ 69,622 75,907 86,494 73,371 71,828 55,040 63,350 62,439 66,100 72,944 79,278 73,507 71,631 73,510
Petcoke TJ 0 0 66 0 0 0 472 1,560 579 515 796 105 326 147
Propane TJ 213 352 60 10 187 76 44 6 7 6 6 4 6 5
Wood TJ 0 0 0 706 1,001 2,006 0 0 0 0 0 0 0 0
Total TJ 265,834 244,458 256,771 234,714 239,185 180,809 209,082 216,250 220,623 204,533 221,419 209,805 213,324 217,435
Activity
Steel, primary forms kt 14,531 14,414 16,597 15,327 14,845 9,245 13,003 12,891 13,510 12,417 12,730 12,473 12,646 13,614
Steel, disposition kt 12,696 13,349 14,865 14,197 14,837 8,777 12,423 12,070 12,786 12,192 11,984 11,954 11,977 11,860
GDP M$2007 2,918 3,208 3,675 3,378 2,964 1,783 2,469 2,704 2,831 2,684 2,829 2,500 2,547 2,616
Intensity
Energy/Steel, primary forms MJ/t 18,294.5 16,959.6 15,471.0 15,313.4 16,112.1 19,556.8 16,079.7 16,775.6 16,330.0 16,472.0 17,393.5 16,820.7 16,868.9 15,971.4
Energy/Steel, disposition MJ/t 20,938.4 18,313.6 17,273.4 16,532.1 16,120.7 20,600.0 16,830.0 17,916.0 17,255.6 16,776.0 18,476.3 17,551.0 17,811.1 18,333.5
Energy/GDP MJ/$2007 91.1 76.2 69.9 69.5 80.7 101.4 84.7 80.0 77.9 76.2 78.3 83.9 83.8 83.1
Index (1990=1)
Energy/Steel, primary forms MJ/t 1.00 0.93 0.85 0.84 0.88 1.07 0.88 0.92 0.89 0.90 0.95 0.92 0.92 0.87
Energy/Steel, disposition MJ/t 1.00 0.87 0.82 0.79 0.77 0.98 0.80 0.86 0.82 0.80 0.88 0.84 0.85 0.88
Energy/GDP MJ/$2007 1.00 0.84 0.77 0.76 0.89 1.11 0.93 0.88 0.86 0.84 0.86 0.92 0.92 0.91
Energy Use and Intensity Indicators
CEEDC estimate
Page 1 of 30 More data available at https://www.sfu.ca/ceedc/databases.html

NAICS 3311 Iron and steel mills and ferro-alloy manufacturing
Canada
StatCan 1990 value
Energy 1990 1995 2000 2005 2008 2009 2010 2011 2012 2013 2014 2015 2016 2017
Coal TJ 10 270 486 0 337 3,030 8,719 9,897 11,179 11,280 11,837 13,102 12,584 14,736
Coke Oven Gas TJ 31,581 27,391 27,120 29,530 25,893 19,894 26,813 25,951 26,125 24,249 22,666 21,181 19,994 19,744
Coke TJ 88,057 97,878 99,063 88,965 97,284 73,086 80,697 87,557 87,430 70,292 76,671 71,537 78,812 79,735
Electricity TJ 24,673 32,903 34,976 32,483 29,994 24,163 27,739 27,678 28,464 24,343 29,436 29,111 28,984 28,191
Heavy Fuel Oil TJ 10,774 8,527 7,548 8,817 12,133 2,357 91 31 95 3 50 521 117 568
Middle Distillates TJ 940 1,231 959 832 529 1,155 1,144 1,132 643 902 681 754 869 799
Natural Gas TJ 64,520 75,907 86,494 73,371 71,828 55,040 63,350 62,439 66,100 72,944 79,278 73,507 71,631 73,510
Petcoke TJ 0 0 66 0 0 0 472 1,560 579 515 796 105 326 147
Propane TJ 1 352 60 10 187 76 44 6 7 6 6 4 6 5
Wood TJ 0 0 0 706 1,001 2,006 0 0 0 0 0 0 0 0
Total TJ 220,556 244,458 256,771 234,714 239,185 180,809 209,082 216,250 220,623 204,533 221,419 209,805 213,324 217,435
Activity
Steel, primary forms kt 12,281 14,414 16,597 15,327 14,845 9,245 13,003 12,891 13,510 12,417 12,730 12,473 12,646 13,614
Steel, disposition kt 11,565 13,349 14,865 14,197 14,837 8,777 12,423 12,070 12,786 12,192 11,984 11,954 11,977 11,860
GDP M$2007 2,918 3,208 3,675 3,378 2,964 1,783 2,469 2,704 2,831 2,684 2,829 2,500 2,547 2,616
Intensity
Energy/Steel, primary forms MJ/t 17,959.6 16,959.6 15,471.0 15,313.4 16,112.1 19,556.8 16,079.7 16,775.6 16,330.0 16,472.0 17,393.5 16,820.7 16,868.9 15,971.4
Energy/Steel, disposition MJ/t 19,071.5 18,313.6 17,273.4 16,532.1 16,120.7 20,600.0 16,830.0 17,916.0 17,255.6 16,776.0 18,476.3 17,551.0 17,811.1 18,333.5
Energy/GDP MJ/$2007 75.6 76.2 69.9 69.5 80.7 101.4 84.7 80.0 77.9 76.2 78.3 83.9 83.8 83.1
Index (1990=1)
Energy/Steel, primary forms MJ/t 1.00 0.94 0.86 0.85 0.90 1.09 0.90 0.93 0.91 0.92 0.97 0.94 0.94 0.89
Energy/Steel, disposition MJ/t 1.00 0.96 0.91 0.87 0.85 1.08 0.88 0.94 0.90 0.88 0.97 0.92 0.93 0.96
Energy/GDP MJ/$2007 1.00 1.01 0.92 0.92 1.07 1.34 1.12 1.06 1.03 1.01 1.04 1.11 1.11 1.10
Energy Use and Intensity Indicators
CEEDC estimate
Page 2 of 30 More data available at https://www.sfu.ca/ceedc/databases.html

NAICS 3311 Iron and steel mills and ferro-alloy manufacturing
Canada
Adjusted 1990 value
Energy 1990 1995 2000 2005 2008 2009 2010 2011 2012 2013 2014 2015 2016 2017
Coal ktCO2 29 21 39 0 28 254 734 847 945 920 966 1,094 1,031 1,192
Coke Oven Gas ktCO2 1,291 1,011 1,001 1,060 929 714 962 931 938 870 814 760 718 709
Coke ktCO2 13,762 11,465 11,814 10,308 10,804 8,138 9,163 10,078 10,173 8,037 8,929 8,036 9,311 9,420
Electricity ktCO2 0 0 0 0 0 0 0 0 0 0 0 0 0 0
Heavy Fuel Oil ktCO2 867 645 571 655 901 175 7 2 7 0 4 39 9 42
Middle Distillates ktCO2 79 88 68 59 38 82 81 81 46 64 48 54 62 57
Natural Gas ktCO2 3,543 3,834 4,366 3,710 3,616 2,767 3,184 3,151 3,309 3,650 3,958 3,667 3,558 3,641
Petcoke ktCO2 0 0 6 0 0 0 39 130 48 43 67 9 27 12
Propane ktCO2 13 21 4 1 11 5 3 0 0 0 0 0 0 0
Wood ktCO2 0 0 0 0 0 0 0 0 0 0 0 0 0 0
Total ktCO2 19,584 17,085 17,868 15,792 16,327 12,135 14,173 15,220 15,467 13,585 14,786 13,658 14,715 15,072
Activity
Steel, primary forms kt 14,531 14,414 16,597 15,327 14,845 9,245 13,003 12,891 13,510 12,417 12,730 12,473 12,646 13,614
Steel, disposition kt 12,696 13,349 14,865 14,197 14,837 8,777 12,423 12,070 12,786 12,192 11,984 11,954 11,977 11,860
GDP M$2007 2,918 3,208 3,675 3,378 2,964 1,783 2,469 2,704 2,831 2,684 2,829 2,500 2,547 2,616
Intensity
CO2/Steel, primary forms gCO2/kg 1,347.7 1,185.3 1,076.6 1,030.3 1,099.8 1,312.5 1,090.0 1,180.7 1,144.8 1,094.0 1,161.5 1,095.0 1,163.6 1,107.1
CO2/Steel, disposition gCO2/kg 1,542.5 1,279.9 1,202.0 1,112.3 1,100.4 1,382.5 1,140.9 1,261.0 1,209.7 1,114.2 1,233.8 1,142.6 1,228.6 1,270.9
CO2/GDP gCO2/$2007 6.7 5.3 4.9 4.7 5.5 6.8 5.7 5.6 5.5 5.1 5.2 5.5 5.8 5.8
CO2/GJ gCO2/MJ 73.7 69.9 69.6 67.3 68.3 67.1 67.8 70.4 70.1 66.4 66.8 65.1 69.0 69.3
Index (1990=1)
CO2/Steel, primary forms gCO2/kg 1.00 0.88 0.80 0.76 0.82 0.97 0.81 0.88 0.85 0.81 0.86 0.81 0.86 0.82
CO2/Steel, disposition gCO2/kg 1.00 0.83 0.78 0.72 0.71 0.90 0.74 0.82 0.78 0.72 0.80 0.74 0.80 0.82
CO2/GDP gCO2/$2007 1.00 0.79 0.72 0.70 0.82 1.01 0.86 0.84 0.81 0.75 0.78 0.81 0.86 0.86
CO2/GJ gCO2/MJ 1.00 0.95 0.94 0.91 0.93 0.91 0.92 0.96 0.95 0.90 0.91 0.88 0.94 0.94
CO2 Emissions and Intensity Indicators
CEEDC estimate
Page 11 of 30 https://www.sfu.ca/ceedc/databases.html

NAICS 3311 Iron and steel mills and ferro-alloy manufacturing
Canada
StatCan 1990 value
Energy 1990 1995 2000 2005 2008 2009 2010 2011 2012 2013 2014 2015 2016 2017
Coal ktCO2 1 21 39 0 28 254 734 847 945 920 966 1,094 1,031 1,192
Coke Oven Gas ktCO2 1,166 1,011 1,001 1,060 929 714 962 931 938 870 814 760 718 709
Coke ktCO2 10,477 11,465 11,814 10,308 10,804 8,138 9,163 10,078 10,173 8,037 8,929 8,036 9,311 9,420
Electricity ktCO2 0 0 0 0 0 0 0 0 0 0 0 0 0 0
Heavy Fuel Oil ktCO2 815 645 571 655 901 175 7 2 7 0 4 39 9 42
Middle Distillates ktCO2 67 88 68 59 38 82 81 81 46 64 48 54 62 57
Natural Gas ktCO2 3,283 3,834 4,366 3,710 3,616 2,767 3,184 3,151 3,309 3,650 3,958 3,667 3,558 3,641
Petcoke ktCO2 0 0 6 0 0 0 39 130 48 43 67 9 27 12
Propane ktCO2 0 21 4 1 11 5 3 0 0 0 0 0 0 0
Wood ktCO2 0 0 0 0 0 0 0 0 0 0 0 0 0 0
Total ktCO2 15,808 17,085 17,868 15,792 16,327 12,135 14,173 15,220 15,467 13,585 14,786 13,658 14,715 15,072
Activity
Steel, primary forms kt 12,281 14,414 16,597 15,327 14,845 9,245 13,003 12,891 13,510 12,417 12,730 12,473 12,646 13,614
Steel, disposition kt 11,565 13,349 14,865 14,197 14,837 8,777 12,423 12,070 12,786 12,192 11,984 11,954 11,977 11,860
GDP M$2007 2,918 3,208 3,675 3,378 2,964 1,783 2,469 2,704 2,831 2,684 2,829 2,500 2,547 2,616
Intensity
CO2/Steel, primary forms gCO2/kg 1,287.3 1,185.3 1,076.6 1,030.3 1,099.8 1,312.5 1,090.0 1,180.7 1,144.8 1,094.0 1,161.5 1,095.0 1,163.6 1,107.1
CO2/Steel, disposition gCO2/kg 1,367.0 1,279.9 1,202.0 1,112.3 1,100.4 1,382.5 1,140.9 1,261.0 1,209.7 1,114.2 1,233.8 1,142.6 1,228.6 1,270.9
CO2/GDP gCO2/$2007 5.4 5.3 4.9 4.7 5.5 6.8 5.7 5.6 5.5 5.1 5.2 5.5 5.8 5.8
CO2/GJ gCO2/MJ 71.7 69.9 69.6 67.3 68.3 67.1 67.8 70.4 70.1 66.4 66.8 65.1 69.0 69.3
Index (1990=1)
CO2/Steel, primary forms gCO2/kg 1.00 0.92 0.84 0.80 0.85 1.02 0.85 0.92 0.89 0.85 0.90 0.85 0.90 0.86
CO2/Steel, disposition gCO2/kg 1.00 0.94 0.88 0.81 0.81 1.01 0.83 0.92 0.88 0.82 0.90 0.84 0.90 0.93
CO2/GDP gCO2/$2007 1.00 0.98 0.90 0.86 1.02 1.26 1.06 1.04 1.01 0.93 0.96 1.01 1.07 1.06
CO2/GJ gCO2/MJ 1.00 0.98 0.97 0.94 0.95 0.94 0.95 0.98 0.98 0.93 0.93 0.91 0.96 0.97
CO2 Emissions and Intensity Indicators
CEEDC estimate
Page 12 of 30 https://www.sfu.ca/ceedc/databases.html

NAICS 3311 Iron and steel mills and ferro-alloy manufacturing
Canada
Adjusted 1990 value
Energy 1990 1995 2000 2005 2008 2009 2010 2011 2012 2013 2014 2015 2016 2017
Coal ktCO2e 30 21 39 0 28 255 736 850 948 923 968 1,097 1,035 1,195
Coke Oven Gas ktCO2e 1,316 1,030 1,020 1,080 947 728 981 949 955 887 829 775 731 722
Coke ktCO2e 13,788 11,488 11,837 10,328 10,826 8,155 9,182 10,098 10,194 8,053 8,947 8,052 9,329 9,438
Electricity ktCO2e 0 0 0 0 0 0 0 0 0 0 0 0 0 0
Heavy Fuel Oil ktCO2e 873 649 575 659 907 176 7 2 7 0 4 39 9 42
Middle Distillates ktCO2e 80 88 68 59 38 83 82 81 46 64 49 54 62 57
Natural Gas ktCO2e 3,562 3,855 4,390 3,731 3,637 2,782 3,201 3,168 3,327 3,670 3,980 3,687 3,577 3,661
Petcoke ktCO2e 0 0 6 0 0 0 39 130 48 43 67 9 27 12
Propane ktCO2e 13 21 4 1 11 5 3 0 0 0 0 0 0 0
Wood ktCO2e 0 0 0 1 2 4 0 0 0 0 0 0 0 0
Total ktCO2e 19,661 17,153 17,939 15,860 16,396 12,187 14,231 15,279 15,526 13,641 14,844 13,713 14,771 15,129
Activity
Steel, primary forms kt 14,531 14,414 16,597 15,327 14,845 9,245 13,003 12,891 13,510 12,417 12,730 12,473 12,646 13,614
Steel, disposition kt 12,696 13,349 14,865 14,197 14,837 8,777 12,423 12,070 12,786 12,192 11,984 11,954 11,977 11,860
GDP M$2007 2,918 3,208 3,675 3,378 2,964 1,783 2,469 2,704 2,831 2,684 2,829 2,500 2,547 2,616
Intensity
GHG/Steel, primary forms gCO2e/kg 1,353.1 1,190.0 1,080.8 1,034.7 1,104.5 1,318.2 1,094.4 1,185.3 1,149.2 1,098.6 1,166.1 1,099.5 1,168.0 1,111.3
GHG/Steel, disposition gCO2e/kg 1,548.6 1,285.0 1,206.8 1,117.1 1,105.1 1,388.5 1,145.5 1,265.8 1,214.4 1,118.8 1,238.7 1,147.2 1,233.2 1,275.6
GHG/GDP gCO2e/$2007 6.7 5.3 4.9 4.7 5.5 6.8 5.8 5.7 5.5 5.1 5.2 5.5 5.8 5.8
GHG/GJ gCO2e/MJ 74.0 70.2 69.9 67.6 68.6 67.4 68.1 70.7 70.4 66.7 67.0 65.4 69.2 69.6
Index (1990=1)
GHG/Steel, primary forms gCO2e/kg 1.00 0.88 0.80 0.76 0.82 0.97 0.81 0.88 0.85 0.81 0.86 0.81 0.86 0.82
GHG/Steel, disposition gCO2e/kg 1.00 0.83 0.78 0.72 0.71 0.90 0.74 0.82 0.78 0.72 0.80 0.74 0.80 0.82
GHG/GDP gCO2e/$2007 1.00 0.79 0.72 0.70 0.82 1.01 0.86 0.84 0.81 0.75 0.78 0.81 0.86 0.86
GHG/GJ gCO2e/MJ 1.00 0.95 0.94 0.91 0.93 0.91 0.92 0.96 0.95 0.90 0.91 0.88 0.94 0.94
GHG Emissions and Intensity Indicators
CEEDC estimate
Page 21 of 30 https://www.sfu.ca/ceedc/databases.html

NAICS 3311 Iron and steel mills and ferro-alloy manufacturing
Canada
StatCan 1990 value
Energy 1990 1995 2000 2005 2008 2009 2010 2011 2012 2013 2014 2015 2016 2017
Coal ktCO2e 1 21 39 0 28 255 736 850 948 923 968 1,097 1,035 1,195
Coke Oven Gas ktCO2e 1,188 1,030 1,020 1,080 947 728 981 949 955 887 829 775 731 722
Coke ktCO2e 10,497 11,488 11,837 10,328 10,826 8,155 9,182 10,098 10,194 8,053 8,947 8,052 9,329 9,438
Electricity ktCO2e 0 0 0 0 0 0 0 0 0 0 0 0 0 0
Heavy Fuel Oil ktCO2e 821 649 575 659 907 176 7 2 7 0 4 39 9 42
Middle Distillates ktCO2e 67 88 68 59 38 83 82 81 46 64 49 54 62 57
Natural Gas ktCO2e 3,301 3,855 4,390 3,731 3,637 2,782 3,201 3,168 3,327 3,670 3,980 3,687 3,577 3,661
Petcoke ktCO2e 0 0 6 0 0 0 39 130 48 43 67 9 27 12
Propane ktCO2e 0 21 4 1 11 5 3 0 0 0 0 0 0 0
Wood ktCO2e 0 0 0 1 2 4 0 0 0 0 0 0 0 0
Total ktCO2e 15,875 17,153 17,939 15,860 16,396 12,187 14,231 15,279 15,526 13,641 14,844 13,713 14,771 15,129
Activity
Steel, primary forms kt 12,281 14,414 16,597 15,327 14,845 9,245 13,003 12,891 13,510 12,417 12,730 12,473 12,646 13,614
Steel, disposition kt 11,565 13,349 14,865 14,197 14,837 8,777 12,423 12,070 12,786 12,192 11,984 11,954 11,977 11,860
GDP M$2007 2,918 3,208 3,675 3,378 2,964 1,783 2,469 2,704 2,831 2,684 2,829 2,500 2,547 2,616
Intensity
GHG/Steel, primary forms gCO2e/kg 1,292.7 1,190.0 1,080.8 1,034.7 1,104.5 1,318.2 1,094.4 1,185.3 1,149.2 1,098.6 1,166.1 1,099.5 1,168.0 1,111.3
GHG/Steel, disposition gCO2e/kg 1,372.7 1,285.0 1,206.8 1,117.1 1,105.1 1,388.5 1,145.5 1,265.8 1,214.4 1,118.8 1,238.7 1,147.2 1,233.2 1,275.6
GHG/GDP gCO2e/$2007 5.4 5.3 4.9 4.7 5.5 6.8 5.8 5.7 5.5 5.1 5.2 5.5 5.8 5.8
GHG/GJ gCO2e/MJ 72.0 70.2 69.9 67.6 68.6 67.4 68.1 70.7 70.4 66.7 67.0 65.4 69.2 69.6
Index (1990=1)
GHG/Steel, primary forms gCO2e/kg 1.00 0.92 0.84 0.80 0.85 1.02 0.85 0.92 0.89 0.85 0.90 0.85 0.90 0.86
GHG/Steel, disposition gCO2e/kg 1.00 0.94 0.88 0.81 0.81 1.01 0.83 0.92 0.88 0.82 0.90 0.84 0.90 0.93
GHG/GDP gCO2e/$2007 1.00 0.98 0.90 0.86 1.02 1.26 1.06 1.04 1.01 0.93 0.96 1.01 1.07 1.06
GHG/GJ gCO2e/MJ 1.00 0.97 0.97 0.94 0.95 0.94 0.95 0.98 0.98 0.93 0.93 0.91 0.96 0.97
GHG Emissions and Intensity Indicators
CEEDC estimate
Page 22 of 30 https://www.sfu.ca/ceedc/databases.html

NAICS 3311 Iron and steel mills and ferro-alloy manufacturing
Ontario
Adjusted 1990 value
Energy 1990 2005 2010 2011 2012 2013 2014 2015 2016 2017
Coal TJ 303 0 4,332 5,476 6,720 9,926 10,000 12,044 8,413 10,000
Coke Oven Gas TJ 28,469 29,530 21,973 25,950 26,125 24,249 22,666 21,181 19,994 19,744
Coke TJ 94,124 89,746 80,288 87,415 87,167 67,532 76,601 71,426 78,695 79,618
Diesel TJ 0 712 1,081 510 400 591 400 140 766 800
Electricity TJ 26,370 22,056 21,350 22,000 22,000 19,078 21,177 21,912 17,900 18,022
Gasoline TJ 0 140 133 65 150 0 0 0 11 41
Heavy Fuel Oil TJ 9,324 7,286 978 568 300 179 50 48 254 250
Middle Distillates TJ 909 16 222 300 234 117 188 367 269 1
Natural Gas TJ 56,656 58,856 50,290 52,014 53,917 54,149 56,347 47,703 54,508 56,905
Petcoke TJ 0 0 0 0 0 0 0 0 0 0
Propane TJ 173 23 23 25 23 28 157 132 100 76
Wood TJ 0 0 0 0 0 0 0 0 0 0
Total TJ 216,326 208,367 180,706 194,244 197,039 175,849 187,793 175,224 180,908 185,706
Activity
Steel, primary forms kt 11,825 11,924 9,234 9,213 9,841 8,827 9,120 8,836 9,336 10,166
Steel, disposition kt 10,332 11,045 8,823 8,626 9,313 8,667 8,585 8,468 8,842 8,856
GDP M$2007 2,375 2,628 1,753 1,933 2,062 1,908 2,027 1,771 1,880 1,953
Intensity
Energy/Steel, primary forms MJ/t 18,294.5 17,475.0 19,569.3 21,084.2 20,022.5 19,921.7 20,591.8 19,831.0 19,377.9 18,267.8
Energy/Steel, disposition MJ/t 20,938.4 18,865.8 20,482.4 22,517.5 21,157.5 20,289.4 21,873.6 20,692.0 20,460.3 20,969.5
Energy/GDP MJ/$2007 91.1 79.3 103.1 100.5 95.6 92.2 92.7 98.9 96.2 95.1
Index (1990=1)
Energy/Steel, primary forms MJ/t 1.00 0.96 1.07 1.15 1.09 1.09 1.13 1.08 1.06 1.00
Energy/Steel, disposition MJ/t 1.00 0.90 0.98 1.08 1.01 0.97 1.04 0.99 0.98 1.00
Energy/GDP MJ/$2007 1.00 0.87 1.13 1.10 1.05 1.01 1.02 1.09 1.06 1.04
Energy Use and Intensity Indicators
CEEDC estimate
Page 1 of 30 More data available at https://www.sfu.ca/ceedc/databases.html
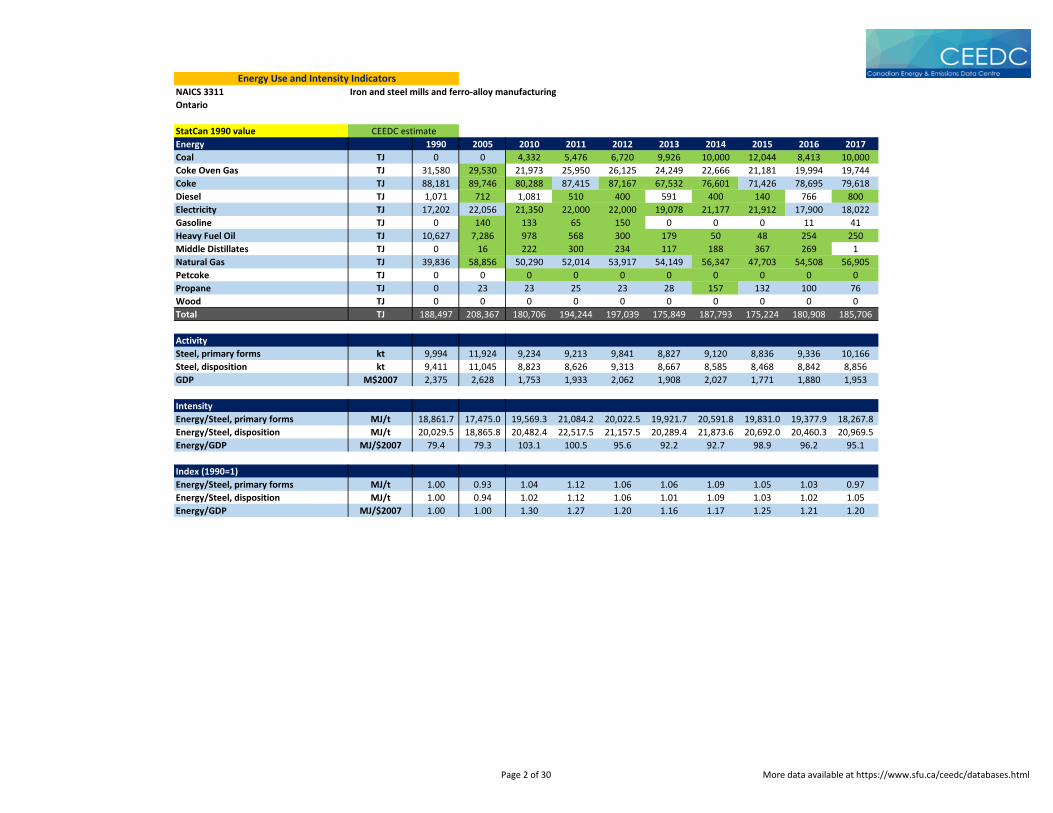
NAICS 3311 Iron and steel mills and ferro-alloy manufacturing
Ontario
StatCan 1990 value
Energy 1990 2005 2010 2011 2012 2013 2014 2015 2016 2017
Coal TJ 0 0 4,332 5,476 6,720 9,926 10,000 12,044 8,413 10,000
Coke Oven Gas TJ 31,580 29,530 21,973 25,950 26,125 24,249 22,666 21,181 19,994 19,744
Coke TJ 88,181 89,746 80,288 87,415 87,167 67,532 76,601 71,426 78,695 79,618
Diesel TJ 1,071 712 1,081 510 400 591 400 140 766 800
Electricity TJ 17,202 22,056 21,350 22,000 22,000 19,078 21,177 21,912 17,900 18,022
Gasoline TJ 0 140 133 65 150 0 0 0 11 41
Heavy Fuel Oil TJ 10,627 7,286 978 568 300 179 50 48 254 250
Middle Distillates TJ 0 16 222 300 234 117 188 367 269 1
Natural Gas TJ 39,836 58,856 50,290 52,014 53,917 54,149 56,347 47,703 54,508 56,905
Petcoke TJ 0 0 0 0 0 0 0 0 0 0
Propane TJ 0 23 23 25 23 28 157 132 100 76
Wood TJ 0 0 0 0 0 0 0 0 0 0
Total TJ 188,497 208,367 180,706 194,244 197,039 175,849 187,793 175,224 180,908 185,706
Activity
Steel, primary forms kt 9,994 11,924 9,234 9,213 9,841 8,827 9,120 8,836 9,336 10,166
Steel, disposition kt 9,411 11,045 8,823 8,626 9,313 8,667 8,585 8,468 8,842 8,856
GDP M$2007 2,375 2,628 1,753 1,933 2,062 1,908 2,027 1,771 1,880 1,953
Intensity
Energy/Steel, primary forms MJ/t 18,861.7 17,475.0 19,569.3 21,084.2 20,022.5 19,921.7 20,591.8 19,831.0 19,377.9 18,267.8
Energy/Steel, disposition MJ/t 20,029.5 18,865.8 20,482.4 22,517.5 21,157.5 20,289.4 21,873.6 20,692.0 20,460.3 20,969.5
Energy/GDP MJ/$2007 79.4 79.3 103.1 100.5 95.6 92.2 92.7 98.9 96.2 95.1
Index (1990=1)
Energy/Steel, primary forms MJ/t 1.00 0.93 1.04 1.12 1.06 1.06 1.09 1.05 1.03 0.97
Energy/Steel, disposition MJ/t 1.00 0.94 1.02 1.12 1.06 1.01 1.09 1.03 1.02 1.05
Energy/GDP MJ/$2007 1.00 1.00 1.30 1.27 1.20 1.16 1.17 1.25 1.21 1.20
Energy Use and Intensity Indicators
CEEDC estimate
Page 2 of 30 More data available at https://www.sfu.ca/ceedc/databases.html
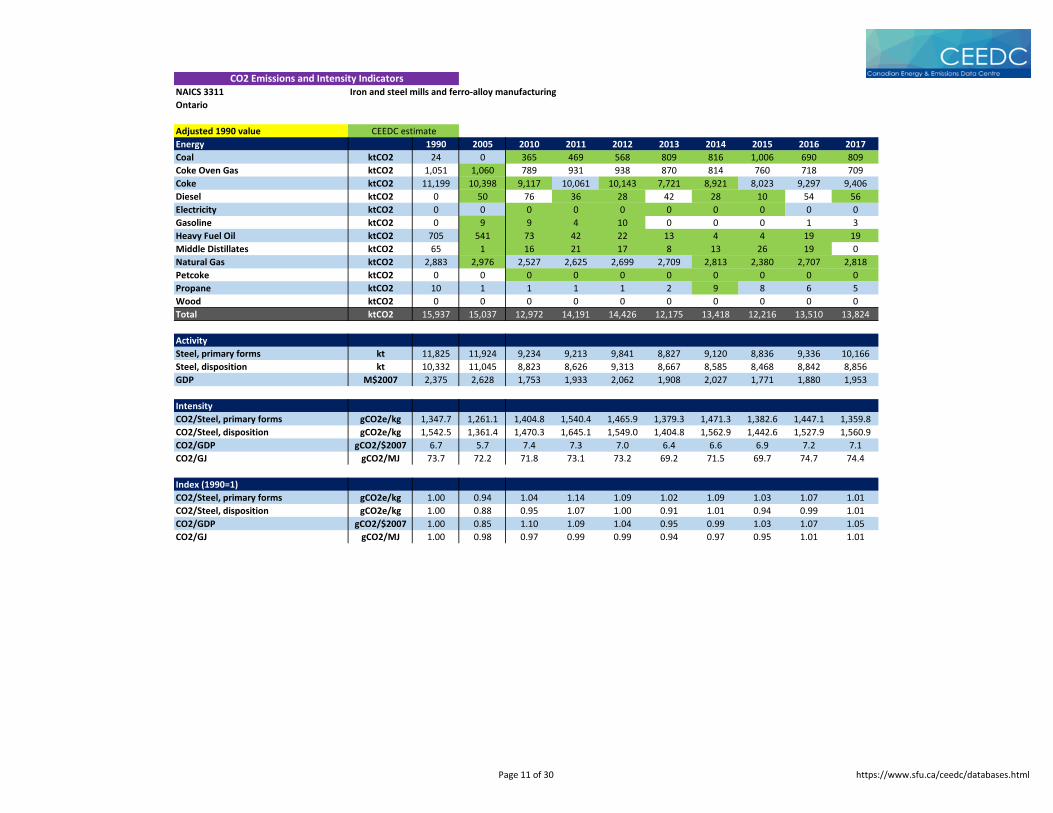
NAICS 3311 Iron and steel mills and ferro-alloy manufacturing
Ontario
Adjusted 1990 value
Energy 1990 2005 2010 2011 2012 2013 2014 2015 2016 2017
Coal ktCO2 24 0 365 469 568 809 816 1,006 690 809
Coke Oven Gas ktCO2 1,051 1,060 789 931 938 870 814 760 718 709
Coke ktCO2 11,199 10,398 9,117 10,061 10,143 7,721 8,921 8,023 9,297 9,406
Diesel ktCO2 0 50 76 36 28 42 28 10 54 56
Electricity ktCO2 0 0 0 0 0 0 0 0 0 0
Gasoline ktCO2 0 9 9 4 10 0 0 0 1 3
Heavy Fuel Oil ktCO2 705 541 73 42 22 13 4 4 19 19
Middle Distillates ktCO2 65 1 16 21 17 8 13 26 19 0
Natural Gas ktCO2 2,883 2,976 2,527 2,625 2,699 2,709 2,813 2,380 2,707 2,818
Petcoke ktCO2 0 0 0 0 0 0 0 0 0 0
Propane ktCO2 10 1 1 1 1 2 9 8 6 5
Wood ktCO2 0 0 0 0 0 0 0 0 0 0
Total ktCO2 15,937 15,037 12,972 14,191 14,426 12,175 13,418 12,216 13,510 13,824
Activity
Steel, primary forms kt 11,825 11,924 9,234 9,213 9,841 8,827 9,120 8,836 9,336 10,166
Steel, disposition kt 10,332 11,045 8,823 8,626 9,313 8,667 8,585 8,468 8,842 8,856
GDP M$2007 2,375 2,628 1,753 1,933 2,062 1,908 2,027 1,771 1,880 1,953
Intensity
CO2/Steel, primary forms gCO2e/kg 1,347.7 1,261.1 1,404.8 1,540.4 1,465.9 1,379.3 1,471.3 1,382.6 1,447.1 1,359.8
CO2/Steel, disposition gCO2e/kg 1,542.5 1,361.4 1,470.3 1,645.1 1,549.0 1,404.8 1,562.9 1,442.6 1,527.9 1,560.9
CO2/GDP gCO2/$2007 6.7 5.7 7.4 7.3 7.0 6.4 6.6 6.9 7.2 7.1
CO2/GJ gCO2/MJ 73.7 72.2 71.8 73.1 73.2 69.2 71.5 69.7 74.7 74.4
Index (1990=1)
CO2/Steel, primary forms gCO2e/kg 1.00 0.94 1.04 1.14 1.09 1.02 1.09 1.03 1.07 1.01
CO2/Steel, disposition gCO2e/kg 1.00 0.88 0.95 1.07 1.00 0.91 1.01 0.94 0.99 1.01
CO2/GDP gCO2/$2007 1.00 0.85 1.10 1.09 1.04 0.95 0.99 1.03 1.07 1.05
CO2/GJ gCO2/MJ 1.00 0.98 0.97 0.99 0.99 0.94 0.97 0.95 1.01 1.01
CO2 Emissions and Intensity Indicators
CEEDC estimate
Page 11 of 30 https://www.sfu.ca/ceedc/databases.html

NAICS 3311 Iron and steel mills and ferro-alloy manufacturing
Ontario
StatCan 1990 value
Energy 1990 2005 2010 2011 2012 2013 2014 2015 2016 2017
Coal ktCO2 0 0 365 469 568 809 816 1,006 690 809
Coke Oven Gas ktCO2 1,166 1,060 789 931 938 870 814 760 718 709
Coke ktCO2 10,492 10,398 9,117 10,061 10,143 7,721 8,921 8,023 9,297 9,406
Diesel ktCO2 74 50 76 36 28 42 28 10 54 56
Electricity ktCO2 0 0 0 0 0 0 0 0 0 0
Gasoline ktCO2 0 9 9 4 10 0 0 0 1 3
Heavy Fuel Oil ktCO2 804 541 73 42 22 13 4 4 19 19
Middle Distillates ktCO2 0 1 16 21 17 8 13 26 19 0
Natural Gas ktCO2 2,027 2,976 2,527 2,625 2,699 2,709 2,813 2,380 2,707 2,818
Petcoke ktCO2 0 0 0 0 0 0 0 0 0 0
Propane ktCO2 0 1 1 1 1 2 9 8 6 5
Wood ktCO2 0 0 0 0 0 0 0 0 0 0
Total ktCO2 14,563 15,037 12,972 14,191 14,426 12,175 13,418 12,216 13,510 13,824
Activity
Steel, primary forms kt 9,994 11,924 9,234 9,213 9,841 8,827 9,120 8,836 9,336 10,166
Steel, disposition kt 9,411 11,045 8,823 8,626 9,313 8,667 8,585 8,468 8,842 8,856
GDP M$2007 2,375 2,628 1,753 1,933 2,062 1,908 2,027 1,771 1,880 1,953
Intensity
CO2/Steel, primary forms gCO2e/kg 1,457.2 1,261.1 1,404.8 1,540.4 1,465.9 1,379.3 1,471.3 1,382.6 1,447.1 1,359.8
CO2/Steel, disposition gCO2e/kg 1,547.4 1,361.4 1,470.3 1,645.1 1,549.0 1,404.8 1,562.9 1,442.6 1,527.9 1,560.9
CO2/GDP gCO2/$2007 6.1 5.7 7.4 7.3 7.0 6.4 6.6 6.9 7.2 7.1
CO2/GJ gCO2/MJ 77.3 72.2 71.8 73.1 73.2 69.2 71.5 69.7 74.7 74.4
Index (1990=1)
CO2/Steel, primary forms gCO2e/kg 1.00 0.87 0.96 1.06 1.01 0.95 1.01 0.95 0.99 0.93
CO2/Steel, disposition gCO2e/kg 1.00 0.88 0.95 1.06 1.00 0.91 1.01 0.93 0.99 1.01
CO2/GDP gCO2/$2007 1.00 0.93 1.21 1.20 1.14 1.04 1.08 1.12 1.17 1.15
CO2/GJ gCO2/MJ 1.00 0.93 0.93 0.95 0.95 0.90 0.92 0.90 0.97 0.96
CO2 Emissions and Intensity Indicators
CEEDC estimate
Page 12 of 30 https://www.sfu.ca/ceedc/databases.html

NAICS 3311 Iron and steel mills and ferro-alloy manufacturing
Ontario
Adjusted 1990 value
Energy 1990 2005 2010 2011 2012 2013 2014 2015 2016 2017
Coal ktCO2e 24 0 366 470 570 812 818 1,009 692 811
Coke Oven Gas ktCO2e 1,071 1,080 804 949 955 887 829 775 731 722
Coke ktCO2e 11,221 10,419 9,135 10,082 10,163 7,737 8,939 8,040 9,315 9,424
Diesel ktCO2e 0 52 79 37 29 43 29 10 56 59
Electricity ktCO2e 0 0 0 0 0 0 0 0 0 0
Gasoline ktCO2e 0 9 9 4 10 0 0 0 1 3
Heavy Fuel Oil ktCO2e 710 545 73 42 22 13 4 4 19 19
Middle Distillates ktCO2e 65 1 16 21 17 8 13 26 19 0
Natural Gas ktCO2e 2,899 2,993 2,541 2,639 2,714 2,724 2,829 2,393 2,722 2,834
Petcoke ktCO2e 0 0 0 0 0 0 0 0 0 0
Propane ktCO2e 10 1 1 2 1 2 10 8 6 5
Wood ktCO2e 0 0 0 0 0 0 0 0 0 0
Total ktCO2e 16,000 15,100 13,025 14,247 14,482 12,227 13,471 12,264 13,562 13,877
Activity
Steel, primary forms kt 11,825 11,924 9,234 9,213 9,841 8,827 9,120 8,836 9,336 10,166
Steel, disposition kt 10,332 11,045 8,823 8,626 9,313 8,667 8,585 8,468 8,842 8,856
GDP M$2007 2,375 2,628 1,753 1,933 2,062 1,908 2,027 1,771 1,880 1,953
Intensity
GHG/Steel, primary forms gCO2e/kg 1,353.1 1,266.4 1,410.5 1,546.5 1,471.6 1,385.2 1,477.1 1,388.0 1,452.6 1,365.0
GHG/Steel, disposition gCO2e/kg 1,548.6 1,367.2 1,476.3 1,651.6 1,555.1 1,410.8 1,569.1 1,448.3 1,533.8 1,566.9
GHG/GDP gCO2e/$2007 6.7 5.7 7.4 7.4 7.0 6.4 6.6 6.9 7.2 7.1
GHG/GJ gCO2e/MJ 74.0 72.5 72.1 73.3 73.5 69.5 71.7 70.0 75.0 74.7
Index (1990=1)
GHG/Steel, primary forms gCO2e/kg 1.00 0.94 1.04 1.14 1.09 1.02 1.09 1.03 1.07 1.01
GHG/Steel, disposition gCO2e/kg 1.00 0.88 0.95 1.07 1.00 0.91 1.01 0.94 0.99 1.01
GHG/GDP gCO2e/$2007 1.00 0.85 1.10 1.09 1.04 0.95 0.99 1.03 1.07 1.05
GHG/GJ gCO2e/MJ 1.00 0.98 0.97 0.99 0.99 0.94 0.97 0.95 1.01 1.01
GHG Emissions and Intensity Indicators
CEEDC estimate
Page 21 of 30 https://www.sfu.ca/ceedc/databases.html

NAICS 3311 Iron and steel mills and ferro-alloy manufacturing
Ontario
StatCan 1990 value
Energy 1990 2005 2010 2011 2012 2013 2014 2015 2016 2017
Coal ktCO2e 0 0 366 470 570 812 818 1,009 692 811
Coke Oven Gas ktCO2e 1,188 1,080 804 949 955 887 829 775 731 722
Coke ktCO2e 10,512 10,419 9,135 10,082 10,163 7,737 8,939 8,040 9,315 9,424
Diesel ktCO2e 78 52 79 37 29 43 29 10 56 59
Electricity ktCO2e 0 0 0 0 0 0 0 0 0 0
Gasoline ktCO2e 0 9 9 4 10 0 0 0 1 3
Heavy Fuel Oil ktCO2e 809 545 73 42 22 13 4 4 19 19
Middle Distillates ktCO2e 0 1 16 21 17 8 13 26 19 0
Natural Gas ktCO2e 2,038 2,993 2,541 2,639 2,714 2,724 2,829 2,393 2,722 2,834
Petcoke ktCO2e 0 0 0 0 0 0 0 0 0 0
Propane ktCO2e 0 1 1 2 1 2 10 8 6 5
Wood ktCO2e 0 0 0 0 0 0 0 0 0 0
Total ktCO2e 14,625 15,100 13,025 14,247 14,482 12,227 13,471 12,264 13,562 13,877
Activity
Steel, primary forms kt 9,994 11,924 9,234 9,213 9,841 8,827 9,120 8,836 9,336 10,166
Steel, disposition kt 9,411 11,045 8,823 8,626 9,313 8,667 8,585 8,468 8,842 8,856
GDP M$2007 2,375 2,628 1,753 1,933 2,062 1,908 2,027 1,771 1,880 1,953
Intensity
GHG/Steel, primary forms gCO2e/kg 1,463.5 1,266.4 1,410.5 1,546.5 1,471.6 1,385.2 1,477.1 1,388.0 1,452.6 1,365.0
GHG/Steel, disposition gCO2e/kg 1,554.1 1,367.2 1,476.3 1,651.6 1,555.1 1,410.8 1,569.1 1,448.3 1,533.8 1,566.9
GHG/GDP gCO2e/$2007 6.2 5.7 7.4 7.4 7.0 6.4 6.6 6.9 7.2 7.1
GHG/GJ gCO2e/MJ 77.6 72.5 72.1 73.3 73.5 69.5 71.7 70.0 75.0 74.7
Index (1990=1)
GHG/Steel, primary forms gCO2e/kg 1.00 0.87 0.96 1.06 1.01 0.95 1.01 0.95 0.99 0.93
GHG/Steel, disposition gCO2e/kg 1.00 0.88 0.95 1.06 1.00 0.91 1.01 0.93 0.99 1.01
GHG/GDP gCO2e/$2007 1.00 0.93 1.21 1.20 1.14 1.04 1.08 1.12 1.17 1.15
GHG/GJ gCO2e/MJ 1.00 0.93 0.93 0.95 0.95 0.90 0.92 0.90 0.97 0.96
GHG Emissions and Intensity Indicators
CEEDC estimate
Page 22 of 30 https://www.sfu.ca/ceedc/databases.html