Embed Size (px)
Citation preview

Energy Trust Commercial Strategic Energy Management Pilot
Evaluation Report 2
Prepared by
PWP, Inc.
And
Michaels Energy, Inc.
September 2014

MEMO Date: November 3, 2014 To: Board of Directors
From: Kathleen Belkhayat, Business Sector Project Manager Dan Rubado, Evaluation Project Manager
Subject: Staff Response to the Commercial SEM Evaluation Report 2
Commercial Strategic Energy Management (SEM) has proven to be popular with commercial customers and has become a successful, cost-effective and growing source of savings for Energy Trust since its inception in 2011. This report is the second of two evaluation reports documenting the pilot program through the first two cohorts. Commercial SEM has since transitioned out of pilot status and become a full offering, serving businesses and organizations that operate large commercial buildings and campuses, or control multiple facilities.
This report demonstrates that participants achieved significant energy savings with SEM, were satisfied with the program, found it to be very valuable and were motivated to keep it up over time. Many of the recommendations made in this report are to further refine the delivery of SEM in areas that are working well or are related to energy tracking and the methods used to quantify savings. For instance, the program will be updating and simplifying the template for the summary reports that are provided to Energy Trust by the implementation contractor at the end of the engagement. The program will also be reviewing the procedures used to model energy use and compute savings. In particular, clear criteria will be defined for selecting a single baseline period to use in creating the facility energy models. They will also revisit the linear extrapolation method used to estimate savings for the following year. In addition, the program will determine the best way to handle buildings that realize negative savings and how they will be pooled with other buildings to calculate a participant’s overall savings.
The cohort approach to SEM, in which a group of participants attend a series of workshops together, was shown to be particularly effective and will continue to be expanded. On the other hand, the corporate, or one-on-one approach to SEM, will no longer be promoted by Energy Trust, although it will still be available on a limited basis. Other recent program changes include a shift to a Program Delivery Contractor (PDC) structure. Newly hired PDCs now have annual goals and budgets and will assume responsibility for recruiting participants, providing SEM training and services to participants, and quantifying the resulting energy savings. This change coincided with Energy Trust’s effort to develop standardized SEM curriculum to consolidate the best practices for teaching SEM and provide a consistent customer experience. In addition, the program is developing a more robust “SEM Continuation” offering, where customers can receive SEM services and technical support year after year.
Going forward, Commercial SEM will be evaluated like other Energy Trust programs with a regular cycle of process and impact evaluations.

Table of Contents
Executive Summary ......................................................................................................................... i
1. Introduction ................................................................................................................................. 1
2. Program Activities -- Year 2……………………………………………………………………2
3. Evaluation Goals and Scope ....................................................................................................... 8
4. Evaluation Methodology ............................................................................................................. 9
5. Results ....................................................................................................................................... 10
Impact Evaluation ............................................................................................................. 10
Process Evaluation ............................................................................................................ 17
6. Conclusions and Recommendations ......................................................................................... 28
Appendix A ................................................................................................................................... 32

SEM Year 2 Evaluation – Final – 9-30-14 Page i
Executive Summary This report presents the results of the evaluation of Energy Trust of Oregon’s Commercial
Strategic Energy Management (SEM) pilot through 2013. As the second of two reports for this
initiative, this report evaluates savings and program delivery for second year participants and
also considers savings in the year following participation for organizations that participated in
Year 1. Commercial SEM is a program offering designed to deliver comprehensive energy
services to selected large customers focused on behavioral and operational changes, with
recommendations for capital projects that would be eligible for incentives from other Energy
Trust programs. Energy Trust has contracted with two Commercial Technical Service Providers
(CTSPs) to deliver integrated energy analysis and training to large commercial customers to
achieve operational savings and to help develop long term plans for energy efficiency. The
program currently has two approaches to SEM delivered by different contractors: the Cohort
track and Corporate, or one-on-one, track.
The goals of the Commercial SEM evaluation were to ensure that the initiative is achieving the
projected level of energy savings at a reasonable cost and to provide feedback on program design
and implementation. The evaluation was designed to help Energy Trust decide how best to
integrate SEM as a standard offering within the Existing Buildings program.
Key findings from this report are summarized below.
Overall, our evaluation indicates that the application of SEM to commercial customers is
viable, and a worthwhile use of Energy Trust’s resources, both as an initiative to capture
immediate savings and as a means of transforming the way existing buildings are managed.
Getting SEM thoroughly established in an organization takes time. Even the one-year
engagement used by the Commercial SEM pilot may not be long enough for such
organizational changes as the actual adoption of an Energy Management Plan and the
empowerment of an organization-wide Energy Management Team to become ingrained into
the organizational culture. Participants clearly value and respond to ongoing outside expert
assistance, as shown by the significantly greater savings for participants who continued their
engagement with the CTSP in the second year.
The cohort approach appears to be more cost-effective than the on-on-one approach in
helping organizations improve the efficiency of their energy management. Moreover, the
exchange of ideas between facility managers from different organizations (or, to a lesser
extent, managers of geographically dispersed buildings within a single organization) was one
of the most highly valued features of the SEM workshops and meetings.

SEM Year 2 Evaluation – Final – 9-30-14 Page ii
Overall, the SEM approach is appropriate for most of the participants selected, although one
participant had such a wide-ranging retrofit project going on concurrent with SEM that
calculation of savings attributable to SEM was very difficult.
Commercial SEM uses a regression analysis approach where predicted energy use is
compared to actual energy use over time. The difference is the savings, which is tracked over
time using a cumulative sum (CUSUM) to analyze the rate of savings. While CUSUM
regression analysis provides an acceptable approach for estimating aggregate kWh and
therms savings from the numerous operational and behavioral changes that would be
expected to result from implementation of SEM in commercial buildings, we had concerns
regarding the non-standard CUSUM approach applied to the Cohort 2 participants. Because
both the baseline period and the post period are compared to a pre period, no clear
assessment could be made to the relative accuracy of the model for the baseline period.
Typically, this period would be the modeled period and the accuracy could be easily assessed
by looking at the deviation of each month relative to the model.
Similarly, the reports themselves were difficult to interpret and lacked context. The content
provided was significant and important, but the lack of clarifying text made it hard to
understand, particularly in light of the use of comments and acronyms rather than sentences
and descriptions, which are unlikely to be understood by most readers.
Projections of annual savings are made using too little data. Linear extrapolation of post-
engagement savings to estimate annual savings using just a few months of post-baseline data
is potentially misleading, and abnormal weather can dramatically over- or understate savings.
There may be bias in the overall estimate of savings in that buildings with negative savings
are set to zero rather than being pooled with those that have positive savings.
Because savings are a small percentage of overall usage, the CUSUM analysis may be more
subject to error, particularly when limited information is provided on the sources of savings.
Use of the Monitoring, Targeting and Reporting (MT&R) systems tends to slip over time, in
part because it is a time consuming process whose statistical foundations are not always
understood by participants.
The more comprehensive and meaningful a formal Strategic Energy Management Plan will
be to the overall organization, the longer it takes to design and implement, with internal
approval processes often stretching this to the end of the initial engagement or beyond.

SEM Year 2 Evaluation – Final – 9-30-14 Page iii
Recommendations
We believe the cohort approach to commercial SEM is suitable for inclusion in the Existing
Buildings program, but the individual approach seems to require too many resources relative
to the savings achieved.
Structure the SEM offering within the Existing Buildings program as a multi-year
commitment, with the intensive first-year effort followed by, for example, detailed quarterly
reviews with the CTSP. In addition, savings achieved by applying SEM to additional
buildings within Energy Trust territory in the second year should be counted in the savings
attributed to the engagement.
Focus on multi-site customers when recruiting, and avoid recruiting firms with extensive
capital projects or energy services contracts underway shortly before participation or planned
during the participation period, particularly if those projects are more complex than simple
equipment change-outs with well-defined savings.
Since one of the primary benefits of the CUSUM analysis is that it clearly presents the total
savings accrued to date on the y-axis, the standard approach, where the baseline period
immediately precedes the participation period, should be used and any deviations from it
should be clearly explained.
Expand the text for the reports to provide more clarity on the information presented in tables
and graphs and to include more clear descriptions of findings and actions, reducing use of
acronyms, especially non-standard acronyms. In addition, findings should be more clearly
organized to present: (1) a description of the finding, (2) the action to be taken to correct the
operation based on the finding and (3) a description of how this action results in a reduction
in energy use (and some estimate if possible).
A more accurate approach toward the annualization of savings could be achieved by
modeling the savings based on expected operation; for example, by relating savings to
heating or cooling degree days over the rest of the forecast period. Alternatively, if enough
post-engagement time has passed to provide sufficient data points, a model (similar to the
baseline models developed above) could be developed to relate energy usage to parameters
such as days, temperature, or other driving factors as forecast for the remainder of the year.
For most of the projects reviewed ignoring buildings with negative savings does not
significantly alter the claimed savings; however, the net savings when these increases in
usage are factored in should be examined and discussed to determine, for example, if people
were moved from one building to another with an associated shift in usage.

SEM Year 2 Evaluation – Final – 9-30-14 Page iv
The potential for error in the small percentage savings from SEM heightens the need for
clearer, better documentation of changes that could be responsible for the lower usage
observed in the model results. Given the difficulty of linking changes in usage to specific
actions, it is important that the variance logs be comprehensive in the operational changes
tracked at the time they are implemented so that energy managers have a detailed record to
refer to when investigating changes in usage. The variance logs should be regularly updated,
including confirmation that previously implemented changes continue in place over time.
Emphasize to participants the importance of continuing to monitor and respond to monthly
energy usage data, with examples of how alternative analysis tools can serve this purpose.
Make ongoing consultation with the organization on the Energy Plan one of the features of
second year participation and, as recommended in the year 1 report, consider offering an
incremental incentive when the participant’s organization can prove that it has formally
adopted a plan that is approved by the CTSP.
To encourage the valuable exchange of information among energy managers at different
companies, devote some time during each workshop or meeting to allow participants to share
their successes and failures. For the one-on-one approach, this feature can best be exploited
by working with organizations that have multiple sites; if those are geographically dispersed,
use conference calls or web-based meetings to reduce cost while still sharing information.

SEM Year 2 Evaluation – Final – 9-30-14 Page 1
1. Introduction
This report presents the results of the evaluation of Energy Trust of Oregon’s Commercial
Strategic Energy Management (SEM) pilot through 2013. This is the second of two reports for
this initiative. The first report1 evaluated the initial year of participation and 1) analyzed the
program’s savings methodology to determine if claimed savings were appropriate and 2)
assessed the effectiveness of program delivery for organizations whose first-year participation
ended in late 2012 and early 2013. This report evaluates savings and program delivery for second
year participants and also considers savings in the year following participation for organizations
that participated in Year 1.
Commercial SEM is a limited program offering designed to deliver comprehensive energy
services to selected large customers focused on behavioral and operational changes, with
recommendations for capital projects that would be eligible for incentives from other Energy
Trust programs. Energy Trust contracted with two Commercial Technical Service Providers
(CTSPs) to deliver integrated energy analysis and training to large commercial customers to
achieve operational savings and to help develop long term plans for energy efficiency. The
program currently has two approaches to SEM delivered by different contractors: a cohort track
and an individual track.
The cohort approach to SEM was managed by one of the two CTSPs. For 2013, this
CTSP led a cohort (Cohort 2) of 6 customers (one of which dropped out mid-year)
through a process of training workshops, opportunity assessments, one-on-one coaching
and Monitoring, Tracking & Reporting (MT&R) to help them incorporate energy
management practices into their core business. While the initial program plan called for
participants to engage with the CTSP for just one year, two of the 2012 (Cohort 1)
participants also continued to receive technical assistance in implementing and sustaining
SEM through 2013.
The individual approach, called Corporate SEM, was managed by the other CTSP and
provides a menu of service options to individual customers, either as a comprehensive
package or a custom selection that best meets the organization’s energy objectives.
Services may include one-on-one opportunity assessment, Energy Information System
installation, organizational assessment, strategic planning and implementation support of
a strategic action plan. The Corporate CTSP enrolled two participants for 2012, but
completed the one year SEM engagement for only one of those in time to be included in
1 http://energytrust.org/library/reports/SEM_Report.pdf, Energy Trust Commercial Strategic Energy Management Pilot,
Evaluation Report 1 - Public Version, September 2013

SEM Year 2 Evaluation – Final – 9-30-14 Page 2
the Year 1 evaluation. In 2013 the CTSP completed the first year activities for the second
of two first-year participants, and also enrolled a second 2013 participant that received
the full range of services.
For both approaches, customers receive extensive technical assistance and evaluation of their
energy savings as well as incentives ($0.02/kWh and $0.20/therm), based on the estimated
annual savings. Savings are determined from a top down analysis of behavioral and operations
and maintenance changes, which are estimated by analyzing facility energy data at the end of the
first and second years of involvement. Firms that actively participate for the second year receive
the same incentives for second year savings. For firms that do not participate in the second year,
additional second year savings are still calculated,
Commercial SEM did not directly involve capital improvements, though capital projects may be
identified and implemented as a result of a participant receiving the SEM services.
Program Activities – Year 2
COHORT CTSP In implementing its approach, the Cohort CTSP recruited six participants for its second year
cohort (cohort 2), initiating recruitment in mid-2012 and conducting a kickoff meeting with all
participants on January 16, 2013. One participant – a shopping center – dropped out after the first
two workshops, citing a lack of resources to devote to the SEM engagement. A brief summary of
each of the remaining five cohort 2 participants – which will be called Cohort-2P1 through
Cohort-2P5 in the final report to maintain confidentiality – is presented below.
Cohort-2P1
Cohort-2-P1 is an Oregon college. Cohort-2P1 has focused on ‘green’ practices as evidenced by
its sustainability council, a group of students, faculty, and staff. The council has existed in some
form since the late 1990s. Its current charge is to review, prioritize, and, as appropriate, act on
the recommendations of its 2010-11 Sustainability Task Force. The Cohort CTSP began
recruiting Cohort-2P1 for SEM participation in November of 2012, with discussions related to
different types of engagement activities and opportunity assessments. The request to participate
was signed by Cohort-2P1 on January 5, 2013.
Cohort-2P1 has signed the American College & University President’s Climate Commitment and
is adopting SEM to advance its energy related sustainability efforts. During the engagement,
Cohort-2P1 drafted an Energy Management Policy and initiated a review process to adopt the
policy at the campus level. Cohort-2P1’s Sustainability Manager is working on expanding the
breadth of the Energy Team to better address and represent Cohort-2P1 organizationally, and an
SEM plan is under development. Cohort-2P1’s Sustainability Manager is developing a campus
wide education and outreach campaign, including student employment/engagement; using the

SEM Year 2 Evaluation – Final – 9-30-14 Page 3
proprietary Deck energy monitoring system to create dashboards to inform those on campus
about energy use; staff energy awareness development days; a sustainability rewards program
and other creative solutions to create a proactive campus culture.
Opportunity assessments have been conducted on several buildings, and opportunity registers
have been created. Cohort-2P1 has been working with their electric utility to map its meters to
specific buildings. Cohort-2P1’s Deck monitoring system and the monitoring, tracking and
reporting (MT&R) models are being used to track building performance and determine energy
savings. Cohort-2P1 recently hired additional facilities staff and has made organizational
adjustments within its facilities group to better address building performance issues and follow-
through. Cohort-2P1 has building operational issues due to controls complexities and a lack of
system documentation. Cohort-2P1 is looking to systematically upgrade/replace aging building
controls infrastructure, establish a building commissioning process, increase O&M staff training
and bring more building services in-house.
Cohort-2P2
Recruiting for Cohort-2P2 began in June of 2012, with discussions related to different types of
engagement activities and opportunity assessments. The enrollment form officially requesting
participation was signed by Cohort-2P2 on November 16, 2012.
A clothing company, Cohort-2P2 wanted to place emphasis on its corporate office buildings
through the SEM engagement. Cohort-2P2 intended to make its sustainability program more
encompassing by including energy in their overall company goals and objectives. Metrics were
already in place for energy management in manufacturing, but no metrics had been established
for the corporate office buildings.
Cohort-2P2 sees its SEM initiative and an important part of its strong and sustained commitment
to resource management and environmental stewardship. Organizationally, Cohort-2P2 has
drafted an Energy Management Policy that is being vetted at the senior management level to gain
organizational buy-in necessary for adoption. Cohort-2P2 Facilities is planning to expand its
energy team beyond the facilities group, and is introducing energy management to others in the
organization. Cohort-2P2’s SEM Energy Champion is crafting a multi-year SEM plan using the
proposed Energy Management Policy as the foundation. Cohort-2P2 is also developing an
employee and building occupant engagement plan and activities, as well as site specific facility
plans (including operational improvements, capital projects, and behavioral activities).
Dashboards have been created to provide information on SEM initiative progress to facilities
staff and management, as well as executive management.
Cohort-2P2 included about one-third of its Oregon corporate office buildings in this SEM
engagement. Building specific opportunity registers were created and Cohort-2P2 Energy Team
members met with O&M technicians weekly for follow through on high priority items. Night

SEM Year 2 Evaluation – Final – 9-30-14 Page 4
audits were conducted on six buildings, and collaboration with custodial operations pursued
more day cleaning (and reduce night time energy needs). Cohort-2P2 is actively tracking
building performance using Energy Expert, the monitoring, tracking & reporting (MT&R)
models, and its energy accounting software. Cohort-2P2 Energy Team members are working
with facilities’ HVAC team on tracking building performance and taking corrective action as
needed (particularly building scheduling and system controls).
Cohort-2P3
Cohort-2P3, another Oregon college, considers itself a leader in sustainability, features a strong
sustainability program and is active in the energy efficiency industry as a whole. Recruiting for
SEM participation began in November of 2012, with discussions related to different types of
engagement activities and opportunity assessments. The enrollment form officially requesting
participation was signed by Cohort-2P3 on January 3, 2013.
Cohort-2P3 is moving forward with SEM from a technical and organizational perspective.
Organizationally, Cohort-2P3 has drafted and is currently vetting its Energy Management Policy,
which is related to Cohort-2P3’s Climate Action Plan. The process for policy adoption for the
entire college is complex and requires stakeholder feedback from staff, faculty, student
government and executive management. Cohort-2P3 is creating a green revolving fund which
can be used to fund projects, with the fund being repaid through utility budget savings and
project incentives. A part-time student energy education coordinator position has been
established to help develop and implement a campus wide communications plan and engagement
activities. Cohort-2P3 is developing its multi-year comprehensive SEM plan, bringing forward a
number of energy efficiency items to its capital advisory committee (space management,
deferred/preventive maintenance, campus standards), and looking to establish a new procurement
platform that tracks purchases and specifies Energy Star.
On the technical front, Cohort-2P3 has conducted building opportunity assessments, with
opportunity registers containing numerous areas of improvement that are readily correctable and
deployable across campus. Cohort-2P3 is incorporating these improvements into its facility
maintenance “work order” activities as time allows, and has noted resource constraints as a
limitation in moving forward more aggressively. Cohort-2P3 intends to use its new green
revolving fund for initial implementation of retro-commissioning opportunities. Cohort-2P3 is
also moving forward with deployment of enhanced campus metering and sub-metering for better
tracking of building level energy use (through the creation of building specific facility level
dashboards). Currently, multiple buildings are on the same meters. Cohort-2P3 will budget utility
costs at the building level for the first time in FY 2014.

SEM Year 2 Evaluation – Final – 9-30-14 Page 5
Cohort-2P4
Recruiting for Cohort-2P4 began in November of 2012, with discussions related to different
types of engagement activities and opportunity assessments. The enrollment form officially
requesting participation was signed by Cohort-2P4 on January 16, 2013.
Cohort-2P4 is a convention center, drawing events of all types - from industry tradeshows to
meetings, auctions and private receptions. Prior to participating in SEM, Cohort-2P4 had already
earned LEED® for Existing Buildings certification at the Platinum level from the U.S. Green
Building Council. The convention center operates with a pledge to continually reduce its
environmental footprint, and to educate its staff, clients and visitors on the importance of
working together toward a sustainable future.
Since enrolling in SEM, Cohort-2P4 has actively applied a strategic approach to energy
management, and it took significant steps forward in 2013. Organizational efforts include
development and approval of an Energy Management Policy, creation of a Sustainability Team,
with a sub-committee focused on energy efficiency, and progress in crafting a multi-year SEM
plan. The Energy Management Policy has strong executive support and aligns Cohort-2P4’s
SEM activity with overall organizational goals. As part of its employee engagement activities,
Cohort-2P4 launched an energy efficiency challenge to all staff at its December 2013 retreat.
Cohort-2P4 also identified barriers/misconceptions about energy use, and is developing
resources and suggested best management practices for all staff.
In addition to integrating its LEED existing buildings re-certification and retro-commissioning
efforts with its SEM activity, Cohort-2P4 has completed multiple projects, including changes
that allow Cohort-2P4 to shut down its boilers over the summer. Cohort-2P4 has established
energy reduction targets linked to the goal in its Energy Management Policy, and is improving its
preventive maintenance plans and logs, and has created central systems, processes, and
documentation of projects. Cohort-2P4’s annual report will be used to recognize its SEM
achievements, including energy savings, major projects, and staff champions.
Cohort-2P5
Cohort-2P5 is a city government in Oregon. Their facilities division provides O&M, project
management, and property management services to city departments upon request. The city
strives to be a leader in adopting energy efficiency ordinances, and saw enrollment in the SEM
initiative as an opportunity to “Walk the Talk.”
Recruiting for Cohort-2P5 began in November of 2012, with discussions related to different
types of engagement activities and opportunity assessments. The enrollment form officially
requesting participation was signed by Cohort-2P5 on December 27, 2012.

SEM Year 2 Evaluation – Final – 9-30-14 Page 6
Cohort-2P5 continues to work on developing a draft Energy Policy. A Building Opportunities
Assessment workshop and the building walk-throughs were completed, and MT&R regression
models were used for both natural gas and electricity to track building performance and
determine energy savings.
Cohort Summary
The electric and gas energy savings used to calculate incentives for each of the Cohort
participants are reported below, including second year savings for participants in Cohort 1
(detailed information about these participants can be found in Report 1).
Exhibit 1-1 – Cohort 2 Year 1 and Cohort 1 Year 2 SEM Electric and Gas Savings
Cohort SEM Participants
2013 savings from SEM
kWh Therms
Cohort 1
Actively Participated in 2013
Cohort-1P4 1,008,619 30,202
Cohort-1P5 122,774 49,372
Did Not Actively Participate in 2013
Cohort-1P1*
Cohort-1P3**
21,603
Cohort-1P6* 213,560
Cohort-1P7** 163,814 9,475
Cohort-1P2**
Cohort 2
Cohort-2P1 451,339 41,448
Cohort-2P2 2,353,778 39,507
Cohort-2P3 2,006,535 10,511
Cohort-2P4 216,446 82,051
Cohort-2P5 1,062,651 13,007
Total 7,222,142 253,091
* only kWh savings in 2012
** both kWh and therms savings in 2012
CORPORATE CTSP The Corporate CTSP recruited only a single organization (Corporate-2P1) for its individual SEM
approach for 2013, but also completed the participation of 2012 participant Corporate-P2. As
explained in Report 1, Corporate-P2 had launched a campus-wide performance contract
involving numerous equipment retrofits, which complicated the estimation of energy savings

SEM Year 2 Evaluation – Final – 9-30-14 Page 7
from SEM participation. However, some savings were claimed in 2013. For the other year 1
participant, Corporate-P1, no additional savings were claimed for the second year.
Corporate-2P1
Corporate-2P1 is a restaurant chain with about 50 restaurants in Energy Trust’s territory. All of
the restaurants are the same size, roughly 4,000 square feet. Corporate-2P1’s participation in the
SEM initiative grew out of a similar internal program started in 2008 to manage energy use and
to determine why usage was different at restaurants of the same size in different locations.
Having already worked with the Corporate CTSP at several sites previously, Corporate-2P1
started its participation in Energy Trust’s SEM offering in February 2013, running through
December 2013. Corporate-2P1’s financial services department assumed primary responsibility
for program implementation, but also engaged other key departments, including facilities and
training, as well as site level employees throughout the organization. As a result of the
engagement, Corporate-2P1 improved upon current energy management activities to form a
sustaining energy management system. As discussed later, one measure of the change is a
comparison of pre- and post-participation results of an Envinta One 2 Five Energy
Organizational Assessment at the onset and conclusion of the engagement. For Corporate-2P1,
the overall rating went from one to two stars on a one to five scale, indicating some
improvement, but still far below optimal organizational practices.
Corporate-1P2
Corporate-1P2 is a college campus in Oregon. About half of its buildings were enlisted in the
SEM initiative. Corporate-1P2 signed the participation documents in March 2012 and held a
kickoff meeting in April of that year. As noted previously, Corporate-1P2 was probably not a
good candidate for participation because of its simultaneous execution of a campus-wide
performance contract with an energy services company involving a three year, multi-million
program of upgrades to electrical, water, building controls, and mechanical systems, including
two new boilers. While this made separating savings attributable to SEM from those associated
with the performance contract difficult and limited the amount of incentive the participant
received, Corporate-1P2 did build the foundation for longer term SEM within both the facilities
department and other members of the university community. The Corporate CTSP’s work with
the college’s catering department, the custodial staff and students exposed multiple groups to
SEM, but since these other groups do not have direct accountability for energy usage and
savings, the impact of this activity was limited.
Corporate SEM Summary
The electric and gas energy savings used to calculate incentives for both 2012 and 2013
individual approach participants are shown in the table below. Since savings for 2012
participants were not claimed until 2013, the results for the two years are combined.

SEM Year 2 Evaluation – Final – 9-30-14 Page 8
Exhibit 1-2 – Corporate SEM 2012/2013 Electric and Gas Savings
Corporate SEM Participants
2012-2013
Savings from SEM
kWh Therms
Year 1
Corporate-1P1* 101,341 11,364
Corporate-1P2 214,304 0
Year 2
Corporate-2P1 144,386 51,929
Total 460,031 63,293
* Reported and discussed in Evaluation of 2012 program
2. Evaluation Goals The goals of the Commercial SEM evaluation were to ensure that the initiative is achieving the
projected level of energy savings at a reasonable cost and to provide feedback on program design
and implementation. The evaluation was designed to help Energy Trust decide how best to
integrate SEM as a standard offering within the Existing Buildings program, with the goals of:
Documenting SEM processes and project costs. Assessing whether the initiative is
operating effectively and spending money appropriately.
Assessing customer satisfaction, engagement and success with SEM. Investigating
customer persistence with SEM measures, barriers to achieving goals and common
characteristics of customers that benefited the most.
For customers with multiple sites, assessing whether SEM practices are being transferred
to non-participating sites and investigating ways to motivate customers to adopt SEM
practices at all of their sites, including through re-enrollment in the initiative.
Assessing the energy savings calculation methods and assumptions used by the CTSPs to
ensure that they are using a valid approach and that the results provide a clear link
between SEM activities and claimed savings.
Reviewing energy tracking systems for usefulness and accuracy.
Verifying the realized energy savings resulting from SEM measures and their persistence
over time.
Determining to what extent customers initiated capital energy efficiency projects after
participating in SEM.

SEM Year 2 Evaluation – Final – 9-30-14 Page 9
3. Methodology Given the modest scale of participation in the SEM pilot, evaluation methods focused on the
collection and analysis of customer- and project-specific information. By assessing how
individual customers participated in the pilot, what actions they took and what savings they
reported, we were able to understand both the processes and results of the initiative. Both
secondary data – in the form of program materials, documents, and detailed participant- and
building-specific usage and savings data – and primary data from interviews were used to
support this analysis.
A) DOCUMENT REVIEW For this evaluation, we reviewed a broad spectrum of documents, materials, forms, invoices and
project tracking data, with the aim of thoroughly understanding the initiative goals and processes
and how the SEM pilot fits with Energy Trust’s overall strategy for commercial sector energy
savings. Specific items reviewed include:
Program database describing individual participant enrollment and results
Individual participant plans to implement SEM, particularly policy documents adopted
for multiple buildings
Workshop/meeting notes and presentations
Workshop/meeting evaluations completed by participants after each session
Participant opportunity assessments describing the results of walk-through audits
completed by CTSPs at each building
Participant usage models and savings estimates, including the extent to which savings
could be related to specific actions identified by the opportunity assessments and
implemented at participant buildings.
B) PRIMARY DATA Primary data were collected through interviews with program participants, as summarized in
Exhibit 4-1. We interviewed Cohort 1 and Corporate Year 1 (2012) participants who had
continued their engagement in Year 2, Cohort 1 and Corporate Year 1 participants who did not
actively participate in Year 2, and Cohort 2 and Corporate Year 2 participants. In some cases, the
numbers reflect interviews with multiple individuals at a single organization.
Exhibit 4-1 – Interviews Completed
Project Role Count
2012 Participants Active in 2013 3
2012 Participants Not Active in 2013 3
2013 Participants 9
Total 15

SEM Year 2 Evaluation – Final – 9-30-14 Page 10
4. Results
A) IMPACT EVALUATION
Unlike most impact evaluations, where the evaluator develops an independent estimate of energy
savings, the goal in this evaluation was to review the approaches and methods used to calculate
claimed energy savings and determine whether or not they are reasonable. Savings calculations
for all customers are supported by a series of Excel workbooks that show both actual usage and
what usage would have been in the absence of SEM participation.
As described in Report 1, both CTSPs calculated savings for the SEM pilot participants using
“CUSUM” regression analysis to establish an energy use baseline and then calculated savings by
comparing actual usage to usage “predicted” by the regression model under given weather (or
other) conditions. Again, as noted in Report 1, such use of regression analysis to establish a
relationship between energy use and various “independent” variables is well established, having
been employed by EPA on Commercial Building Energy Consumption Survey (CBECS) data,
by Georgia Tech University to model industrial energy consumption, and by Energy Trust and
NEEA to estimate savings for SEM programs targeted to industrial users. The Corporate CTSP
also uses such an approach for other SEM initiatives that it manages.
Using CUSUM regression analysis applied to the SEM savings calculations, there is no explicit
linkage between individual SEM actions and their associated energy savings. Instead, the savings
from SEM typically come from an overall plan that includes numerous small, often incremental
changes in occupant behavior as well as potentially more significant changes in facility
operations. At least in theory, one would expect to be able to observe some link between the
timing of specific actions noted for a participating facility and a resulting drop in usage. Being
able to identify and diagnose increases in usage is certainly promoted as one of the benefits of
SEM; that is, if a jump in usage is observed, the obvious question to ask is what is causing it.
Based on the provided documentation, electric and natural gas savings were claimed for a total of
five Cohort 2 participants. Estimated first year electric savings ranged from 216,446 to 2,353,778
kWh and natural gas savings ranged from 10,511 to 82,051 therms. For the purposes of this
review, three of the five participants were selected for more detailed analysis. Because Cohort-
2P2 and Cohort-2P3 accounted for over 70% of Cohort 2 electric savings, while Cohort-2P2 and
Cohort-2P4 accounted for about two-thirds of gas savings, these were the participants we
focused on, and within those, we looked particularly at the buildings that contributed the most to
savings. The selected participants included 38 buildings and comprised 75% of the Cohort 2 first
year electric savings and 71% of the natural gas savings. For those three participants we focused
on individual buildings that represented at least half the participant’s claimed savings. It should
be noted that the participant with the smallest electric savings in the cohort was selected for
review due to its large gas savings, while the participant with the smallest gas savings was
SEM Year 2 Evaluation – Final – 9-30-14 Page 11
included because of its large electric savings, so that our review covered sites with both large and
small savings for both electricity and gas.
The CTSP used a variation of the standard CUSUM analysis was used to predict the annual
savings for these buildings. A CUSUM analysis uses a regression analysis on a set of billing data
to develop a curve, or characteristic operation, to relate the energy usage for the facility to
different temperatures and other operating conditions. This characteristic operation is then used
to project the expected usage for the building for each month going forward. If the actual billed
usage for the building is less than the projected usage from the curve, then the building has
energy savings for that month. The savings for each month going forward are summed to
determine the expected cumulative savings for the entire year – hence the term CUSUM.
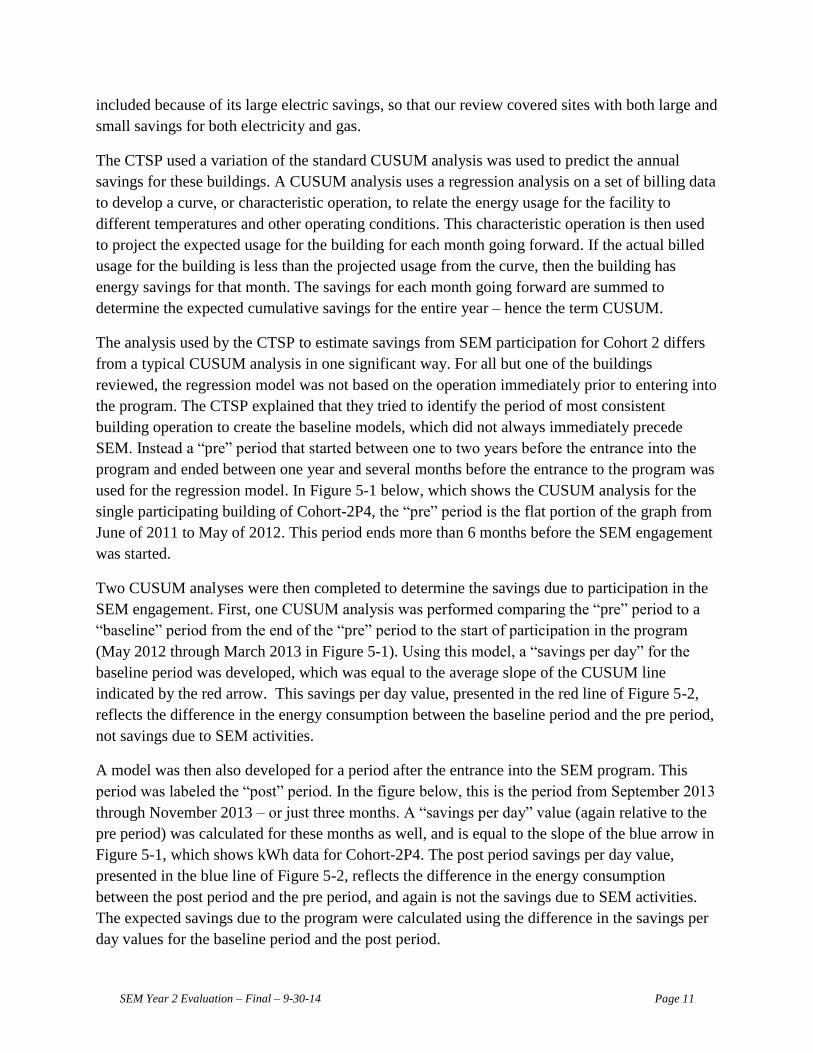
The analysis used by the CTSP to estimate savings from SEM participation for Cohort 2 differs
from a typical CUSUM analysis in one significant way. For all but one of the buildings
reviewed, the regression model was not based on the operation immediately prior to entering into
the program. The CTSP explained that they tried to identify the period of most consistent
building operation to create the baseline models, which did not always immediately precede
SEM. Instead a “pre” period that started between one to two years before the entrance into the
program and ended between one year and several months before the entrance to the program was
used for the regression model. In Figure 5-1 below, which shows the CUSUM analysis for the
single participating building of Cohort-2P4, the “pre” period is the flat portion of the graph from
June of 2011 to May of 2012. This period ends more than 6 months before the SEM engagement
was started.
Two CUSUM analyses were then completed to determine the savings due to participation in the
SEM engagement. First, one CUSUM analysis was performed comparing the “pre” period to a
“baseline” period from the end of the “pre” period to the start of participation in the program
(May 2012 through March 2013 in Figure 5-1). Using this model, a “savings per day” for the
baseline period was developed, which was equal to the average slope of the CUSUM line
indicated by the red arrow. This savings per day value, presented in the red line of Figure 5-2,
reflects the difference in the energy consumption between the baseline period and the pre period,
not savings due to SEM activities.
A model was then also developed for a period after the entrance into the SEM program. This
period was labeled the “post” period. In the figure below, this is the period from September 2013
through November 2013 – or just three months. A “savings per day” value (again relative to the
pre period) was calculated for these months as well, and is equal to the slope of the blue arrow in
Figure 5-1, which shows kWh data for Cohort-2P4. The post period savings per day value,
presented in the blue line of Figure 5-2, reflects the difference in the energy consumption
between the post period and the pre period, and again is not the savings due to SEM activities.
The expected savings due to the program were calculated using the difference in the savings per
day values for the baseline period and the post period.

SEM Year 2 Evaluation – Final – 9-30-14 Page 12
The MT&R workbooks and reports did not contain a description or explanation for the selection
of the date ranges associated with the baseline, pre, or post periods. Additionally the dates did
not appear to be consistent throughout individual projects. For example, for Building 1 of
Cohort-2P3, the post period started on November 2012 for the electric savings, but not until
September 2013 for the natural gas savings.
Figure 5-1 –kWh CUSUM Savings Chart for Cohort-2P4
Because many of the projects completed have less than one full year of operation in the pre
period and/or the post period, the savings are linearly extrapolated for the remainder of the year,
based on the fraction or percent of the year completed in the program. For example, as shown in
Figure 5-2 below, the baseline period for the figure above has a “savings” of 1,812.5 kWh per
day. The post period has a projected savings of 6,936.8 kWh per day. Therefore, the savings due
to the program is the difference between those two values (5,124.3 kWh/day). Based on 365 days
per year, the resulting savings are 1,870,373 kWh. However, 1,653,927 kWh in annual savings
are due to capital projects and not included in the SEM savings, which makes the project savings
attributed to SEM equal to 216,446 kWh.
Figure 5-2 –SEM Savings for Cohort-2P4
Period
Adjusted Baseline
Savings Rate
Avg Daily
Savings Rate
Incremental
Rate
Measured
Savings
Projected
Annual
Savings
Claimed
Capital
Projects Net Savings
5/26/2012-2/27/2013 1812.5
2/28/2013-7/29/2013 3750.0 1937.4 569,993 707,160 1,556,982 -849,822
7/30/2013-11/26/2013 Incremental 6936.8 3186.9 832,421 1,163,213 96,945 1,066,268
1,870,373 1,653,927 216,446
SEM Year 2 Evaluation – Final – 9-30-14 Page 13
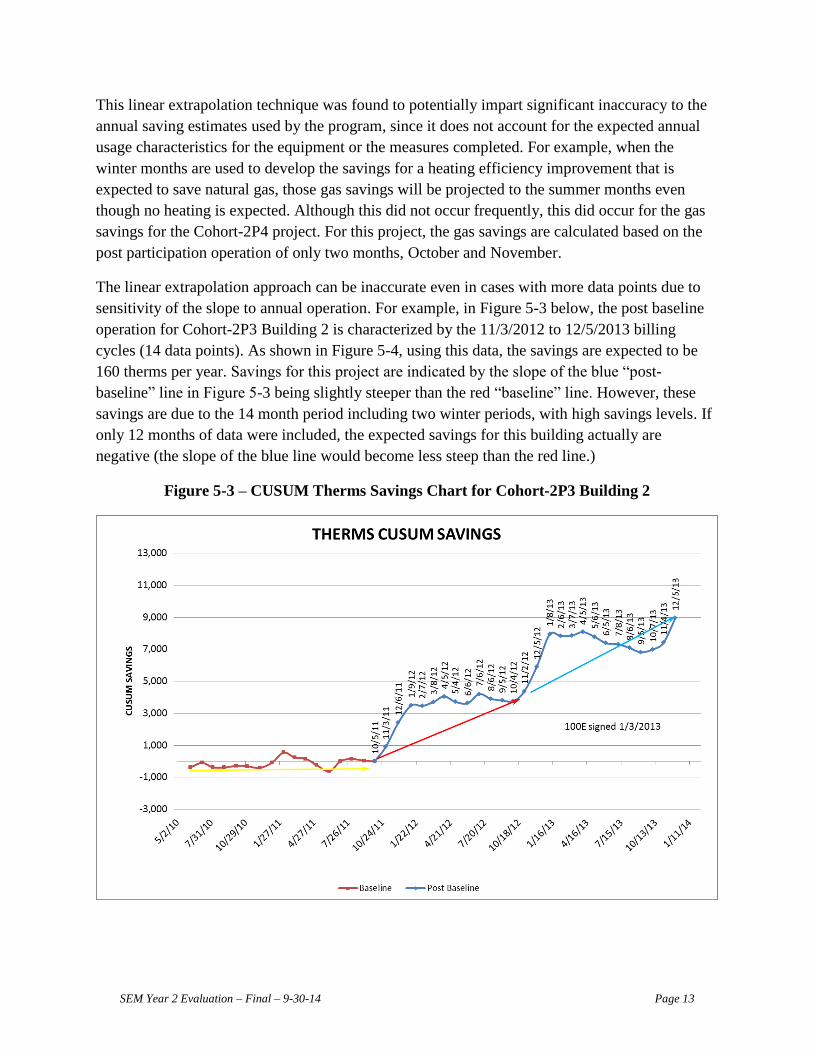
This linear extrapolation technique was found to potentially impart significant inaccuracy to the
annual saving estimates used by the program, since it does not account for the expected annual
usage characteristics for the equipment or the measures completed. For example, when the
winter months are used to develop the savings for a heating efficiency improvement that is
expected to save natural gas, those gas savings will be projected to the summer months even
though no heating is expected. Although this did not occur frequently, this did occur for the gas
savings for the Cohort-2P4 project. For this project, the gas savings are calculated based on the
post participation operation of only two months, October and November.
The linear extrapolation approach can be inaccurate even in cases with more data points due to
sensitivity of the slope to annual operation. For example, in Figure 5-3 below, the post baseline
operation for Cohort-2P3 Building 2 is characterized by the 11/3/2012 to 12/5/2013 billing
cycles (14 data points). As shown in Figure 5-4, using this data, the savings are expected to be
160 therms per year. Savings for this project are indicated by the slope of the blue “post-
baseline” line in Figure 5-3 being slightly steeper than the red “baseline” line. However, these
savings are due to the 14 month period including two winter periods, with high savings levels. If
only 12 months of data were included, the expected savings for this building actually are
negative (the slope of the blue line would become less steep than the red line.)
Figure 5-3 – CUSUM Therms Savings Chart for Cohort-2P3 Building 2

SEM Year 2 Evaluation – Final – 9-30-14 Page 14
Figure 5-4 – SEM Therms Savings for Cohort-2P3 Building 2
Analysis Method Conclusions
Overall, the use of the CUSUM approach to determine the savings levels appears to be
reasonable and appropriate. CUSUM analysis clearly demonstrates savings levels with minimal
effort. However, as applied in the estimation of Cohort 2 savings, we believe the analysis has
several shortcomings.
First, the presentation of the CUSUM analysis was somewhat confusing.
Because both the baseline period and the post period are compared to a pre period, no clear
assessment could be made to the relative accuracy of the model for the baseline period.
Typically, this period would be the modeled period and the accuracy could be easily assessed by
looking at the deviation of each month relative to the model. An accurate model should have a
total cumulative savings of zero for the modeled period and each month for the modeled period
should have small deviations from the model as well (as seen in the flat shape to the modeled
period in figure 5-1 previously). The current approach requires the reader or the analyst to
compare the relative change in slopes to assess the savings. Although not necessarily less
accurate, the savings are less apparent when comparing different slopes in Figure 5-1. Typically,
one of the primary benefits of the CUSUM analysis is that it clearly presents the total savings
accrued to date as the y-axis. The approach used by the CTSP in this case, makes the CUSUM
chart a much less useful tool to the participant.
Second, we have concerns about the linear extrapolation of post-engagement savings to
estimate annual savings.
Another concern with the analysis methodology is the approach to extrapolation or
annualization. The need to extrapolate or annualize the savings is understood; however, the
current linear extrapolation technique was found to have significant potential inaccuracies,
especially when only a few months of post baseline data are used to develop the savings
estimates and/or annual operation is not appropriately represented.
A more accurate approach toward the annualization could be achieved by modeling the savings
based on expected operation. For example, for a project that is expected to improve heating
Period Period Duration Dates
Adjusted
Baseline
Savings
Rate
Period
Avg Daily
Savings
Rate
Net
Daily
Savings
Rate
Projected
Annual
Savings
Measured
Savings
Capital
Project
Savings
Projected
Net
Savings
Adjusted Baseline 10/6/2011 - 11/2/2012 11.1
1st savings rate period 11/3/2012 - 12/5/2013 11.5 0.4 160 4,587 0 160
2nd savings rate period
Final results 2013 160 160

SEM Year 2 Evaluation – Final – 9-30-14 Page 15
system operation, the savings could be related to heating degree days. Alternatively, if enough
post-engagement time has passed to provide sufficient data points, a model (similar to the
baseline models developed above) could be developed to relate energy usage to parameters such
as days, temperature, or other driving factors as forecast for the remainder of the year based on
past experience.
Third, the savings estimates may be influenced by abnormal weather conditions.
The CUSUM approach described above also calculates the savings based on actual weather
conditions. These weather conditions can have a dramatic influence on the claimed savings. If,
for example, a project has savings due to a reduction in air conditioning load, a hot summer will
likely produce greater savings estimates from the CUSUM analysis than a cooler summer. These
savings would be accurate for that particular year, but would not be representative for a year with
typical weather conditions. Typical Meteorological Year (TMY) data would produce more
“typical” results, which would not be as swayed by specific-year weather data.
Fourth, the current approach also includes potential bias in that buildings with negative
savings are set to zero.
For most of the projects reviewed this does not significantly alter the claimed savings. However,
for one participant (Cohort-2P2), setting the buildings with negative savings to zero has a
significant effect on the total expected savings for that customer. Based on the supplied
documentation, the expected total reduction in energy consumption for this customer is
2,352,424 kWh. To achieve this, the customer completed 2,067,229 kWh of capital projects and
2,353,778 kWh of SEM improvements. The total “savings” for the completed projects is
4,421,007 kWh, but the eight buildings are expected to increase in usage by 2,068,580 kWh, or a
value that is approximately 88% as large as the savings claimed for the SEM program
participation. From the information presented, it cannot be determined if the zeroing out of these
buildings is appropriate or not.
It should be noted that it is not expected that these buildings would have increased energy usage
from the SEM program participation that would need to be accounted for. Instead, the concern
with removing the buildings with negative savings, is that buildings will naturally have some
variation, with some having increasing usage and others decreasing. The current approach
captures the “savings” for buildings where the usage simply decreased due to this natural
variation and no SEM actions were taken.
Finally, the CUSUM analysis may be less valuable when savings are a small percentage of
overall usage, particularly when limited information is provided on the sources of savings.
As previously mentioned, the CUSUM approach is reasonable and appropriate. However, when
the savings are small relative to the total billed consumption, an engineering analysis may be
more appropriate and more accurate. One example of this would be the Building 1 for Cohort-

SEM Year 2 Evaluation – Final – 9-30-14 Page 16
2P2. The total projected savings for this building based on the CUSUM analysis was
approximately 0.5% of the total building usage. Although this number may be reasonable, the
uncertainty associated with savings developed using this approach is significantly larger than the
total savings. We recognize that in this case, the savings associated with this building are a small
portion of the participant’s total savings, so even a relatively large error for this building may not
result in a large error for SEM participation overall. However, insufficient information was
provided to determine if the actions taken at this building are consistent with the claimed savings
or whether an engineering model could have been reliably developed.
The lack of information was common across projects. For all projects, the information supplied
in the project reports was insufficient to provide any assessment on the reasonableness of the
savings estimates, with little information presented to demonstrate the findings or issues
addressed through the actions taken through the SEM program. Similarly, little to no information
was presented on what changes were actually made to result in savings. For one participant
(Cohort-2P2), the same issue was repeated across multiple buildings with little to no indication
of applicability. Almost all the buildings had the following issue listed for the first operational
visit:
“Found most HVAC systems Optimal Start programs defaulted to 1am “Earliest Start
Times”. Customer begins addressing issue. Systems begin to start closer to their 5am
“latest scheduled start” time.”
Cost of Savings
To compare the cost-effectiveness of the two delivery approaches, we compiled the costs and
savings associated with each CTSP, including non-incentive and incentive costs. Because both of
the 2012 individual approach participants (Corporate-1P1 and Corporate-1P2) had significant
non-incentive costs in 2012 but only reported incentive costs (as well as additional non-incentive
costs) in 2013, results for both approaches were combined for 2012 and 2013. To facilitate a
comparison of costs across electric and gas savings, we normalized all savings to MMBTU, and
calculated both non-incentive cost and total cost, as shown in Exhibit 5-6.
Exhibit 5-6 – SEM 2012 and 2013 Costs and Savings per MMBTU
CTSP
Non-incentive
cost Incentives
Elec. Savings
(MMBTU)
Therms Savings
(MMBTU) Total
(MMBTU)
Non-incentive cost per MMBTU
Total cost per
MMBTU
Cohort $699,278 $330,629 45,271 12,694 57,965 $12.06 $17.77
Corporate $245,995 $21,860 1,570 6,329 9,381 $26.22 $28.55
Total SEM $945,273 $352,488 46,841 19,024 67,346 $14.04 $19.27

SEM Year 2 Evaluation – Final – 9-30-14 Page 17
The results clearly show the lower cost of savings when the cohort approach is used. They also
show that service provider costs are several times higher than the amount of the incentives,
indicating that the program strategy does have a significant impact on overall cost-effectiveness.
B) PROCESS EVALUATION
The process evaluation focused on analyzing the delivery process and how it was perceived by
program staff as well as program participants. Results are presented below.
Program Awareness and Enrollment
Most participants for the first year of the pilot were approached directly by the CTSP. The
Energy Trust of Oregon Existing Buildings program management contractor (PMC) in some
cases made the participants aware of the SEM pilot and in other cases identified a customer to
the CTSP as a good candidate. The participant enrolled in Corporate SEM for 2013 was a
restaurant chain they had worked with Energy Trust for several years, so that it is somewhat
challenging to separate their work on the SEM engagement from other activities that would have
occurred regardless.
For both delivery approaches, the participating customer is called upon to identify a) an
Executive Sponsor who has the authority to ensure that recommended actions and plans are
executed and b) an Energy Champion who acts as the driving force behind day-to-day
implementation of SEM in the organization. The Energy Champions were expected to organize
Energy Management Teams that brought in other organization staff with energy-related
responsibilities. In addition, participants agree to develop and implement a Strategic Energy
Management Plan. The overall result is that participation requires a significant commitment from
the participant in terms of both operational and executive staff time. While this commitment was
made clear at the time of enrollment, one participant in Cohort 2 dropped out after two
workshops because they were unable to meet the time demands of the engagement, as noted
previously.
Program Participation
Unless specified, the following aspects of program participation apply to both the cohort and
one-on-one approach as implemented in the first year of the SEM pilot. Exhibit 5-7 below lists
the order of individual workshops for the Cohort 2, Year 1 participants.

SEM Year 2 Evaluation – Final – 9-30-14 Page 18
Exhibit 5-7 – Cohort 2 Workshop Topics and Dates
Workshop Number
Topic Date
1 Kick Off January 16, 2013
2 Energy Management Assessment Individually Scheduled
3 Energy Accounting and Benchmarking February 19, 2013
4 Effective Energy Teams March 13, 2013
5 Performance Tracking and Reporting April 23, 2013
6 Building Operations Assessment Individually Scheduled
7 Energy Analysis & Audits June 11, 2013
8 Building Operations Assessment Individually Scheduled
9 Employee/occupant Engagement July 16, 2013
10 Energy Management Planning September 10, 2013
11 Report Out November 5, 2013
In response to participant feedback and the perceptions of the Cohort CTSP team, the order of
workshops was changed from the previous year. (One participant noted last year, “Building the
team should probably even come before the building assessment.”) In 2013, the sessions on
Effective Energy Teams and Performance Tracking and Reporting were moved earlier in the
sequence, while Energy Analysis and Audits were discussed later, after participants were up to
speed on energy teams and performance tracking and after the individual buildings operations
assessments.
At the end of each workshop, Cohort 2 participants were asked to complete an evaluation form.
Exhibit 5-8 presents mean participant ratings of various aspects of the meetings and workshops
on a 1 to 5 scale, where 1 means poor and 5 means excellent. Across all workshops, average
ratings were 4.3 or higher for each aspect of the workshops evaluated. There were two
workshops – Energy Accounting and Benchmarking, and Occupant Engagement – to which
participants gave mean ratings of less than 4 in response to the question “How useful overall was
this workshop for ideas to improve your organization's energy management capabilities?”

SEM Year 2 Evaluation – Final – 9-30-14 Page 19
Exhibit 5-8 – Participant Ratings of Cohort 2 Workshops
The response scales for the last two items in the exhibit differ from those used for the items
above them; here, a score of 3 would reflect perception that the amount of material covered and
the pace of the presentation were “just right.” It would appear that some workshop participants
didn’t take time to re-evaluate their responses for this different scale, since a handful of
respondents who answered 5 to other aspects of the workshops also provided ratings of 5 for
these questions, which would have suggested that there was way too much material presented
way too fast; these responses are inconsistent with ratings of 5 for the quality of the
presentations. As a result, the average ratings of 3.6 and 3.5 for these questions probably do not
reflect an overall perceptions that slightly too much material was covered too rapidly.
Cohort 2
Please rate on a scale of 1 to 5 Kickoff
Energy
Acctg. &
Bench-
marking
Energy
Teams
Perfor-
mance
Tracking
Energy
Analysis
&
Audits
Employee/
Occupant
Engage-
ment
Eenergy
Mgmt.
Planning Nike
Lewis
and
Clark
City of
Portland
Oregon
Conven-
tion
Center
Portland
State
Univ.
ALL
WORK-
SHOPS
the quality of the written
materials 4.3 4.3 4.4 4.6 4.4 4.5 4.1 5.0 3.8 4.5 5.0 4.3 4.4
the quality of presentations
made 4.3 4.3 4.3 4.3 4.5 4.4 4.9 5.0 4.3 4.5 5.0 4.5 4.5
the quality of the facilitation and
overall manaqement4.5 4.3 4.5 4.1 4.5 4.6 4.9 5.0 4.3 4.5 5.0 4.3 4.5
the quality of the food and
facilities4.4 3.9 4.7 4.3 4.5 3.7 4.7 NA NA NA NA NA 4.3
how useful for ideas to improve
energy mgmt. capabilities4.4 3.4 4.4 4.2 4.3 3.2 4.5 5.0 4.3 4.6 5.0 4.0 4.3
the amount of material covered:
1 = too little, 5 = too much3.2 4.0 3.2 3.4 3.5 4.1 3.3 3.0 3.3 4.0 4.0 4.0 3.6
the pace of the workshop: 1 = too
slow, 5 = too fast3.0 4.0 2.9 3.0 3.6 4.5 2.9 3.0 3.5 4.0 4.0 3.3 3.5
Number of respondents = 14 15 10 9 11 24 24 2 4 15 2 4 134
Building Operations Assessment
Cohort 2
Please rate on a scale of 1 to 5 Kickoff
Energy
Acctg. &
Bench-
marking
Energy
Teams
Perfor-
mance
Tracking
Energy
Analysis
& Audits
Employee/
Occupant
Engage-
ment
Eenergy
Mgmt.
Planning
Cohort -
2P1
Cohort -
2P2
Cohort -
2P3
Cohort -
2P4
Cohort -
2P5
ALL
WORK-
SHOPS
the quality of the written
materials 4.3 4.3 4.4 4.6 4.4 4.5 4.1 3.8 5.0 4.3 5.0 4.5 4.4
the quality of presentations made 4.3 4.3 4.3 4.3 4.5 4.4 4.9 4.3 5.0 4.5 5.0 4.5 4.5
the quality of the facilitation and
overall manaqement4.5 4.3 4.5 4.1 4.5 4.6 4.9 4.3 5.0 4.3 5.0 4.5 4.5
the quality of the food and
facilities4.4 3.9 4.7 4.3 4.5 3.7 4.7 NA NA NA NA NA 4.3
how useful for ideas to improve
energy mgmt. capabilities4.4 3.4 4.4 4.2 4.3 3.2 4.5 4.3 5.0 4.0 5.0 4.6 4.3
the amount of material covered: 1
= too little, 5 = too much3.2 4.0 3.2 3.4 3.5 4.1 3.3 3.3 3.0 4.0 4.0 4.0 3.6
the pace of the workshop: 1 = too
slow, 5 = too fast3.0 4.0 2.9 3.0 3.6 4.5 2.9 3.5 3.0 3.3 4.0 4.0 3.5
Number of respondents = 14 15 10 9 11 24 24 4 2 4 2 15 134
Building Operations Assessment

SEM Year 2 Evaluation – Final – 9-30-14 Page 20
In addition to their survey responses, workshop participants were asked for comments on which
aspects of each session they found most or least useful. Illustrative comments are presented
below:
Most useful
Time to work as a team; presentation by previous year participant. (kickoff)
The county example was great as well as the individual exercise. (kickoff)
Discussion of tracking software. (benchmarking)
Hearing what others are doing at their sites. [Other participant] was very insightful
sharing about what [his organization] has done. (benchmarking)
I liked having some time in the workshop to work on our action plans. I thought this was
valuable and to be able to ask some clarifying questions to the SEM staff. (energy teams)
Learning about the models, understanding data process. Very exciting. (performance
tracking)
Examples from other companies. (employee/occupant engagement)
Energy savings and targets spreadsheet examples. (energy management planning)
Graphs and explanations of where the most power is consumed. (operations assessment)
Least useful
There was some repetitive information. I would have preferred more discussion.(kickoff)
Some heavy text slides, could trim or add more images for audience interaction. (energy
teams)
It’s a bit technical, but I liked it. I think "predicted" energy was a confusing term.
(performance tracking)
Wished we had more time to review specifics around how events can effect usage and
correlating metrics within the models -- some of the ' why' behind the scenes.
(performance tracking)
I would have liked more of the hands on exercises to get comfortable with using utility
data to identify problems and consider solutions. (energy analysis and audits)
Some images/ examples could be clearer. (employee/occupant engagement)
Go through pages 1-10 (basics) more quickly and spend more time on trouble shooting,
examples, etc. Speak to your audience, technicians. (operations assessment)
As is evident from the comments above, the sharing of experience and knowledge appears to be
one of the most valuable aspects of the cohort approach, particularly when past participants
describe how they implemented SEM. Individuals within one organization can exchange ideas
with their peers who hold similar positions in other organizations, thereby increasing the amount
of learning beyond what would be possible in a one-on-one expert-participant setting. In addition
to this peer interaction, participants indicated through their comments that they highly value the
real-world examples provided in the workshops.

SEM Year 2 Evaluation – Final – 9-30-14 Page 21
Comments on the least useful aspects of the workshop often seem to reflect the difficulty of
tailoring presentations to an audience that typically included both very technically sophisticated
and purely non-technical attendees. While there is undoubtedly some “preaching to the choir” of
knowledgeable engineers and technicians, it remains important to engage Executive Sponsors
and other management personnel who will ultimately need to make strategic energy management
standard organizational practice.
Organizational Change
As much as achieving energy savings through improved building operations, a fundamental goal
of the SEM initiative is to foster organizational and behavior change that will support future
management of energy use.

SEM Year 2 Evaluation – Final – 9-30-14 Page 22
Energy Management Team
For both the cohort and individual approaches, a key aspect of this change was the expectation
that participants would organize Energy Management Teams that brought in others besides the
Energy Champion and the Executive Sponsor. An active, engaged Energy Management Team
that brought in various departments or functions of the organizations was seen as a prerequisite
for bringing about and sustaining a more focused approach to energy management. Energy
management teams typically included facility or operations and maintenance staff, as well as
other individuals or departments such as the custodial staff whose involvement was essential to
implementing recommended changes, such as changes in lighting schedules.
At the Cohort 2 participant with the greatest aggregate SEM savings, the Energy Champion said
he has been the only member of the Energy Management Team, but that he is hoping to add one
or more operations personnel. In addition, he has been actively engaging other facility staff at his
organization and encouraging them to take on a more direct energy management role. One other
Cohort 2 respondent also said that they did not have the Energy Management Team in place, but
noted that they do have 14 maintenance technicians as well as the Energy Champion and a
building engineer who keep in direct touch on energy issues. A third Cohort 2 respondents said
they had organized a team (as of late spring), but that the team had not met yet.
Energy Management Teams at other participating sites met monthly or quarterly, although for
one participant the full team meets just once a year as plans for the next year are developed.
Meetings – in some cases via conference call -- usually involved discussing actions taken as part
of the implementation of SEM, as well as reviewing energy usage at one or more facilities in the
previous month. CTSP representatives sometimes participated in these meetings, but most were
done by the participant organization’s staff alone. Both CTSPs did have staff participate in
regular team meetings where SEM actions were discussed.
Organizational/Energy Management Assessment
To help guide the efforts of the Energy Management Teams, both of the CTSPs conducted
Organizational Assessments with individual participants to walk them through a comparison of
their energy management efforts against “best practices.” This process is referred to as an Energy
Management Assessment. The Cohort CTSP uses its own process for the assessment, while the
Corporate CTSP uses a proprietary third party product from Envinta. The benefit of the
Corporate SEM assessment is that it provides a pre- and post-participation metric to quantify the
extent to which participants have advanced their energy management practices. For example,
Corporate-2P1 participated in an Envinta One 2 Five Energy Organizational Assessment at the
onset and conclusion of the engagement; their overall rating went from one star at the outset to
two stars at the conclusion of the engagement. (The assessment has a one to five scale, where
five stars represent industry best practice and is very difficult to attain).

SEM Year 2 Evaluation – Final – 9-30-14 Page 23
While participants in both tracks praised the organizational assessment, there were some
concerns that the approach was too generic – even though the assessments were conducted at the
individual participant level. A Cohort 2 respondent noted that “a lot of it was geared to for-profit
organizations, which are focused on ISO standards and other protocols that are not relevant to
educational and government agencies.” Similarly, the 2013 Corporate SEM participant said that
“the three hour interview was too much, and kind of silly, as much of it did not pertain to us; it
needs to be industry specific.”
Energy Management Plan
Building on the results of the organizational assessment, participants were encouraged to develop
an Energy Management Plan that formalizes the SEM practices introduced through the program.
Depending on the complexity of the organization and the number of levels of management
involved, this process can take time, especially since most SEM participants are large, multi-site
organizations. Several of the Cohort 2 participants and the Corporate Year 1 and 2 participants
interviewed said they had put an Energy Management Plan in place, even though it had taken
from several months to a year. Two Cohort 2 respondents said they were still in the process of
working on it; one said that they are reformatting the template they were given to better reflect
their organization/culture, while the other described it as a work in progress that was expected to
be completed by late summer 2014.
Evidence that participants value the assistance they received in energy management planning can
be seen in responses to the question “how useful overall was this workshop for ideas to improve
your organization's energy management capabilities.” The 24 respondents from Cohort 2
participants who attended the energy management planning workshop gave this session a higher
average rating than any workshop other than the individualized building assessments.
Building Operations Assessment
A Building Operations or Opportunity Assessment (BOA), which was done with each
participant, is a facility audit conducted by CTSP technical staff accompanied by participant
staff. The number of Cohort 2 BOA participant staff involved in completing surveys after their
assessment ranged from 2 to 15, showing the wide variation in attendance. Participants
consistently expressed high levels of satisfaction with this aspect of the program, offering
comments such as “having all the facility maintenance technicians together in the same room and
engaging in SEM was great,” and “good overview of building systems, with specifics cited.”
Participants also had requests, however, such as “please help get upper management truly on
board with this” and “I would like to have a little more assistance with applying solutions.”
While not as detailed as a full retro-commissioning study or facility audit, the BOA has a similar
goal of identifying operational changes that will result in energy savings. Most changes
identified in the Cohort 2 BOAs seemed to focus on schedule adjustments, including the run-

SEM Year 2 Evaluation – Final – 9-30-14 Page 24
times for HVAC systems, start-up sequence for cooking and other restaurant equipment, and
lighting schedules.
Implemented changes made by participants are tracked in a variance log, with the aim of linking
those changes to resulting reductions in energy consumption (i.e., differences between modeled
and actual usage for a given period.) As noted in our review of the savings calculations, entries
for many of the buildings were not specific or detailed enough to provide for a credible linkage
to observed or projected changes in energy usage.
We commented in Report 1that: “Given the difficulty of linking changes in usage to specific
actions, it is important that the variance logs be comprehensive in the operational changes
tracked at the time they are implemented so that energy managers have a detailed record to refer
to when investigating changes in usage. The variance logs should be regularly updated, including
confirmation that previously implemented changes continue in place over time.” We did not see
evidence that this was being done in the savings documents we reviewed for Year 2 (either
Cohort 1 or 2), as discussed below.
Presentation of Results
One of the findings resulting from the evaluation team’s review of the reports generated by the
CTSPs for use by each participant describing their savings was that these reports were confusing
to us, and seemed to have been written without a clear audience or purpose. They presented
information, but for somebody not intimately involved in the project or familiar with the
building, the information was not easily interpretable, and often confusing, in the following
ways.
Overall, we found the reports very content-heavy, but short on context and explanation.
The content provided was significant and important, but the explanation around the content or
the meaning of the content was missing. We understand that adding clarifying text is not a
“simplification” but rather adds bulk (and time and cost) to the report. However, graphic or
tabular content without explanatory text can quickly lose its meaning to customers who may lack
the technical background to understand the models being developed or the measures being
recommended.
The effects of this lack of text are amplified through the use of comments and acronyms rather
than sentences and descriptions. One example of this can be found in the Cohort-2P3 report,
where a comment for one of the buildings states that there was “a failed EP transducer for NH SF
3 MAD.” Other than those directly involved in building operations, few readers will understand
what that is referring to, what its implications are, and what should be done about it.
Recommendations

SEM Year 2 Evaluation – Final – 9-30-14 Page 25
Expand the text for the reports to provide more clarity on the information presented in
tables and graphs.
Expand the text to include more clear descriptions of findings and actions, reducing use
of acronyms, especially non-standard acronyms.
Organize findings more clearly to present: (1) a description of the finding, (2) the action
to be taken to correct the operation based on the finding, (3) a description of how this
action results in a reduction in energy use (and some estimate if possible).
The lack of text or explanation also detracts from the credibility of the approach. For
example, the adjusted baseline period for one building for Cohort-2P2 includes 11 months of
data before the customer joined the SEM program and 7 months after the customer joined the
program. The baseline period includes the SEM kick off workshop, 3 operational visits and an
operational assessment workshop. It is not clear why all of this time is included in the adjusted
baseline period. Such a deviation from the standard approach (even if justified) tends to detract
from the effects that may be actually caused by the program.
Recommendation
Clearly describe the rationale for any deviations from the standard approach or for
selecting atypical periods for analysis.
Clearly describe and explain how the baseline, pre- and post-periods are selected for the
savings analysis.
We found the reports to be overly standardized, which contributed to the difficulty in
interpreting the information presented. For example, for many Cohort-2P2 buildings, the
model and savings are listed as being from Energy Expert. However, all of the information
presented is the standard information that would be presented as if the standard models were
used. Because of this all of the model parameters are listed as “N/A” and no information is
actually given about the Energy Expert model or approach taken.
This over-standardization also applied to the findings and recommendations for the buildings.
For Cohort-2P2, the same significant finding was presented verbatim for almost every building,
and no other findings were given. Because of this, and augmented by the minimal information
presented, it is difficult to understand if this recommendation was actually observed for every
building or just a general recommendation that was observed in many cases. Also, every
observation should be presented. Although it is very possible that this was the only observation
for the site visit, it seems unusual that this observation was made at all buildings and no other
observation was made at any of these buildings.
Recommendation
Ensure that the description and rationale for the methodology and savings estimates are
tailored to the model and the approach taken for the specific project or building.

SEM Year 2 Evaluation – Final – 9-30-14 Page 26
Ensure that all observations and recommendations for each building are presented and
that the observations and recommendations are tailored to the specific observations and
recommendations for that building.
Finally, as discussed this in the impact section of this report previously, the manner in which the
savings charts were presented added confusion, since they were somewhat modified from a
typical CUSUM analysis. One of the key benefits of a CUSUM analysis is that the baseline
period is used to develop the model, so that savings over time are clearly presented and can be
clearly seen in the charts. The current approach requires the user to interpret the changes in
slopes, so that the values presented in the graph are not directly interpretable.
Appendix A shows an illustration of an alternative format for presenting results that members of
the evaluation team have found useful on other projects.
Tracking of Savings and Persistence
As part of their participation, each organization is expected to track its energy consumption over
time. Monthly energy usage is entered into a MT&R spreadsheet tool so that consumption can be
compared to usage during the same time in the previous year. To make the comparisons valid,
current and past usage are both weather-normalized to account for changes in weather, as
described in the analysis of savings methodology. That means a participant who wants to
compare usage to his or her baseline must enter both consumption and relevant weather data –
unless weather is automatically downloaded from an external source -- making the process of
tracking savings somewhat resource- or time-intensive.
A variety of tools were used by participants to track usage after participation, including several
that were mentioned by multiple respondents, as indicated in parentheses:
Portland General Electric’s Energy Reporting System, also called Energy Expert (4
respondents)
Monthly usage reports (internally called The Energy Performance Report)
MT&R spreadsheet tool (2 respondents)
EPA portfolio manager
“Meters and bills”
Even though only two participants (both from Cohort 2) were still using the MT&R
spreadsheets, all the participants contacted said they felt they had sufficient data to manage their
energy usage, with several offering comments such as:
We now have better controls and can act to make corrections/improvements
We were using an Excel document; now we’re using PGE Energy Expert/EPA portfolio
and looking for anomalies in usage patterns that way

SEM Year 2 Evaluation – Final – 9-30-14 Page 27
We did not track usage before other than looking at utility bills; we track now with
[CTSP] provided spreadsheet, also use Energy Expert for a 400,000 square foot building
The fact that SEM “alumni” are tracking their usage is one indication of the extent to which
organizational and management changes brought about by SEM have persisted. Other indicators
of the persistence of organizational change include the continuation or expansion of SEM,
ongoing functioning of an Energy Team and the implementation of a Strategic Energy
Management Plan (SEMP). While all of the Cohort 1 contacted who were not actively
participating in 2013 said they had incorporated the lessons of SEM participation into their
operations, the extent to which they were following the recommended practices varied.
Cohort-1P2 said it had expanded SEM to all of their 43 building where it was applicable, but
they had not developed a SEMP or maintained an Energy Team. On the other hand, they are
planning to hire an energy manager both to develop the energy management plan and head up
their team. Although they had no additional claimed savings in 2013 for the 8 buildings that
participated in 2012, the respondent said that SEM helped them kick-start their energy savings
efforts, change their culture and increase the number of energy savings projects they are doing by
giving them the data to see payback.
Cohort-1P7 has not extended SEM to additional buildings, and also has no SEMP in place. The
respondent attributed that to extensive personnel turnover. However, with a new facilities
director on board, they plan to reinvigorate the SEM effort, and are also planning a major facility
renovation. Energy considerations will be a big part of the renovation since SEM got the
company’s senior executive’s attention focused on this.
A respondent at Corporate-1P1 said that the program served as a catalyst to moving his
organization in the direction of responsible resource use. Although there is no Energy Team
currently in place and no SEMP, the Energy Champion says that the best practices implemented
during the SEM engagement remain in place now.
Additional Savings and Capital Projects
A challenge in identifying savings attributable to SEM is the fact that most participants have
been and continue to be involved in facility and equipment upgrades, often through other Energy
Trust programs. Both CTSPs were diligent about using the estimated savings associated with
capital projects to reduce overall savings, yet reducing overall savings by those attributable to
capital projects would only appear to add to the uncertainty associated with the remaining
savings attributed to SEM. In all cases, capital projects identified and therefore “triggered” by
the SEM engagement (as distinct from capital projects already planned or under way) took place
outside the time frame of the savings analysis. Adjustments to savings were based on capital
projects initiated earlier or simultaneously, rather than those recommended as a result of the
SEM walk-throughs or opportunity assessments, although several Cohort 1 and Cohort 2
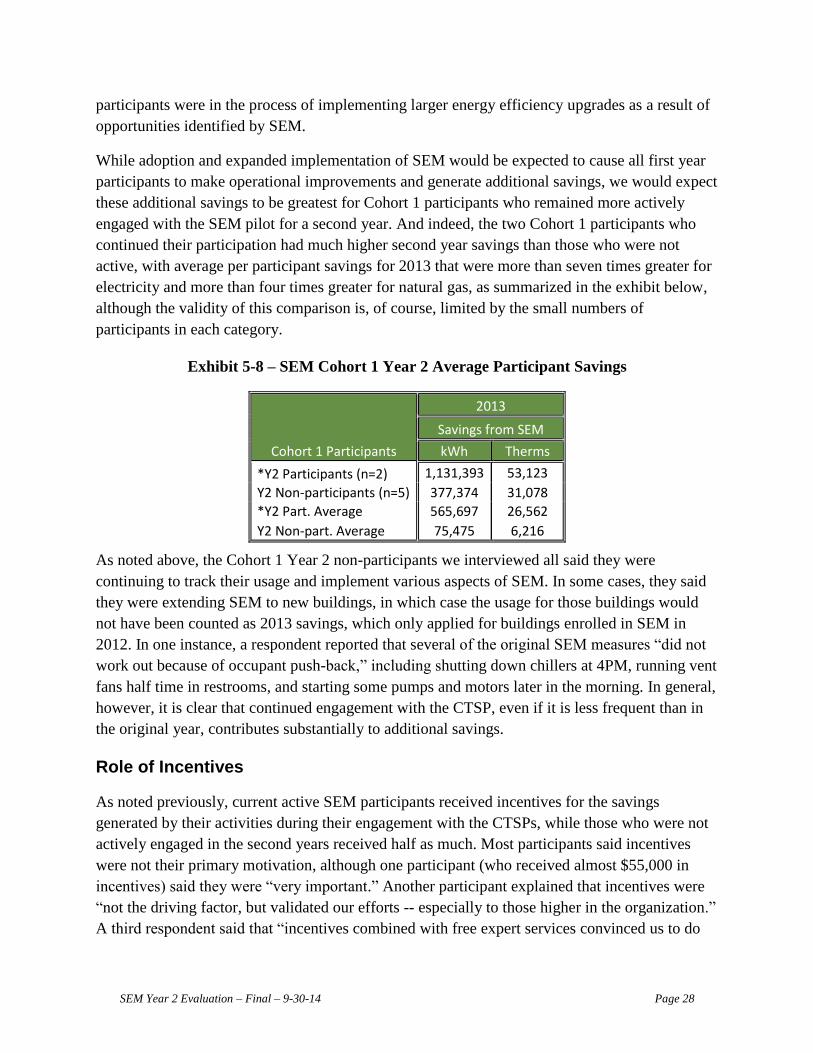
SEM Year 2 Evaluation – Final – 9-30-14 Page 28
participants were in the process of implementing larger energy efficiency upgrades as a result of
opportunities identified by SEM.
While adoption and expanded implementation of SEM would be expected to cause all first year
participants to make operational improvements and generate additional savings, we would expect
these additional savings to be greatest for Cohort 1 participants who remained more actively
engaged with the SEM pilot for a second year. And indeed, the two Cohort 1 participants who
continued their participation had much higher second year savings than those who were not
active, with average per participant savings for 2013 that were more than seven times greater for
electricity and more than four times greater for natural gas, as summarized in the exhibit below,
although the validity of this comparison is, of course, limited by the small numbers of
participants in each category.
Exhibit 5-8 – SEM Cohort 1 Year 2 Average Participant Savings
Cohort 1 Participants
2013
Savings from SEM
kWh Therms
*Y2 Participants (n=2) 1,131,393 53,123
Y2 Non-participants (n=5) 377,374 31,078
*Y2 Part. Average 565,697 26,562
Y2 Non-part. Average 75,475 6,216
As noted above, the Cohort 1 Year 2 non-participants we interviewed all said they were
continuing to track their usage and implement various aspects of SEM. In some cases, they said
they were extending SEM to new buildings, in which case the usage for those buildings would
not have been counted as 2013 savings, which only applied for buildings enrolled in SEM in
2012. In one instance, a respondent reported that several of the original SEM measures “did not
work out because of occupant push-back,” including shutting down chillers at 4PM, running vent
fans half time in restrooms, and starting some pumps and motors later in the morning. In general,
however, it is clear that continued engagement with the CTSP, even if it is less frequent than in
the original year, contributes substantially to additional savings.
Role of Incentives
As noted previously, current active SEM participants received incentives for the savings
generated by their activities during their engagement with the CTSPs, while those who were not
actively engaged in the second years received half as much. Most participants said incentives
were not their primary motivation, although one participant (who received almost $55,000 in
incentives) said they were “very important.” Another participant explained that incentives were
“not the driving factor, but validated our efforts -- especially to those higher in the organization.”
A third respondent said that “incentives combined with free expert services convinced us to do
SEM Year 2 Evaluation – Final – 9-30-14 Page 29
the program,” but added with regard to the incentive amounts, that “for the effort put in, a little
more would be nice.” No other participants interviewed expressed dissatisfaction with the
incentive amount.
Overall Satisfaction
Whether they were Cohort 2 participants in 2013, Cohort 1 participants who continued their
engagement with the CTSP in 2013, or Cohort 1 participants who were not formally enrolled for
a second year in 2013, all of the participants we interviewed expressed a high degree of
satisfaction with the SEM program overall.
5. Conclusions and Recommendations
Overall, our evaluation indicates that the application of SEM to commercial customers is viable,
and a worthwhile use of Energy Trust’s resources, both as an initiative to capture immediate
savings and as a means of transforming the way existing buildings are managed. As a result, we
reiterate our belief that an SEM offering should be part of the Energy Trust Existing Buildings
program portfolio. The following other conclusions and associated recommendations are offered.
Conclusion: Getting SEM thoroughly established in an organization takes time. Even the one-
year engagement used by the Commercial SEM pilot does not appear to be long enough for such
organizational changes as the actual adoption of an Energy Management Plan and the
empowerment of an organization-wide Energy Management Team to become ingrained into the
organizational culture. Moreover, participants clearly value and respond to ongoing outside
expert assistance, as shown by the significantly greater savings for participants who continued
their engagement with the CTSP.
Recommendation: Structure the SEM offering within the Existing Buildings program as
a multi-year commitment, with the intensive first-year effort followed by, for example,
detailed quarterly reviews with the CTSP. In addition, savings achieved by applying SEM
to additional buildings within Energy Trust territory in the second year should be counted
in the savings attributed to the engagement.
Conclusion: The cohort approach appears to be much more cost-effective than the one-on-one
approach in helping organizations improve the efficiency of their energy management.
Recommendation: We believe the cohort approach to commercial SEM is suitable for
inclusion in the Existing Buildings program, but the individual approach seems to require
too many resources relative to the savings achieved.
Conclusion: Overall, the SEM approach is appropriate for most of the participants selected,
although one participant had only a single large building and thus was unable to apply SEM
techniques to additional facilities. In addition, one participant had such a wide-ranging retrofit

SEM Year 2 Evaluation – Final – 9-30-14 Page 30
project going on concurrent with SEM that calculation of savings attributable to SEM was very
difficult.
Recommendation: Focus on multi-site customers when recruiting, and avoid recruiting
firms with extensive capital projects or energy services contracts underway shortly before
participation or planned during the participation period, particularly if those projects are
more complex than simple equipment change-outs with well-defined savings.
Conclusions: While CUSUM regression analysis provides an acceptable approach for estimating
aggregate kWh and therms savings from the numerous operational and behavioral changes that
would be expected to result from implementation of SEM in commercial buildings, we had
concerns regarding the non-standard CUSUM approach applied to the Cohort 2 participants,
some of which echo the year 1 recommendations.
The presentation of the CUSUM analysis was somewhat confusing. Because both the
baseline period and the post period are compared to a pre period, no clear assessment could be
made to the relative accuracy of the model for the baseline period. Typically, this period would
be the modeled period and the accuracy could be easily assessed by looking at the deviation of
each month relative to the model.
Recommendation: Since one of the primary benefits of the CUSUM analysis is that it
clearly presents the total savings accrued to date on the y-axis, the standard approach,
where the baseline period immediately precedes the participation period, should be used
and any deviations from it should be clearly explained.
Similarly, the reports themselves were difficult to interpret and lacked context. The content
provided was significant and important, but the lack of clarifying text made it hard to understand,
particularly in light of the use of comments and acronyms rather than sentences and descriptions,
which are unlikely to be understood by most readers. Since program evaluators who are trained
engineers found the reports difficult to interpret, most participating customer staff would find
them hard to understand as well.
Recommendation: Expand the text for the reports to provide more clarity on the
information presented in tables and graphs and to include more clear descriptions of
findings and actions, reducing use of acronyms, especially non-standard acronyms. In
addition, findings should be more clearly organized to present: (1) a description of the
finding, (2) the action to be taken to correct the operation based on the finding and (3) a
description of how this action results in a reduction in energy use (and some estimate if
possible).
Projections of annual savings are made using too little data. Linear extrapolation of post-
engagement savings to estimate annual savings using just a few months of post-baseline data is
SEM Year 2 Evaluation – Final – 9-30-14 Page 31
potentially misleading. Moreover, abnormal weather conditions can dramatically over- or
understate savings.
Recommendation: A more accurate approach toward the annualization could be
achieved by modeling the savings based on expected operation, for example, by relating
savings to heating or cooling degree days over the rest of the forecast period.
Alternatively, if enough post-engagement time has passed to provide sufficient data
points, a model (similar to the baseline models developed above) could be developed to
relate energy usage to parameters such as days, temperature, or other driving factors as
forecast for the remainder of the year.
There may be bias in the overall estimate of savings in buildings with negative savings that
are set to zero.
Recommendation: For most of the projects reviewed, this does not significantly alter the
claimed savings; however, the net savings when these increases in usage are factored in
should be examined and discussed to determine, for example, if people were moved from
one building to another with an associated shift in usage.
Savings are a small percentage of overall usage. The CUSUM analysis may be more subject to
error when savings are a small percentage of overall usage, particularly when limited information
is provided on the sources of savings.
Recommendation: The potential for error in the small percentage savings heightens the
need for clearer, better documentation of changes that could be responsible for the lower
usage observed in the model results. Given the difficulty of linking changes in usage to
specific actions, it is important that the variance logs be comprehensive in the operational
changes tracked at the time they are implemented so that energy managers have a detailed
record to refer to when investigating changes in usage. The variance logs should be
regularly updated, including confirmation that previously implemented changes continue
in place over time.
Conclusion: Use of the MT&R tends to slip over time, in part because it is a time consuming
process whose statistical foundations are not always understood by participants.
Recommendation: Emphasize the importance of continuing to monitor and respond to
monthly energy usage data, with examples of how alternative analysis tools can
adequately serve this purpose.
Conclusion: The more comprehensive and meaningful a formal Strategic Energy Management
Plan will be to the overall organization, the longer it takes to design and implement, with internal
approval processes often stretching this to the end of the initial engagement or beyond.

SEM Year 2 Evaluation – Final – 9-30-14 Page 32
Recommendation: Make ongoing consultation with the organization on the Energy Plan
one of the features of second year participation and, as recommended in the year 1 report,
consider offering an incremental incentive when the participant’s organization can prove
that it has formally adopted a plan that is approved by the CTSP.
Conclusion: The exchange of ideas between facility managers from different organizations (or,
to a lesser extent, managers of geographically dispersed buildings within a single organization)
was one of the most highly valued features of the SEM workshops and meetings.
Recommendation: To encourage this exchange of information, devote some time during
each workshop or meeting to allow participants to share their successes and failures. For
the one-on-one approach, this feature can best be exploited by working with
organizations that have multiple sites; if those are geographically dispersed, use
conference calls or web-based meetings to reduce cost while still sharing information.

SEM Year 2 Evaluation – Final – 9-30-14 Page 33
Appendix A – Illustrative Results presentation
ECM 1: Optimize Hot Water Pump VFD Operation
Observation:
During the site visit it was observed the VFDs for the
two 15 HP hot water pumps were set to “Hand” mode
and operate at full speed (60 Hz) throughout the
heating season. The EMS was reviewed and the hot
water pump status (on/off) is not controlled by the
EMS.
Recommendation:
Reset the VFD to “Auto” mode to allow the VFDs to
modulate based on hot water requirements, as dictated
by the EMS.
Also, reprogram the EMS to interlock the hot water
pump operation to the boiler operation to ensure that
the hot water pumps only operate when there is a call for hot water.
Expected Savings:
Currently the pump motor is running at full load for the entire heating season. Allowing the
pump to modulate based on demand can save up to 70% of the motor energy consumption.
Additionally, by interlocking the operation of the pump to the boiler, the pump will be able to
turn off during periods in the heating season when there is no heating required (such as warm
weather or overnight hours), allowing the pump operation


![[Webinar] "Trust, Fear and Energy"](https://img.dokumen.tips/doc/110x75/54660d28af7959496f8b5121/webinar-trust-fear-and-energy.jpg)