Embed Size (px)
Citation preview
Energy Storage in Datacenters: What, Where, and Howmuch?
Di Wang, Chuangang Ren, Anand Sivasubramaniam, Bhuvan Urgaonkar, and Hosam Fathy∗
Department of Computer Science and Engineering, ∗Department of Mechanical and Nuclear EngineeringThe Pennsylvania State University
{diw5108,cyr5126,anand,bhuvan}@cse.psu.edu, [email protected]
ABSTRACTEnergy storage - in the form of UPS units - in a datacenterhas been primarily used to fail-over to diesel generators uponpower outages. There has been recent interest in using theseEnergy Storage Devices (ESDs) for demand-response (DR)to either shift peak demand away from high tariff periods, orto shave demand allowing aggressive under-provisioning ofthe power infrastructure. All such prior work has only con-sidered a single/specific type of ESD (typically re-chargeablelead-acid batteries), and has only employed them at a sin-gle level of the power delivery network. Continuing tech-nological advances have provided us a plethora of competi-tive ESD options ranging from ultra-capacitors, to differentkinds of batteries, flywheels and even compressed air-basedstorage. These ESDs offer very different trade-offs betweentheir power and energy costs, densities, lifetimes, and energyefficiency, among other factors, suggesting that employinghybrid combinations of these may allow more effective DRthan with a single technology. Furthermore, ESDs can beplaced at different, and possibly multiple, levels of the powerdelivery hierarchy with different associated trade-offs. Toour knowledge, no prior work has studied the extensive de-sign space involving multiple ESD technology provisioningand placement options. This paper intends to fill this criti-cal void, by presenting a theoretical framework for capturingimportant characteristics of different ESD technologies, thetrade-offs of placing them at different levels of the power hi-erarchy, and quantifying the resulting cost-benefit trade-offsas a function of workload properties.
Categories and Subject DescriptorsC.0 [Computer Systems Organization]: General
General TermsDesign, Experimentation, Performance, Theory
KeywordsDatacenters, Power Provisioning, Energy Storage, Cost Re-duction
Permission to make digital or hard copies of all or part of this work forpersonal or classroom use is granted without fee provided that copies arenot made or distributed for profit or commercial advantage and that copiesbear this notice and the full citation on the first page. To copy otherwise, torepublish, to post on servers or to redistribute to lists, requires prior specificpermission and/or a fee.SIGMETRICS’12, June 11–15, 2012, London, England, UK.Copyright 2012 ACM 978-1-4503-1097-0/12/06 ...$10.00.
1. INTRODUCTIONDatacenter power consumption is raising serious cost, en-
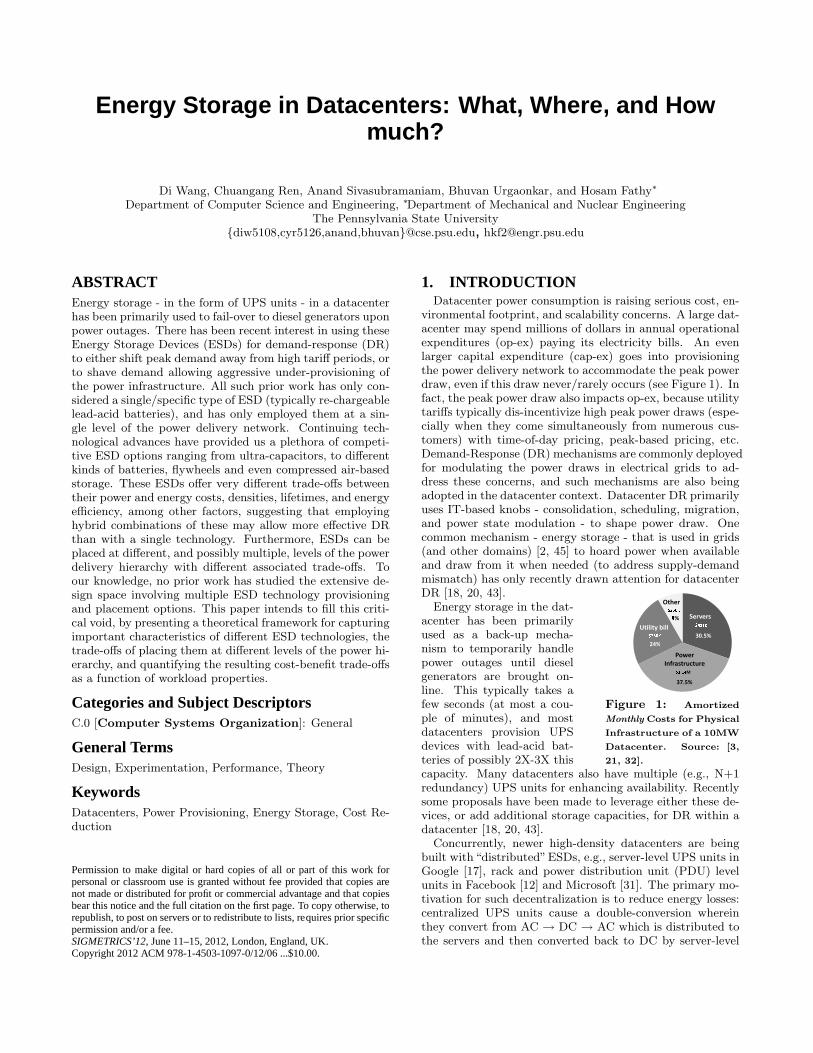
vironmental footprint, and scalability concerns. A large dat-acenter may spend millions of dollars in annual operationalexpenditures (op-ex) paying its electricity bills. An evenlarger capital expenditure (cap-ex) goes into provisioningthe power delivery network to accommodate the peak powerdraw, even if this draw never/rarely occurs (see Figure 1). Infact, the peak power draw also impacts op-ex, because utilitytariffs typically dis-incentivize high peak power draws (espe-cially when they come simultaneously from numerous cus-tomers) with time-of-day pricing, peak-based pricing, etc.Demand-Response (DR) mechanisms are commonly deployedfor modulating the power draws in electrical grids to ad-dress these concerns, and such mechanisms are also beingadopted in the datacenter context. Datacenter DR primarilyuses IT-based knobs - consolidation, scheduling, migration,and power state modulation - to shape power draw. Onecommon mechanism - energy storage - that is used in grids(and other domains) [2, 45] to hoard power when availableand draw from it when needed (to address supply-demandmismatch) has only recently drawn attention for datacenterDR [18, 20, 43].
Figure 1: Amortized
Monthly Costs for Physical
Infrastructure of a 10MW
Datacenter. Source: [3,
21, 32].
Energy storage in the dat-acenter has been primarilyused as a back-up mecha-nism to temporarily handlepower outages until dieselgenerators are brought on-line. This typically takes afew seconds (at most a cou-ple of minutes), and mostdatacenters provision UPSdevices with lead-acid bat-teries of possibly 2X-3X thiscapacity. Many datacenters also have multiple (e.g., N+1redundancy) UPS units for enhancing availability. Recentlysome proposals have been made to leverage either these de-vices, or add additional storage capacities, for DR within adatacenter [18, 20, 43].
Concurrently, newer high-density datacenters are beingbuilt with“distributed”ESDs, e.g., server-level UPS units inGoogle [17], rack and power distribution unit (PDU) levelunits in Facebook [12] and Microsoft [31]. The primary mo-tivation for such decentralization is to reduce energy losses:centralized UPS units cause a double-conversion whereinthey convert from AC → DC → AC which is distributed tothe servers and then converted back to DC by server-level
power supplies. Moving the UPS units close to the servercan help avoid losses due to such double-conversion (anotheralternative is to build DC-based datacenters as in [42]). Inall these cases, the ESD - whether at a server or in a rack -is still used only for handling power outages.
While recent research has shown the benefits of lead-acidbattery based UPS for datacenter DR - whether it be inshaving peaks to under-provision the power infrastructure [18,20] or for shifting demand away from high tariff periods [43],all such prior work has only considered a single type of ESD,placed at a single location in the datacenter power hierarchy.Provisioning and placement of energy storage is a complexproblem, with (i) a plethora of ESD options, (ii) each op-tion with its idiosyncracies in cost, density, wear, and opera-tional characteristics, (iii) a multitude of choices when plac-ing them at different - possibly multiple - levels of the powerhierarchy, and (iv) controlling their usage based on workloadcharacteristics. This paper presents a formal framework formodeling and optimizing these design choices. Specifically,we address the following questions in the provisioning andoperation of ESDs:
• Which ESDs should we employ? With a plethora of tech-nologies available today, we need to model the trade-offsin cost, density, wear/health, efficiency and other opera-tional characteristics when provisioning.
• Why should we be restricted to any one ESD technology?Given diversity in load demands temporally and spatially(across regions of the datacenter), should we consider mul-tiple options given that different technologies are suitedfor different kinds of workloads?
• Where should these ESDs be placed? Why should werestrict them to any one level of the datacenter powerhierarchy (e.g., central or server-level)? Does a multi-levelenergy storage hierarchy make sense given the statisticalmultiplexing effects (less burstiness) as we move up thehierarchy? An important consideration is the amount ofspace/volume that can be devoted for such ESDs, sincedatacenter real-estate is expensive.
While this paper provides specific answers to these questions(e.g., (i) single technologies suffice when there is little tem-poral/spatial heterogeneity, though the choice of technologywould depend on the workload (ultra-capacitors and fly-wheels for tall and narrow workload peaks, but compressedair and/or batteries for wide peaks); (ii) regions of diversityin workload characteristics where hybrid ESD options are at-tractive; (iii) the benefits of multi-level ESD solutions, andthe impact of volumetric constraints on these solutions), themore important contribution is a modeling and optimizationframework that can take a range of input workload speci-fications, operating conditions, and power-related costs toderive ESD provisioning and dispatch solutions towards re-ducing cap-ex and op-ex. Using a combination of syntheticworkloads which exercise the intricacies of ESD operation,and loads reported in 4 real datacenters, we demonstratehow this framework can be used to answer the above ques-tions. We believe our framework can be very helpful whendesigning and operating a datacenter power infrastructurethat leverages ESDs for DR.
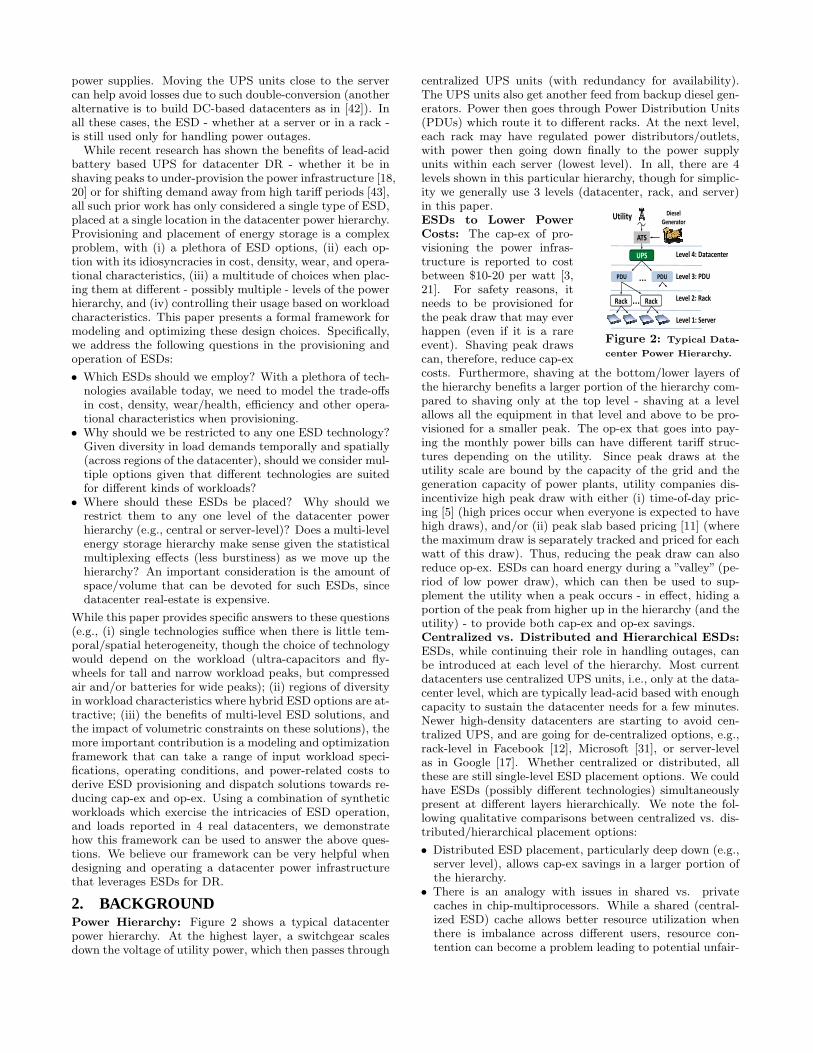
2. BACKGROUNDPower Hierarchy: Figure 2 shows a typical datacenterpower hierarchy. At the highest layer, a switchgear scalesdown the voltage of utility power, which then passes through
centralized UPS units (with redundancy for availability).The UPS units also get another feed from backup diesel gen-erators. Power then goes through Power Distribution Units(PDUs) which route it to different racks. At the next level,each rack may have regulated power distributors/outlets,with power then going down finally to the power supplyunits within each server (lowest level). In all, there are 4levels shown in this particular hierarchy, though for simplic-ity we generally use 3 levels (datacenter, rack, and server)in this paper.
���
���
����
������� ����������� ��
������ ���
������������
���������
����������������
���
���
� ���
Figure 2: Typical Data-
center Power Hierarchy.
ESDs to Lower PowerCosts: The cap-ex of pro-visioning the power infras-tructure is reported to costbetween $10-20 per watt [3,21]. For safety reasons, itneeds to be provisioned forthe peak draw that may everhappen (even if it is a rareevent). Shaving peak drawscan, therefore, reduce cap-excosts. Furthermore, shaving at the bottom/lower layers ofthe hierarchy benefits a larger portion of the hierarchy com-pared to shaving only at the top level - shaving at a levelallows all the equipment in that level and above to be pro-visioned for a smaller peak. The op-ex that goes into pay-ing the monthly power bills can have different tariff struc-tures depending on the utility. Since peak draws at theutility scale are bound by the capacity of the grid and thegeneration capacity of power plants, utility companies dis-incentivize high peak draw with either (i) time-of-day pric-ing [5] (high prices occur when everyone is expected to havehigh draws), and/or (ii) peak slab based pricing [11] (wherethe maximum draw is separately tracked and priced for eachwatt of this draw). Thus, reducing the peak draw can alsoreduce op-ex. ESDs can hoard energy during a ”valley” (pe-riod of low power draw), which can then be used to sup-plement the utility when a peak occurs - in effect, hiding aportion of the peak from higher up in the hierarchy (and theutility) - to provide both cap-ex and op-ex savings.Centralized vs. Distributed and Hierarchical ESDs:ESDs, while continuing their role in handling outages, canbe introduced at each level of the hierarchy. Most currentdatacenters use centralized UPS units, i.e., only at the data-center level, which are typically lead-acid based with enoughcapacity to sustain the datacenter needs for a few minutes.Newer high-density datacenters are starting to avoid cen-tralized UPS, and are going for de-centralized options, e.g.,rack-level in Facebook [12], Microsoft [31], or server-levelas in Google [17]. Whether centralized or distributed, allthese are still single-level ESD placement options. We couldhave ESDs (possibly different technologies) simultaneouslypresent at different layers hierarchically. We note the fol-lowing qualitative comparisons between centralized vs. dis-tributed/hierarchical placement options:
• Distributed ESD placement, particularly deep down (e.g.,server level), allows cap-ex savings in a larger portion ofthe hierarchy.
• There is an analogy with issues in shared vs. privatecaches in chip-multiprocessors. While a shared (central-ized ESD) cache allows better resource utilization whenthere is imbalance across different users, resource con-tention can become a problem leading to potential unfair-
ness. Private (distributed ESDs) caches are isolated fromeach other from this perspective. For example, two server-level ESDs that can each shave a single peak, could do sofor their respective servers. It is possible that when replac-ing them with a single ESD at the higher level (with sumof their capacities), this ESD ends up shaving two peaksof 1 server and none of the other (becoming unfair).
• As noted earlier, a completely distributed server-level ESDoption can help avoid double-conversion related energylosses compared to centralized placement.
• A centralized ESD solution may not have a serious vol-ume/real estate constraint. In fact, many facilities placesuch ESDs outside of the datacenter itself (e.g., separateroom of shelves with lead-acid batteries, flywheels, base-ments of buildings for compressed air, etc.), since data-center floor/rack space is precious (running to thousandsof dollars per square foot). A distributed/hierarchical so-lution would need real-estate within the datacenter.
Consequently, it would be interesting to find distributedand/or hierarchical ESD solutions, provided we can stip-ulate volume constraints for the ESDs at each level.Availability Issues: Prior work [18, 19, 27] has shown thatESDs can be used for DR without affecting their ability tohandle power outages, as long as a few residual minutesof capacity is always retained. We could either adopt thisoption, or have separate sets of ESDs (one set for handlingoutages and the other for DR). This relieves us of concernsof our ESD-based DR hurting datacenter availability.
3. ENERGY STORAGE DEVICES (ESD)
�����
�����
����
�����
�
�������������� ����
����������
���������
�������� ���
��������������
������� �������
��� �������
������
�����
���
��
�
���
�� ��� ����� ������ ������� ���������
�
���� ����
���� ����!"
��������������
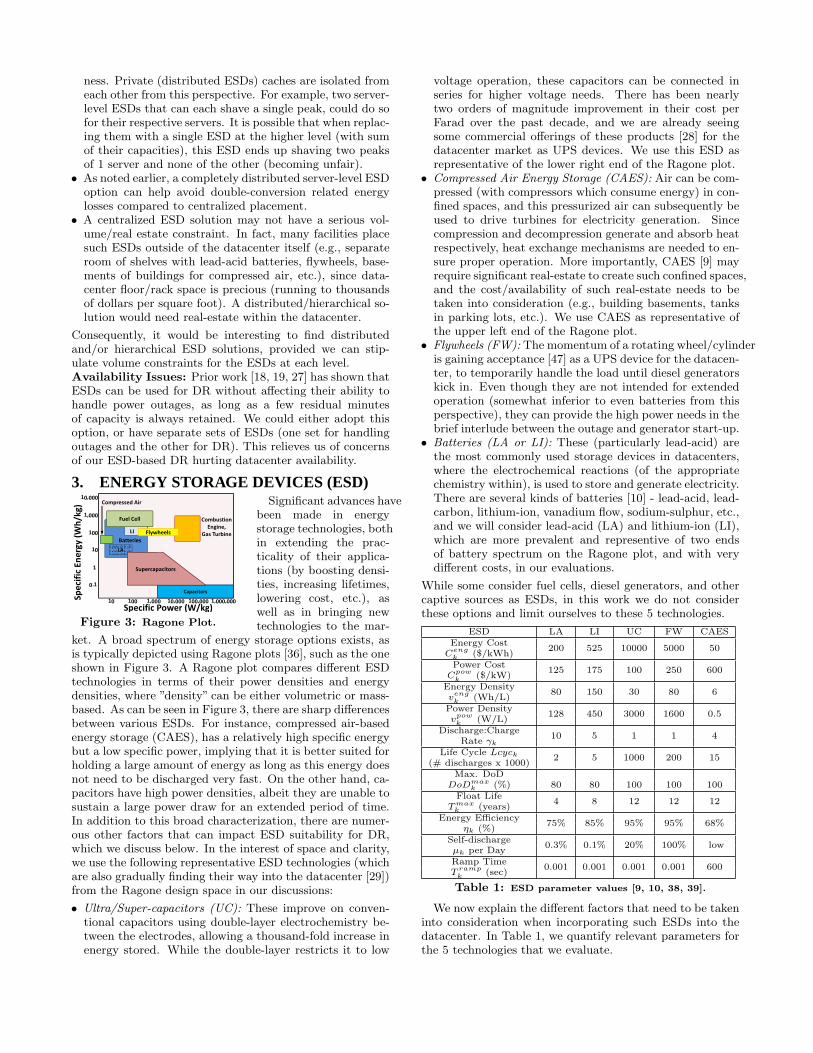
Figure 3: Ragone Plot.
Significant advances havebeen made in energystorage technologies, bothin extending the prac-ticality of their applica-tions (by boosting densi-ties, increasing lifetimes,lowering cost, etc.), aswell as in bringing newtechnologies to the mar-
ket. A broad spectrum of energy storage options exists, asis typically depicted using Ragone plots [36], such as the oneshown in Figure 3. A Ragone plot compares different ESDtechnologies in terms of their power densities and energydensities, where ”density” can be either volumetric or mass-based. As can be seen in Figure 3, there are sharp differencesbetween various ESDs. For instance, compressed air-basedenergy storage (CAES), has a relatively high specific energybut a low specific power, implying that it is better suited forholding a large amount of energy as long as this energy doesnot need to be discharged very fast. On the other hand, ca-pacitors have high power densities, albeit they are unable tosustain a large power draw for an extended period of time.In addition to this broad characterization, there are numer-ous other factors that can impact ESD suitability for DR,which we discuss below. In the interest of space and clarity,we use the following representative ESD technologies (whichare also gradually finding their way into the datacenter [29])from the Ragone design space in our discussions:
• Ultra/Super-capacitors (UC): These improve on conven-tional capacitors using double-layer electrochemistry be-tween the electrodes, allowing a thousand-fold increase inenergy stored. While the double-layer restricts it to low
voltage operation, these capacitors can be connected inseries for higher voltage needs. There has been nearlytwo orders of magnitude improvement in their cost perFarad over the past decade, and we are already seeingsome commercial offerings of these products [28] for thedatacenter market as UPS devices. We use this ESD asrepresentative of the lower right end of the Ragone plot.
• Compressed Air Energy Storage (CAES): Air can be com-pressed (with compressors which consume energy) in con-fined spaces, and this pressurized air can subsequently beused to drive turbines for electricity generation. Sincecompression and decompression generate and absorb heatrespectively, heat exchange mechanisms are needed to en-sure proper operation. More importantly, CAES [9] mayrequire significant real-estate to create such confined spaces,and the cost/availability of such real-estate needs to betaken into consideration (e.g., building basements, tanksin parking lots, etc.). We use CAES as representative ofthe upper left end of the Ragone plot.
• Flywheels (FW): The momentum of a rotating wheel/cylinderis gaining acceptance [47] as a UPS device for the datacen-ter, to temporarily handle the load until diesel generatorskick in. Even though they are not intended for extendedoperation (somewhat inferior to even batteries from thisperspective), they can provide the high power needs in thebrief interlude between the outage and generator start-up.
• Batteries (LA or LI): These (particularly lead-acid) arethe most commonly used storage devices in datacenters,where the electrochemical reactions (of the appropriatechemistry within), is used to store and generate electricity.There are several kinds of batteries [10] - lead-acid, lead-carbon, lithium-ion, vanadium flow, sodium-sulphur, etc.,and we will consider lead-acid (LA) and lithium-ion (LI),which are more prevalent and representive of two endsof battery spectrum on the Ragone plot, and with verydifferent costs, in our evaluations.
While some consider fuel cells, diesel generators, and othercaptive sources as ESDs, in this work we do not considerthese options and limit ourselves to these 5 technologies.
ESD LA LI UC FW CAESEnergy Cost
200 525 10000 5000 50C
eng
k($/kWh)
Power Cost125 175 100 250 600
Cpow
k($/kW)
Energy Density80 150 30 80 6
veng
k(Wh/L)
Power Density128 450 3000 1600 0.5
vpow
k(W/L)
Discharge:Charge10 5 1 1 4
Rate γk
Life Cycle Lcyck 2 5 1000 200 15(# discharges x 1000)
Max. DoDDoDmax
k (%) 80 80 100 100 100Float Life
4 8 12 12 12T max
k (years)Energy Efficiency
75% 85% 95% 95% 68%ηk (%)
Self-discharge0.3% 0.1% 20% 100% low
µk per DayRamp Time
0.001 0.001 0.001 0.001 600T
ramp
k(sec)
Table 1: ESD parameter values [9, 10, 38, 39].
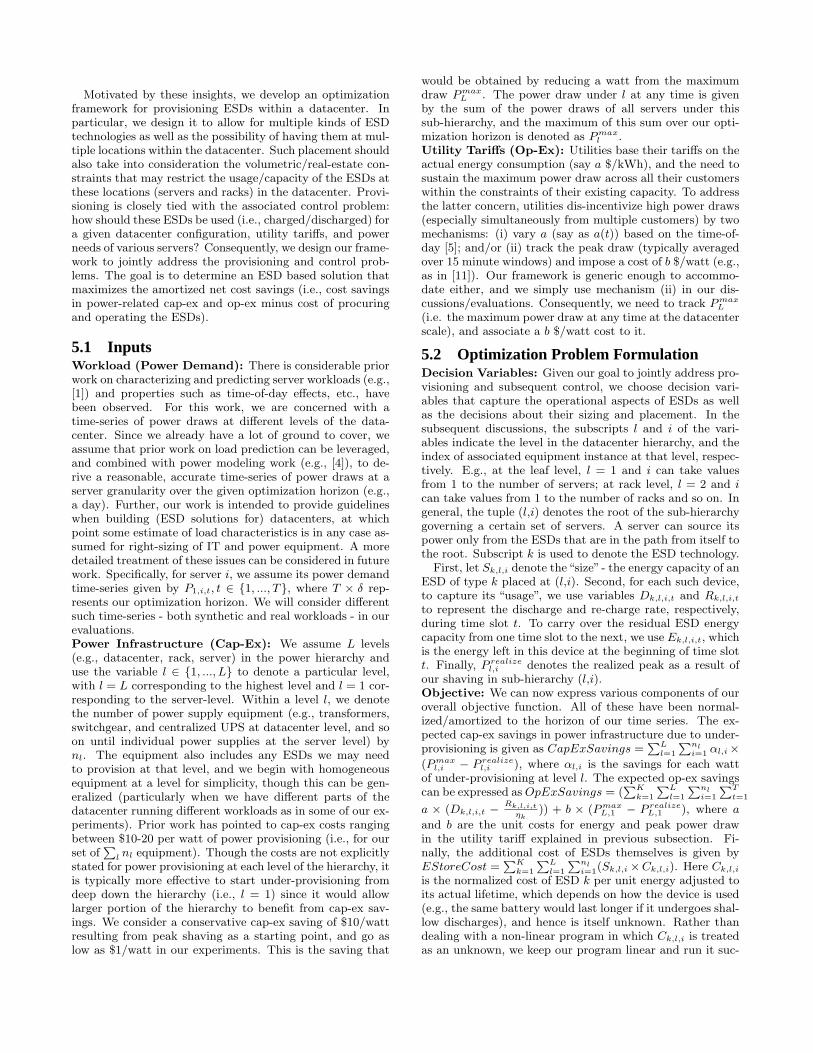
We now explain the different factors that need to be takeninto consideration when incorporating such ESDs into thedatacenter. In Table 1, we quantify relevant parameters forthe 5 technologies that we evaluate.

Cost (Energy and Power): When optimizing electricitycosts with ESDs, we need to account for the costs of theESDs themselves. The cost of ESD depends on 2 factors -the total energy that is to be stored/discharged, and the rate(power) at which the energy is to be charged/discharged.This is somewhat indicated by where the device falls on theRagone plot. Rows 1 and 2 of Table1 show these two com-ponents of the cost for the 5 ESDs under consideration. Ascan be expected, from the energy point of view, CAES isthe least expensive (50 $/kWh) with ultra-capacitors at theother end of the spectrum at 200X this cost. On the otherhand, with respect to power, ultra-capacitors are the mostattractive option with CAES being 6X more expensive. Bat-teries offer a good compromise between these extremes.Density (Energy and Power): Beyond costs, it is alsoimportant to consider the densities of these technologies re-quired to provide a certain energy and power demand. Den-sity determines the “volume” (real-estate) that needs to beprovisioned in the datacenter to sustain the demands. Sincedatacenter real-estate is very precious - whether it be rackspace or floor space, volume constraints may need to beimposed when provisioning ESDs. ESDs which may be at-tractive based on energy or power costs may not necessar-ily be suitable because of space constraints. For instance,CAES - the most cost-attractive option - is the worst fromthe density viewpoint even if we are only trying to cater toenergy demands (and willing to tolerate the slow dischargerate offered by CAES). In fact, as we will find, trying to pro-vide CAES for each server (or even a rack), is prohibitive inreal-estate demands. At best, we can consider CAES at adatacenter scale, where basements, sealed tanks in parkinglots, etc., may be options.Discharge/Charge Rate Ratio: Since ESDs alternatebetween charging and discharging, it is important that therebe sufficient charging time to hoard the required capacitybefore the next discharge. We can capture this by the dis-charge/charge ratio, which is larger than 1 (i.e., it takeslonger to charge than discharge) for many ESDs. Ultra-capacitors and flywheels may come close to this ideal behav-ior, while batteries (particularly LA) are not as attractive.Replacement Costs (Charge/Discharge cycles andLifetime): We need to consider the costs of ESD replace-ment, since the datacenter infrastructure may itself havea much longer lifetime (e.g., 12 years as suggested in [21]).The lifetime of an ESD, especially batteries, depends (amongother factors) on the number of charge-discharge cycles andthe Depth-of-Discharge (DoD) of each discharge [9]. In ad-dition, the internal chemistry itself has certain propertiessuch as lead-out, which can also impact the lifetime orthog-onal to usage. Row 8 of Table 1 gives the average lifetime(in years) of these ESDs based on typical usage. Batteriestypically need replacement while our other technologies canpossibly match the expected datacenter lifetime. It is notthat batteries stop working abruptly - rather, their capacityfor holding charge degrades over time, and replacement isdone when it drops below 80% of the original capacity.Energy Efficiency: The energy used to charge an ESD ishigher than what can be drawn out subsequently, implyinglosses. Ultra-capacitors and flywheels are very energy effi-cient, while batteries can incur losses of 15-25% based ontheir chemistries. The efficiency of CAES is even worse.Self-Discharge Losses: ESDs can lose charge even whenthey are not being discharged, with the loss proportional to
the time since the last charge. Fly-wheels can be poor fromthis perspective, and so are ultra-capacitors. Consequently,it may be desirable that such devices be charged just beforea discharge, rather than hoarding the charge for a long time.Ramp Rate: While power density is one factor influenc-ing the rate at which energy can be drawn, the ramp rateis another consideration in some ESDs. One can view theramp rate as a start up latency to change the power output(analogous to how combustion engines of automobiles canaccelerate from zero to a given speed in a certain amountof time, and then sustain it at that speed). In most ESDswe consider the ramp rate is very high (i.e., it takes at mosta few milliseconds to start supplying requisite power draw),except in CAES where it can take several minutes. Hence,CAES cannot instantaneously start sustaining any desireddraw, requiring either (i) anticipating the draw and tak-ing pro-active measures, or (ii) using some other ESD untilCAES becomes ready to sustain the draw.
4. EFFICACY OF DIFFERENT ESDSTo achieve effective selection and placement of ESDs in
the datacenter, it is important to understand the efficacy ofeach ESD technology in shaping a given power demand time-series, and use this to understand the trade-offs across thesetechnologies. Towards this, we intentionally keep the powerdemand representation simplistic at this stage (more exten-sive representations and real loads are considered later): it issimply an ON-OFF series where the ON periods correspondto a high demand value (“peaks”) while the OFF periodscorrespond to a low demand value (“valleys”). We denotethe mean amplitude (“height”) and duration (“width”) ofthe peaks and valleys of this time-series as (hpeak,wpeak)and (hvalley,wvalley), respectively. Note that both the cap-ex and op-ex costs grow with the tallest peak of the seriesas discussed in Section 2. Hence to understand the efficacyof an ESD, we focus on finding its size/cost that is neededto “shave” a certain specified portion of all the peaks (ratherthan any one peak) in the time-series. We develop a sim-ple model to compare their cost-efficacy in shaping differentkinds of power demands.
4.1 Model for a single ESDWe denote the portion (amplitude) of the peak that is to
be shaved as hshave. It is important that hshave be assigneda “realizable” value, e.g., clearly we must have hshave <
hpeak − hvalley, since an ESD capacity is finite and it needsto be charged at some point (in a valley). We denote the“frequency” of peak occurrences as fpeak = 1
wpeak+wvalley.
We use k ∈ {1, 2, ..., K} , to denote an ESD technology (soK = 5 in our evaluations). We can now translate the ESDproperties in Table 1 into the following constraints to calcu-late the cost of ESD k (Ctotal
k ) that must be provisioned toshave hshave from the demand.
First, the power and energy densities of technology k im-pose these lower bounds on the required ESD capacity (cost):
Ctotalk
Cpowk
≥ hshave;Ctotal
k
Cengk
× DoDmaxk ≥ hshave × wpeak.
Next, the device must possess enough energy at the begin-ning of a peak to shave hshave of it. It may have to acquireall of this energy by re-charging during the preceding valley,implying the following dependence on the discharge/chargerate ratio (γk). (Note that this re-charging will increase thepower drawn during the valley making it higher than hvalley,

but this increased value would still be less than hpeak−hshave
by our “realizability” assumption above):
Ctotalk
Cpowk
× wvalley ×1
γk
≥ hshave × wpeak.
Finally, the cost of ESD replacement should also be fac-tored. This is governed by its expected float-life (T max
k ), aswell as (i) the wear caused by repeated discharges and (ii)the extent/depth of each these discharges. Except for bat-teries, the other 3 ESDs have a large enough T max
k to be lessaffected. To quantify the effect of wear on the lifetime, wecan de-rate the expected number of lifetime charge-dischargecycles (Lcyck) which is calculated pessimistically at a Depth-of-Discharge of DoDmax
k , by the actual depth to which it isdischarged DoDactual
k , to get the expected lifetime of theESD k as
Lifek = min
„
1
fpeak
× Lcyck ×DoDmax
k
DoDactualk
, Tmaxk
«
.
This expected lifetime can be used to find the amortizedcost (yearly) as per each of the above three requirements(energy needs, power needs, re-charging rates), and the costof the employed ESD k is given by the maximum of thesethree requirements:
max
„
hshaveCpowk
Lifek
,hshavewpeakC
engk
Lifek × DoDmaxk
,hshavewpeakγkC
powk
wvalleyLifek
«
.
4.2 ESD Suitability for Different Demands
0 10 200
500
Pow
er (
W)
P1: (300,1,0.05)
0 10 200
500
P2: (500,1,0.05)
0 10 200
500
P3: (300,1,0.5)
0 10 200
500
P4: (500,1,0.5)
0 10 200
500
Pow
er (
W)
P5: (300,10,0.5)
0 10 200
500
P6: (500,10,0.5)
0 10 200
500
P7: (300,10,5)
0 10 200
500
P8: (500,10,5)
0 10 200
500
Time (Hour)
Pow
er (
W)
P9: (300,100,5)
0 10 200
500
Time (Hour)
P10
: (500,100,5)
0 10 200
500
Time (Hour)
P11
: (300,100,24)
0 10 200
500
Time (Hour)
P12
: (500,100,24)
Figure 4: Power demand building blocks with mean values
of (hpeak watt, wpeak min, 1
fpeakhour)
4.2.1 Model Evaluation Methodology
1 10 100
32
UltraCapacitorFlywheelLead AcidCAES
Peak Width (min)
P1,P2
8
2
0.5
Pea
k P
erio
d (h
our)
0.1
P3,P4
P7,P8
P5,P6
P9,P10
P11,P12
Figure 5: Most cost-effective
ESD for different Peak types.
Since at this stageour goal is to eval-uate the match be-tween ESD propertiesand workload charac-teristics, we begin withsynthetic power demands(using our ON-OFF se-ries described above)for which we vary theparameters over a widerange. We use normaldistributions for each
of these parameters with specified mean and variance. Wepick a set of 12 different combinations of means (2 each for
peak height and frequency, 3 for peak width, and 1 for val-ley height) that we use as our synthetic workload “buildingblocks”. Figures 4 (P1-P12) shows the 12 resulting powerdemands. For each of these 12 power demands, we choosean hshave that is realizable for that demand. Using themodel described in previous subsection, we compute the(peak width, peak frequency) region over which each of the5 ESDs under consideration is the most cost-effective (sincehshave is set to be the same for all ESDs, the resulting cap-ex and op-ex savings are identical, and hence we need onlycompare the ESD costs). We show these regions in Figure 5,together with where our 12 workloads fall.
4.2.2 Key Findings from our EvaluationNo Single Technology Always Best: For each storagetechnology, there is a portion of the workload region, whereit is cost-superior to other technologies. For example, ultra-capacitor is best when we have extremely narrow peaks (tensof seconds to a minute) as in P1-P4. Among the 5 tech-nologies, ultra-capacitors offer the cheapest cost/power draw($/kW). They can also re-charge fast enough within the highfrequency of peak occurrence in these demands. Althoughthey are the most expensive in terms of cost/unit energy($/kWh), this does not become prohibitive since the peaksto be shaved for these demands require only small amountsof energy. At the other end, CAES is an attractive option fordemands P9-P12, which are more “energy-demanding” withwide peaks (and ultra-capacitors are high cost options forthese demands). CAES, on the other hand, requires veryhigh capacities (and costs) to handle the narrow high powerpeaks where ultra-capacitors are attractive. There are re-gions in the middle where batteries (P7-P8) and flywheels(P5-P6) are the better options. Therefore, a datacenter mayneed to consider these workload idiosyncrasies and variancesover its lifetime in provisioning ESDs rather than alwaysemploying a fixed technology.Hybrid ESDs May Be Desirable: Certain technolo-gies appear complementary to each other in terms of theirpros and cons. The most stark contrast is between ultra-capacitors and CAES: while ultra-capacitors are the mostcost-effective for P1-P4, CAES turns out to be the most pro-hibitive; the reverse holds for P9-P12. Such complementarybehavior is also seen, to different degrees, for other pairsof technologies as well. Therefore, when a datacenter mayhouse different kinds of workloads - either across its differ-ent spatial regions or temporally over its lifetime - it may beworthwhile to consider hybrid ESD options.Multi-level ESD May Be Desirable: Within a datacen-ter, the nature of the power demand seen at different levelsof its power hierarchy can be different, e.g., higher averagesand smaller variances because of statistical multiplexing ef-fects as we move up. When we compare a power demandwith smaller average but higher variance (e.g, P1) againstthose with higher average but smaller variance (e.g., P10),we find different technologies being the most cost-effective.Whereas P1 is best shaped using ultra-capacitors, CAES isthe best choice for P10. Therefore, it may be desirable toemploy appropriate (possibly different) ESD technologies atmultiple - server, rack, and datacenter - levels of the powerhierarchy. Furthermore, pushing ESDs deeper down the hi-erarchy can allow higher cap-ex savings.
5. A FRAMEWORK FOR PROVISIONINGAND CONTROL OF ESDS
Motivated by these insights, we develop an optimizationframework for provisioning ESDs within a datacenter. Inparticular, we design it to allow for multiple kinds of ESDtechnologies as well as the possibility of having them at mul-tiple locations within the datacenter. Such placement shouldalso take into consideration the volumetric/real-estate con-straints that may restrict the usage/capacity of the ESDs atthese locations (servers and racks) in the datacenter. Provi-sioning is closely tied with the associated control problem:how should these ESDs be used (i.e., charged/discharged) fora given datacenter configuration, utility tariffs, and powerneeds of various servers? Consequently, we design our frame-work to jointly address the provisioning and control prob-lems. The goal is to determine an ESD based solution thatmaximizes the amortized net cost savings (i.e., cost savingsin power-related cap-ex and op-ex minus cost of procuringand operating the ESDs).
5.1 InputsWorkload (Power Demand): There is considerable priorwork on characterizing and predicting server workloads (e.g.,[1]) and properties such as time-of-day effects, etc., havebeen observed. For this work, we are concerned with atime-series of power draws at different levels of the data-center. Since we already have a lot of ground to cover, weassume that prior work on load prediction can be leveraged,and combined with power modeling work (e.g., [4]), to de-rive a reasonable, accurate time-series of power draws at aserver granularity over the given optimization horizon (e.g.,a day). Further, our work is intended to provide guidelineswhen building (ESD solutions for) datacenters, at whichpoint some estimate of load characteristics is in any case as-sumed for right-sizing of IT and power equipment. A moredetailed treatment of these issues can be considered in futurework. Specifically, for server i, we assume its power demandtime-series given by P1,i,t, t ∈ {1, ..., T}, where T × δ rep-resents our optimization horizon. We will consider differentsuch time-series - both synthetic and real workloads - in ourevaluations.Power Infrastructure (Cap-Ex): We assume L levels(e.g., datacenter, rack, server) in the power hierarchy anduse the variable l ∈ {1, ..., L} to denote a particular level,with l = L corresponding to the highest level and l = 1 cor-responding to the server-level. Within a level l, we denotethe number of power supply equipment (e.g., transformers,switchgear, and centralized UPS at datacenter level, and soon until individual power supplies at the server level) bynl. The equipment also includes any ESDs we may needto provision at that level, and we begin with homogeneousequipment at a level for simplicity, though this can be gen-eralized (particularly when we have different parts of thedatacenter running different workloads as in some of our ex-periments). Prior work has pointed to cap-ex costs rangingbetween $10-20 per watt of power provisioning (i.e., for ourset of
P
l nl equipment). Though the costs are not explicitlystated for power provisioning at each level of the hierarchy, itis typically more effective to start under-provisioning fromdeep down the hierarchy (i.e., l = 1) since it would allowlarger portion of the hierarchy to benefit from cap-ex sav-ings. We consider a conservative cap-ex saving of $10/wattresulting from peak shaving as a starting point, and go aslow as $1/watt in our experiments. This is the saving that
would be obtained by reducing a watt from the maximumdraw P max
L . The power draw under l at any time is givenby the sum of the power draws of all servers under thissub-hierarchy, and the maximum of this sum over our opti-mization horizon is denoted as P max
l .Utility Tariffs (Op-Ex): Utilities base their tariffs on theactual energy consumption (say a $/kWh), and the need tosustain the maximum power draw across all their customerswithin the constraints of their existing capacity. To addressthe latter concern, utilities dis-incentivize high power draws(especially simultaneously from multiple customers) by twomechanisms: (i) vary a (say as a(t)) based on the time-of-day [5]; and/or (ii) track the peak draw (typically averagedover 15 minute windows) and impose a cost of b $/watt (e.g.,as in [11]). Our framework is generic enough to accommo-date either, and we simply use mechanism (ii) in our dis-cussions/evaluations. Consequently, we need to track P max
L
(i.e. the maximum power draw at any time at the datacenterscale), and associate a b $/watt cost to it.
5.2 Optimization Problem FormulationDecision Variables: Given our goal to jointly address pro-visioning and subsequent control, we choose decision vari-ables that capture the operational aspects of ESDs as wellas the decisions about their sizing and placement. In thesubsequent discussions, the subscripts l and i of the vari-ables indicate the level in the datacenter hierarchy, and theindex of associated equipment instance at that level, respec-tively. E.g., at the leaf level, l = 1 and i can take valuesfrom 1 to the number of servers; at rack level, l = 2 and i
can take values from 1 to the number of racks and so on. Ingeneral, the tuple (l,i) denotes the root of the sub-hierarchygoverning a certain set of servers. A server can source itspower only from the ESDs that are in the path from itself tothe root. Subscript k is used to denote the ESD technology.
First, let Sk,l,i denote the“size” - the energy capacity of anESD of type k placed at (l,i). Second, for each such device,to capture its “usage”, we use variables Dk,l,i,t and Rk,l,i,t
to represent the discharge and re-charge rate, respectively,during time slot t. To carry over the residual ESD energycapacity from one time slot to the next, we use Ek,l,i,t, whichis the energy left in this device at the beginning of time slott. Finally, P realize
l,i denotes the realized peak as a result ofour shaving in sub-hierarchy (l,i).Objective: We can now express various components of ouroverall objective function. All of these have been normal-ized/amortized to the horizon of our time series. The ex-pected cap-ex savings in power infrastructure due to under-provisioning is given as CapExSavings =
PL
l=1
Pnli=1
αl,i ×
(P maxl,i − P realize
l,i ), where αl,i is the savings for each wattof under-provisioning at level l. The expected op-ex savingscan be expressed as OpExSavings = (
PK
k=1
PL
l=1
Pnli=1
PT
t=1
a × (Dk,l,i,t −Rk,l,i,t
ηk)) + b × (P max
L,1 − P realizeL,1 ), where a
and b are the unit costs for energy and peak power drawin the utility tariff explained in previous subsection. Fi-nally, the additional cost of ESDs themselves is given byEStoreCost =
PK
k=1
PL
l=1
Pnli=1
(Sk,l,i ×Ck,l,i). Here Ck,l,i
is the normalized cost of ESD k per unit energy adjusted toits actual lifetime, which depends on how the device is used(e.g., the same battery would last longer if it undergoes shal-low discharges), and hence is itself unknown. Rather thandealing with a non-linear program in which Ck,l,i is treatedas an unknown, we keep our program linear and run it suc-

cessively with the value of Ck,l,i yielded by one run fed intothe next run till convergence is achieved.
Finally, putting these components together, we have ourobjective as:Maximize (CapExSaving + OpExSaving − EStoreCost).Constraints: We assume that all ESDs are fully chargedat the beginning of the time-series, and need to leave themin the same state at the end of the time-series. In any timeslot, an ESD may only hold energy between a lower thresholdallowed by its recommended DoD and its maximum capacity.To capture these we have:
Ek,l,i,1 = Ek,l,i,T+1 = Sk,l,i, ∀k, l, i, (1a)
(1 − DoDmaxk ) × Sk,l,i ≤ Ek,l,i,t ≤ Sk,l,i, ∀k, l, i, t, (1b)
For each ESD, the amount of energy that can be dis-charged or stored is bounded by the product of its provi-sioned size and corresponding discharge (rdischarge
k ) and re-
charge (rrechargek ) rates:
0 ≤ Dk,l,i,t ≤ Sk,l,i × rdischargek , ∀k, l, i, t, (2a)
0 ≤ Rk,l,i,t ≤ Sk,l,i × rrechargek , ∀k, l, i, t, (2b)
We account for the conversion losses (energy efficiency ηk)of an ESD, during the charging process as
Pl,i,t =Pnl−1,i
j=1
“
Pl−1,j,t +PK
k=1
Rk,l−1,j,t
ηk−PK
k=1Dk,l−1,j,t
”
,
∀l ≥ 2, i, j, t, (3a)
Furthermore, when charging we should still ensure that thenet power draw (including the power for all the equipmentunder l) is bound by P realize
l,i (which is in turn less thanP max
l,i ). This gives us:
0 ≤ Pl,i,t +KX
k=1
Rk,l,i,t
ηk
−KX
k=1
Dk,l,i,t ≤ Prealizel,i , ∀l, i, t, (3b)
0 ≤ Prealizel,i ≤ P
maxl,i , ∀l, i, (3c)
To account for energy losses due to self-discharge (µk)characteristics, we have
Ek,l,i,t = Ek,l,i,t−1 + Rk,l,i,t−1δ − Dk,l,i,t−1δ − Ek,l,i,t−1µk,
∀k, l, i, t ≥ 2, (4)
The ramp-up properties of ESDs pose restrictions on howfast the rate of discharge can itself increase over time (recallthe analogy of car acceleration). We capture this as:
Dk,l,i,t+1 − Dk,l,i,t
δ≤
Sk,l,i × rdischargek,l,i,t
Trampk
, ∀k, l, i, t, (5)
Our final constraints restricts the volume (V maxl,i ) within
which the ESDs must be accommodated at various levels:
KX
k=1
„
Sk,l,i
vengk
«
≤ Vmax
l,i , ∀l, i, (6a)
and
KX
k=1
Sk,l,i × rdischargek
vpowk
!
≤ Vmax
l,i , ∀l, i, (6b)
Discussion: When solving for a large datacenter with thou-sands of servers, this strategy can become intractable. We
exploit the homogeneity of load across servers to appropri-ately scale down the number of decision variables, togetherwith associated parameters. Finally, it should be noted thatour framework automatically allows one ESD to charge bydischarging another ESD instead of only using utility power.
6. EXPERIMENTS AND EVALUATION
6.1 Experimental Setup and Methodology
Max. Power 4 MW# racks 256
# servers 8192V max
220% of rack vol.
V max1
10% of server vol.Cap-ex (α) $10,$1/Watt
Op-ex energy (a) $0.05/kWhOp-ex peak (b) $12/kW/Month
Table 2: Parameter Values.
Configuration and Pa-rameters: Our evalu-ations use a 4 MW dat-acenter of 8192 servers(placed in racks of32 servers/rack), eachwith a 500W powersupply, organized in ahierarchy as in Fig-
ure 2. We choose three levels for placing ESDs (L=3): top ofthe hierarchy (l=3, as in most datacenters today), rack-level(l=2, corresponding to some reported datacenters of Face-book [12] and Microsoft [31]), and server-level (l=1, as insome reported datacenters of Google [17]). Again note thatthese reported datacenters still place their ESDs at only onelevel, and not as a multi-level hierarchy which we allow.
We present results for K = 5 ESD technologies discussedearlier (however, LI based solutions do not explicitly appearin the results since whenever LI comes up on top of LA, theCAES option does even better). As discussed in Section 2,we use an op-ex cost model (Table 2) that is representativeof that charged by Duke Electric [11], which has a monthlypeak component charge of $12/kW/month in addition to theenergy usage charge. We consider cap-ex cost of $10/W forthe datacenter power infrastructure which is at the lower endof the $10-20/W range reported in literature [3, 21]. Sinceit is difficult to quantify the cap-ex benefits for peak reduc-tion only at a lower level of the hierarchy, we also considersensitivity experiments where we push cap-ex costs as lowas $1/W in our technical report [48]. Note that even a centof difference in additional cap-ex savings (i.e., αl+1−αl > ǫ)when we push ESDs deeper down the hierarchy, will auto-matically enable our formulation to place ESDs deeper downthe hierarchy as allowed by volume constraints. The cap-ex (12 year datacenter lifetime), op-ex (typically chargedmonthly), and ESD costs (appropriate actual lifetimes) areamortized for the horizon of the time series.ESD Placement/Configurations: For comparison, weuse 3 existing baseline strategies which are all “non-hybrid& single-level” placement styles (i.e., only one ESD technol-ogy x used at only one level in a given solution): Bdc,x,Brack,x, Bserver,x. Though these represent some datacenterESD placement styles in use today, note that x=lead-acidbatteries in most of them, and their capacities are chosenjust for power outages. Our solutions will consider otheroptions for x together with higher capacities. We comparethese baselines with: (i)“hybrid & single-level,”where we al-low multiple technologies to be provisioned at a fixed level -centralized (HybSindc), rack-level (HybSinrack), or server-level (HybSinserver), and (ii) “hybrid & multi-level,” wherewe allow multiple technologies to be provisioned at possiblyall of these levels (HybMul).Workloads (Power Demands): To stress and understandthe impact of workload parameters, we take the individualsynthetic power demands P1 ... P12 described earlier in sec-
tion 4 and combine them in interesting ways (pair-wise) tobring out the impact of homogeneity and heterogeneity ofworkload behavior on ESD provisioning (section 6.2). Eachresulting server-level power demand time-series spans a day,with each point in the series corresponding to the powerneeds over a one minute duration. Broadly, we refer to thepeaks with mean width upto a minute as “narrow,” 1-10minutes as “medium,” and higher (10 minutes to 2 hours)as “wide.” In addition, Section 6.3 studies these issues withpower demands of real-world datacenters and clusters (forGoogle [13], TCS [44], MSN [8] and stream media clusters[23]), reported in prior studies.
6.2 Synthetic Workload Experiments
�� ���������������������������� ����������������
������
�����������������������
�� �� �� �� �� �� �� �� � �� ��� ���
��������������� ����������������������� ���������� �������������
������
�
�
�� ��
��
����
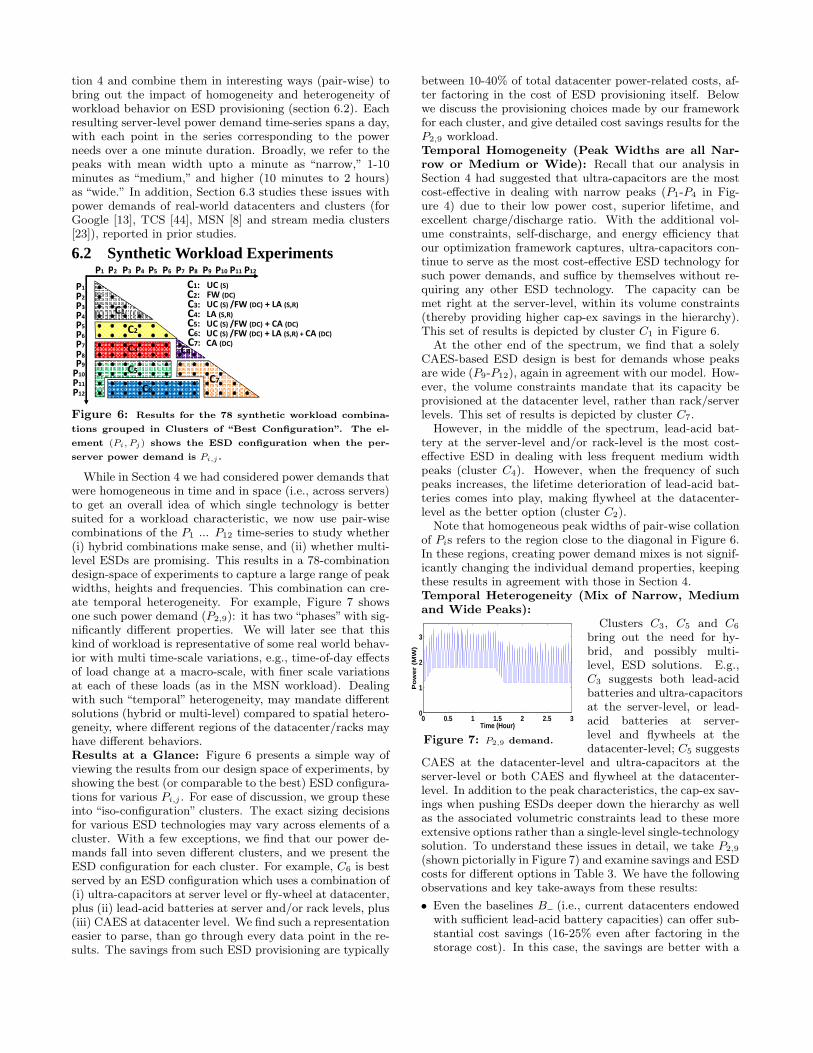
Figure 6: Results for the 78 synthetic workload combina-
tions grouped in Clusters of “Best Configuration”. The el-
ement (Pi, Pj) shows the ESD configuration when the per-
server power demand is Pi,j .
While in Section 4 we had considered power demands thatwere homogeneous in time and in space (i.e., across servers)to get an overall idea of which single technology is bettersuited for a workload characteristic, we now use pair-wisecombinations of the P1 ... P12 time-series to study whether(i) hybrid combinations make sense, and (ii) whether multi-level ESDs are promising. This results in a 78-combinationdesign-space of experiments to capture a large range of peakwidths, heights and frequencies. This combination can cre-ate temporal heterogeneity. For example, Figure 7 showsone such power demand (P2,9): it has two “phases”with sig-nificantly different properties. We will later see that thiskind of workload is representative of some real world behav-ior with multi time-scale variations, e.g., time-of-day effectsof load change at a macro-scale, with finer scale variationsat each of these loads (as in the MSN workload). Dealingwith such “temporal” heterogeneity, may mandate differentsolutions (hybrid or multi-level) compared to spatial hetero-geneity, where different regions of the datacenter/racks mayhave different behaviors.Results at a Glance: Figure 6 presents a simple way ofviewing the results from our design space of experiments, byshowing the best (or comparable to the best) ESD configura-tions for various Pi,j . For ease of discussion, we group theseinto “iso-configuration” clusters. The exact sizing decisionsfor various ESD technologies may vary across elements of acluster. With a few exceptions, we find that our power de-mands fall into seven different clusters, and we present theESD configuration for each cluster. For example, C6 is bestserved by an ESD configuration which uses a combination of(i) ultra-capacitors at server level or fly-wheel at datacenter,plus (ii) lead-acid batteries at server and/or rack levels, plus(iii) CAES at datacenter level. We find such a representationeasier to parse, than go through every data point in the re-sults. The savings from such ESD provisioning are typically
between 10-40% of total datacenter power-related costs, af-ter factoring in the cost of ESD provisioning itself. Belowwe discuss the provisioning choices made by our frameworkfor each cluster, and give detailed cost savings results for theP2,9 workload.Temporal Homogeneity (Peak Widths are all Nar-row or Medium or Wide): Recall that our analysis inSection 4 had suggested that ultra-capacitors are the mostcost-effective in dealing with narrow peaks (P1-P4 in Fig-ure 4) due to their low power cost, superior lifetime, andexcellent charge/discharge ratio. With the additional vol-ume constraints, self-discharge, and energy efficiency thatour optimization framework captures, ultra-capacitors con-tinue to serve as the most cost-effective ESD technology forsuch power demands, and suffice by themselves without re-quiring any other ESD technology. The capacity can bemet right at the server-level, within its volume constraints(thereby providing higher cap-ex savings in the hierarchy).This set of results is depicted by cluster C1 in Figure 6.
At the other end of the spectrum, we find that a solelyCAES-based ESD design is best for demands whose peaksare wide (P9-P12), again in agreement with our model. How-ever, the volume constraints mandate that its capacity beprovisioned at the datacenter level, rather than rack/serverlevels. This set of results is depicted by cluster C7.
However, in the middle of the spectrum, lead-acid bat-tery at the server-level and/or rack-level is the most cost-effective ESD in dealing with less frequent medium widthpeaks (cluster C4). However, when the frequency of suchpeaks increases, the lifetime deterioration of lead-acid bat-teries comes into play, making flywheel at the datacenter-level as the better option (cluster C2).
Note that homogeneous peak widths of pair-wise collationof Pis refers to the region close to the diagonal in Figure 6.In these regions, creating power demand mixes is not signif-icantly changing the individual demand properties, keepingthese results in agreement with those in Section 4.Temporal Heterogeneity (Mix of Narrow, Mediumand Wide Peaks):
0 0.5 1 1.5 2 2.5 30
1
2
3
Time (Hour)
Po
we
r (M
W)
Figure 7: P2,9 demand.
Clusters C3, C5 and C6
bring out the need for hy-brid, and possibly multi-level, ESD solutions. E.g.,C3 suggests both lead-acidbatteries and ultra-capacitorsat the server-level, or lead-acid batteries at server-level and flywheels at thedatacenter-level; C5 suggests
CAES at the datacenter-level and ultra-capacitors at theserver-level or both CAES and flywheel at the datacenter-level. In addition to the peak characteristics, the cap-ex sav-ings when pushing ESDs deeper down the hierarchy as wellas the associated volumetric constraints lead to these moreextensive options rather than a single-level single-technologysolution. To understand these issues in detail, we take P2,9
(shown pictorially in Figure 7) and examine savings and ESDcosts for different options in Table 3. We have the followingobservations and key take-aways from these results:
• Even the baselines B (i.e., current datacenters endowedwith sufficient lead-acid battery capacities) can offer sub-stantial cost savings (16-25% even after factoring in thestorage cost). In this case, the savings are better with a
B HybSin HybMul(savings, cost) (savings, cost) (savings, cost)
Datacenter LA UC+FW+CAES FW+CAES(2.6k,0.5k) (3.0k, 0.2k)
Rack LA UC+LA -(2.3k,0.3k) (3.0k,0.2k)
Server LA UC+LA UC(1.7k,0.1k) (3.0k,0.2k) (3k,0.2k)
Table 3: P2,9: (Savings($/day), ESD costs($/day)). Total
cost without ESD is $10K/day.
centralized ESD that does not have volume constraints asopposed to restricted capacity sizes deeper in the hierar-chy, since we do not have explicit cap-ex savings valueswhen shaving peaks at each level of the power hierarchy.This lack of additional cap-ex information about savingswhen we go deeper down the hierarchy (which is conser-vatively set to ǫ) is also the reason why the cost savingswith HybMul are not different from those of HybSindc
(though in reality the savings are likely to be higher forHybMul).
• For datacenters with centralized ESD, CAES (in combi-nation with flywheels or ultra-capacitors if there are talland narrow peaks to compensate for the slow ramp rateof CAES) appears to be a better option if space is nota problem. For instance, CAES-based hybrid datacen-ter level solutions provide 15% better savings than just alead-acid centralized solution.
• The improvements that our HybSin_ techniques offer overtheir corresponding baselines improve as we go down thehierarchy (HybSindc offers 15% more cost savings thatBdc while HybSinserver offers over 75% more cost sav-ings than Bserver). This results from the more stringentvolume constraints at lower levels, where hybrid solutionsthat include ESDs with higher power and/or energy den-sity offer larger gains. This may suggest that recent data-centers with distributed ESDs, like those at Google, Face-book and Microsoft, may benefit further from a move tohybrid ESDs.
Spatial Heterogeneity: Until now, we have only discussedspatially homogeneous power demands (i.e., all servers acrossthe datacenter experience the same power demands). How-ever, our techniques can address heterogeneous demands,and in fact hybrid and multi-level ESDs make even moresense in such environments. Many datacenters host differ-ent applications, with diverse power demands, e.g. a searchengine may have applications which directly cater to Inter-net requests along with crawlers running in the background.These may not necessarily run on the same servers, and mayeven fall in different power sub-hierarchies in the datacen-ter. In the interest of space, we summarize one result toillustrate this point. When half the servers run P1 and theother half run P12, and we compare our HybSinserver whichuses ultra-capacitors and lead-acid batteries in the two setsof servers respectively, it provides over 50% more cost sav-ings than both homogeneous ESD baselines Bserver,UC andBserver,LA.
6.3 Real Workload ExperimentsIn this section, we construct power demands to mimic be-
havior reported previously in four different real-world data-centers/clusters.
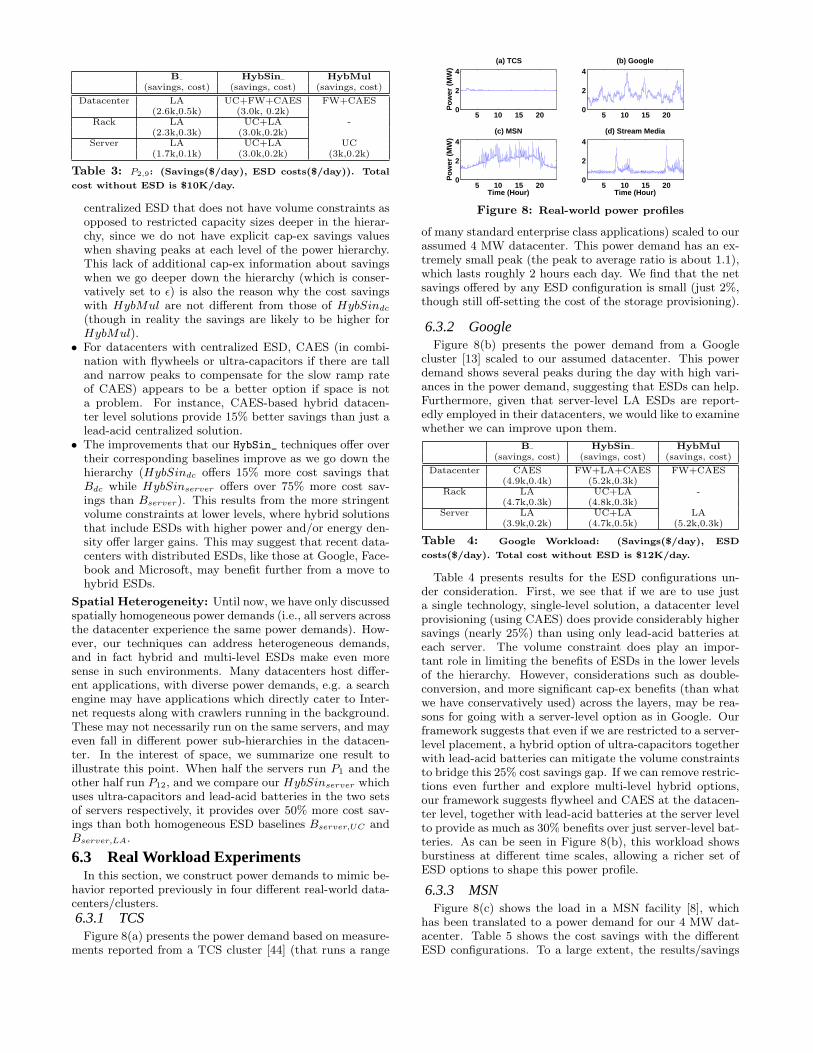
6.3.1 TCSFigure 8(a) presents the power demand based on measure-
ments reported from a TCS cluster [44] (that runs a range
5 10 15 200
2
4(a) TCS
Pow
er (
MW
)
5 10 15 200
2
4(b) Google
5 10 15 200
2
4
Time (Hour)
Pow
er (
MW
)
(c) MSN
5 10 15 200
2
4(d) Stream Media
Time (Hour)
Figure 8: Real-world power profiles
of many standard enterprise class applications) scaled to ourassumed 4 MW datacenter. This power demand has an ex-tremely small peak (the peak to average ratio is about 1.1),which lasts roughly 2 hours each day. We find that the netsavings offered by any ESD configuration is small (just 2%,though still off-setting the cost of the storage provisioning).
6.3.2 GoogleFigure 8(b) presents the power demand from a Google
cluster [13] scaled to our assumed datacenter. This powerdemand shows several peaks during the day with high vari-ances in the power demand, suggesting that ESDs can help.Furthermore, given that server-level LA ESDs are report-edly employed in their datacenters, we would like to examinewhether we can improve upon them.
B HybSin HybMul(savings, cost) (savings, cost) (savings, cost)
Datacenter CAES FW+LA+CAES FW+CAES(4.9k,0.4k) (5.2k,0.3k)
Rack LA UC+LA -(4.7k,0.3k) (4.8k,0.3k)
Server LA UC+LA LA(3.9k,0.2k) (4.7k,0.5k) (5.2k,0.3k)
Table 4: Google Workload: (Savings($/day), ESD
costs($/day). Total cost without ESD is $12K/day.
Table 4 presents results for the ESD configurations un-der consideration. First, we see that if we are to use justa single technology, single-level solution, a datacenter levelprovisioning (using CAES) does provide considerably highersavings (nearly 25%) than using only lead-acid batteries ateach server. The volume constraint does play an impor-tant role in limiting the benefits of ESDs in the lower levelsof the hierarchy. However, considerations such as double-conversion, and more significant cap-ex benefits (than whatwe have conservatively used) across the layers, may be rea-sons for going with a server-level option as in Google. Ourframework suggests that even if we are restricted to a server-level placement, a hybrid option of ultra-capacitors togetherwith lead-acid batteries can mitigate the volume constraintsto bridge this 25% cost savings gap. If we can remove restric-tions even further and explore multi-level hybrid options,our framework suggests flywheel and CAES at the datacen-ter level, together with lead-acid batteries at the server levelto provide as much as 30% benefits over just server-level bat-teries. As can be seen in Figure 8(b), this workload showsburstiness at different time scales, allowing a richer set ofESD options to shape this power profile.
6.3.3 MSNFigure 8(c) shows the load in a MSN facility [8], which
has been translated to a power demand for our 4 MW dat-acenter. Table 5 shows the cost savings with the differentESD configurations. To a large extent, the results/savings
are similar to those in the Google workload - capacity lim-itations and conservative cap-ex cost assumptions limit theextent of savings with just server-level lead-acid batteries,and CAES/flywheels can better augment the power needscentrally. The main difference is that this workload hasvery diverse sets of peaks - some last as long as 8 hours perday, and some which are at most a few minutes. The shortand bursty tall power spikes favor a ultra-capacitor basedsolution at the server level, whether it be in HybSinserver
or HybMul. Overall we find HybMul giving around 30%and 20% better savings than server level alone, or rack-levelalone placement of lead-acid batteries.
B HybSin HybMul(savings, cost) (savings, cost) (savings, cost)
Datacenter LA UC+FW+CAES FW+CAES(4.0k,0.5k) (4.4k,0.3k)
Rack LA UC+LA -(3.8k,0.3k) (4.3k,0.3k)
Server LA UC+LA UC(3.4k,0.1k) (4.2k,0.2k) (4.4k,0.3k)
Table 5: MSN Workload: (Savings($/day), ESD
costs($/day). Total cost without ESD is $15K/day.
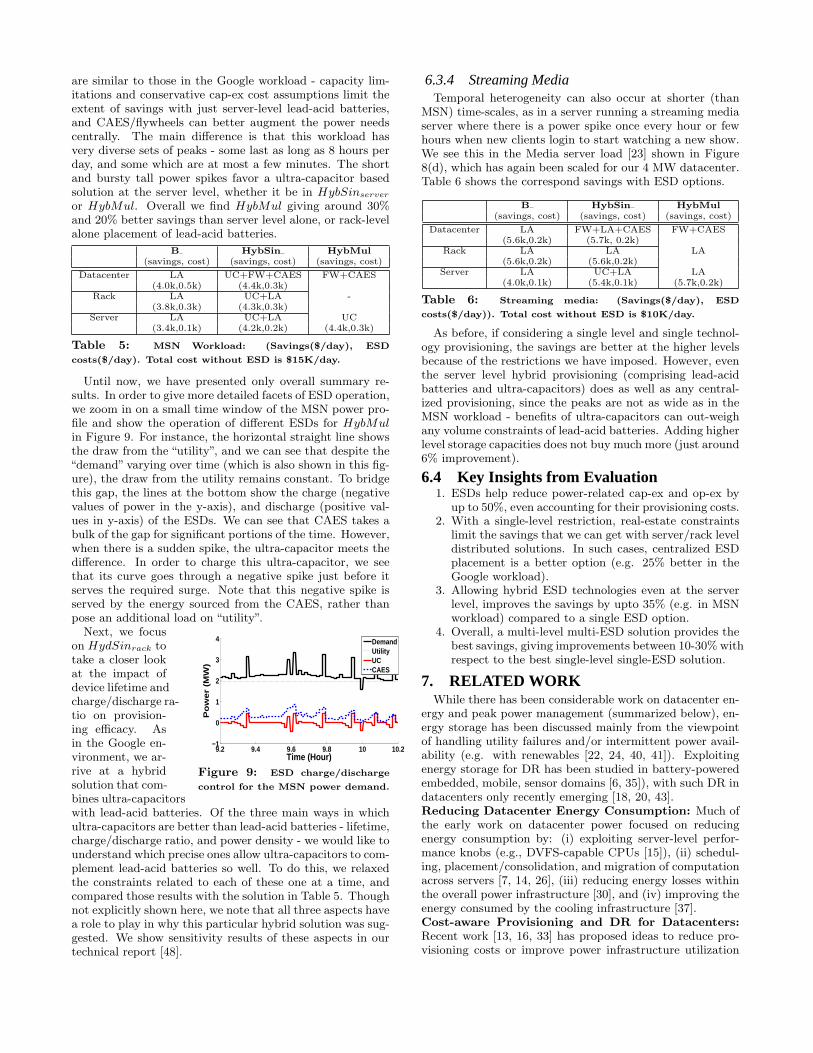
Until now, we have presented only overall summary re-sults. In order to give more detailed facets of ESD operation,we zoom in on a small time window of the MSN power pro-file and show the operation of different ESDs for HybMul
in Figure 9. For instance, the horizontal straight line showsthe draw from the “utility”, and we can see that despite the“demand” varying over time (which is also shown in this fig-ure), the draw from the utility remains constant. To bridgethis gap, the lines at the bottom show the charge (negativevalues of power in the y-axis), and discharge (positive val-ues in y-axis) of the ESDs. We can see that CAES takes abulk of the gap for significant portions of the time. However,when there is a sudden spike, the ultra-capacitor meets thedifference. In order to charge this ultra-capacitor, we seethat its curve goes through a negative spike just before itserves the required surge. Note that this negative spike isserved by the energy sourced from the CAES, rather thanpose an additional load on “utility”.
9.2 9.4 9.6 9.8 10 10.2−1
0
1
2
3
4
Time (Hour)
Po
we
r (M
W)
DemandUtilityUCCAES
Figure 9: ESD charge/discharge
control for the MSN power demand.
Next, we focuson HydSinrack totake a closer lookat the impact ofdevice lifetime andcharge/discharge ra-tio on provision-ing efficacy. Asin the Google en-vironment, we ar-rive at a hybridsolution that com-bines ultra-capacitorswith lead-acid batteries. Of the three main ways in whichultra-capacitors are better than lead-acid batteries - lifetime,charge/discharge ratio, and power density - we would like tounderstand which precise ones allow ultra-capacitors to com-plement lead-acid batteries so well. To do this, we relaxedthe constraints related to each of these one at a time, andcompared those results with the solution in Table 5. Thoughnot explicitly shown here, we note that all three aspects havea role to play in why this particular hybrid solution was sug-gested. We show sensitivity results of these aspects in ourtechnical report [48].
6.3.4 Streaming MediaTemporal heterogeneity can also occur at shorter (than
MSN) time-scales, as in a server running a streaming mediaserver where there is a power spike once every hour or fewhours when new clients login to start watching a new show.We see this in the Media server load [23] shown in Figure8(d), which has again been scaled for our 4 MW datacenter.Table 6 shows the correspond savings with ESD options.
B HybSin HybMul(savings, cost) (savings, cost) (savings, cost)
Datacenter LA FW+LA+CAES FW+CAES(5.6k,0.2k) (5.7k, 0.2k)
Rack LA LA LA(5.6k,0.2k) (5.6k,0.2k)
Server LA UC+LA LA(4.0k,0.1k) (5.4k,0.1k) (5.7k,0.2k)
Table 6: Streaming media: (Savings($/day), ESD
costs($/day)). Total cost without ESD is $10K/day.
As before, if considering a single level and single technol-ogy provisioning, the savings are better at the higher levelsbecause of the restrictions we have imposed. However, eventhe server level hybrid provisioning (comprising lead-acidbatteries and ultra-capacitors) does as well as any central-ized provisioning, since the peaks are not as wide as in theMSN workload - benefits of ultra-capacitors can out-weighany volume constraints of lead-acid batteries. Adding higherlevel storage capacities does not buy much more (just around6% improvement).
6.4 Key Insights from Evaluation1. ESDs help reduce power-related cap-ex and op-ex by
up to 50%, even accounting for their provisioning costs.2. With a single-level restriction, real-estate constraints
limit the savings that we can get with server/rack leveldistributed solutions. In such cases, centralized ESDplacement is a better option (e.g. 25% better in theGoogle workload).
3. Allowing hybrid ESD technologies even at the serverlevel, improves the savings by upto 35% (e.g. in MSNworkload) compared to a single ESD option.
4. Overall, a multi-level multi-ESD solution provides thebest savings, giving improvements between 10-30% withrespect to the best single-level single-ESD solution.
7. RELATED WORKWhile there has been considerable work on datacenter en-
ergy and peak power management (summarized below), en-ergy storage has been discussed mainly from the viewpointof handling utility failures and/or intermittent power avail-ability (e.g. with renewables [22, 24, 40, 41]). Exploitingenergy storage for DR has been studied in battery-poweredembedded, mobile, sensor domains [6, 35]), with such DR indatacenters only recently emerging [18, 20, 43].Reducing Datacenter Energy Consumption: Much ofthe early work on datacenter power focused on reducingenergy consumption by: (i) exploiting server-level perfor-mance knobs (e.g., DVFS-capable CPUs [15]), (ii) schedul-ing, placement/consolidation, and migration of computationacross servers [7, 14, 26], (iii) reducing energy losses withinthe overall power infrastructure [30], and (iv) improving theenergy consumed by the cooling infrastructure [37].Cost-aware Provisioning and DR for Datacenters:Recent work [13, 16, 33] has proposed ideas to reduce pro-visioning costs or improve power infrastructure utilization

with underprovisioning and statistically multiplexing it amongworkloads of complementary power needs. Such work reliesupon reactive power control mechanisms to ensure safetyand limit performance overheads during such emergencies [37].DR techniques have been explored to reduce the utility billby adapting power consumption to the vagaries of electricitycost and availability. These include: (i) across datacenters- dynamic workload redistribution to datacenter sites withcheaper prices or power availability [34, 46] and (ii) withina datacenter - complementing the utility draw with energystorage during periods when energy is expensive or unavail-able [43], workload scheduling/postponement to match elec-tricity price [25], etc.
8. CONCLUSIONS AND FUTURE WORKFor the first time, this paper has investigated the novel
problem of energy storage provisioning - what, where andhow much - in the datacenter for Demand Response (DR)purposes. With a plethora of energy storage options, intri-cacies in their characteristics, pros and cons of placing themin different layers of the power hierarchy, and their suit-ability to diverse workload characteristics, there are numer-ous design choices when provisioning and dispatching powerfrom these energy storage devices. We have presented a de-tailed treatise on energy storage technologies/characteristicsimpacting their operation in the datacenter. We have pre-sented a simple model to gauge the suitability of a giventechnology to different workload power profiles, and usedthis to identify the regions where each becomes cost-effective.We have then formalized a systematic framework for cap-turing the different intricacies of ESD operations, and de-veloped a generalized optimization platform for ESD place-ment and control in the datacenter. This platform can beinvaluable in datacenter design, capturing a whole spectrumof costs, constraints and workload demands.
Using a wide spectrum of synthetic workloads that stressdifferent aspects of these ESDs, we have shown (i) homo-geneous ESD technologies suffice when there is not muchheterogeneity in the workload, though the region of opera-tion will decide which ESD should be deployed (e.g., narrow,tall and frequent peaks suited for ultra-capacitors/flywheelsvs. broad and infrequent peaks better suited for compressedair and possibly batteries); (ii) even when placing ESDs ina single layer of the power hierarchy, considerations suchas how much of the power hierarchy to optimize, volumeconstraints deciding storage capacity, and statistical multi-plexing effects of the workload, influence where (server, rackor datacenter levels) the ESDs should be placed; (iii) even ata single layer of the power hierarchy, hybrid ESD solutionsemploying multiple technologies can offset the limitations ofthese constraints to provide substantial benefits (e.g., 25%improvement in cost savings in MSN at the server level);(iv) even if a hybrid ESD option is not employed at eachlevel, a multi-layer hybrid solution can provide as much, ifnot better, savings across the spectrum of workloads thatwe have studied. The hybrid and multi-level ESD solutionsare even more beneficial when the temporal (over differenttime scales) and spatial (across regions of the datacenter)heterogeneity in the workload increases.
We are building a small scale prototype with actual ESDsto study these issues experimentally. Further, we are lookingto improve control/dispatch algorithms of the ESDs avail-able in the datacenter based on continuously evolving prop-
erties. Our contributions are analogous to those in capacityplanning of IT load for provisioning computing equipmentin the datacenter, with the difference being that we are fo-cusing on power provisioning. Such planning usually in-volves awareness of the workload, to help in right-sizing ofthe equipment. We believe this paper provides the valuabletools toward right-sizing the power infrastructure (when adatacenter is built) given workload characteristics.
9. ACKNOWLEDGMENTSThis work was supported, in part, by NSF grants CNS-0720456, CNS-0615097, CAREER award 0953541, and re-search awards from Google and HP.
10. REFERENCES[1] M. F. Arlitt and C. L. Williamson. Internet Web
Servers: Workload Characterization and PerformanceImplications. IEEE Trans. Netw., 5(5):631–645, 1997.
[2] A. Bar-Noy, M. P. Johnson, and O. Liu. Peak ShavingThrough Resource Buffering. In Workshop OnApproximation and Online Algorithms, 2008.
[3] L. A. Barroso and U. Holzle. The Datacenter as aComputer: An Introduction to the Design ofWarehouse-Scale Machines. Morgan and ClaypoolPublishers, 2009.
[4] D. Brooks, V. Tiwari, and M. Martonosi. Wattch: aframework for architectural-level power analysis andoptimizations. In Proceedings of ISCA, 2000.
[5] California ISO Open Access Same-time InformationSystem Hourly Average Energy Prices, Nov. 2011.http://oasishis.caiso.com/.
[6] Q. Cao, D. Kassa, N. Pham, Y. Sarwar, andT. Abdelzaher. Virtual Battery: An Energy ReserveAbstraction for Embedded Sensor Networks. InProceedings of RTSS, 2008.
[7] J. Chase, D. Anderson, P. Thakur, and A. Vahdat.Managing Energy and Server Resources in HostingCenters. In Proceedings of SOSP, 2001.
[8] G. Chen, W. He, J. Liu, S. Nath, L. Rigas, L. Xiao,and F. Zhao. Energy-aware Server Provisioning andLoad Dispatching for Connection-intensive InternetServices. In Proceedings of NSDI, 2008.
[9] H. Chen, T. N. Cong, W. Yang, C. Tan, Y. Li, andY. Ding. Progress in Electrical Energy StorageSystem: A Critical Review. Progress in NaturalScience, 19(3), 2009.
[10] K. C. Divya and J. Stergaard. Battery Energy StorageTechnology for Power Systems - An Overview. ElectricPower Systems Research, 79(4), 2009.
[11] Duke Utility Bill Tariff, Oct. 2011. http://www.duke-energy.com/pdfs/scscheduleopt.pdf.
[12] Facebook Open Compute Project, Nov. 2011.opencompute.org.
[13] X. Fan, W.-D. Weber, and L. A. Barroso. PowerProvisioning for a Warehouse-Sized Computer. InProceedings of ISCA, 2007.
[14] A. Gandhi, V. Gupta, M. Harchol-Balter, andM. Kozuch. Optimality Analysis ofEnergy-Performance Trade-off for Server FarmManagement. In Proceedings of SIGMETRICS, 2010.
[15] A. Gandhi, M. Harchol-Balter, R. Das, andC. Lefurgy. Optimal Power Allocation in ServerFarms. In Proceedings of SIGMETRICS, 2009.

[16] D. Gmach, J. Rolia, C. Bash, Y. Chen, T. Christian,A. Shah, R. K. Sharma, and Z. Wang. CapacityPlanning and Power Management to ExploitSustainable Energy. In Proceedings of CNSM, 2010.
[17] Google Server-level UPS for Improved Efficiency, Apr.2009. http://news.cnet.com/8301-1001_3-10209580-92.html.
[18] S. Govindan, A. Sivasubramaniam, and B. Urgaonkar.Benefits and Limitations of Tapping into StoredEnergy For Datacenters. In Proceedings of ISCA, 2011.
[19] S. Govindan, D. Wang, L. Chen, A. Sivasubramaniam,and B.Urgaonkar. Towards Realizing a Low Cost andHighly Available Datacenter Power Infrastructure. InWorkshop on HotPower, 2011.
[20] S. Govindan, D. Wang, A. Sivasubramaniam, andB. Urgaonkar. Leveraging Stored Energy for HandlingPower Emergencies in Aggressively ProvisionedDatacenters. In Proceedings of ASPLOS, 2012.
[21] J. Hamilton. Internet-scale Service InfrastructureEfficiency, ISCA 2009, Keynote.http://perspectives.mvdirona.com/.
[22] K. Le, R. Bianchini, T. D. Nguyen, O. Bilgir, andM. Martonosi. Capping the Brown EnergyConsumption of Internet Services at Low Cost. InProceedings of IGCC, 2010.
[23] B. Li, G. Y. Keung, S. Xie, F. Liu, Y. Sun, andH. Yin. An Empirical Study of Flash Crowd Dynamicsin a P2P-Based Live Video Streaming System. InProceedings of GLOBECOM, 2008.
[24] C. Li, A. Qouneh, and T. Li. Characterizing andAnalyzing Renewable Energy Driven Data Centers. InProceedings of SIGMETRICS, 2011.
[25] J. Li, Z. Li, K. Ren, X. Liu, and H. Su. TowardsOptimal Electric Demand Management for InternetData Centers. IEEE Trans. on Smart Grid, 2011.
[26] Z. Liu, M. Lin, A. Wierman, S. H. Low, and L. L. H.Andrew. Greening Geographical Load Balancing. InProceedings of SIGMETRICS, 2011.
[27] M. Marwah, P. Maciel, A. Shah, R. Sharma,T. Christian, V. Almeida, C. Araujo, E. Souza,G. Callou, B. Silva, S. Galdino, and J. Pires.Quantifying the Sustainability Impact of Data CenterAvailability. SIGMETRICS Performance EvaluationReview, 37(4), 2010.
[28] Maxwell Ultracapacitor Uninterruptible Power SupplySolutions, Oct. 2011. http://www.maxwell.com/products/ultracapacitors/industries/.
[29] S. McCluer and J. F. Christin. APC White Paper:Comparing Data Center Batteries, Flywheels, andUltracapacitors, Oct. 2011. http://www.apcmedia.com/salestools/DBOY-77FNCT_R2_EN.pdf.
[30] D. Meisner, C. M. Sadler, L. A. Barroso, W. Weber,and T. F. Wenisch. Power Management of OnlineData-intensive Services. In Proceedings of ISCA, 2011.
[31] Microsoft Reveals its Specialty Servers, Racks, Apr.2011.http://www.datacenterknowledge.com/archives/.
[32] M. K. Patterson, D. G. Costello, P. F. Grimm, andM. Loeffler. Data Center TCO; A Comparison ofHigh-density and Low-density Spaces. In Proceedingsof THERMES, 2007.
[33] S. Pelley, D. Meisner, P. Zandevakili, T. F. Wenisch,and J. Underwood. Power Routing: Dynamic PowerProvisioning in the Data Center. In Proceedings ofASPLOS, 2010.
[34] A. Qureshi, R. Weber, H. Balakrishnan, J. Guttag,and B. Maggs. Cutting the Electric Bill forInternet-Scale Systems. In Proceedings of SIGCOMM,2009.
[35] M. Ra, J. Paek, A. Sharma, R. Govindan, M. H.Krieger, and M. J. Neely. Energy-delay Tradeoffs inSmartphone Applications. In Proceedings of theInternational Conference on Mobile Systems,Applications, and Services, 2010.
[36] D. V. Ragone. Review of Battery Systems forElectrically Powered Vehicles. Society of AutomotiveEngineers, 1968.
[37] P. Ranganathan, P. Leech, D. Irwin, and J. Chase.Ensemble-level Power Management for Dense BladeServers. In Proceedings of ISCA, 2006.
[38] D. Rastler. Electricity Energy Storage TechnologyOptions. Technical Report 1020676, Electric PowerResearch Institue, 2010.
[39] S. M. Schoenung and W. V. Hassenzahl. Long- vs.Short-Term Energy Storage Technologies Analysis. ALife-Cycle Cost Study. A Study for the DOE EnergyStorage Systems Program. Technical ReportSAND2003-2783, Sandia National Laboratories, 2003.
[40] N. Sharma, S. Barker, D. Irwin, and P. Shenoy. Blink:Managing Server Clusters on Intermittent Power. InProceedings of ASPLOS, 2011.
[41] C. Stewart and K. Shen. Some Joules Are MorePrecious Than Others: Managing Renewable Energyin the Datacenter. In Workshop on HotPower, 2009.
[42] M. Ton, B. Fortenbery, and W. Tschudi. DC Powerfor Improved Data Center Efficiency, Mar. 2008.http://hightech.lbl.gov/dcpowering/about.html.
[43] R. Urgaonkar, B. Urgaonkar, M. J. Neely, andA. Sivasubramaniam. Optimal Power CostManagement Using Stored Energy in Data Centers. InProceedings of SIGMETRICS, 2011.
[44] A. Vasan, A. Sivasubramaniam, V. Shimpi,T. Sivabalan, and R. Subbiah. Worth Their Watts? -An Empirical Study of Datacenter Servers. InProceedings of HPCA, 2010.
[45] P. Ven, N. Hegde, L. Massoulie, and T. Salonidis.Optimal Control of Residential Energy Storage UnderPrice Fluctuations. In Proceedings of the InternationalConference on Smart Grids, Green Communicationsand IT Energy-aware Technologies, 2011.
[46] A. Verma, P. De, V. Mann, T. Nayak, A. Purohit,D. Gargi, and K. Ravi. BrownMap : Enforcing PowerBudget in Shared Data Centers. In Proceedings of theUSENIX International Middleware Conference, 2010.
[47] VYCON: Flywheel Based UPS System in DataCenters, Nov. 2011.http://www.vyconenergy.com/pq/ups.htm.
[48] D. Wang, C. Ren, A. Sivasubramaniam, B.Urgaonkar,and H. Fathy. Energy Storage in Datacenters: What,Where, and How much? Technical ReportCSE-11-016, The Pennsylvania State University,November 2011.