Embed Size (px)
Citation preview

Interim Review Period Progress
ENERGY STARCommercial Buildings Update
Katy Hatcher
ENERGY STAR Public Sector National Manager
US EPA

Interim Review Period Progress
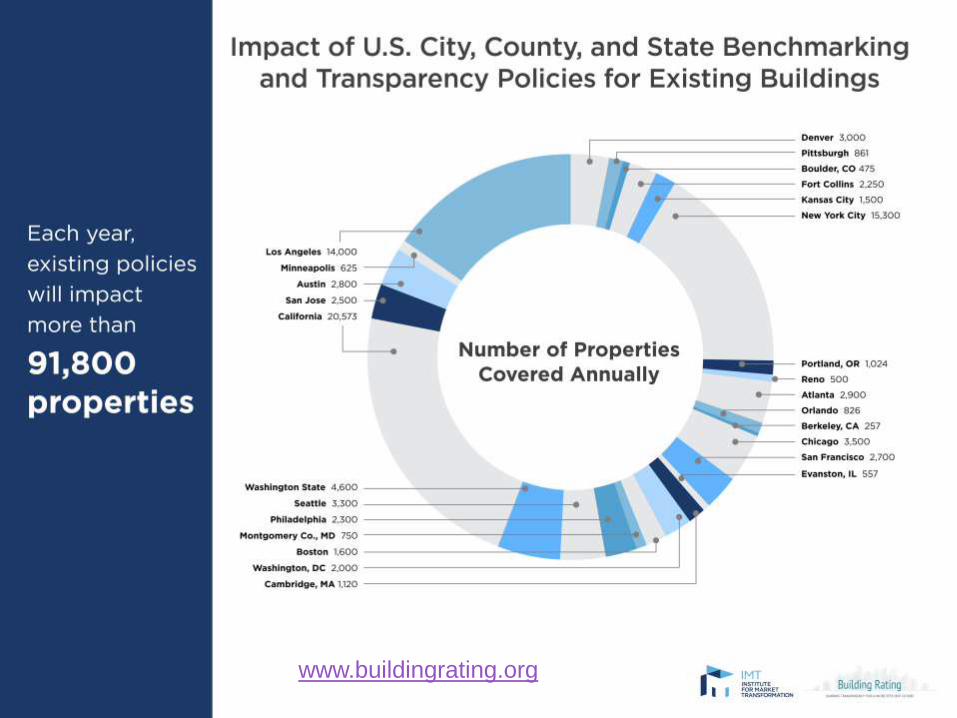
• 270,000 buildings just last year
• 32 state and local benchmarking policies
• One foreign government (Canada)

Interim Review Period Progress
0
50,000
100,000
150,000
200,000
250,000
300,000
0
5000
10000
15000
20000
25000
30000
'99 '00 '01 '02 '03 '04 '05 '06 '07 '08 '09 '10 '11 '12 '13 '14 '15 '16 '17 18
Build
ings B
enchm
ark
ed
Flo
or
Space
Year
Annual buildings benchmarked Annual Floor space (millions)
Annual Buildings Benchmarking Energy

Interim Review Period Progress
ENERGY STAR Certified Buildings
0
5,000
10,000
15,000
20,000
25,000
30,000
35,000
40,000
0
1,000
2,000
3,000
4,000
5,000
6,000
'99 '00 '01 '02 '03 '04 '05 '06 '07 '08 '09 '10 '11 '12 '13 '14 15 16 17 18
Cumulative Certifications Cumulative Floor Area (Millions)
Flo
or
Space (
Mill
ion S
quare
Feet)
Build
ings C
ert
ifie
d
Interim Review Period Progress
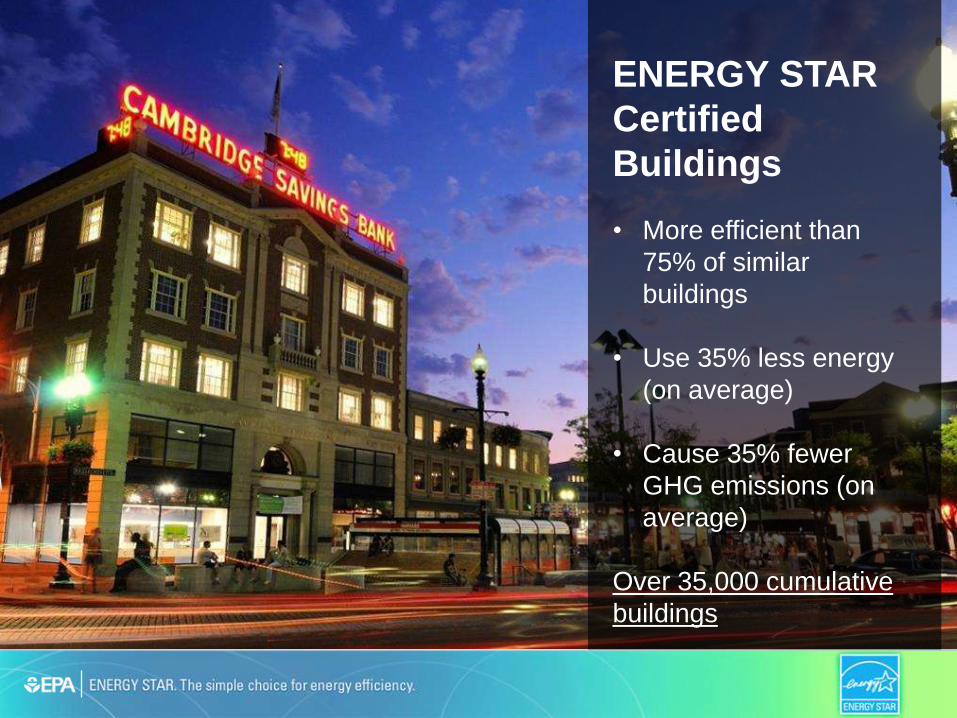
ENERGY STAR
Certified
Buildings
• More efficient than
75% of similar
buildings
• Use 35% less energy
(on average)
• Cause 35% fewer
GHG emissions (on
average)
Over 35,000 cumulative
buildings

Interim Review Period Progress
Management Tool
Track changes in energy, water, greenhouse gas emissions, and cost over time
Create custom reports
Apply for ENERGY STAR certification
Assess whole building energy and water consumption, plus waste
Track green power purchase
Share/report data with others
6

Interim Review Period Progress
Hundreds of metrics, including:
GHG
emissions
Indirect,
direct, total,
avoided
Energy use
Source, site,
weather
normalized,
demand
1-100
ENERGY
STAR score
Water use
Water use
intensity,
Water Score
(for Multifamily)
Waste &
Materials
Waste intensity,
diversion rate
7
Interim Review Period Progress
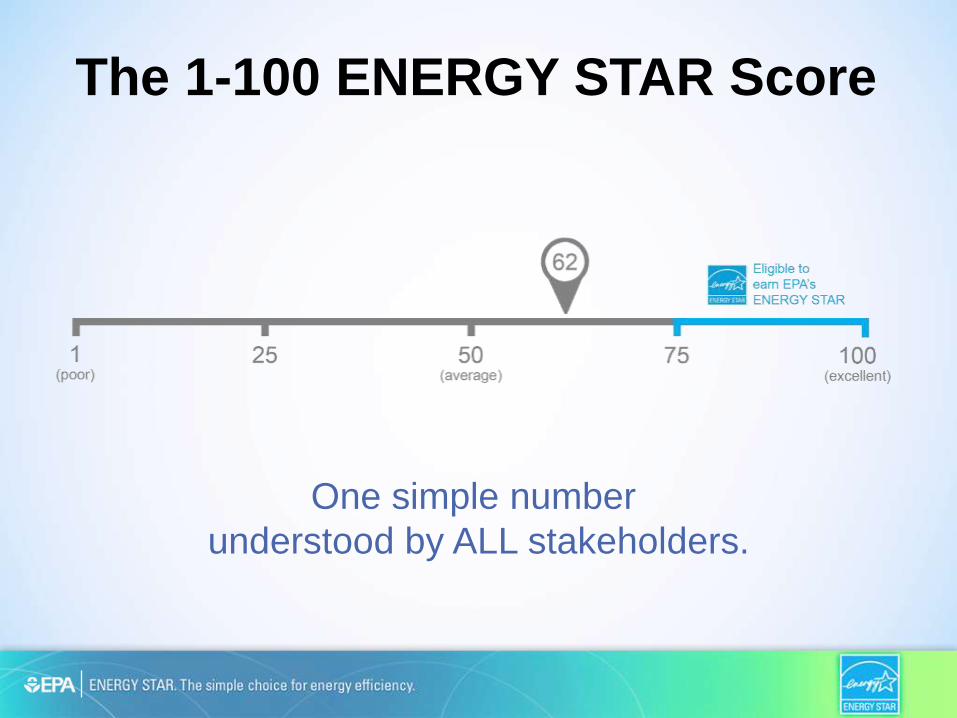
The 1-100 ENERGY STAR Score
One simple number
understood by ALL stakeholders.

Interim Review Period Progress
ENERGY STAR Score Objectives
• Evaluate whole building energy use • Accounts for combined effects of technology,
operation, maintenance, and usage patterns
• Provide a comparative, national benchmark• 1-100 Score provides percentile comparison to peer
buildings
• Identify best performers in the market• Top 25% of the market
• Tap into 90% awareness of ENERGY STAR brand
• Allow consumers and businesses to make smart choices
9
Interim Review Period Progress
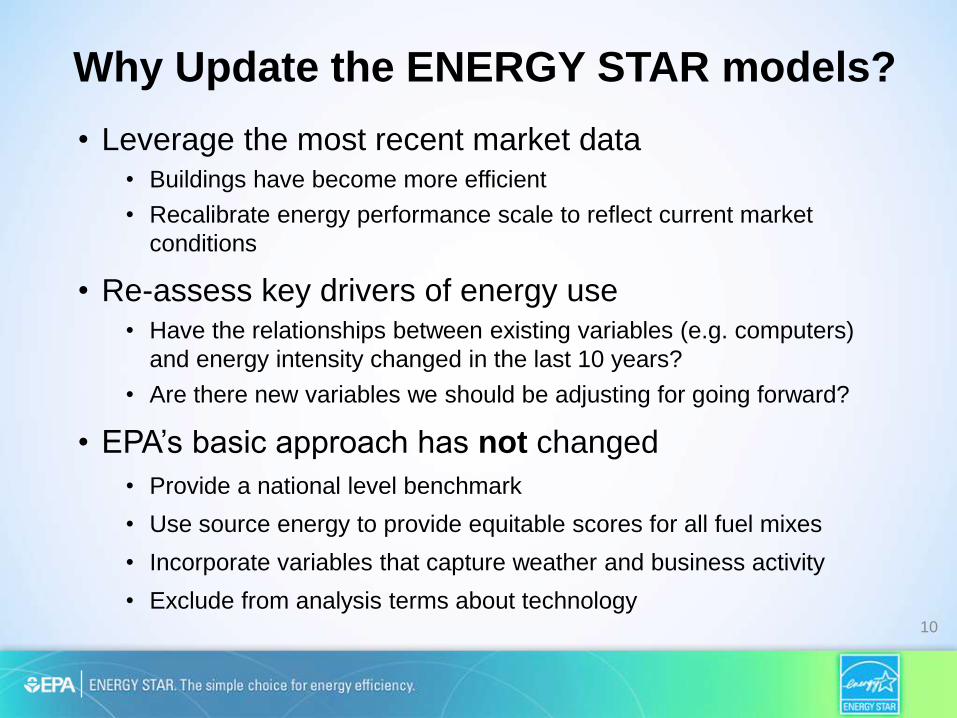
Why Update the ENERGY STAR models?
• Leverage the most recent market data• Buildings have become more efficient
• Recalibrate energy performance scale to reflect current market
conditions
• Re-assess key drivers of energy use• Have the relationships between existing variables (e.g. computers)
and energy intensity changed in the last 10 years?
• Are there new variables we should be adjusting for going forward?
• EPA’s basic approach has not changed
• Provide a national level benchmark
• Use source energy to provide equitable scores for all fuel mixes
• Incorporate variables that capture weather and business activity
• Exclude from analysis terms about technology10

Interim Review Period Progress
Score Review Period
• Released updated models for U.S. properties in August, 2018
• Updated models with 2012 CBECS data
• Received feedback once scores were live• Score trends• Variability• Changes that were hard to understand
• Instituted review period in September, 2018• Suspended certification• Gathered feedback• Conducted analysis
11
Interim Review Period Progress
Status of Office Score Review
• Common feedback was variability observed among buildings with different:
• Location/climate
• Fuel mix
• Size
• Conducted extensive analysis• Assessed scores in Portfolio Manager
• Worked with EIA to analyze CBECS data not publicly available
• Pleased to be communicating results
12

Interim Review Period Progress
Office Model: Location/Climate
• Heating Degree Days (HDD) • Not included in August 2018 model
• CBECS 2012 did not show a statistically significant positive relationship between HDD and EUI
• Gathered feedback and performed analysis• Buildings in very cold climates score lower on average
• Need to account for the different ranges of HDD and heating requirements that buildings experience on a year-to-year basis
• Determined that an HDD/heating adjustment is needed
• Thank you for helping us improve the model!
13

Interim Review Period Progress
Results: Range of score increase from HDD adjustment
14
CityAverage
HDD
Range
Lower End
(10th Percentile)
Middle
(Median)
Higher End
(90th Percentile)
Boston 5,429 4 6 9
Chicago 5,528 4 7 9
New York 4,300 3 5 7
Los Angeles 1,016 0 0 1

Interim Review Period Progress
Overview of Benchmarking Trends

Interim Review Period Progress
Interactive map of policies and programs
16www.energystar.gov/policiesandprograms Can be hosted on your site!

Interim Review Period Progress
17
Benchmarking laws that require use of ENERGY STAR Portfolio Manager
30+ laws nationwide
Buildings must:
1. Benchmark their energy use
2. Report it on an annual basis
3. Disclose to public or potential buyers/lessees
EPA only advises on the use of Portfolio Manager
Interim Review Period Progress

Interim Review Period Progress
20
Interim Review Period ProgressGovernment Commercial Multifamily Water
reporting
Utility data
availability
Atlanta, GA >25K >25K Yes web services
Austin, TX >10K - - spreadsheet
Berkeley, CA >25K >25K Yes web services
Boston, MA >35K>35K or 35+
unitsYes web services
Boulder, CO >20K - Yes web services
Cambridge, MA >25K 50+ units Yes spreadsheet
Chicago, IL >50K >50K - web services
Denver, CO >25K >25K - web services
Washington, DC* >50K >50K Yes web services
Evanston, IL >20K >20K Yes web services
Fort Collins, CO >20K >5K Yes web services

Interim Review Period Progress
21
Interim Review Period ProgressGovernment Commercial Multifamily Water
reporting
Utility data
availability
Kansas City, MO >50K >50K Yes spreadsheet
Los Angeles, CA >20K >20K Yes web services
Minneapolis, MN >50K >50K Yes web services
Montgomery
County, MD*>50K - - web services
New York, NY >25K >25K Yes web services
Orlando, FL >50K >50K - -
Philadelphia, PA >50K >50K Yes web services
Pittsburgh, PA >50K - Yes web services
Portland, ME** >20K 50+ units Yes -
Portland, OR >20K - - web services

Interim Review Period Progress
22
Interim Review Period ProgressGovernment Commercial Multifamily Water
reporting
Utility data
availability
Reno, NV >30K >30K Yes -
Salt Lake City, UT >25K - - web services
San Diego, CA >50K >50K, 17+ units - web services
San Francisco, CA >10K - - web services
San Jose, CA >20K >20K Yes web services
Seattle, WA >20K >20K - web services
South Portland, ME >5K 10+ units Yes -
St. Louis, MO >50K >50K Yes web services
State of California >50K >50K - web services
State of Washington* >10K - - web services
Province of Ontario,
Canada>50K >50K, 10+ units Yes -

Interim Review Period Progress
Recently added benchmarking requirements
• New or updated in 2019: • Minneapolis, MN: added multifamily reporting
requirement
• Salt Lake City, Utah
• San Diego, California
• San Jose, California
23
Interim Review Period Progress
Coming in 2020
• Fort Collins, Colorado• March 1 deadline; commercial and multifamily 5,000 ft2
+; water included
• Reno, Nevada• April 1 deadline; commercial and multifamily 30,000 ft2
+; water included; required action every 7 years if not meeting performance target
• Des Moines• May 1 deadline; commercial and multifamily 25,000 ft2+;
water included
24

Interim Review Period Progress
Other new requirements
• Chicago building label law• Starts in 2019 based on 2018 data year
• New York City building label law • Starts in 2020 based on 2019 data year
DC Building Energy Performance Standards• Minimum performance standards to be established by
1/1/2021 and each 5 years thereafter. Will be no lower than district median ENERGY STAR score for property type. 10,000 ft2+. EUI reduction and prescriptive compliance paths in 5 year window.
25
Interim Review Period Progress
Other new requirements, cont’d
• NYC GHG caps• GHG caps set for buildings based on property type and
square footage, using local factors for GHG emissions. 25,000 ft2+. Caps begin 2024, applying 2024-2029, with stricter caps 2030-2034.
• State of Washington building energy standard• Commercial buildings 50,000 ft2 +. Starts 2026. Must meet
standard based on “energy utility index”, adjusted by building category and geography. Standards will be updated each 5 years. Alt. compliance path will be available.
26

Interim Review Period Progress
ENERGY STAR Battle of the Buildings
Everything you need to
get started:
• Template rules, timeline,
communications
• Competition Guide
• Data Management Guide
and Template Data Tracker
• Activity kits
• …and more!
www.energystar.gov/BattleoftheBuildings
Interim Review Period Progress
28
Interim Review Period Progress

Interim Review Period Progress
29
Interim Review Period Progress

Interim Review Period Progress
30
Interim Review Period Progress
Interim Review Period Progress
31
Interim Review Period Progress

Interim Review Period Progress
32
Interim Review Period Progress

Interim Review Period Progress
33
Interim Review Period Progress

Interim Review Period Progress
34
Interim Review Period Progress
Interim Review Period Progress
35
Interim Review Period Progress