Embed Size (px)
Citation preview
© Hitachi, Ltd. 2021. All rights reserved.
Hitachi Investor Day 2021
Energy Sector
Executive Vice President and Executive OfficerHitachi, Ltd.
June 8, 2021
Toshikazu Nishino
Senior Vice President and Executive OfficerCEO of Power Grids Business UnitHitachi, Ltd.
Claudio Facchin
1© Hitachi, Ltd. 2021. All rights reserved.
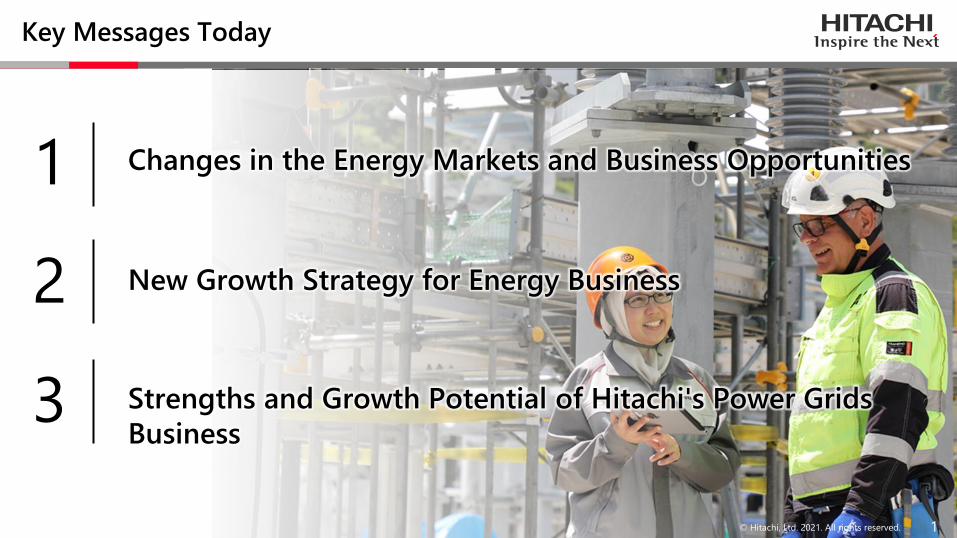
1 Changes in the Energy Markets and Business Opportunities
2
3
New Growth Strategy for Energy Business
Key Messages Today
Strengths and Growth Potential of Hitachi's Power Grids
Business
1© Hitachi, Ltd. 2021. All rights reserved.

© Hitachi, Ltd. 2021. All rights reserved.
Contents
2
Energy Sector
1. Energy Sector
1-1. Energy Sector Overview
1-2. Vision and Growth Strategy
1-3. Summary
2. Power Grids Business
2-1. Overview of Operations
2-2. Market Environment
2-3. Growth Opportunities
2-4. Execution Focus
2-5. Summary
3. Appendix
3-1. Performance Data
3-2. Glossary of Terms

3© Hitachi, Ltd. 2021. All rights reserved.
Services & Platforms BU
Product Business
Bu
ildin
gSyste
ms
BU
Railw
ay
Syste
ms
BU
Mo
bility
Hita
ch
i Glo
bal L
ife S
olu
tion
s
Hita
ch
iH
igh
-Tech
Sm
art
Life
Ind
ustry
& D
istribu
tion
BU
Wate
r & E
nviro
nm
en
t BU
Ind
ustry
Au
tom
otiv
e S
yste
ms B
usin
ess
Hita
ch
i Aste
mo
ITFin
an
cia
l Institu
tion
s BU
So
cia
l Infra
structu
re S
yste
ms B
U
IT
1-1. Energy Sector Overview
1. Position of Energy Sector
Po
wer G
rids B
U
Hita
ch
i Pla
nt C
on
structio
n
Hita
ch
i Po
wer S
olu
tion
s
Hita
ch
i AB
B P
ow
er G
rids
Hita
ch
i Po
wer S
em
ico
nd
ucto
r Devic
e
Nu
cle
ar E
nerg
y B
U
En
erg
y B
U
En
erg
y
Hita
ch
i-GE N
ucle
ar E
nerg
y
Po
wer G
en
era
tion
Syste
ms D
ivisio
nR
en
ew
ab
le E
nerg
y S
olu
tion
Div
ision
Tra
nsm
ission
& D
istribu
tion
Syste
ms D
ivisio
n
KumeCEO
UraseCEO
FacchinCEO
4© Hitachi, Ltd. 2021. All rights reserved.
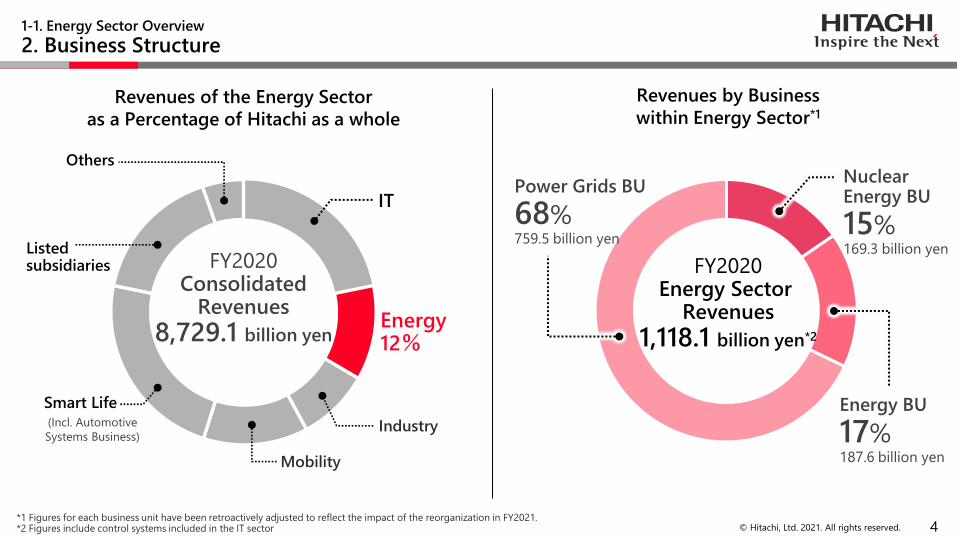
Revenues of the Energy Sector
as a Percentage of Hitachi as a whole
Revenues by Business
within Energy Sector*1
(Incl. Automotive
Systems Business)
IT
Energy12%
Industry
Mobility
Smart Life
Listedsubsidiaries
Others
FY2020Consolidated
Revenues
8,729.1 billion yen
FY2020Energy Sector
Revenues
1,118.1 billion yen*2
Energy BU
17%187.6 billion yen
Power Grids BU
68%759.5 billion yen
Nuclear Energy BU
15%169.3 billion yen
1-1. Energy Sector Overview
2. Business Structure
*1 Figures for each business unit have been retroactively adjusted to reflect the impact of the reorganization in FY2021.*2 Figures include control systems included in the IT sector

5© Hitachi, Ltd. 2021. All rights reserved.
Energy BusinessPower Grids Business
⚫Grid AutomationAutomation products, SCADA systems,
Services, Enterprise software
⚫High VoltageHigh volutage switchgear components
(GIS,AIS), GCB, maintenance services
⚫Grid IntegrationHVDC, FACTS & Power quality systems,
Power semiconductor
⚫TransformerPower converters, power distribution
converters, maintenance service
Chubu Electric Power Grid Co., Inc. Hida Converter Station starts operation
(Support for regional interconnection in Japan and stable electricity supply)
VSC-HVDC order received for Dogger Bank Offshore Wind Farm
(Promoting the introduction of renewable energy in UK)
Delivery
Delivery
Order
⚫ Energy Solution ServicesEFaaS, regional energy management,
maintenance services
⚫Green (Renewable Energy)Renewable energy solutions, power generation
systems
⚫ Power Semiconductor
Order received for Nomaoi-no-sato Wind Power Plant (Contributing to the expansion of renewable energy in Japan)
⚫New Plant
⚫Restart, Preventive Maintenance, DecommissioningRestart (Response to the New Regulatory
Requirements), preventive maintenance,
revitalization of Fukushima,
decommissioning and radioactive waste processing
⚫ Fuel Cycle
Completion of dry-up work at Fukushima Daiichi Units 1 to 4(Support for Fukushima Decommissioning and Revitalization)
Dry cask order received for Onagawa and Fukushima Daiichi Unit 5
(Radioactive waste processing)
1-1. Energy Sector Overview
3. Business Overview and Major Orders Received and Delivered in FY2020
Grid-eMotionTM Fleet Deployment(Support for clean urbanization)
Nuclear Energy Business
Start of demonstration of the world's first hybrid phase control system for the UK
(Utilization of renewable energy and supportfor grid stabilization)
Commercialization of SiC devices such as TED-MOS(Contribution to decarbonization through
higher efficiency and energy saving)
Source: Aibel
Development Development
Order Delivery
Order

© Hitachi, Ltd. 2021. All rights reserved.
Contents
6
Energy Sector
1. Energy Sector
1-1. Energy Sector Overview
1-2. Vision and Growth Strategy
1-3. Summary
3. Appendix
3-1. Performance Data
3-2. Glossary of Terms
2. Power Grids Business
2-1. Overview of Operations
2-2. Market Environment
2-3. Growth Opportunities
2-4. Execution Focus
2-5. Summary
7© Hitachi, Ltd. 2021. All rights reserved.
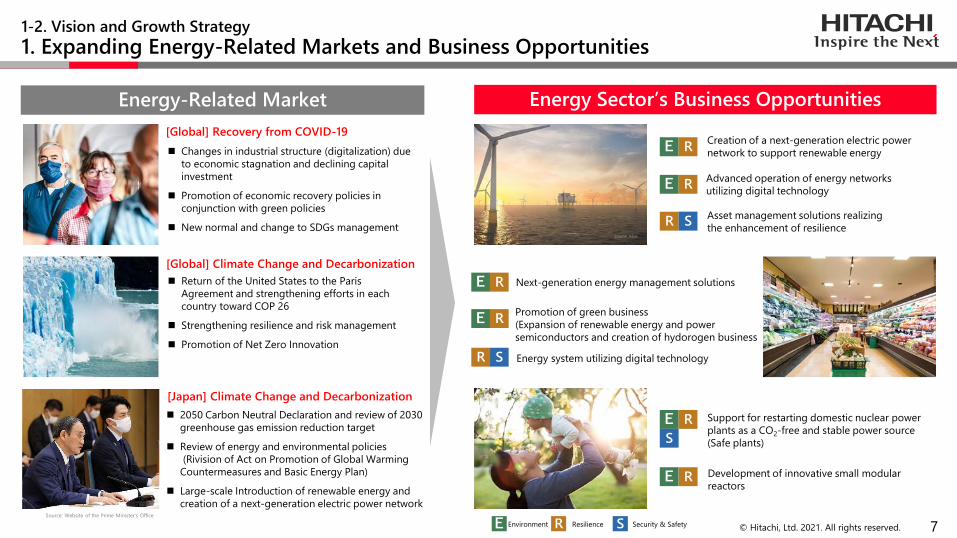
Energy-Related Market
1-2. Vision and Growth Strategy
1. Expanding Energy-Related Markets and Business Opportunities
Energy Sector’s Business Opportunities
E
E
R
R
S
E R S
E R
S
E R
Source: Aibel
R
E R
SR
E R
[Global] Climate Change and Decarbonization
[Global] Recovery from COVID-19
◼ Changes in industrial structure (digitalization) due
to economic stagnation and declining capital
investment
◼ Promotion of economic recovery policies in
conjunction with green policies
◼ New normal and change to SDGs management
◼ Return of the United States to the Paris
Agreement and strengthening efforts in each
country toward COP 26
◼ Strengthening resilience and risk management
◼ Promotion of Net Zero Innovation
[Japan] Climate Change and Decarbonization
◼ 2050 Carbon Neutral Declaration and review of 2030
greenhouse gas emission reduction target
◼ Review of energy and environmental policies
(Rivision of Act on Promotion of Global Warming
Countermeasures and Basic Energy Plan)
◼ Large-scale Introduction of renewable energy and
creation of a next-generation electric power networkSource: Website of the Prime Minister's Office
Environment Resilience Security & Safety
Next-generation energy management solutions
Energy system utilizing digital technology
Asset management solutions realizing
the enhancement of resilience
Advanced operation of energy networks
utilizing digital technology
Creation of a next-generation electric power
network to support renewable energy
Promotion of green business
(Expansion of renewable energy and power
semiconductors and creation of hydorogen business
Support for restarting domestic nuclear power
plants as a CO2-free and stable power source
(Safe plants)
Development of innovative small modular
reactors
Source: Aibel

8© Hitachi, Ltd. 2021. All rights reserved.
Enhancing Our value as a global leader in the field of energy in a sustainable society
Provide OT x IT x Products as a Package
Improve Quality of Life Add value for customers
Solving customer energy-related issues by providing three types of value
Social valueEnvironmental
valueEconomic
value
8© Hitachi, Ltd. 2021. All rights reserved. 8© Hitachi, Ltd. 2021. All rights reserved.
1-2. Vision and Growth Strategy
2. Goals of the Energy Business
Environment Resilience Security & Safety
Contribute to the realization of a decarbonized society
Supporting the stable supply of energy
Providing light to areas without electricity and areas with frequent power outages
9© Hitachi, Ltd. 2021. All rights reserved.* Based on 2020 orders (Investigated by Hitachi ABB Power Grids)
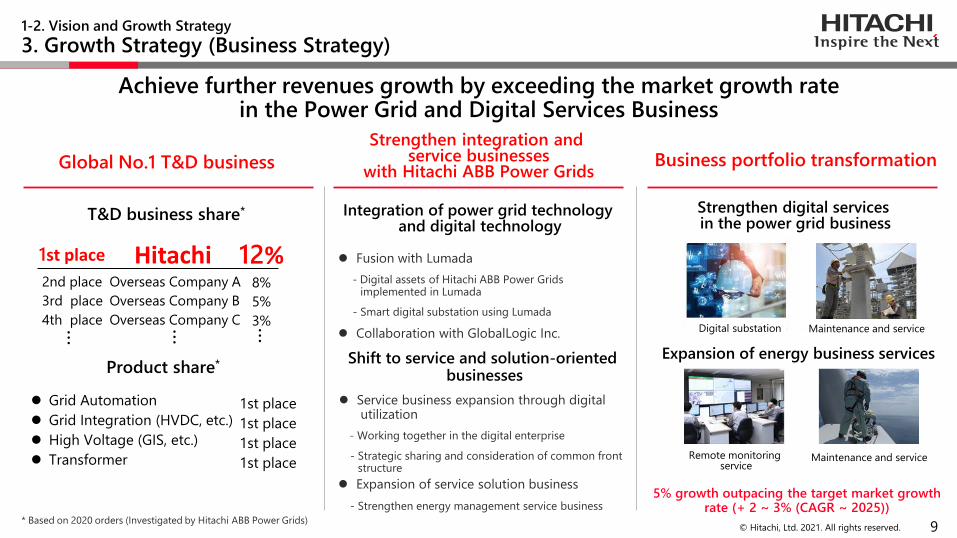
Global No.1 T&D business
Achieve further revenues growth by exceeding the market growth rate in the Power Grid and Digital Services Business
1-2. Vision and Growth Strategy
3. Growth Strategy (Business Strategy)
Integration of power grid technologyand digital technology
⚫ Fusion with Lumada
- Digital assets of Hitachi ABB Power Grids implemented in Lumada
- Smart digital substation using Lumada
⚫ Collaboration with GlobalLogic Inc.
Shift to service and solution-oriented businesses
T&D business share* Strengthen digital servicesin the power grid business
⚫ Service business expansion through digitalutilization
- Working together in the digital enterprise
- Strategic sharing and consideration of common front structure
⚫ Expansion of service solution business
- Strengthen energy management service business
Strengthen integration and service businesses
with Hitachi ABB Power GridsBusiness portfolio transformation
Product share*
⚫ Grid Automation
⚫ Grid Integration (HVDC, etc.)
⚫ High Voltage (GIS, etc.)
⚫ Transformer
1st place
1st place
1st place
1st place
2nd place
3rd place
4th place
Overseas Company A
Overseas Company B
Overseas Company C
8%
5%
3%
12%
・・・・・・
・・・
1st place Hitachi
Digital substation Maintenance and service
Expansion of energy business services
Maintenance and serviceRemote monitoringservice
5% growth outpacing the target market growth rate (+ 2 ~ 3% (CAGR ~ 2025))

10© Hitachi, Ltd. 2021. All rights reserved.
North America
Progress of Digitalization
◼ High value-added digital solutions◼ Energy blockchain◼ Resilience・Cybersecurity
◼ EV + EV Stations◼ Hybrid train
Europe Eco-friendly grid
◼ National grid development + Digitalization◼ Energy management for industrial conglomerates
India High economic growth
◼ Uptake of renewable energy◼ Smart urban infrastructure
MiddleEast
De-oiling & Gas
◼ From coal to renewable energy◼ Eco-friendly grid
(Expansion of EV andZero waste energy)
ChinaEnergy portfoliotransformation
◼ Grid stabilization and regional interconnection, utilization of digital solutions◼ Expansion of green business (Support decarbonization, energy management)◼ Expansion of renewable energy
JapanDecarbonization,
grid transformation andresilience enhancement
Accelerate growth in target markets and focused regions by creating digital synergy
Microgrid
~ 15%
(CAGR 2017 -2025)*Target Market Growth
Data center
6%or more
Railway
~ 5%
EV charging system
8% or more
HVDC
~ 6%
1-2. Vision and Growth StrategyOverview of Operations
4. Growth Strategy (Target Markets and Focused Regions)
* Investigated by Hitachi ABB Power Grids

11© Hitachi, Ltd. 2021. All rights reserved.
Common ERP Global Shared Services Group wide CRM
• Consolidated country service teams in 5
hubs
• Standardized HR, IT, SCM, Finance
processes
• Global engineering and service centers
(eg. India >2,000 employees)
• Harmonized business processes
• Simplified enterprise IT backbone with digital at the core
• Globally aligned with business needs
• >10K users connecting Sales to Sales Ops.
• Enable cross-selling, collaboration & strengthened customer relationships
• Improved sales planning & forecast accuracy
Leveraging Hitachi ABB Power Grids capabilities to enable agility, scale, reach and customer intimacy across Hitachi
Digital Core
Core IT Services
Digital HR
Digital Front End
Digital Business
Augmented Engineering
Data &Analytics
1-2. Vision and Growth Strategy
5. Operational synergies benefitting Hitachi and Hitachi ABB Power Grids

12© Hitachi, Ltd. 2021. All rights reserved.
Achievement of carbon neutrality in FY2030 through reform of the in-house energy portfolio
(1) Switching to non-fossil power sources(2) Electrification and hydrogenation of heat sources
⚫ Establishing a Next-Generation Microgrid in the Hitachi Works thatinterconnects power, heat, environmental value, and information
⚫ Total optimization through the transition from a one-way power supply model to two-way interchange of energy
⚫ Create an in-house model platform and expand its sales (Leading the world with advanced technology)
⚫ Demonstration of EFaaS business and consideration of showcasing(Develop highly effective solutions for decarbonization)
(t-CO 2)
2. Reforming the Energy Portfolio at Business Sites
1. CO2 emission reduction plan for in-house
production activities
3. Contributing to decarbonization through collaboration
with green businesses
Energy saving
Energy creation
Non-fossil power generation
Offset
(1) Advancement of energy saving activities through introduction of EMS
(2) Replacement of electrical and mechanical equipment with high-efficiency equipment
(3) Construction of a microgrid system (with perspective of using hydrogen fuel) withneighboring sites (Omika and Katsuta)
(1) Introduction of solar power generation facilities (Unused area in the sites)(2) Transportation from off-site renewable energy power generation facilities (PPA, VPP)
(1) Differences due to heat source fuel, peak power, etc. are offset by certificate credit
FY2020 FY2021 FY2024 FY2027 FY2030
Transition in CO2 emissions from the Energy Sector
1-2. Vision and Growth Strategy
6. Toward the Realization of Carbon Neutrality in FY2030
© Hitachi, Ltd. 2021. All rights reserved.
Contents
13
Energy Sector
1. Energy Sector
1-1. Energy Sector Overview
1-2. Vision and Growth Strategy
1-3. Summary
3. Appendix
3-1. Performance Data
3-2. Glossary of Terms
2. Power Grids Business
2-1. Overview of Operations
2-2. Market Environment
2-3. Growth Opportunities
2-4. Execution Focus
2-5. Summary

14© Hitachi, Ltd. 2021. All rights reserved.
1-3. Summary
1. Financial Performance & Progress of 2021 Mid-term Management Plan
Adjusted operating income ratio
EBIT ratio
EBITDA ratio
Revenues
Overseas revenue ratio
ROIC(Return on Invested Capital)
FY2019(Results)
FY2020(Results)
FY2021(Forecast)
408.6 billion yen
1,330.0 billion yen
Figures include control systems included in the IT sector. Figures of FY2020 have been retroactively adjusted to reflect the impact of the reorganization in FY2021.The upper rows of EBIT ratio, EBITDA ratio, and ROIC exclude related expenses (Restructuring, PPA amortization, etc.); the lower rows include them.
2.6%
12% 69% 76%
(91.5)% 2.9%(4.8)%
9.4%3.1%
(90.3)% 6.0%3.0%
12.7%9.6%
6.4% 1.7%(2.7)%
6.0%2.2%
(4.1)%Includerelated cost
FY2025(Target)
Excluderelated cost
FY2022(Target)
4.0%
9.0%
1,330.0 billion yen
Over 1,700.0 billion yen
2.8%
1,118.1 billion yen
8.3%
3.8%
10.0%
12.0%

15© Hitachi, Ltd. 2021. All rights reserved.
1-3. Summary
2. FY 2021 Forcast and FY 2022 Targets
Figures include control systems included in the IT sector.
FY2021 (Forecast)
Revenues
1.33 trillion yen
Adjusted Operating Income Ratio
2.8%
FY2022 (Target)
Revenues
1.33 trillion yen
Adjusted Operating Income Ratio
4.0%
⚫ Increase in revenues due to the establishment of Hitachi ABB Power Grids
⚫Hitachi ABB Power Grids revenues increase, Increase in profit due to completion of measures for some Energy BU projects
⚫Although Power Grids BU expands, revenues are flat due to portfolio restructuring of Energy BU business
⚫ Increase in revenues in the power grid business due to a decrease in the impact of COVID-19, Increase in profit due to expansion of service business and improvement of operations

16© Hitachi, Ltd. 2021. All rights reserved.
1-3. Summary
3. Toward further growth
Achieving a Decarbonized Society, Supporting Stable Energy Supply, and Contributing to Improving Quality of Life
Powering Good for Sustainable Energy
16© Hitachi, Ltd. 2021. All rights reserved. 16

© Hitachi, Ltd. 2021. All rights reserved.
Contents
17
Energy Sector
1. Energy Sector
1-1. Energy Sector Overview
1-2. Vision and Growth Strategy
1-3. Summary
3. Appendix
3-1. Performance Data
3-2. Glossary of Terms
2. Power Grids Business
2-1. Overview of Operations
2-2. Market Environment
2-3. Growth Opportunities
2-4. Execution Focus
2-5. Summary

© Hitachi, Ltd. 2021. All rights reserved.
Products and componentsBroadest portfolio and footprint
Software and automationDeepest application know-how
SystemsTechnology and innovation leader
ServiceLargest installed base
Global Technology and Market Leader with a combined pioneering
innovation heritage of 2.5 centuries
Bringing together the world’s leading energy and digital platforms
PLAN BUILD OPERATE MAINTAIN
Powering good for a sustainable energy future, with pioneering and digital technologies,
as the partner of choice for enabling a stronger, smarter and greener grid.
OT IT
18
2-1.Overview of Operations
1. Hitachi ABB Power Grids:Powering Good for Sustainable Energy
Energy Industry Mobility Smart LifeIT Hitachi Astemo
Utilities Industry Transport & Infrastructure

© Hitachi, Ltd. 2021. All rights reserved. 19
Driving world-class executionIndustry leading performance,
cost efficiency & quality
Becoming a growth engine World-class front-end performance
Sharpening our winning
portfolio & business modelsService penetration & digitalization
2019 2025
CAGR
~3%*
~100 BUSD
Well positioned … Transformation underway…in attractive markets … …. to deliver profitable
and sustainable growth
CAGR 2017-2025*
EV Charging
>8%
Rail
~5%
~15%
Data Centers
>6%
Software &
Automation
~5%
HVDC
~6%
Power Quality
~5%
Microgrids
Innovation
People
2 Foundations
3 pillars
Strengthen #1 position & grow
faster than the market
UtilitiesIndustry
Transport &
Infrastructure Customers
Products
Systems
Software &
Automation
ServicesOffering
EuropeAMEA
Americas
Geographies
US$10 Bn Business Volume
~36,000 employees
~90 countries, 115 factories: 200 offices
World’s largest installed base
Service (Consultancy, Service, Software)
Digital (Digitalized products & systems)
Products
(Conventional products & systems)
2-1.Overview of Operations
2. Hitachi ABB Power Grids:Overview
* Investigated by Hitachi ABB Power Grids
© Hitachi, Ltd. 2021. All rights reserved.
Contents
20
Energy Sector
1. Energy Sector
1-1. Energy Sector Overview
1-2. Vision and Growth Strategy
1-3. Summary
3. Appendix
3-1. Performance Data
3-2. Glossary of Terms
2. Power Grids Business
2-1. Overview of Operations
2-2. Market Environment
2-3. Growth Opportunities
2-4. Execution Focus
2-5. Summary

© Hitachi, Ltd. 2021. All rights reserved. 21
Avoiding new emissions
is not enough. If
nothing is done about
emissions from existing
infrastructure, climate
goals are surely out of
reach. If today’s energy
infrastructure continues
to operate as it has in
the past, it would lock in
by itself a temperature
rise of 1.65 °C.
IEA World Energy Outlook 2020
Global investments
$2.2 trillion expected investment in the power sector until 2030*1
1/3 of this to expand, modernize and digitalize electricity networks*1
Global grid investments in 2030 increasing from $255 billion to$800bn*1
Number of grid-connected devices reach 30-40bn by 2025*2 (2X)
Increasing number of geographies committed to net zero by 2050
“$100bn
power infrastructure
investment proposed*3
€58bn a year investment in
power grids (2021-30)*4
40GW offshore wind
ambition by 2030
Emission peak by 2030
- carbon neutrality by 2060
450 GW of renewables
by 2030
Up to 45GW offshore wind
ambition by 2040
*1 Source: IEA World Energy Outlook 2020 *2 Source: IEA Power Systems in Transition *3 Source: THE WHITE HOUSE FACT SHEET announced March 31,2021
*4 Investment needed to achieve 2030 climate ambitions (compared to 24bn 2011-20). After 2030 annual investments need go up to >€80bn: by a factor of 4.
Source: Country announcements
2-2.Market Environment
1. Growth opportunities as climate commitments gather pace
© Hitachi, Ltd. 2021. All rights reserved.
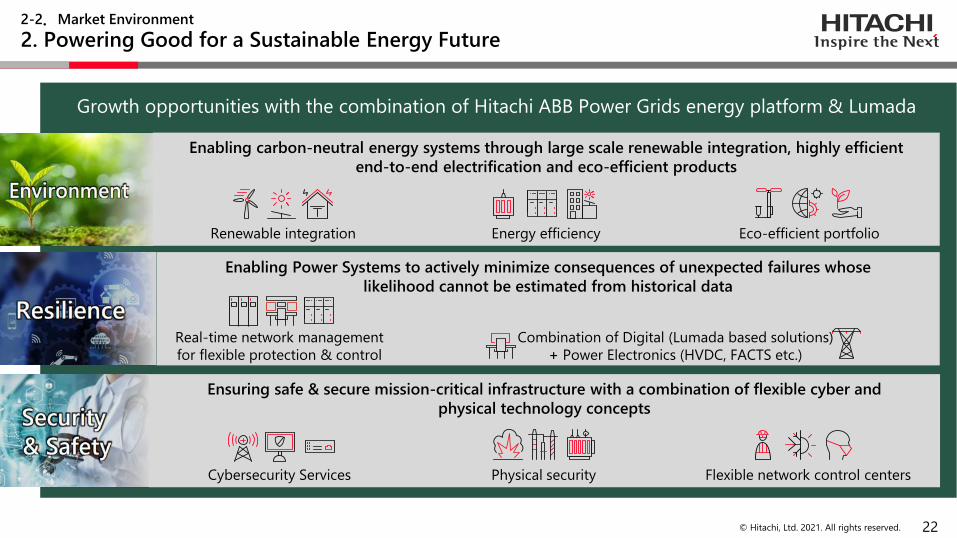
Growth opportunities with the combination of Hitachi ABB Power Grids energy platform & Lumada
22
Cybersecurity Services AI & Digitalization Remote monitoring
Renewable integration Grid Edge Solutions
Eco-efficient portfolio &
energy efficiency
Active network management for
flexible protection & control
Combination of digital (Lumada based solutions)
+ power electronics (HVDC, FACTS etc)
Enabling carbon-neutral energy systems through large scale renewable integration, highly efficient
end-to-end electrification and eco-efficient products
Ensuring safe & secure mission-critical infrastructure with a combination of flexible cyber and
physical technology concepts
Enabling Power Systems to actively minimize consequences of unexpected failures whose
likelihood cannot be estimated from historical data
Renewable integration Energy efficiency Eco-efficient portfolio
Real-time network management
for flexible protection & control
Combination of Digital (Lumada based solutions)
+ Power Electronics (HVDC, FACTS etc.)
Cybersecurity Services Physical security Flexible network control centers
2-2.Market Environment
2. Powering Good for a Sustainable Energy Future

© Hitachi, Ltd. 2021. All rights reserved.
Contents
23
Energy Sector
1. Energy Sector
1-1. Energy Sector Overview
1-2. Vision and Growth Strategy
1-3. Summary
3. Appendix
3-1. Performance Data
3-2. Glossary of Terms
2. Power Grids Business
2-1. Overview of Operations
2-2. Market Environment
2-3. Growth Opportunities
2-4. Execution Focus
2-5. Summary

© Hitachi, Ltd. 2021. All rights reserved. 24
Environmental benefits
from HVDC Light® connectors
Constantly innovating to reduce power
losses, the carbon footprint has been
reduced by two thirds in the latest
generation HVDC Light® saving millions
of tons of CO2 emissions over lifetime
Offshore wind HVDC connection
Dogger Bank (UK)
‒ 3 x 1200 MW, 320 kV DC connection
‒ 190 km from shore
- Capable of meeting ~5% of the
UK electricity demand with clean
fossil-free electricity*1
- Can reduce 200t of CO2
emission per GWh*2
- Most compact and low losses
- Innovative partnership
business model focusing on
core competencies and
creating competitive
advantage for customer
Technology and
collaborative business
models supporting SDG 7
Source: Aibel
*1 Source: SSE, Equinor, Dogger Bank websites *2 Source: Hitachi ABB Power Grids Lifecycle assessment
2-3.Growth Opportunities
1. Shaping a Sustainable Energy Future: HVDC for Offshore Wind
© Hitachi, Ltd. 2021. All rights reserved. 25
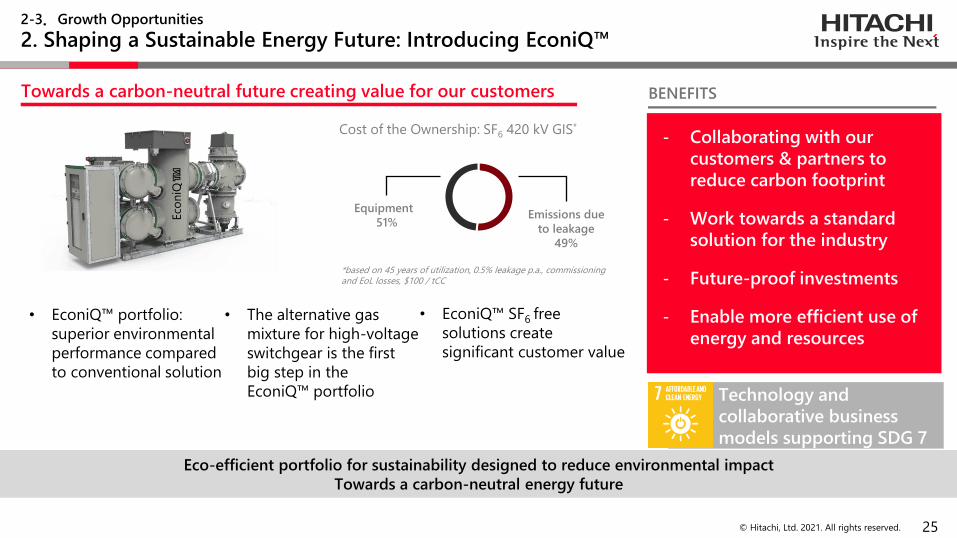
Towards a carbon-neutral future creating value for our customers
• EconiQ™ SF6 free
solutions create
significant customer value
• EconiQ™ portfolio:
superior environmental
performance compared
to conventional solution
Eco-efficient portfolio for sustainability designed to reduce environmental impact
Towards a carbon-neutral energy future
Cost of the Ownership: SF6 420 kV GIS*
*based on 45 years of utilization, 0.5% leakage p.a., commissioning and EoL losses, $100 / tCC
Emissions due
to leakage
49%
Equipment
51%
BENEFITS
- Collaborating with our
customers & partners to
reduce carbon footprint
- Work towards a standard
solution for the industry
- Future-proof investments
- Enable more efficient use of
energy and resources
Eco
niQ™
• The alternative gas
mixture for high-voltage
switchgear is the first
big step in the
EconiQ™ portfolio Technology and
collaborative business
models supporting SDG 7
2-3.Growth Opportunities
2. Shaping a Sustainable Energy Future: Introducing EconiQ™
© Hitachi, Ltd. 2021. All rights reserved. 26
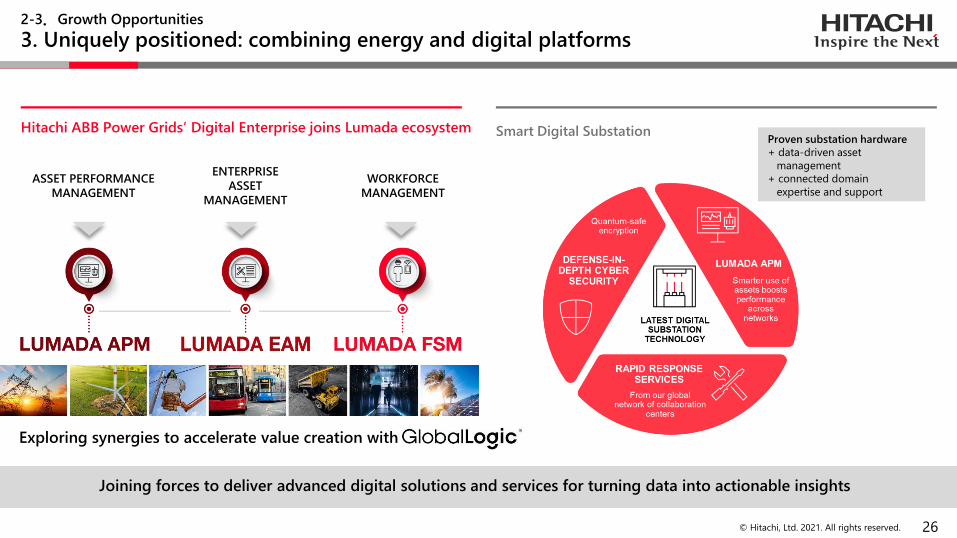
Hitachi ABB Power Grids’ Digital Enterprise joins Lumada ecosystem Smart Digital Substation
ASSET PERFORMANCE
MANAGEMENT
ENTERPRISE
ASSET
MANAGEMENT
WORKFORCE
MANAGEMENT
Proven substation hardware
+ data-driven asset
management
+ connected domain
expertise and support
Joining forces to deliver advanced digital solutions and services for turning data into actionable insights
Exploring synergies to accelerate value creation with
2-3.Growth Opportunities
3. Uniquely positioned: combining energy and digital platforms

© Hitachi, Ltd. 2021. All rights reserved.
*The ability to limit the extent, severity & duration of system degradation following an unexpected, rare & extreme event whose likelihood cannot be estimated from historical data
27
Examples of some recent large-scale power outages Power system resilience* : a key focus area for Hitachi ABB
Power Grids
System Advisory services e.g. grid reinforcement planning
with enhanced resilience focus
Technologies for enabling a stronger, smarter, greener,
interconnected transmission grid and flexible integrated distributed
energy systems e.g. microgrids and storage
Grid Automation and controls to manage increasing
complexities while optimizing power flows with Secure and intelligent
digital grid management
Predictive maintenance & security services (physical &
cyber) to increase stress capability of critical elements in the system
Aug 9, 2019 United Kingdom
Loss of demand ~3%
Full restoration in 45 min
Aug 4, 2019 Java-Bali, Indonesia
Loss of demand 100% (blackout)
Full restoration in ~12 hours
Jan 10, 2021 Pakistan
Loss of demand 100% (blackout)
Full restoration in ~20 hours
Feb 15, 2021 Texas, USA
Loss of demand ~30%
Full restoration took several days
2-3.Growth Opportunities
4. Grid resilience is increasingly in focus

© Hitachi, Ltd. 2021. All rights reserved.*1 Source: BNEF (2019) Electricity consumption *2 Source: IRENA *3 Base 2013 28
Japan – Grid opportunities Hitachi ABB Power Grids solutions
largest electricity market globally*1
- opportunities from continued deregulation
record installations of onshore
wind and solar*2
commitment to net-zero
reduction in CO2 emissions by 2030*3
HVDC (Renewable integration,
interconnections)
Back-to Back connections based on HVDC /
FACTS synchronizing 50/60Hz systems
Grid Automation (control & flexibility) - incl.
Digital substations & Lumada based solutions
Grid-edge solutions & microgrids
(Distributed power)
4th
2020
2050
46%
Up to 45GW offshore wind ambition by 2040
2-3. Growth Opportunities
5. Japan opportunity: access to the world’s 3rd largest economy

© Hitachi, Ltd. 2021. All rights reserved.
Contents
29
Energy Sector
1. Energy Sector
1-1. Energy Sector Overview
1-2. Vision and Growth Strategy
1-3. Summary
3. Appendix
3-1. Performance Data
3-2. Glossary of Terms
2. Power Grids Business
2-1. Overview of Operations
2-2. Market Environment
2-3. Growth Opportunities
2-4. Execution Focus
2-5. Summary
© Hitachi, Ltd. 2021. All rights reserved. 30
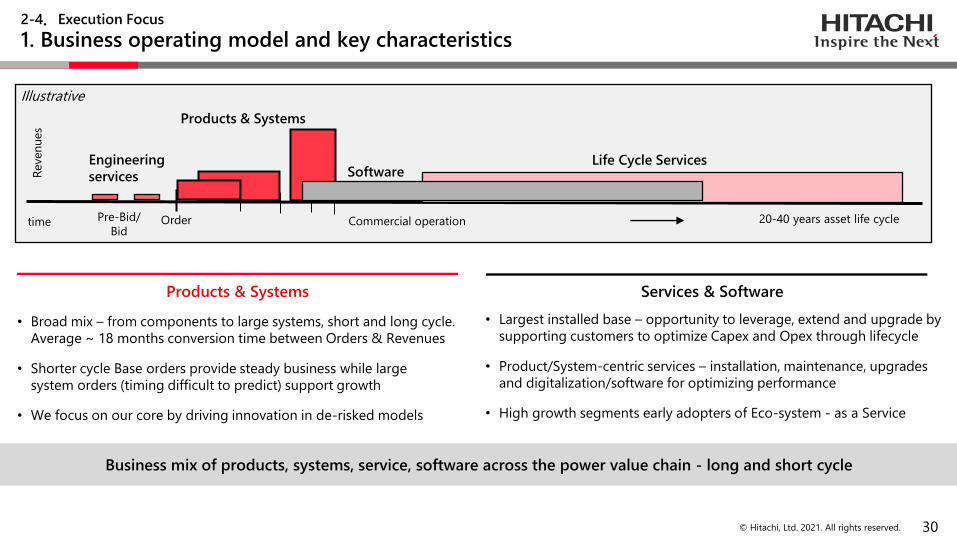
Products & Systems Services & Software
• Largest installed base – opportunity to leverage, extend and upgrade by
supporting customers to optimize Capex and Opex through lifecycle
• Product/System-centric services – installation, maintenance, upgrades
and digitalization/software for optimizing performance
• High growth segments early adopters of Eco-system - as a Service
• Broad mix – from components to large systems, short and long cycle.
Average ~ 18 months conversion time between Orders & Revenues
• Shorter cycle Base orders provide steady business while large
system orders (timing difficult to predict) support growth
• We focus on our core by driving innovation in de-risked models
Business mix of products, systems, service, software across the power value chain - long and short cycle
Illustrative
Products & Systems
Life Cycle Services
Commercial operationOrder
Reven
ues
Software
time 20-40 years asset life cyclePre-Bid/
Bid
Engineering
services
2-4.Execution Focus
1. Business operating model and key characteristics
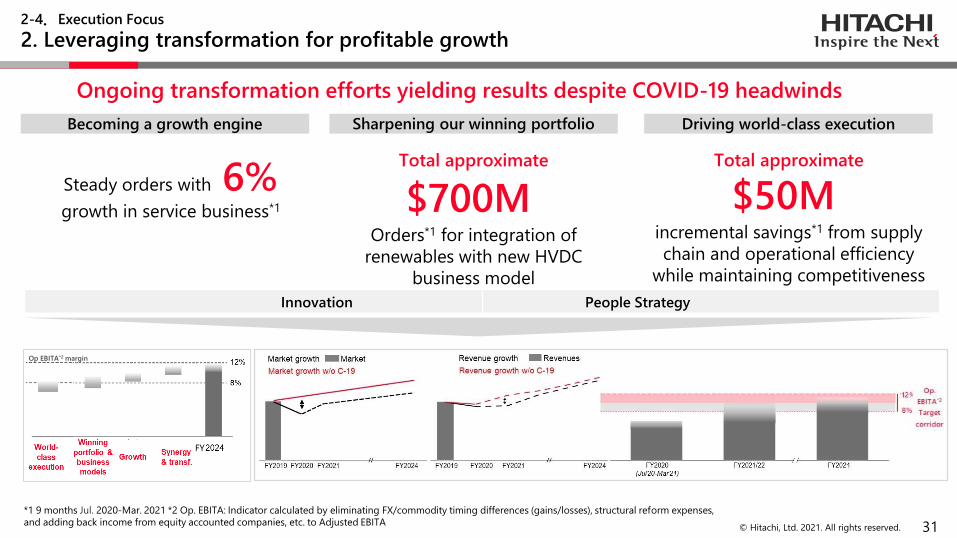
© Hitachi, Ltd. 2021. All rights reserved. 31
Becoming a growth engine Sharpening our winning portfolio Driving world-class execution
Total approximate
$700MOrders*1 for integration of
renewables with new HVDC
business model
Innovation People Strategy
Steady orders with 6% growth in service business*1
Total approximate
$50Mincremental savings*1 from supply
chain and operational efficiency
while maintaining competitiveness
*1 9 months Jul. 2020-Mar. 2021 *2 Op. EBITA: Indicator calculated by eliminating FX/commodity timing differences (gains/losses), structural reform expenses,
and adding back income from equity accounted companies, etc. to Adjusted EBITA
Ongoing transformation efforts yielding results despite COVID-19 headwinds
Op EBITA*2 margin
FY
2-4.Execution Focus
2. Leveraging transformation for profitable growth
© Hitachi, Ltd. 2021. All rights reserved.
Contents
32
Energy Sector
1. Energy Sector
1-1. Energy Sector Overview
1-2. Vision and Growth Strategy
1-3. Summary
3. Appendix
3-1. Performance Data
3-2. Glossary of Terms
2. Power Grids Business
2-1. Overview of Operations
2-2. Market Environment
2-3. Growth Opportunities
2-4. Execution Focus
2-5. Summary

© Hitachi, Ltd. 2021. All rights reserved. 33
2018 2019 2020 2021...
Profitable & Sustainable Growth
COVID-19 disruption
…2024
Environmental value Economic valueSocial value
Start of the new journey & building up
collaboration and identifying synergiesLeveraging synergies
(digital, technology, broader portfolio)
HITACHI ABB POWER GRIDS
Transition
•We are well positioned in attractive markets. A Solid foundation to secure the leading position in a transforming energy market
•We continue to drive profitable & sustainable growth, portfolio competitiveness & world class execution via our Transformation program
•COVID-19 has a short-term impact, but recovery plans and accelerated energy transition offer mid/long-term growth opportunities
• Jointly with Hitachi we will contribute through growth synergy program to deliver additional value to all key stakeholders
•We target above market order growth ~4 to 5% (CAGR) & aim to reach the upper end of our 8-12% operational EBITA target margin corridor by FY2024-
2025
Transformation
2-5.Summary
1. Our journey…

© Hitachi, Ltd. 2021. All rights reserved.
Contents
34
Energy Sector
1. Energy Sector
1-1. Energy Sector Overview
1-2. Vision and Growth Strategy
1-3. Summary
3. Appendix
3-1. Performance Data
3-2. Glossary of Terms
2. Power Grids Business
2-1. Overview of Operations
2-2. Market Environment
2-3. Growth Opportunities
2-4. Execution Focus
2-5. Summary

35© Hitachi, Ltd. 2021. All rights reserved.
(60.0)%
(90.3)%
3.0%9.6%
△2,586
△3,740
△533410
(61.1)%
(91.5)%
(4.8)%3.1%
4,235 4,086
2018年度 2019年度 2020年度 2021年度見通し
Revenues
EBIT
3-1. Performance Data
1. Business Forecast and Target
FY2018 FY2020FY2019 2021年度見通し
EBIT ratio
318 153
△454
370
Adjusted operating income
FY2018 FY2020FY2019 2021年度見通し
Adjusted operating income ratio
7.5%
3.8%
△4.1%
2.8%
EBITDA ratio
FY2018 FY2020FY2019 2021年度見通し
Unit : Billions of yen
1,118.1
Power Grids BU
Nuclear Energy BU +Energy BU 7,595
3,587
1,330.0
FY2018
FY2018
FY2018
FY2018
FY2019
FY2019 FY2019
FY2020
FY2020 FY2020
FY2021 Forecast
FY2021 Forecast
FY2021 Forecast
FY2021 Forecast
FY2020FY2019
423.5 408.6
759.5 997.1
358.7 337.3
31.815.3
(45.4)
37.0
41.0(53.3)
(258.6)
(374.0)
Figures include control systems included in the IT sector and related costs. The figures for FY2020 are retroactively adjusted to reflect the impact of the reorganization in FY2021.
(4.1)%

36© Hitachi, Ltd. 2021. All rights reserved.
7.4%6.4%
(2.7)%
2.2%
2
△1,515
622180
0.0%
(37.1)%
5.6% 1.4%
7.5%
3.8%
0.6%
6.1%
ROIC
Cash flows from operating activities Lumada business revenues*
3-1. Performance Data
2. Business Forecast and Target
FY2018 FY2020FY2019 2021年度見通し
110 410 400
1,090
+373% (2)%
+173%
FY2018 FY2020FY2019 2021年度見通し
Cash flows from operating activitiesratio
●:YoY
Figures include control systems included in the IT sector and related costs. The figures for FY2020 are retroactively adjusted to reflect the impact of the reorganization in FY2021. * Figures from FY2019 onwards are based on the new definition announced in the FY2020 financial results.
Adjusted EBITA ratio
FY2018 FY2020FY2019 2021年度見通し
FY2018 FY2020FY2019 2021年度見通し
FY2021 ForecastFY2021
Forecast
FY2021 Forecast
FY2021 Forecast
Unit : Billions of yen
0.2
62.218.0
11.0 41.0 40.0
109.0(151.5)
37© Hitachi, Ltd. 2021. All rights reserved.
Unit : Billions of yen FY2019 FY2020 FY2021
YoY YoY Forecast
(As of April 2021)
YoY Target
(As of June 2019)
Changes from the
previous target
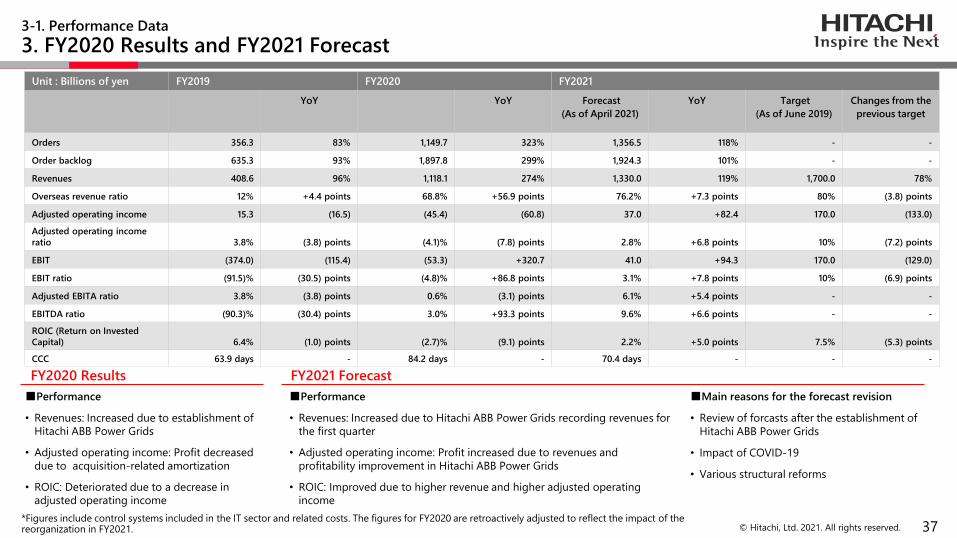
Orders 356.3 83% 1,149.7 323% 1,356.5 118% - -
Order backlog 635.3 93% 1,897.8 299% 1,924.3 101% - -
Revenues 408.6 96% 1,118.1 274% 1,330.0 119% 1,700.0 78%
Overseas revenue ratio 12% +4.4 points 68.8% +56.9 points 76.2% +7.3 points 80% (3.8) points
Adjusted operating income 15.3 (16.5) (45.4) (60.8) 37.0 +82.4 170.0 (133.0)
Adjusted operating income
ratio 3.8% (3.8) points (4.1)% (7.8) points 2.8% +6.8 points 10% (7.2) points
EBIT (374.0) (115.4) (53.3) +320.7 41.0 +94.3 170.0 (129.0)
EBIT ratio (91.5)% (30.5) points (4.8)% +86.8 points 3.1% +7.8 points 10% (6.9) points
Adjusted EBITA ratio 3.8% (3.8) points 0.6% (3.1) points 6.1% +5.4 points - -
EBITDA ratio (90.3)% (30.4) points 3.0% +93.3 points 9.6% +6.6 points - -
ROIC (Return on Invested
Capital) 6.4% (1.0) points (2.7)% (9.1) points 2.2% +5.0 points 7.5% (5.3) points
CCC 63.9 days - 84.2 days - 70.4 days - - -
FY2020 Results FY2021 Forecast
3-1. Performance Data
3. FY2020 Results and FY2021 Forecast
■Performance
• Revenues: Increased due to establishment of
Hitachi ABB Power Grids
• Adjusted operating income: Profit decreased
due to acquisition-related amortization
• ROIC: Deteriorated due to a decrease in
adjusted operating income
■Performance
• Revenues: Increased due to Hitachi ABB Power Grids recording revenues for
the first quarter
• Adjusted operating income: Profit increased due to revenues and
profitability improvement in Hitachi ABB Power Grids
• ROIC: Improved due to higher revenue and higher adjusted operating
income
■Main reasons for the forecast revision
• Review of forcasts after the establishment of
Hitachi ABB Power Grids
• Impact of COVID-19
• Various structural reforms
*Figures include control systems included in the IT sector and related costs. The figures for FY2020 are retroactively adjusted to reflect the impact of the reorganization in FY2021.

38© Hitachi, Ltd. 2021. All rights reserved.
Unit : Billions of yen FY2019 FY2020 FY2021 Forecast
Orders Sector Total 356.3 1,149.7 1,356.5
Nuclear Energy BU +Energy BU 356.3 337.7 343.9
Power Grids BU - 811.9 1,012.7
Hitachi ABB Power Grids - 783.6 986.5
Order backlog Sector Total 635.3 1,897.8 1,924.3
Nuclear Energy BU + Energy BU 635.3 519.5 530.5
Power Grids BU - 1,378.3 1,393.9
Hitachi ABB Power Grids - 1,299.7 1,320.2
Revenues Sector Total 408.6 1,118.1 1,330.0
Nuclear Energy BU 155.7 169.3 156.6
Energy BU 254.7 187.6 188.4
Power Grids BU - 759.5 997.1
Hitachi ABB Power Grids - 722.4 966.0
Overseas revenue ratio Sector Total 12% 68.8% 76.2%
Nuclear Energy BU + Energy BU 12% 10.3% 12.3%
Power Grids BU - 96.5% 97.4%
Hitachi ABB Power Grids - 99.3% 99.5%
Adjusted operating income [ratio] Sector Total 15.3[3.8%] (45.4)[(4.1)%] 37.0[2.8%]
Nuclear Energy BU + Energy BU 15.3[3.8%] (4.1)[(1.2)%] 33.6[10.0%]
Power Grids BU - (41.3)[(5.4)%] 4.0[0.4%]
Hitachi ABB Power Grids - 32.2[4.5%] 75.0[7.8%]
* Figures include control systems included in the IT sector and related costs.
The figures for FY2020 are retroactively adjusted to reflect the impact of the reorganization in FY2021.
* Figures of Hitachi ABB Power Grids is a standalone figure that does not include related costs.
3-1. Performance Data
4. FY2020 Results and FY2021 Forecast (Detail(1))

39© Hitachi, Ltd. 2021. All rights reserved.
Unit : Billions of yen FY2019 FY2020 FY2021 Forecast
EBIT [ratio] Sector Total (374.0)[(91.5)%] (53.3)[(4.8)%] 41.0[3.1%]
Nuclear Energy BU +Energy BU (374.0)[(91.5)%] (5.6)[(1.6)%] 32.5[9.6%]
Power Grids BU - (47.7)[(6.3)%] (2.6)[(0.3)%]
Hitachi ABB Power Grids - 36.5[5.1%] 77.6[8.0%]
Adjusted EBITA ratio Sector Total 3.8% 0.6% 6.1%
Nuclear Energy BU + Energy BU 3.8% (1.2)% 10.0%
Power Grids BU - 1.5% 4.8%
Hitachi ABB Power Grids - 4.5% 7.8%
EBITDA ratio Sector Total (90.3)% 3.0% 9.6%
Nuclear Energy BU + Energy BU (90.3)% (0.1)% 11.5%
Power Grids BU - 4.5% 7.7%
Hitachi ABB Power Grids - 9.0% 11.8%
ROIC Sector Total 6.4% (2.7)% 2.2%
(Return on Invested Capital) Nuclear Energy BU + Energy BU 6.4% (3.0)% 24.1%
Power Grids BU - (2.8)% 0.4%
CCC Sector Total 63.9 days 84.2 days 70.4 days
Nuclear Energy BU + Energy BU 63.9 days 51.7 days 58.9 days
Power Grids BU - 99.1 days 74.4 days
3-1. Performance Data
5. FY2020 Results and FY2021 Forecast (Detail(2))
* Figures include control systems included in the IT sector and related costs.
The figures for FY2020 are retroactively adjusted to reflect the impact of the reorganization in FY2021.
* Figures of Hitachi ABB Power Grids is a standalone figure that does not include related costs.
40© Hitachi, Ltd. 2021. All rights reserved.
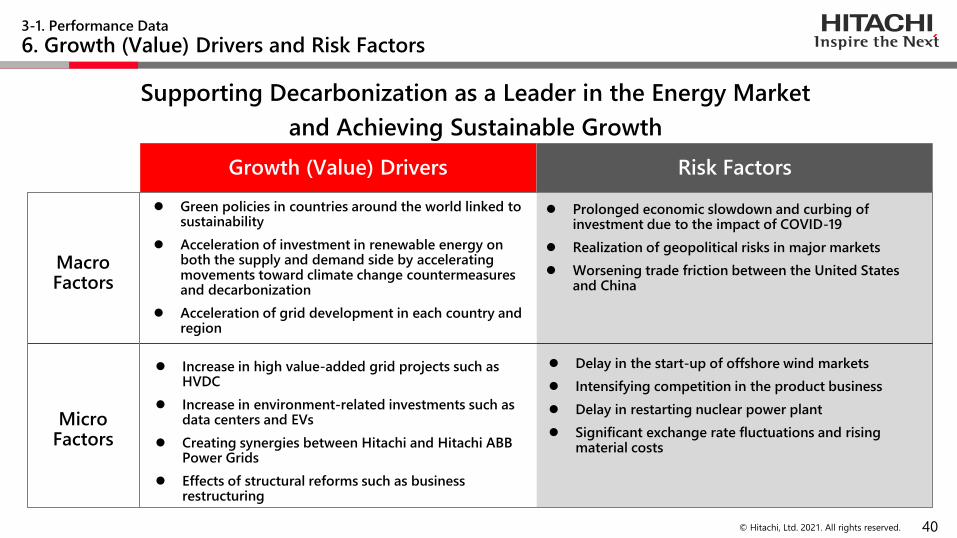
Supporting Decarbonization as a Leader in the Energy Market
and Achieving Sustainable Growth
⚫ Green policies in countries around the world linked to sustainability
⚫ Acceleration of investment in renewable energy on both the supply and demand side by accelerating movements toward climate change countermeasures and decarbonization
⚫ Acceleration of grid development in each country and region
⚫ Prolonged economic slowdown and curbing of investment due to the impact of COVID-19
⚫ Realization of geopolitical risks in major markets
⚫ Worsening trade friction between the United States and China
⚫ Increase in high value-added grid projects such as HVDC
⚫ Increase in environment-related investments such as data centers and EVs
⚫ Creating synergies between Hitachi and Hitachi ABB Power Grids
⚫ Effects of structural reforms such as business restructuring
⚫ Delay in the start-up of offshore wind markets
⚫ Intensifying competition in the product business
⚫ Delay in restarting nuclear power plant
⚫ Significant exchange rate fluctuations and rising material costs
3-1. Performance Data
6. Growth (Value) Drivers and Risk Factors
Growth (Value) Drivers Risk Factors
Macro Factors
Micro Factors

© Hitachi, Ltd. 2021. All rights reserved.
Contents
41
Energy Sector
1. Energy Sector
1-1. Energy Sector Overview
1-2. Vision and Growth Strategy
1-3. Summary
3. Appendix
3-1. Performance Data
3-2. Glossary of Terms
2. Power Grids Business
2-1. Overview of Operations
2-2. Market Environment
2-3. Growth Opportunities
2-4. Execution Focus
2-5. Summary

42© Hitachi, Ltd. 2021. All rights reserved.
3-1. Glossary of Terms
1. Glossary of Terms ① A~E
Adjusted EBITA Adjusted Earnings Before Interests, Taxes and Amortization
AIS Air Insulated Switchgear
APM Asset Performance Management
CAGR Compound Average Growth Rate
Capex Capital Expenditure
CCC Cash Conversion Cycle
CO2e CO2 equivalent
CRM Customer Relationship Management
E2E End-to-End
EAM Enterprise Asset Management
EBIT Earnings Before Interests and Taxes
EBITA Earnings Before Interests, Taxes and Amortization
EBITDA Earnings Before Interests, Taxes, Depreciation and Amortization
EFaaS Energy & Facility Management as a Service
EMS Energy Management Service
EoL End of Life
ERP Enterprise Resources Planning

43© Hitachi, Ltd. 2021. All rights reserved.
3-1. Glossary of Terms
2. Glossary of Terms ② E~V
EV Electric Vehicle
FACTS Flexible Alternating Current Transmission Systems
FSM Field Service Management
GCB Gas Circuit Breaker
GIS Gas Insulated Switchgear
HVDC High Voltage Direct Current
Opex Operational Expenditure
OT Operational Technology
PPA(Page 12) Power Purchase Agreement
PPA(Page 14) Purchase Price Allocation
QoL Quality of Life
SCADA Supervisory Control And Data Acquisition
SCM Supply Chain Management
SDG(s) Sustainable Development Goal(s)
SF6 Sulfur hexafluoride
T&D Transmission & Distribution
tCC ton of carbon credit
VPP Virtual Power Plant
43© Hitachi, Ltd. 2021. All rights reserved.
44© Hitachi, Ltd. 2021. All rights reserved.
Cautionary Statement
Certain statements found in this document may constitute “forward-looking statements” as defined in the U.S. Private Securities Litigation Reform Act of 1995. Such “forward-looking statements” reflect management’s current views with respect to certain future
events and financial performance and include any statement that does not directly relate to any historical or current fact. Words such as “anticipate,” “believe,” “expect,” “estimate,” “forecast,” “intend,” “plan,” “project” and similar expressions which indicate
future events and trends may identify “forward-looking statements.” Such statements are based on currently available information and are subject to various risks and uncertainties that could cause actual results to differ materially from those projected or
implied in the “forward-looking statements” and from historical trends. Certain “forward-looking statements” are based upon current assumptions of future events which may not prove to be accurate. Undue reliance should not be placed on “forward-looking
statements,” as such statements speak only as of the date of this report.
Factors that could cause actual results to differ materially from those projected or implied in any “forward-looking statement” and from historical trends include, but are not limited to:
◼ exacerbation of social and economic impacts of the spread of COVID-19;
◼ economic conditions, including consumer spending and plant and equipment investment in Hitachi’s major markets, as well as levels of demand in the major industrial sectors Hitachi serves;
◼ exchange rate fluctuations of the yen against other currencies in which Hitachi makes significant sales or in which Hitachi’s assets and liabilities are denominated;
◼ uncertainty as to Hitachi’s ability to access, or access on favorable terms, liquidity or long-term financing;
◼ uncertainty as to general market price levels for equity securities, declines in which may require Hitachi to write down equity securities that it holds;
◼ fluctuations in the price of raw materials including, without limitation, petroleum and other materials, such as copper, steel, aluminum, synthetic resins, rare metals and rare-earth minerals, or shortages of materials, parts and components;
◼ estimates, fluctuations in cost and cancellation of long-term projects for which Hitachi uses the percentage-of-completion method to recognize revenue from sales;
◼ increased commoditization of and intensifying price competition for products;
◼ uncertainty as to Hitachi’s ability to attract and retain skilled personnel;
◼ uncertainty as to Hitachi’s ability to continue to develop and market products that incorporate new technologies on a timely and cost-effective basis and to achieve market acceptance for such products;
◼ fluctuations in demand of products, etc. and industry capacity;
◼ uncertainty as to Hitachi’s ability to implement measures to reduce the potential negative impact of fluctuations in demand of products, etc., exchange rates and/or price of raw materials or shortages of materials, parts and components;
◼ credit conditions of Hitachi’s customers and suppliers;
◼ uncertainty as to Hitachi’s ability to achieve the anticipated benefits of its strategy to strengthen its Social Innovation Business;
◼ uncertainty as to the success of acquisitions of other companies, joint ventures and strategic alliances and the possibility of incurring related expenses;
◼ uncertainty as to the success of restructuring efforts to improve management efficiency by divesting or otherwise exiting underperforming businesses and to strengthen competitiveness;
◼ general socioeconomic and political conditions and the regulatory and trade environment of countries where Hitachi conducts business, particularly Japan, Asia, the United States and Europe, including, without limitation, direct or indirect restrictions by
other nations on imports and differences in commercial and business customs including, without limitation, contract terms and conditions and labor relations;
◼ the potential for significant losses on Hitachi’s investments in equity-method associates and joint ventures;
◼ uncertainty as to the success of cost structure overhaul;
◼ the possibility of disruption of Hitachi’s operations by natural disasters such as earthquakes and tsunamis, the spread of infectious diseases, and geopolitical and social instability such as terrorism and conflict;
◼ uncertainty as to the outcome of litigation, regulatory investigations and other legal proceedings of which the Company, its subsidiaries or its equity-method associates and joint ventures have become or may become parties;
◼ the possibility of incurring expenses resulting from any defects in products or services of Hitachi;
◼ uncertainty as to Hitachi’s ability to maintain the integrity of its information systems, as well as Hitachi’s ability to protect its confidential information or that of its customers;
◼ uncertainty as to Hitachi’s access to, or ability to protect, certain intellectual property; and
◼ uncertainty as to the accuracy of key assumptions Hitachi uses to evaluate its employee benefit-related costs.
The factors listed above are not all-inclusive and are in addition to other factors contained elsewhere in this report and in other materials published by Hitachi.