Embed Size (px)
Citation preview
Energy Savings Forecast of Solid-State Lighting in General Illumination Applications
Prepared for the U.S. Department of Energy
August 2014
Prepared by Navigant Consulting, Inc.

August 2014
Page i
(This page intentionally left blank)

August 2014
Page ii
Disclaimer
This report was prepared as an account of work sponsored by an agency of the United States
Government. Neither the United States Government, nor any agency thereof, nor any of their
employees, nor any of their contractors, subcontractors, or their employees, makes any warranty,
express or implied, or assumes any legal liability or responsibility for the accuracy,
completeness, or usefulness of any information, apparatus, product, or process disclosed, or
represents that its use would not infringe privately owned rights. Reference herein to any specific
commercial product, process, or service by trade name, trademark, manufacturer, or otherwise,
does not necessarily constitute or imply its endorsement, recommendation, or favoring by the
United States Government or any agency, contractor, or subcontractor thereof. The views and
opinions of authors expressed herein do not necessarily state or reflect those of the United States
Government or any agency thereof.

August 2014
Page iii
Acknowledgements
The authors would like to acknowledge the valuable guidance and input provided during the
preparation of this report. Dr. James R. Brodrick of the U.S. Department of Energy, Building
Technologies Office offered day-to-day oversight of this assignment, helping to shape the
approach, execution, and documentation. The authors are also grateful to Mahima Gupta,
Norman Bardsley, Steve Bland, Morgan Pattison, as well as the Pacific Northwest National
Laboratory and Next Generation Lighting Initiative Alliance members who contributed to
reviewing this report. Their contributions, guidance, and review proved invaluable in preparing
the estimates contained in this report.

August 2014
Page iv
COMMENTS
The Energy Department is interested in feedback or comments on the materials presented in this
document. Please write to James Brodrick, Lighting Program Manager:
James R. Brodrick, Ph.D.
Lighting Program Manager
U.S. Department of Energy
1000 Independence Avenue SW
Washington, D.C. 20585-0121

Page v
Executive Summary
The United States Department of Energy (DOE) has been at the forefront of the solid-state
lighting revolution. Among its various activities, DOE has supported studies forecasting the
market penetration of light-emitting diodes (LEDs) in general illumination applications since
2002. These forecasts provide a comprehensive overview of the expected path of LED adoption
within the United States and estimate the energy savings offered by LED products out to year
2030. This, the sixth iteration of the Energy Savings Forecast of Solid-State Lighting in General
Illumination Applications, presents the results of the United States lighting market model, which
leverages updated data sources and provides a more detailed breakdown of general lighting
applications than presented in past forecasts. This study estimates the expected future adoption
of LEDs based on the current trajectory for the technology and does not necessarily represent the
maximum potential—both in terms of market penetration and energy savings—of LED
technology.
The lighting market model assumes the market adoption of LED lighting technology is driven
primarily by projected improvements in LED product efficacy and price, as well as established
technology diffusion rates. At the end of the analysis period, LEDs are anticipated to dominate
lighting sales in each of the submarkets examined, comprising 84% of all sales by lumen-hours.
This will dramatically lower national energy consumption. Without LEDs, the model projects
that the energy consumption of the lighting sector would grow to approximately eight quadrillion
Btu (quads). The market penetration of LEDs is projected to drive a 40% reduction in energy
consumption, or a total energy savings of 3.0 quads, in 2030 alone, which is nearly the total
energy consumed by 24 million United States homes today.
Of the eight submarkets examined, the lighting market model anticipates that LEDs will grow
most rapidly in the street and roadway and general service submarkets in terms of the percentage
of total lumen-hour sales. In the street and roadway submarket, already a popular area for LED
upgrades, LEDs are predicted to reach 83% market share of sales by 2020 and nearly 100% by
2030. The general service submarket will shift to LEDs a bit more slowly, with a projected 55%
market share of sales in 2020, but will also almost entirely consist of LEDs by 2030.
Though all forecasts lack certainty, the findings present a thorough overview of where the
lighting market is currently headed and will be of use to manufacturers, suppliers, and other
stakeholders in the lighting industry as the transition to LED technology moves forward.
Additionally, this study is accompanied by an online interactive model, which allows users to
adjust key inputs, including price and efficacy trends, to better understand how these adjustments
affect the forecasted LED penetration and energy savings. The online interactive model is
available at be http://energy.gov/eere/ssl/led-lighting-forecast.

Page vi
Table of Contents
EXECUTIVE SUMMARY ................................................................................................. V
1 INTRODUCTION................................................................................................................. 1
2 ANALYTICAL APPROACH .............................................................................................. 2
LIGHTING MARKET MODEL ENHANCEMENTS ........................................... 5
SIMPLIFYING ASSUMPTIONS .......................................................................... 7
3 LIGHTING MARKET MODEL RESULTS...................................................................... 9
INDOOR LIGHTING ........................................................................................... 11
3.1.1 General Service Submarket ....................................................................... 14
3.1.2 Decorative Lamp Submarket ..................................................................... 16
3.1.3 Directional Submarket ............................................................................... 18
3.1.4 Linear Fixture Submarket .......................................................................... 22
3.1.5 Low/High Bay Submarket ......................................................................... 24
OUTDOOR LIGHTING SUBMARKETS ........................................................... 26
3.2.1 Street/Roadway Submarket ....................................................................... 27
3.2.2 Parking Submarket .................................................................................... 28
3.2.3 Building Exterior Submarket .................................................................... 30
FORECAST MODEL COMPARISON ................................................................ 31
4 SENSITIVITY ANALYSIS ............................................................................................... 33
APPENDIX A SUBMARKET CLASSIFICATIONS AND LIGHTING INVENTORY ..... 36
APPENDIX B LED LAMPS AND LUMINAIRES PRODUCT DESCRIPTIONS.............. 38
APPENDIX C ANNUAL LUMEN DEMAND AND MARKET TURNOVER .................... 39
APPENDIX C.1 NATIONAL LUMEN DEMAND PROJECTION ................................ 39
APPENDIX C.2 ANNUAL AVAILABLE MARKET .................................................... 39
APPENDIX D CONVENTIONAL TECHNOLOGY IMPROVEMENT PROJECTION .. 41
APPENDIX D.1 LEGISLATION AND DOE REGULATIONS ..................................... 46
APPENDIX E LED TECHNOLOGY IMPROVEMENT PROJECTION ........................... 49
APPENDIX F LIGHTING MARKET PENETRATION MODEL ....................................... 53
APPENDIX F.1 ECONOMETRIC LOGIT MODEL ...................................................... 53
APPENDIX F.2 TECHNICAL DISCUSSION OF THE CONDITIONAL LOGIT
MODEL ............................................................................................................................ 54
APPENDIX F.3 LOGIT MODEL INPUT DATA ........................................................... 55
APPENDIX F.4 TECHNOLOGY DIFFUSION CURVE ................................................ 55
6 REFERENCES .................................................................................................................... 57
Page vii
Tables
Table 3.1 U.S. LED Forecast Results by Sector ........................................................................... 10
Table 3.2 General Service Submarket Forecast ............................................................................ 16
Table 3.3 Decorative Submarket Forecast .................................................................................... 17
Table 3.4 Directional Submarket Forecast .................................................................................... 22
Table 3.5 Linear Fixture Submarket Forecast ............................................................................... 24
Table 3.6 Low/High Bay Submarket Forecast .............................................................................. 26
Table 3.7 Street and Roadway Submarket Forecast ..................................................................... 28
Table 3.8 Parking Submarket Forecast ......................................................................................... 30
Table 3.9 Building Exterior Submarket Forecast ......................................................................... 31
Table 3.10 Forecast Model – LED Market Share Comparison .................................................... 32
Table 4.1 Adjustable Sensitivity Inputs for Online Lighting Market Model Tool ...................... 33
Table B.1 Description of the LED Lamp and Luminaire Groupings in Each Submarket ............ 38
Table D.2 Commercial Sector Conventional Technology Performance 2013 ............................. 42
Table D.3 Residential Sector Conventional Technology Performance 2013 ............................... 43
Table D.4 Industrial Sector Conventional Technology Performance 2013 .................................. 44
Table D.5 Outdoor Sector Conventional Technology Performance 2013 .................................... 45
Table E.6 Average LED Lamp and Luminaire Efficacy Projections by Sector and Submarket .. 50
Table E.7 Previous 2012 Lighting Market Model Best-in-Class LED Efficacy Projections ....... 50
Table E.8 LED Lamp and Luminaire Lifetime Projections .......................................................... 51
Table E.9 Average LED Lamp and Luminaire Price Projections by Sector and Submarket ....... 52
Table E.10 Previous 2012 Lighting Market Model LED Price Projections ................................. 52
Table F.11 Electricity Price Projections in 2014 Dollars per Kilowatt-Hour ............................... 55
Page viii
Figures
Figure 2.1 Lighting Market Arenas ................................................................................................ 3
Figure 2.2 Market Share Modeling Approach ................................................................................ 5
Figure 3.1 Total U.S. Lighting Energy Consumption Forecast, 2013 to 2030 ............................... 9
Figure 3.2 U.S. Lighting Service Forecast, 2013 to 2030 ............................................................. 11
Figure 3.3 Commercial Lighting Energy Consumption Forecast, 2013 to 2030 .......................... 12
Figure 3.4 Industrial Lighting Energy Consumption Forecast, 2013 to 2030 .............................. 13
Figure 3.5 Residential Lighting Energy Consumption Forecast, 2013 to 2030............................ 14
Figure 3.6 General Service Market Share (% of lm-hr sales) Forecast, 2013 to 2030 ................. 15
Figure 3.7 Decorative Lamp Market Share (% of lm-hr sales) Forecast, 2013 to 2030 ............... 17
Figure 3.8 Downlight Applications Market Share (% of lm-hr sales) Forecast, 2013 to 2030 .... 19
Figure 3.9 Track Applications Market Share (% of lm-hr sales) Forecast, 2013 to 2030 ............ 20
Figure 3.10 MR16 Applications Market Share (% of lm-hr sales) Forecast, 2013 to 2030 ......... 20
Figure 3.11 Industrial Directional Applications Market Share (% of lm-hr sales) Forecast, 2013
to 2030 .......................................................................................................................................... 21
Figure 3.12 Linear Fixture Market Share (% of lm-hr sales) Forecast, 2013 to 2030 .................. 23
Figure 3.13 Low/High Bay Market Share (% of lm-hr sales) Forecast, 2013 to 2030 ................. 25
Figure 3.14 Outdoor Lighting Energy Consumption Forecast, 2013 to 2030 .............................. 27
Figure 3.15 Street and Roadway Market Share (% of lm-hr sales) Forecast, 2013 to 2030 ......... 28
Figure 3.16 Parking Market Share (% of lm-hr sales) Forecast, 2013 to 2030 ............................ 29
Figure 3.17 Building Exterior Market Share (% of lm-hr sales) Forecast, 2013 to 2030 ............. 31
Figure 4.1 Forecasted LED Energy Savings if DOE SSL Program Goals are Realized .............. 34
Figure E.1 LED Lamp and Luminaire Lifetime Projections ........................................................ 51
Figure F.1 LED Market Share vs. Conventional Lighting Technology Diffusion ....................... 56

Page 1
1 Introduction
According to a recent U.S. Department of Energy (DOE) report, lighting consumed
approximately 18% of the total U.S. electricity use in 2013 (Navigant, 2014). At that time, light-
emitting diode (LED) lamp and luminaire products were costly, and very few were installed in
general illumination applications; however, predictions suggested that they would soon greatly
transform the market. In the subsequent four years, LED technology has improved considerably
and early energy-savings predictions have begun to materialize.
This study is the sixth iteration of the Energy Savings Forecast of Solid-State Lighting (SSL) in
General Illumination Applications forecast analysis. As in past iterations, this study provides
updated predictions of LED market penetration and energy savings compared to conventional
lighting sources (i.e., incandescent, halogen, fluorescent, and high-intensity discharge) in all
general illumination applications from present-day through 2030.1 An econometric lighting
market model forecasts the expected annual lighting energy consumption which assumes the
continued and increasing penetration of LED technology and a counter-factual scenario where
LEDs never existed. LEDs energy savings can be derived by comparing these forecasts. This
study estimates the expected future adoption of LEDs based on the current trajectory for the
technology. Therefore, the results of the light market model do not necessarily represent the
maximum potential, both in terms of market penetration and energy savings, of LED technology.
This study is presented in five main sections, including this introduction and:
Section 2 which provides a high level overview of the analytical approach used to forecast LED
energy savings. The approach consists of seven steps starting with developing 2013 lighting
inventories and ending with calculating the energy savings due to LED penetration. The lighting
market model utilizes a econometric logit model to award available market share to multiple
competing lighting technologies, similar to the model used in the National Residential Sector
Demand Module of NEMS 2013 (U.S. EIA, 2013) for the lighting technology choice component,
and is discussed in detail in Appendix F.
Section 3 which provides a detailed look at the results of the econometric model. Discussion
concerning the predicted market share of each lighting technology and resulting energy
consumption is provided for the entire lighting market as well as each submarket that is
examined.
Section 4 which provides an abridged sensitivity analysis that looks at the effects of variations in
price and efficacy trends. Readers are invited to visit http://energy.gov/eere/ssl/led-lighting-
forecast, where they can manipulate an interactive version of the lighting market model, and
further investigate the model sensitivities.
Additionally there are a set of Appendices which provide a much deeper dive into the different
elements of the analytical approach.
1 Past iterations of the Energy Savings Forecast of Solid-State Lighting (SSL) in General Illumination Applications
reports are available at: http://www1.eere.energy.gov/buildings/ssl/tech_reports.html

Page 2
2 Analytical Approach
The methodology followed in developing the U.S. lighting market model and forecasting
aggregate consumer lighting purchases, consists of a seven-step process. The summary of this
process is outlined below and additional discussion is provided in the appendices.
Step 1, Calculate national lighting inventory and service. Utilizing the lighting inventory data
published in the 2010 Lighting Market Characterization (Navigant, 2012), the Residential
Lighting End-Use Consumption Study (PNNL, 2013(a)),2 and the Adoption of Light Emitting
Diodes in Common Lighting Applications: Snapshot of 2013 Trends (Navigant, 2014), the
lighting market model uses the lamp installations, average efficacies, wattages, and operating
hours to estimate a national lighting inventory in lumen-hours of lighting service for each sector
(i.e. residential, commercial, industrial, and outdoor). The base year for the inventory considered
in this analysis is 2013.
Step 2, Develop arenas for competition.3 As depicted in Figure 2.1, the current lighting market
model examines eight submarkets across four sectors where a total of 15 technology categories
may compete (not including an “other” technology category used when there is uncertainty in the
existing inventory). An “other” submarket was also included in each sector to accommodate
lighting products with unknown applications. It is assumed that LEDs will compete with these
products separately.
Establishing submarket categories based on common general illumination applications is a
significant improvement from the previous model iteration, where competition between lighting
technologies was simplified by only examining five technology-based submarkets: medium
screw-base general service lamps (GSL–MSB), reflector–screw-base, linear fluorescent, high-
intensity discharge (HID), and miscellaneous. This improvement to the lighting market model
enables a single lighting technology, such as linear fluorescent lamps, to compete in multiple
submarkets (i.e. linear fixtures, low/high bay, and parking) compared to the previous model
iteration which grouped all linear fluorescent lamps into a single submarket regardless of
application.
2 The Residential Lighting End-Use Consumption Study is used for the operating hour estimates for lighting installed
in the residential sector, while the 2010 Lighting Market Characterization is used for the operating hour estimates
for lighting installed in the commercial, industrial and outdoor sectors. 3 Additional detail on how the arenas for competition were developed is included in Appendix A.

Page 3
Figure 2.1 Lighting Market Arenas
Step 3, Project annual lumen demand forecast.4 Assuming constant lumen demand per square
foot of floor space in each sector, the lighting market model forecasts U.S. lumen demand from
2013 to 2030. The Annual Energy Outlook (AEO) 2014 provides annual average growth
forecasts of floor space in the residential and commercial sectors, which are used to project
increases in lumen demand moving forward (U.S. EIA, 2014). Projections suggest that
residential floor space will increase by an average of 1.31% per annum over the 20-year analysis
period, and the commercial sector floor space will increase by an average of 1.00% per annum.
AEO 2014 does not provide a growth forecasts for the industrial or outdoor sectors. Because the
outdoor sector includes buildings-related outdoor lighting, it was assumed that its growth rate
would match that of the commercial sector. For the industrial sector, the AEO 2014 annual
projections for manufacturing employment growth were used as a proxy for annual average floor
space growth estimates of floor space.
Step 4, Calculate the available market.5 Each year, new lamps enter the market as old lamps are
replaced or fixtures are installed or retrofitted. This creates an annual lumen market turnover,
which may be satisfied by a suite of lighting technologies. The lighting market model considers
three possible events that create lumen market turnover: 1) new installations due to new
construction; 2) units replaced upon failure of existing lamps; and 3) units replaced due to
lighting upgrades and renovations. The quantity of lumen turnover due to new installations is
4 Additional detail on how the annual lumen demands were calculated can be found in Appendix C. 5 Additional detail on how the lumen market turnovers were calculated can be found in Appendix C.
Residential Commercial Industrial Outdoor
General Service
Incandescent
Sectors
Decorative Directional LinearLow /
High BayStreet /
RoadwayParking
Building Exterior
Submarkets
Technologies
Incandescent Reflector
Halogen
CFL Reflector CFL Pin T5
Metal HalideHigh Pressure
SodiumMercury Vapor LED Lamp LED Luminaire
Halogen Reflector CFL
T8 T12

Page 4
derived from maintaining lighting density per unit area for the projected new building floor space
in the various sectors as discussed in Step 3. The quantity of lumen turnover due to replacements
is based on the lumens that fail in a calendar year, which is calculated using a Weibull
probability distribution,6 typical lighting operating hours and lifetimes. The quantity of lumen
turnover due to renovation is assumed to be a constant 5% of all lumen-hours per year, or a mean
renovations cycle of 20 years.
Step 5, Project conventional and LED lighting technology improvement.7 Recognizing that the
incumbent conventional lighting technologies will compete with new LED lighting products, the
lighting market model allows for both cost reductions and performance improvements in efficacy
and lifetime for conventional lighting technologies (i.e., incandescent, halogen, fluorescent, and
HID) and LEDs. Technology performance improvements are also adjusted to account for
existing legislative and regulatory energy conservation standards that take effect in future years.
The lighting market model primarily uses adjusted price and performance curves for LED
lighting based on data published in the 2013 SSL Pricing and Efficacy Trend Analysis for Utility
Program Planning (PNNL, 2013(b)).
Step 6, Model the market share of all lighting technologies.8 The lighting market model predicts
market share as an aggregate of many individual purchase decisions using two analytic
components: an econometric logit model that considers cost factors influencing each decision,
and a technology diffusion curve that considers time dependent market factors influencing each
decision. Additionally, LED penetration is calibrated through a reverse engineering process
comparing past LED market share values predicted by the model to actual historical values.
Figure 2.2 summarizes this approach. This approach of using a logit model and a technology
diffusion model in concert is well tested and has been previously used in many forecast models
(Cao, 2004; Paidipati, Frantzis, Sawyer, & Kurrasch, 2008).
6 The Weibull distribution is a commonly used function for modeling survival and/or reliability. The formula for the
survival function of the Weibull distribution is described by the National Institute of Standards and Technology,
http://www.itl.nist.gov/div898/handbook/eda/section3/eda3668.htm 7 Additional detail on how the cost and efficacy improvements were determined can be found in Appendix E. 8 Additional detail on the logit model, the diffusion curve, and the calibration can be found in Appendix F.

Page 5
Figure 2.2 Market Share Modeling Approach
Step 7, Calculate energy savings. Annual energy savings are then estimated by comparing the
lighting energy consumption projected by the lighting market model to that of a counter-factual
LED-absent scenario. In the no-LED scenario, LED products are assumed to have never entered
the general illumination market, but all other market conditions, such as energy conservation
standards for conventional technologies, are unchanged.9
Lighting Market Model Enhancements
This iteration of the general illumination forecast improves upon past years’ iterations in
multiple ways. These enhancements are outlined below:
1. Calibration based on estimated LED market share. Past iterations of this model used
hypothetical market penetration rates based on how similar products historically gained
market share. Market-share data for LED lamp and luminaire products are now available
for several past years. This track record makes it possible to calibrate the lighting market
model outputs for future years based on the actual pattern by which LEDs have gained
market share thus far, effectively improving the accuracy of the predictions.
2. Moving the lighting market model to an advanced quantitative decision-support software
tool. Previous iterations of the lighting market model were limited by the two-
dimensional nature of spreadsheet calculations. For this iteration, the lighting market
9 It has been hypothesized that certain standards would not have been implemented if not for the introduction of
LEDs; however, such secondary effects are not accounted for in the energy savings calculation.
Step 1. Develop initial market share through an econometric logit model which considers first and annual O&M costs of a
technology.
Step 2. Limits market shares using Bass
diffusion which predicts maximum adoption
potential due to market barriers of a technology.
Step 3. Calibrate LED market share projections
by minimizing delta between actual and
modeled market share for 2010-2013.
Mar
ket
Shar
e
Δ betweenactual and modelled
0%
20%
40%
60%
80%
100%
0 10 20 30 40
Max
imu
m A
do
pti
on
(%
)
Years on Market
0%
20%
40%
60%
80%
100%
Logi
t M
ark
et
Sha
re (
%)
Page 6
model was moved to a new software package10 that allows for complex multi-
dimensional analysis, minimizing the need for many over-simplified assumptions and
improving the overall characterization of the U.S. lighting market.
3. A deeper disaggregation of LED products and applications. In this study, the lighting
market model tracks the penetration of LED lamp and luminaire products separately to
more accurately describe competition with incumbent technologies. This also allows
LED lamp and luminaire products to compete within the same submarket, which was not
considered in the previous lighting market model iterations.
4. Reorganization of submarkets. Thanks in part to a transition to the new software
package10, the U.S. lighting market model is now capable of processing a more complex
multi-dimensional analysis as well as more sophisticated market share calculations where
the submarkets are application-based rather than grouped by lighting technology. As
mentioned in the Section 2, the submarkets in the previous lighting market model
included: GSL–MSB, screw-base reflector, linear fluorescent, HID and miscellaneous.
The technologies that competed for market share were limited within each of these
submarkets. In the updated lighting market model, submarkets are defined by
applications within each sector and allow for competition among all available
technologies. For example, the new model considers the use of omnidirectional lamps in
directional applications in acknowledgement that residential consumers use general
service lamps (GSLs) as a common “fix” for several home-based applications. Also, in
the updated lighting market model, HID and linear fluorescent fixtures are able to
compete within low/high bay applications, whereas in the previous model this was not
considered. (See Appendix A for more detail about the lighting technologies grouped in
each submarket.)
5. Advanced failure-rate calculations. In the previous lighting market model, failure rates
were calculated assuming a constant annual failure rate based solely on a product’s
expected lifetime and operating hours. In this updated model iteration, lamp and ballast
failures are predicted using the Weibull probability distribution,6 which predicts the
proportion of remaining units that are expected to fail each year. Using the Weibull
distribution allows the lighting market model to track the vintage or installation year of
all products within the installed stock, and, with this knowledge, predict the number of
failures.
6. Updated price and efficacy forecasts for LEDs. In past iterations the anticipated LED
price and efficacy values for out-years were derived from the DOE SSL Program’s Multi-
year Program Plan (MYPP).11 The MYPP indicates performance goals that the market
believes are achievable with DOE support. As mentioned in step 5 of Section 2, this
year’s lighting market model relies primarily on LED price and efficacy forecasts
provided by PNNL. While the MYPP indicates expectations for the best available
product, the PNNL forecast indicates expectations for average products, which is a better
representation of the entire LED market.
10 Analytica® is a quantitative decision-support environment that facilitates problem visualization. More
information can be found at: http://www.lumina.com/ 11 The DOE SSL Program’s MYPP is updated annually and is available at:
http://www1.eere.energy.gov/buildings/ssl/techroadmaps.html

Page 7
Simplifying Assumptions
In constructing the lighting market model, several simplifying assumptions were necessary to
manage the analytical complexity of the U.S. lighting market. The assumptions are summarized
below for convenience and clarity of presentation. The assumptions represent best estimates and
were derived from inputs provided by DOE’s SSL technical reports as well as industry experts;
however, there is still significant uncertainty introduced with the assumptions. Each assumption
is described below with a statement of whether it has a tendency to cause an overestimation or
underestimation of the forecasted energy savings derived from the penetration of LED lighting.
Due to the high level of uncertainty and lack of data in each area listed below, no attempt is
made to quantify the magnitude of the effect.
1. Constant demand for lighting intensity. It is assumed that the level of lighting intensity
(lumens per square foot) in buildings remains constant over the analysis period (2013–
2030). This simplification may underestimate the forecasted energy savings from LEDs
because it requires LEDs match the source lumen output levels of conventional sources in
all applications. However, many spaces may be over-lit and LED technology may be
able to achieve adequate illumination with fewer lumens (e.g., due to improved
uniformity, directionality, and/or color performance).
2. Prevalence of lighting controls. One of LEDs’ strengths is their compatibility with
lighting controls. Higher LED adoption is likely to be accompanied with higher control
usage. The use of networked lighting controls, such as motion sensors or occupancy
sensors, will allow for instantaneous response to the demand for lighting and save energy
by providing artificial light only when and where it is needed. The lighting market model
assumes the prevalence and use of controls does not change drastically during the
analysis period. This assumption likely underestimates the forecasted energy savings of
LEDs, as controls are becoming increasingly popular in lighting upgrades/retrofits and
new construction, particularly where they can be easily integrated into LED luminaries
themselves.
3. Renovations rate. The lighting market model assumes a constant, 5% per year, rate of
lighting fixture replacements due to renovations of the installed base. This covers all
upgrades/retrofits and renovations, regardless of their impetus, and includes renovations
undertaken for design or aesthetic preferences and “green” retrofits undertaken to reduce
energy consumption. With concerns over climate change mounting, energy-efficiency
retrofits are likely to increase in frequency over time. In addition, utility and government
incentive programs are starting to compensate consumers who retrofit using LED lighting
products.12 Due to the high uncertainty in these inputs, the lighting market model does
not attempt to quantify these trends and, consequentially, may underestimate or
overestimate the forecasted LED market penetration and energy savings.
4. LED and conventional technology price and performance improvement curves. The
lighting market model is driven by price and performance improvement assumptions for
12 Information on lighting incentives can be found at the Database of State Incentives for Renewables & Efficiency
available at: www.dsireusa.org

Page 8
LEDs and conventional technologies over the analysis period. Any deviations from these
projections could cause the energy savings estimates to be higher or lower. Because the
price and performance projections in the 2013 SSL Pricing and Efficacy Trend Analysis
for Utility Program Planning the lighting market model may underestimate or
overestimate the forecasted LED market penetration and energy savings in the long
term.
5. Market share forecast. The economic portion of the lighting market model postulates
that the lighting market responds primarily to first and annual costs and provides a
probability of purchase for each technology under perfect competition. However, the
lighting market model also recognizes that newer technologies are at a relative
disadvantage compared with well-established incumbent technologies. The rate of
market penetration is subject to certain market barriers, including, but not limited to,
acceptance and availability of the technology. Typically, these barriers only apply to new
market entrants, such as LED technologies, as it is these technologies that may initially
be unknown to consumers or may not be readily available to purchase. As a product
establishes itself on the market, however, benefits are communicated by word-of-mouth
to the consumer base, manufacturers are able to ramp up production capacity, and
stocking distribution channels emerge. To account for these factors, the lighting market
model assumes a technology diffusion curve for LEDs based on the historical rate of
penetration of other lighting technologies. Depending on how LEDs are marketed this
assumption may overestimate or underestimate the forecasted LED market penetration
and energy savings.
6. Other future uncertainties. There is a wide array of potential developments that have
been hypothesized which would greatly affect the lighting market. In short, the lighting
market model does not address these developments as their likelihood is currently too
speculative. Future studies should reassess these possible developments and address as
needed.
Rebound effect – Users may increase their daily lighting usage because the
operating cost is cheaper.
Increased LED utility – Demand for LEDs may ascend quicker due to their non-
lighting attributes, such as their ability to be used to transmit data.
New technology – OLED lighting, laser lighting, or another unforeseen
technology may be introduced or gain significant market share.
Government actions – Government actions, such as new efficiency standards or
tax incentives could affect the future adoption of LED lighting products.
Due to the great uncertainty surrounding each, the assumption to not include these
possible market conditions may overestimate or underestimate the forecasted LED
market penetration and energy savings.

Page 9
3 Lighting Market Model Results
DOE estimates that in 2013 lighting technologies were responsible for 17% of total U.S.
electricity consumption, using approximately 609 terawatt-hours of site electricity, or about 6.9
quads of source energy. As seen in Figure 3.1, which presents the lighting energy consumption
forecast as predicted by the lighting market model, LED lighting is projected to reduce lighting
energy consumption by 15% in 2020 and 40% in 2030, which, in absolute terms, is 261 terawatt-
hours or 3.0 quads saved in 2030.
Figure 3.1 Total U.S. Lighting Energy Consumption Forecast, 2013 to 2030
As presented in Table 3.1, the results of this forecast indicate that LED lighting sales (based on
lumen-hours) will increase from approximately 3% in 2013 to about 48% in 2020, and 84% in
2030. The rapid growth of LED products between today and 2020 is largely due to LEDs costs
reaching highly-competitive levels and newly enacted efficiency standards. Much of this growth
will occur first in the outdoor sector, with nearly the entire sector shifting to LEDs by 2025. This
sector’s conventional outdoor lighting technologies have relatively high first costs and thus LED
luminaires will rapidly become cost-competitive.

Page 10
Table 3.1 U.S. LED Forecast Results by Sector
As seen in Figure 3.2 below, in 2013 the installed base in lumen-hours was dominated by linear
fluorescent and HID lighting, both of which have high operating hours, high lumen output per
lamp, and large number of installations. However, in terms of installed base, LED lighting is
predicted to account for a majority of installations by 2022 and 88% of all lumen-hours being
produced for general illumination in 2030.
2013 2015 2020 2025 2030Cum ulative
(2013-2030)
LED M arket Share (% of lm -hr
sales)3% 11% 48% 72% 84%
-
Residential < 1% 3% 33% 71% 83% -
Com m ercial 2% 8% 42% 69% 82% -
Industrial < 1% 3% 26% 58% 87% -
Outdoor 9% 22% 75% 97% 99% -
Site Electricity Savings (TW h) 5 12 89 190 261 2,216
Residential < 1 2 18 42 61 487
Com m ercial 2 5 41 97 139 1,122
Industrial < 1 < 1 4 9 14 106
Outdoor 2 5 27 41 48 502
Source Energy Savings (TBtu) 56 141 1,010 2,166 2,980 25,266
Residential 7 28 200 483 696 5,554
Com m ercial 26 60 467 1,109 1,580 12,788
Industrial < 1 2 41 108 157 1,206
Outdoor 22 52 303 467 547 5,718
Site Electricity Savings (% ) < 1% 2% 15% 30% 40% 20%
Residential < 1% 2% 17% 39% 53% 25%
Com m ercial < 1% 2% 12% 27% 37% 18%
Industrial < 1% < 1% 10% 25% 35% 16%
Outdoor 2% 4% 21% 32% 36% 22%

Page 11
Figure 3.2 U.S. Lighting Service Forecast, 2013 to 2030
The following sections describe the major results of the forecast model for each of the lighting
submarkets.
Indoor Lighting
Residential, commercial, and industrial lighting employ many of the same lighting technologies
in their indoor lighting applications. There are many similarities between the commercial and
industrial sectors in terms of lighting technology and use trends, as lighting applications in these
sectors are characterized by long operating hours (often greater than 10 hours per day) and
higher lumen output requirements compared to the residential sector. Commercial and industrial
lighting consumers are typically facility managers who are highly concerned with the lifetime
costs of a lighting product. Therefore, technologies with high efficacy and long lifetime are
more popular in these sectors, despite higher initial costs. Because of this distinct preference,
both the commercial and industrial sectors are currently dominated by highly efficient and long
lifetime linear fluorescent and HID technologies, which are primarily used in the linear fixture
and low/high bay submarkets. Combined, the linear fixture and low/high bay submarkets
represent 85% and 88% of the 2013 general illumination energy consumption in the commercial
and industrial sectors, respectively.
LEDs are projected to only offer incremental improvement over linear fluorescent and HID
technologies in the near-term; however, with expected performance and price improvements,
LEDs hold great promise in the long-run for cutting energy consumption in the commercial and

Page 12
industrial sectors. Therefore, energy savings in the commercial sector, shown in Figure 3.3, is
projected to reach only 12% in 2020, but grow to 37% in 2030. Energy savings projections for
the industrial sector, shown in Figure 3.4, are similar.
Figure 3.3 Commercial Lighting Energy Consumption Forecast, 2013 to 2030

Page 13
Figure 3.4 Industrial Lighting Energy Consumption Forecast, 2013 to 2030
Residential lighting is used in single-family, multi-family, and mobile households, with the
majority provided by lamps and/or luminaires in the general service and directional submarkets.
Although residential lighting represents the largest number of installed lamps at approximately
5.8 billion in 2013, lamps in this sector are used for relatively few operating hours, averaging
less than two hours per day and providing roughly 3,400 teralumen-hours of lighting service
annually. Due to low lamp usage and limited lighting education, consumers in the residential
sector place a higher value on the price of a lighting product rather than its annual costs. The
residential sector as a whole is therefore less concerned with the efficacy and lifetime
performance of lighting products. Due to the high efficacy and increasing penetration of LED
products, as seen in Figure 3.5, the lighting market model predicts significant energy savings in
the residential sector, estimating a 53% decrease in energy consumption compared to the no-
LED scenario by 2030.

Page 14
Figure 3.5 Residential Lighting Energy Consumption Forecast, 2013 to 2030
3.1.1 General Service Submarket
The general service submarket includes standard incandescent A-type lamps, incandescent
halogen, CFLs, and LED replacement lamps. These omnidirectional lamps, are some of the most
widely recognized and, while the vast majority of these lamps are used in general service
applications, some, due to their low cost and popularity, are also found in downlight and track
lighting applications as discussed in Section 3.1.3, which covers the directional submarket.
Additionally, a small number of these GSLs are used in outdoor submarkets, discussed in Section
3.2.
Incandescent A-type lamps are still the most familiar to consumers, and in 2013 constitute the
majority of this submarket, however, their market share has dropped significantly in recent years.
This shift is largely due to the implementation of Energy Independence and Security Act of 2007
(EISA 2007) general service lamp standards. The maximum wattage standards, which began to
take effect on January 1, 2012, require a 25% efficiency increase for all general service lamps.
As a result, a significant number of CFLs as well as halogen lamps have begun to replace the
traditional incandescent lamps in many applications.13
13 EISA 2007 does not ban incandescent light bulbs, but its minimum efficiency standards are high enough that
incandescent lamps most commonly used by consumers today will not meet the requirements. This Act essentially
eliminates 40W, 60W, 75W, and 100W medium screw based incandescent light bulbs. More information can be
found at: http://www1.eere.energy.gov/buildings/appliance_standards/commercial/pdfs/eisa_2007.pdf

Page 15
LED replacement lamps in the general service submarket became available to consumers
between 2007 and 2009 at a typical cost over $50 per lamp, and struggled to match the efficiency
of incumbent CFLs. The high first cost and limited energy savings over CFLs has limited the
uptake of LED lighting in general service applications, but significant improvements have been
made in recent years. As a result, the lighting market model predicts that LEDs will be the
dominant technology in general service applications by 2020, having an overall market share,
shown in Table 3.2, of 55% across the three indoor sectors.
Figure 3.6 General Service Market Share (% of lm-hr sales) Forecast, 2013 to 2030
While the market share forecasts for the commercial and industrial sectors are quite similar, with
a quick uptake of LEDs following the final phase of EISA 2007 which kicked-in as of January of
0%
20%
40%
60%
80%
100% Commercial
0%
20%
40%
60%
80%
100% Industrial
0%
20%
40%
60%
80%
100%
Incandescent
Halogen
CFL
LED Lamp
0%
20%
40%
60%
80%
100% Residential
Page 16
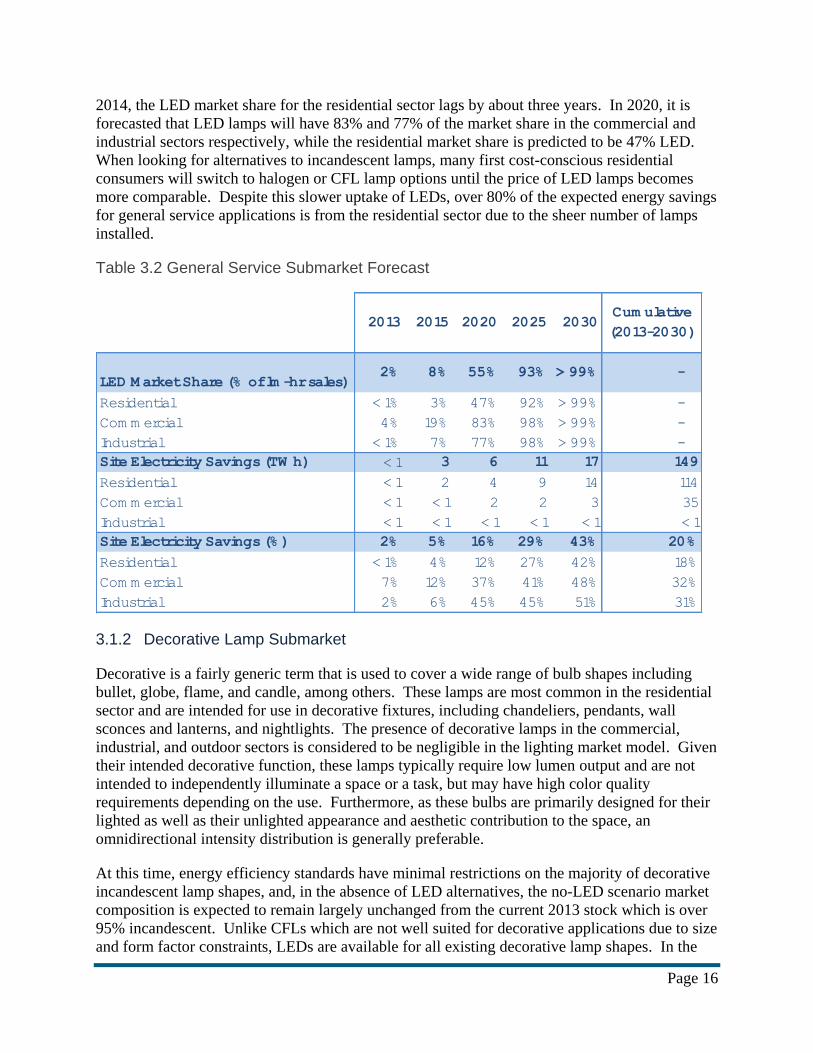
2014, the LED market share for the residential sector lags by about three years. In 2020, it is
forecasted that LED lamps will have 83% and 77% of the market share in the commercial and
industrial sectors respectively, while the residential market share is predicted to be 47% LED.
When looking for alternatives to incandescent lamps, many first cost-conscious residential
consumers will switch to halogen or CFL lamp options until the price of LED lamps becomes
more comparable. Despite this slower uptake of LEDs, over 80% of the expected energy savings
for general service applications is from the residential sector due to the sheer number of lamps
installed.
Table 3.2 General Service Submarket Forecast
3.1.2 Decorative Lamp Submarket
Decorative is a fairly generic term that is used to cover a wide range of bulb shapes including
bullet, globe, flame, and candle, among others. These lamps are most common in the residential
sector and are intended for use in decorative fixtures, including chandeliers, pendants, wall
sconces and lanterns, and nightlights. The presence of decorative lamps in the commercial,
industrial, and outdoor sectors is considered to be negligible in the lighting market model. Given
their intended decorative function, these lamps typically require low lumen output and are not
intended to independently illuminate a space or a task, but may have high color quality
requirements depending on the use. Furthermore, as these bulbs are primarily designed for their
lighted as well as their unlighted appearance and aesthetic contribution to the space, an
omnidirectional intensity distribution is generally preferable.
At this time, energy efficiency standards have minimal restrictions on the majority of decorative
incandescent lamp shapes, and, in the absence of LED alternatives, the no-LED scenario market
composition is expected to remain largely unchanged from the current 2013 stock which is over
95% incandescent. Unlike CFLs which are not well suited for decorative applications due to size
and form factor constraints, LEDs are available for all existing decorative lamp shapes. In the
2013 2015 2020 2025 2030Cum ulative
(2013-2030)
2% 8% 55% 93% > 99% -
< 1% 3% 47% 92% > 99% -
4% 19% 83% 98% > 99% -
< 1% 7% 77% 98% > 99% -
< 1 3 6 11 17 149
< 1 2 4 9 14 114
< 1 < 1 2 2 3 35
< 1 < 1 < 1 < 1 < 1 < 1
2% 5% 16% 29% 43% 20%
< 1% 4% 12% 27% 42% 18%
7% 12% 37% 41% 48% 32%
2% 6% 45% 45% 51% 31%
LED M arket Share (% of lm -hr sales)
Residential
Com m ercial
Industrial
Site Electricity Savings (TW h)
Residential
Com m ercial
Industrial
Site Electricity Savings (% )
Residential
Com m ercial
Industrial
Page 17
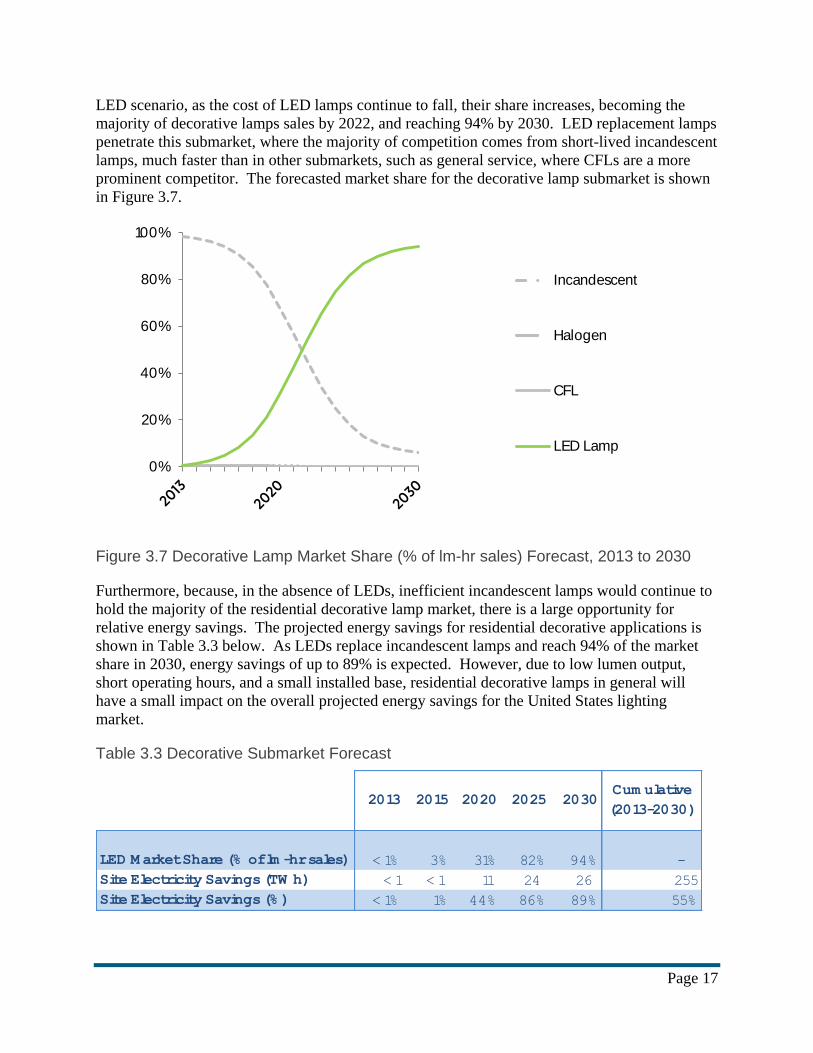
LED scenario, as the cost of LED lamps continue to fall, their share increases, becoming the
majority of decorative lamps sales by 2022, and reaching 94% by 2030. LED replacement lamps
penetrate this submarket, where the majority of competition comes from short-lived incandescent
lamps, much faster than in other submarkets, such as general service, where CFLs are a more
prominent competitor. The forecasted market share for the decorative lamp submarket is shown
in Figure 3.7.
Figure 3.7 Decorative Lamp Market Share (% of lm-hr sales) Forecast, 2013 to 2030
Furthermore, because, in the absence of LEDs, inefficient incandescent lamps would continue to
hold the majority of the residential decorative lamp market, there is a large opportunity for
relative energy savings. The projected energy savings for residential decorative applications is
shown in Table 3.3 below. As LEDs replace incandescent lamps and reach 94% of the market
share in 2030, energy savings of up to 89% is expected. However, due to low lumen output,
short operating hours, and a small installed base, residential decorative lamps in general will
have a small impact on the overall projected energy savings for the United States lighting
market.
Table 3.3 Decorative Submarket Forecast
0%
20%
40%
60%
80%
100%
Incandescent
Halogen
CFL
LED Lamp
0%
20%
40%
60%
80%
100%
2013 2015 2020 2025 2030Cum ulative
(2013-2030)
< 1% 3% 31% 82% 94% -
< 1 < 1 11 24 26 255
< 1% 1% 44% 86% 89% 55%
LED M arket Share (% of lm -hr sales)
Site Electricity Savings (TW h)
Site Electricity Savings (% )

Page 18
3.1.3 Directional Submarket
Directional lighting is typically provided by either large reflector lamps (BR, R, PAR shapes) or
smaller multifaceted reflector (MR) lamps, most commonly housed in track or downlight
fixtures.
Downlights are widely used for ambient lighting in both residential and commercial buildings.
These fixtures can be recessed or surface-mounted and have become popular because they are
inexpensive and can provide inconspicuous ambient lighting for most room types. Track lights
are also a popular fixture used for ambient lighting, but they are used for accent lighting in
households, retail displays, restaurants, museums, and office buildings as well. These light
fixtures are typically comprised of individual light fixtures, or track “heads”, attached to a
continuous metal mounting device that is, in turn, attached to a ceiling or wall, or hung via
suspension cables or rods. For both downlights and track lights using incandescent, halogen, and
compact fluorescent reflector lamps (e.g., PAR, BR, and R lamps), pin-based CFLs, as well as
LED lamps and luminaires are most commonly used. The model also considers omnidirectional
lamps that can be installed in the residential sector where consumers are most concerned with the
initial bulb price as opposed to lighting quality and lifecycle costs. While also installed in
downlight or track fixtures, MR lamps do not compete directly with the large reflector lamps
because they are most often operated at low voltage and their design is constrained by a small
form factor.14 The most common MR lamp, the MR16, is particularly optimal for jewelry and
other display applications due to their high CRI and well-controlled, high-intensity beam
(Rensselaer Polytechnic Institute, 2002). Halogen technology currently dominates the market for
MR lamps, and similar to the decorative lamp submarket, CFLs are not well suited for MR lamps
due to size and form factor constraints.
The lighting market model assumes that both LED lamps and luminaires compete for market
penetration in the directional submarket for downlights, track lights, and MR lamps. Consumers
may put LED replacement lamps into existing downlight and track light fixtures or integrated
directional LED luminaires may be used to replace these fixtures entirely.
For the commercial and residential settings, where directional applications make-up about 3%
and 16%, respectively, of the total lighting service, the lighting market model separates
directional submarket into large reflector downlights, large reflector track lights, and MR lamps.
This is because consumer preference of incumbent technologies, which affects LED market
penetration and resulting energy savings, used in downlighting and track lighting differs.
However, due to limited incumbent technology options for MR lamps, the differences between
market share projections for MR lamps in track and downlighting are negligible. The market
share projections for large reflector downlights, large reflector track lights, and MR lamps are
shown in Figure 3.8, Figure 3.9, and Figure 3.10, respectively.
14 Most MR16 lamps are operated using voltages lower than 120 volts, typically 12 volts; however, GU10 options at
120 volts are also available.

Page 19
Figure 3.8 Downlight Applications Market Share (% of lm-hr sales) Forecast, 2013 to 2030
0%
20%
40%
60%
80%
100%Commercial - Downlight
0%
20%
40%
60%
80%
100%Residential - Downlight
0%
20%
40%
60%
80%
Incandescent Incandescent Reflector Halogen
Halogen Reflector CFL CFL Reflector
CFL Pin LED Lamp LED Luminaire

Page 20
Figure 3.9 Track Applications Market Share (% of lm-hr sales) Forecast, 2013 to 2030
Figure 3.10 MR16 Applications Market Share (% of lm-hr sales) Forecast, 2013 to 2030
0%
20%
40%
60%
80%
100%Commercial - Track
0%
20%
40%
60%
80%
100%Residential - Track
0%
20%
40%
60%
80%
Incandescent Inc Reflector Halogen
Halogen Reflector CFL CFL Reflector
LED Lamp LED Luminaire
0%
20%
40%
60%
80%
100%Commercial - MR
0%
20%
40%
60%
80%
100%Residential - MR
0%
20%
40%
60%
80%
100%
Halogen Reflector LED Lamp LED Luminaire

Page 21
In the industrial sector, due to the limited use of directional lighting (less than 1% of industrial
lighting service), directional lighting is not subdivided. The market share projection for
industrial directional lighting is shown in Figure 3.11.
Figure 3.11 Industrial Directional Applications Market Share (% of lm-hr sales) Forecast, 2013 to 2030
LEDs have already established themselves as a significant competitor in directional applications,
particularly in the industrial and commercial sectors. In the commercial sector, for 2013, LEDs
represent nearly 2% of downlight lumen-hour sales, over 4% of track lighting, and 12% of MR16
lamps. Similarly in the industrial sector, LEDs in the directional submarket reach nearly over
4% of 2013 lumen-hour sales. While somewhat slower, in the residential sector, LED lamps and
luminaires also achieve non-negligible penetration. In 2013, LEDs lumen-hour sales represent
1% of downlights, 1% of track lights, and nearly 2% of all MR16 lamps in the residential sector.
As seen in Table 3.4, due to the high efficacy and increasing penetration of LED lighting
products, energy savings are already occurring in 2013 and result in a 3% reduction in energy
consumption compared to the no-LED scenario. The lighting market model predicts substantial
energy savings in all sectors, with an estimated 23% decrease from the no-LED scenario by 2020
and 55% by 2030. The cumulative savings amount to 321 terawatt-hours of electricity over the
entire analysis period from 2013 to 2030.
0%
20%
40%
60%
80%
201320162019202220252028
Inc Reflector
Halogen Reflector
CFL Reflector
LED Lamp
LED Luminaire
0%
20%
40%
60%
80%
100%Industrial - Directional

Page 22
Table 3.4 Directional Submarket Forecast
3.1.4 Linear Fixture Submarket
For the linear fixture submarket, the lighting market model considers T12, T8, and T5 linear and
U-shaped fluorescent lamps that are less than, greater than, and equal to four feet in length. Both
LED lamps and luminaires are assumed to compete in the linear fixture submarket. In the
lighting market model, this submarket includes recessed troffers, surface-mounted fixtures,
suspended fixtures, and other direct-lighting fixtures that customarily house a linear fluorescent
or U-shaped fluorescent lamp(s) and ballast system. Low and high bay fixtures are evaluated
separately and the forecast results are presented in the following Section 3.1.5.
These fluorescent fixture systems are widely utilized for commercial and industrial
establishments because they offer a low cost, highly efficient and long lifetime lighting source.
As a result, these fluorescent fixture systems represent nearly half of all lighting service in the
United States across all sectors. Because of the significant lighting service required by these
applications, the penetration of LED lighting has the potential to greatly reduce total energy
consumption. However, because modern linear fluorescent systems are such tough competitors
in terms of efficacy and initial and lifecycle costs, the penetration of LEDs, and hence the
forecasted energy savings, are much lower compared to other applications.
Currently, fluorescent lighting dominates these applications to the point that it is basically the
only lighting technology used. When considering the different fluorescent tube diameters (i.e.,
T12, T8 and T5), there has been a continuing trend away from T12 lamps due to the emergence
of higher efficiency T8 and T5 lamp options. The transition to these higher efficiency
fluorescent lamps has also been propelled by energy efficiency standards (see Appendix D.1).
For example, in 2001, T12 systems constituted approximately 72% of the linear fluorescent
installed base in the commercial sector and 67% in the industrial sector (Navigant, 2002),
whereas in 2013, T12 systems constituted only 7% and 6%, respectively. By 2017, T12 lamps
2013 2015 2020 2025 2030Cum ulative
(2013-2030)
4% 8% 26% 55% 74% -
1% 3% 13% 35% 54% -
5% 13% 44% 77% 92% -
4% 10% 37% 72% 90% -
2 4 14 25 36 321
< 1 < 1 2 7 16 90
2 3 12 18 20 231
< 1 < 1 < 1 < 1 < 1 < 1
3% 6% 23% 40% 55% 29%
< 1% 1% 5% 21% 44% 15%
6% 13% 45% 64% 69% 46%
< 1% < 1% 39% 64% 70% 40%
Residential
Com m ercial
Industrial
LED M arket Share (% of lm -hr sales)
Industrial
Site Electricity Savings (% )
Residential
Site Electricity Savings (TW h)
Residential
Com m ercial
Com m ercial
Industrial

Page 23
sold on a lumen-hour basis is forecasted to drop to less than one percent of the total linear fixture
submarket. T5 lamps and LED luminaires are predicted to absorb most of this decline,
increasing to 22% and 24% of total sales respectively. In the no-LED scenario, commercial T5
lamp systems would be expected to continue gaining market share, surpassing that of T8 lamp
and ballast systems by 2024. Figure 3.12 shows that the linear fixture submarket will be strongly
affected by the availability of high-performance LED lighting products in all sectors.
Figure 3.12 Linear Fixture Market Share (% of lm-hr sales) Forecast, 2013 to 2030
0%
20%
40%
60%
80%
100%Commercial
0%
20%
40%
60%
80%
100%Industrial
0%
20%
40%
60%
80%
100%Residential
0%
20%
40%
60%
80%T12
T8
T5
LED Lamp
LED Luminaire

Page 24
While fluorescent systems (lamp and ballast) currently have efficacies averaging between 40 and
90 lm/W, by 2016, both LED lamps and luminaires are expected to consistently exceed all
fluorescent lighting systems in efficacy. The forecasted takeover of LED technology in this
submarket can largely be attributed to LED luminaires which are expected to have a rapid
increase in average efficacy to over 180 lumens per watt by 2030 – or about double that of
currently available fluorescent T5 lamp and ballast systems. Consequently, the forecast model
predicts LEDs will contribute 45% of commercial linear fixture sales by 2020 and will accelerate
to 84% market share by 2030. The industrial sector, although significantly smaller, mimics the
trends seen in the commercial sector. The lighting market model estimates that LED lamps and
luminaires will represent 35% of industrial linear fixture sales in 2020, and will grow quickly to
78% by 2030. In the residential sector the take-over of LED lamps and luminaires is slower
compared to the commercial and industrial sectors which place a higher value on lifecycle costs.
Though still successfully capturing 68% of the market by 2030, LEDs make the slowest market
share gains in the residential sector. Table 3.5 shows that the increasing adoption of LED
lighting should achieve 36% site electricity savings in 2030 in the linear fixture submarket across
all sectors.
Table 3.5 Linear Fixture Submarket Forecast
3.1.5 Low/High Bay Submarket
Low/high bay fixtures are commonly used in both commercial and industrial applications to
illuminate large open indoor spaces for ceiling heights of 20 feet or more, as are typical in big-
box retail, warehouses, and manufacturing facilities. Because of the large area and lofted
ceilings, these spaces require high lumen-output luminaires often above 15,000 lumens per
fixture to deliver the lighting effectively over long distances. This market was historically
dominated by HID lamps, though fluorescent lamps, particularly high output T5 lamps, have
become a major player due to their superior lumen maintenance and enhanced control options.
2013 2015 2020 2025 2030Cum ulative
(2013-2030)
2% 8% 44% 70% 83% -
< 1% 3% 24% 58% 68% -
2% 8% 45% 71% 84% -
1% 5% 35% 62% 78% -
< 1 < 1 22 62 94 696
< 1 < 1 < 1 < 1 1 8
< 1 < 1 20 58 86 642
< 1 < 1 1 4 6 46
< 1% < 1% 9% 25% 36% 16%
< 1% < 1% 1% 7% 15% 5%
< 1% < 1% 9% 25% 36% 16%
< 1% < 1% 9% 25% 37% 16%
Residential
LED M arket Share (% of lm -hr sales)
Residential
Com m ercial
Industrial
Site Electricity Savings (TW h)
Com m ercial
Industrial
Com m ercial
Industrial
Site Electricity Savings (% )
Residential

Page 25
Only in the past few years have technological and cost improvements allowed LEDs to penetrate
the market in significant quantities. Early generation high-bay LED luminaires lacked the lumen
output to compete in this market. By 2013, the DOE’s LED Lighting Facts had over 100 listed
high-bay luminaire products that emitted over 15,000 lumens, and manufacturers now offer
products with output exceeding 25,000 lumens at efficacies over 100 lm/W.15
Low and high bay lighting has become increasingly popular, likely due to the growth in large
commercial retail facilities such as Home Depot, Costco, and other big-box retail stores. In 2013
the low/high bay submarket represents a quarter of all lighting service provided to the
commercial sector and about half for the industrial sector, making this a key application for LED
impact on energy savings. As seen in Figure 3.13, fluorescent lamps made up the majority of the
2013 low/high bay sales for both the commercial and industrial sectors, at 56% and 85%
fluorescent respectively. Overall in both the commercial and industrial sector, LED luminaires
held less than 1% of the 2013 market share with the remainder being HID.
Figure 3.13 Low/High Bay Market Share (% of lm-hr sales) Forecast, 2013 to 2030
15 A full list of current LED Lighting Facts products can be found at: http://www.lightingfacts.com/
0%
20%
40%
60%
80%
100%Commercial
0%
20%
40%
60%
80%
100%Industrial
0%
20%
40%
60%
80%
T12 T8 T5 Metal Halide HPS LED Luminaire

Page 26
Table 3.6 shows that LED luminaires are projected to represent 4% of commercial low/high bay
sales and about 9% in industrial markets in 2015. This climbs to 35% and 41% in the
commercial and industrial sectors respectively by 2020. This penetration of LED luminaires will
result in nearly a 6% reduction in annual energy consumption from the no-LED scenario in 2020
and 28% in 2030.
Table 3.6 Low/High Bay Submarket Forecast
Outdoor Lighting Submarkets
The general illumination submarkets in the outdoor sector consist of street and roadway, parking,
and exterior building lighting. These lighting systems serve multiple purposes, such as providing
proper illumination for pedestrian and automotive traffic, creating a sense of personal security,
and attracting attention to business and spaces. HID and linear fluorescent lamps have
historically been the predominant lighting technology used in the outdoor sector, but because of
the importance of durability and lifetime, LEDs are a particularly attractive option. As presented
in Figure 3.14, the lighting market model predicts that LEDs will reduce the sector’s energy
consumption by 21% in 2020 and 36% in 2030 compared to the no-LED scenario.
2013 2015 2020 2025 2030Cum ulative
(2013-2030)
< 1% 5% 36% 63% 73% -
< 1% 4% 35% 63% 74% -
2% 9% 41% 60% 69% -
< 1 < 1 5 18 27 194
< 1 < 1 4 14 23 155
< 1 < 1 1 3 5 39
< 1% < 1% 6% 19% 28% 12%
< 1% < 1% 5% 18% 28% 11%
< 1% < 1% 9% 21% 29% 14%
Industrial
Site Electricity Savings (TW h)
Com m ercial
Industrial
Site Electricity Savings (% )
Com m ercial
Industrial
Com m ercial
LED M arket Share (% of lm -hr sales)

Page 27
Figure 3.14 Outdoor Lighting Energy Consumption Forecast, 2013 to 2030
3.2.1 Street/Roadway Submarket
LEDs are particularly advantageous in the street and roadway lighting submarket because they
are excellent directional light sources, durable, and exhibit long lifetimes. Because of these
advantages, many local jurisdictions have initiated projects to completely transition their lighting
in these applications to LEDs. For example, the City of Los Angeles has completed a four-year,
citywide street lighting replacement program and has installed over 140,000 LED streetlights
(U.S. DOE, 2014). By the end of 2013, the total installed base of U.S. outdoor area and roadway
LEDs exceeded 3.3 million (Navigant, 2014).
In 2013, in this submarket LEDs already held an impressive 14% market share, while high
pressure sodium (HPS) and metal halide made up the majority of the remainder. The lighting
market model projects LED market share to increase rapidly, reaching 50% of all lumen-hour
sales as early as 2017, as shown in Figure 3.15.
0.0
0.2
0.4
0.6
0.8
1.0
1.2
1.4
1.6
2013 2030
So
urc
e E
nerg
y C
onsu
mp
tio
n (
quad
s)
Street/ Roadway Parking Lot Garage
Building Exterior Other No-LED Scenario
21% Savings in 2020
36% Savings in 2030
2020

Page 28
Figure 3.15 Street and Roadway Market Share (% of lm-hr sales) Forecast, 2013 to 2030
The lighting market model projects that nearly 100% of the street and roadway lighting installed
base in 2030 will be LED. This almost complete saturation with LED technologies will offer
nearly 30% site electricity savings, which is impressive considering efficient HID technologies
are being displaced by LEDs. Detail on the predictions for street and roadway submarket are
shown below in Table 3.7
Table 3.7 Street and Roadway Submarket Forecast
3.2.2 Parking Submarket
In this analysis, the parking lighting submarket has been divided into parking lots and covered
garages, and does not consider street-side parking as those areas are covered in the street and
roadway submarket discussed in Section 3.2.1.
The lighting technologies used for parking lots closely matches the technologies used for
streetlighting, as these applications both have similar lighting requirements. Despite having
similar application requirements, adoption of LED luminaires in lot applications lags behind the
adoption of LED streetlights, holding 7% of the lot market share in 2013 (compared to 14% for
0%
20%
40%
60%
80%
100%
Metal Halide
HPS
Fluorescent
Other
LED Luminaire
0%
20%
40%
60%
80%
100%
2013 2015 2020 2025 2030Cum ulative
(2013-2030)
14% 31% 83% 98% 99% -
< 1 1 7 11 14 137
1% 2% 14% 24% 28% 16%Site Electricity Savings (% )
Site Electricity Savings (TW h)
LED M arket Share (% of lm -hr sales)

Page 29
street/roadway). This difference is likely because LED streetlight momentum has come from
municipalities embarking on city-wide LED upgrades. Sales in the parking lot submarket are
currently dominated by metal halide, which represents 81% of the market share in 2013, while
HPS were approximately 12% of the total market.
Parking garage structures, on the other hand, are unique in the outdoor sector because lighting
fixtures are well protected from the elements and mounting height is generally limited by low
ceilings. While HID lamps are used for lighting parking garage structures, the low-mounting
heights of lighting fixtures require a large number of fixtures in order to meet desired
illumination distributions. These conditions favor linear fluorescent fixtures, which held 43%
market share of lumen-hours sales in 2013, although metal halide and HPS are also prominent
contenders.
By comparing the market share forecasts for lot and garage, shown in Figure 3.16, these
differences in incumbent technology preferences become clear. Additionally, LED lamps
compete for market share in garage lighting, but not lot lighting. This is a result of the
opportunity to replace linear fluorescent lamps, however the lighting market model projects that
it is more likely that these linear fluorescent fixtures in parking garage structures will be replaced
with LED luminaires.
Figure 3.16 Parking Market Share (% of lm-hr sales) Forecast, 2013 to 2030
0%
20%
40%
60%
80%
100% Parking Lot
0%
20%
40%
60%
80%
100% Parking Garage
0%
20%
40%
60%
80%
100%
Halogen Metal Halide HPS Fluorescent
Other LED Lamp LED Luminaire
Page 30
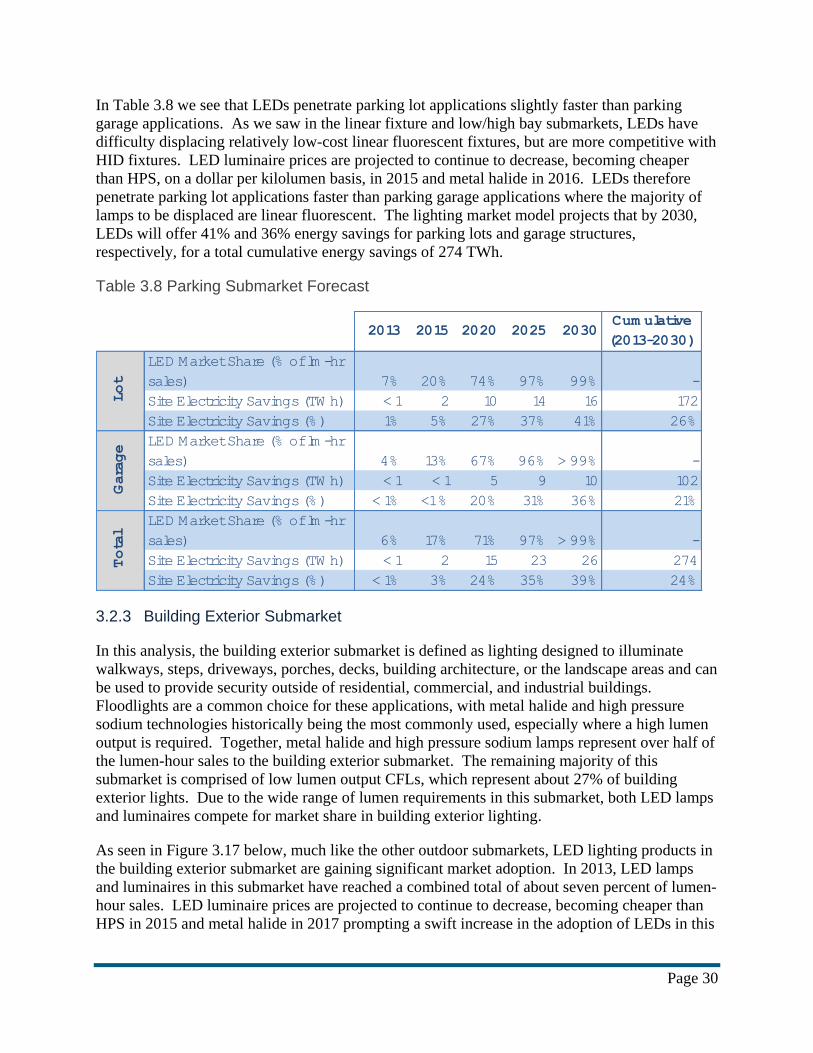
In Table 3.8 we see that LEDs penetrate parking lot applications slightly faster than parking
garage applications. As we saw in the linear fixture and low/high bay submarkets, LEDs have
difficulty displacing relatively low-cost linear fluorescent fixtures, but are more competitive with
HID fixtures. LED luminaire prices are projected to continue to decrease, becoming cheaper
than HPS, on a dollar per kilolumen basis, in 2015 and metal halide in 2016. LEDs therefore
penetrate parking lot applications faster than parking garage applications where the majority of
lamps to be displaced are linear fluorescent. The lighting market model projects that by 2030,
LEDs will offer 41% and 36% energy savings for parking lots and garage structures,
respectively, for a total cumulative energy savings of 274 TWh.
Table 3.8 Parking Submarket Forecast
3.2.3 Building Exterior Submarket
In this analysis, the building exterior submarket is defined as lighting designed to illuminate
walkways, steps, driveways, porches, decks, building architecture, or the landscape areas and can
be used to provide security outside of residential, commercial, and industrial buildings.
Floodlights are a common choice for these applications, with metal halide and high pressure
sodium technologies historically being the most commonly used, especially where a high lumen
output is required. Together, metal halide and high pressure sodium lamps represent over half of
the lumen-hour sales to the building exterior submarket. The remaining majority of this
submarket is comprised of low lumen output CFLs, which represent about 27% of building
exterior lights. Due to the wide range of lumen requirements in this submarket, both LED lamps
and luminaires compete for market share in building exterior lighting.
As seen in Figure 3.17 below, much like the other outdoor submarkets, LED lighting products in
the building exterior submarket are gaining significant market adoption. In 2013, LED lamps
and luminaires in this submarket have reached a combined total of about seven percent of lumen-
hour sales. LED luminaire prices are projected to continue to decrease, becoming cheaper than
HPS in 2015 and metal halide in 2017 prompting a swift increase in the adoption of LEDs in this
2013 2015 2020 2025 2030Cum ulative
(2013-2030)
LED Market Share (% of lm -hr
sales) 7% 20% 74% 97% 99% -
Site Electricity Savings (TW h) < 1 2 10 14 16 172
Site Electricity Savings (%) 1% 5% 27% 37% 41% 26%
LED Market Share (% of lm -hr
sales) 4% 13% 67% 96% > 99% -
Site Electricity Savings (TW h) < 1 < 1 5 9 10 102
Site Electricity Savings (%) < 1% <1 % 20% 31% 36% 21%
LED Market Share (% of lm -hr
sales) 6% 17% 71% 97% > 99% -
Site Electricity Savings (TW h) < 1 2 15 23 26 274
Site Electricity Savings (%) < 1% 3% 24% 35% 39% 24%
Total
Lot
Garage

Page 31
submarket. Combined the penetration of LED lamps and luminaires is forecasted to grow near
exponentially to 71% in 2020 and 99% by 2030.
Figure 3.17 Building Exterior Market Share (% of lm-hr sales) Forecast, 2013 to 2030
Table 3.9 conveys how the projected rapid adoption of LED lighting products will result in
significant energy savings for the building exterior submarket. The lighting market model
forecasts that by 2030, LED lamps and luminaires combined will achieve a 50% energy savings
for this submarket compared to the no-LED scenario. The cumulative savings amount to 74
terawatt-hours of electricity over the entire analysis period from 2013 to 2030.
Table 3.9 Building Exterior Submarket Forecast
Forecast Model Comparison
Below the results of this forecast are compared to six other forecast analyses to provide greater
context. Included in the comparison set are the 2010 and 2012 iterations of the Energy Savings
Forecast of Solid-State Lighting (SSL) in General Illumination Applications forecast analyses.
Table 3.10 below lists these forecasts in decreasing order of projected LED market penetration in
0%
20%
40%
60%
80%
100%Incandescent
Halogen
CFL
Fluorescent
Metal Halide
Mercury Vapor
HPS
LED Lamp
LED Luminaire0%
20%
40%
60%
80%
100%
2013 2015 2020 2025 2030Cum ulative
(2013-2030)
7% 17% 71% 97% 99% -
1 2 4 5 6 74
9% 17% 39% 47% 50% 37%
LED M arket Share (% of lm -hr sales)
Site Electricity Savings (TW h)
Site Electricity Savings (% )

Page 32
2020. These forecasts vary in methodology, regions covered (i.e. U.S. market, global market),
and units (i.e. sales by units, sales by value). Nonetheless, each presents a calculated impression
of the importance of LEDs to the general lighting market in 2020.
Table 3.10 Forecast Model – LED Market Share Comparison
Metric Region 2020
McKinsey, 2012 %units World 57%
IHS Research, 2011 %value World 50%
DOE, 2014 %lumen-hours United States 48%
McKinsey, 2011 %units World 46%
Samsung Electronics, 2014 %units World 42%
DOE, 2012 %lumen-hours United States 36%
DOE, 2010 %lumen-hours United States 21%
The results of this forecast model are generally consistent with those of other studies. All of the
analyses conclude that LED lighting will have tremendous growth over the remainder of this
decade, and roughly comprise 50% of all lighting sales by 2020. Though it is not presented in
the above Table 3.10, most studies expect LEDs to continue their growth, with some models
predicting 2030 market share as high as 90%.
An interesting observation that can be gleaned from Table 3.10 is that all other things being
equal, generally the more recent a forecast is, the more optimistic its anticipated market share.
This is witnessed in the DOE reports as well as the McKinsey analyses. This report is the first of
the DOE SSL Program’s forecast analyses that have calibrated the U.S. lighting market model
using LED sales and shipment data provided by manufacturers, distributors, retailers as well as
industry associations. This track record makes it possible to calibrate the lighting market model
outputs for future years based on the actual pattern by which LEDs have gained market share
thus far, effectively improving the accuracy of the predictions. The calibration to LED sales and
shipment data indicated that market penetration is higher and moving more rapid than was
estimated in past iterations of the U.S. lighting market model, and thus this is properly reflected
in this 2014 report.

Page 33
4 Sensitivity Analysis
There are multiple projections – price and efficacy being among the most influential – that were
used as inputs in the lighting market model. For each of these projections the best-available
resources in concert with manufacturer and industry expertise were utilized to help ensure the
results discussed in Section 3 represent the best estimate for expected future LED penetration
and energy savings. However, as with any forward-looking analysis, there are always elements
of uncertainty.
The sensitivity analysis provided online allows users to examine how variations in the model’s
inputs affect the energy savings results presented in this study. Four inputs may be adjusted, as
depicted in Table 4.1, allowing users to examine a wide variety of scenarios. Control over these
inputs is provided as they were found to be the most influential on results. Many other inputs
with inherent uncertainties, such as the projected price of electricity, are used in the lighting
market model, but varying these inputs (within a reasonable range) did not greatly affect the
results and thus they may not be manipulated in the online model.
Table 4.1 Adjustable Sensitivity Inputs for Online Lighting Market Model Tool
LED Efficacy Improvement Controls Growth Due to LEDs
Low: LED efficacy improves 30% slower than current projection.
Reference: LED efficacy improves based on current projection.
High: LED efficacy improves 30% faster than current projection.
DOE Goal: LED efficacy improves such that it meets 2014 MYPP goals (U.S. DOE, 2014).
Reference: Operating hours for all lighting does not change.
Medium: Operating hours for LEDs linearly decrease to a level that is 15% less than reference operating hours by 2030.
High: Operating hours for LEDs linearly decrease to a level that is 30% less than reference operating hours by 2030.
LED Price Decline Renovation Rate
Low: LED price decline quickens by 30% compared to current projection.
Reference: LED price declines based on current projection.
High: LED price decline slows by 30% compared to current projection.
DOE Goal: LED price declines such that it meets 2014 MYPP goals (U.S. DOE, 2014).
Low: 0% lighting turnover per year due to renovation, upgrades or retrofit.
Reference: 5% lighting turnover per year due to renovation, upgrades or retrofit.
High: 15% lighting turnover per year due to renovation, upgrades or retrofit.
One scenario, that is particularly important to the DOE SSL Program, is highlighted below in
Figure 4.1. This scenario examines the energy savings impact if DOE’s goals for LED price and
Readers are invited to test the DOE SSL Program’s lighting market model for themselves. An online version is provided at http://energy.gov/eere/ssl/led-lighting-forecast. At this site one can examine a number of sensitivity scenarios to better understand how changes in inputs affect the forecasted LED penetration and energy savings. The following section of this report provides a brief snapshot of this sensitivity analysis.

Page 34
efficacy, provided in the 2014 MYPP, are realized. This scenario is intentionally ambitious as it
illustrates a case where the DOE SSL Program’s goals are representative of all LED lighting
products entering the United State light market. However, it indicates how aggressive
investment in LED technology has the potential to greatly impact our nation’s energy footprint.
If the DOE’s goals are realized, LEDs will reach a market share of 68% of lumen-hour sales in
2020 and over 90% in 2030. The total annual general illumination lighting sector energy
consumption in 2030 would decrease by 60% to 265 TWh – this equates to over an additional
130 TWh in energy savings compare to the model’s reference scenario. While the cumulative
energy savings during the analysis period, from 2013 to 2030, over the no-LED scenario would
increase to nearly 3900 TWh or 40 quads – equal to over $380 billion in avoided electricity
costs. This DOE goal’s scenario shows the significant increase in energy savings that could be
captured through increased investment of SSL technology.
Figure 4.1 Forecasted LED Energy Savings if DOE SSL Program Goals are Realized
2013 2015 2020 20301
96 130 200 230
17$ 10$ 5$ 2$
44$ 34$ 20$ 10$
1. 2030 values for LED lam p and lum inaire price ($/klm ) are not provided in the 2014 MYPP
and have been projected to 2030 base on prior year goals.
DOE SSL Program Goals
LED Efficacy (lm /W )
LED Lam p Price ($/klm )
LED Lum inaires Price ($/klm )
0
1
2
3
4
5
6
7
8
2013 2030
So
urc
e E
nerg
y C
onsu
mp
tio
n (
quad
s)
Residential Commercial Industrial Outdoor
2020
60% ENERGY
SAVINGS
Reaching the DOE
goals can increase
energy savings by
an additional 20%.

Page 35
(This page intentionally left blank)

Page 36
Appendix A Submarket Classifications and Lighting Inventory
This study divides the U.S. lighting market into four primary lighting sectors: residential,
commercial, industrial, and outdoor. The residential, commercial, and industrial sectors
correspond to Energy Information Administration’s (EIA’s) building category designations,
while the outdoor sector contains major stationary lighting sources such as street and roadway
lighting as well as those that are associated with exterior building applications (i.e., parking lot
lights and exterior wall packs). The study models and reports results separately for each sector
in order to capture major differences in inventory and patterns of usage arising from distinct
lighting needs and decision-makers.
In order to model the competition between lighting technologies within U.S. lighting market, the
current model examines eight submarkets, which are based on common general illumination
applications. This is a significant improvement from the previous model iteration, where
competition between lighting technologies was simplified by only examining five technology-
based submarkets: GSL–MSB, reflector–screw-base, linear fluorescent, HID, and miscellaneous.
Thanks in part to a transition to the Analytica® software package, the U.S. lighting market
model is now capable of processing a more complex multi-dimensional analysis, as well as a
more sophisticated market share calculations, where the submarkets are application-based rather
than grouped by lighting technology. This improvement to the lighting market model enables a
single lighting technology, such as linear fluorescent lamps, to compete in multiple submarkets
(i.e. linear fixtures, low/high bay, and parking) compared to the previous model iteration which
grouped all linear fluorescent lamps into a single submarket regardless of application.
As in the previous model iteration, the lighting technologies competing within each submarket
are derived from the U.S. Lighting Market Characterization (LMC) report (Navigant, 2012). In
the LMC, 28 lighting technologies were considered:
Incandescent: general service–A-type, general service–decorative, reflector,
miscellaneous
Halogen: general service, reflector, low voltage display, miscellaneous
Compact fluorescent: general service–screw-base, general service–pin-base, reflector,
miscellaneous
Linear fluorescent: T5, T12 less than 4ft, T12 4ft, T12 greater than 4ft, T12 U-
shaped, T8 less than 4ft, T8 4ft, T8 greater than 4ft, T8 U-shaped lamps,
miscellaneous
High-intensity discharge: mercury vapor, metal halide, high pressure sodium, low
pressure sodium
Other: LED lamp, miscellaneous
This analysis reduces that count to 21 by combining linear fluorescent categories, less than 4ft,
4ft, greater than 4ft, and U-shaped, for both T8 and T12. Furthermore, the “other miscellaneous”
category in the LMC, and all lamps in this category, are excluded from this analysis due to great
uncertainty regarding these lamp types and their characteristics. The excluded miscellaneous
lamps account for less than 6 terawatt-hours of annual energy use, or less than one percent, of

Page 37
lighting energy consumption in 2013; thus, the impact of their exclusion is minimal. The LMC
was used to develop the 2010 installed base for conventional technologies in the remaining
product categories.
The LMC is used as the starting point for the lighting technologies examined in the U.S. lighting
market model because it provides detailed lamp counts and provides the inventory foundation for
this study. However, it is important to note that the base year for the LMC lighting inventory is
2010, while the base year for this study is 2013. In order to appropriately update the LMC
inventory estimates to 2013, new data was collected through interviews with manufacturers,
distributor, retailers, as well as industry associations.
However, because the LMC grouped all LEDs into a single category and included LED exit
signs, which are not considered a general illumination white-light source, LMC data was not
used to develop the 2010 installed base of LEDs. Instead the LED installed base was estimated
from Navigant’s 2013 SSL Adoption analysis, which collected LED sales data for the years
2010, 2012, and 2013 from manufacturers, retailers, industry experts, as well as the shipment
data from National Electrical Manufacturers Association, ENERGY STAR, and lighting
distributors.

Page 38
Appendix B LED Lamps and Luminaires Product Descriptions
Table B.1 Description of the LED Lamp and Luminaire Groupings in Each Submarket
SUBMARKET LIGHTING PRODUCT DESCRIPTION
A-type Lamps All A-type lamp shapes with a medium-screw base.
Decorative Lamps All bullet, candle, flare, globe, and any other decorative lamp shapes.
Directional Lamps and Luminaires
Includes reflector, BR, MR, and PAR lamps as well as recessed and surfaced mounted downlights and indoor accent, track, and spot light luminaires.
Linear Fixtures Lamps and Luminaires All troffer, panel, suspended, and pendant luminaires, as well as, LED linear replacement lamps.
Low/High Bay Luminaires Includes LED low and high bay luminaires.
Parking Lamps and Luminaires
Includes LED lamps and luminaires for attached and stand-alone parking garages, as well as parking lot applications. LED lamps are only considered viable in parking garage applications.
Streetlights/Roadway Luminaires Includes LED luminaires installed in street and roadway applications.
Building Exterior Lamps and Luminaires Includes all lamps fixtures installed in façade, spot, architectural, flood, wallpack, step/path applications.
Other Lamps and Luminaires Includes all other special use lighting applications such as tunnel, signage, wall-wash, and cove.

Page 39
Appendix C Annual Lumen Demand and Market Turnover
Appendix C.1 National Lumen Demand Projection
After calculating the lighting service, or lumen-hour, demand in 2013 by sector and submarket,
the next step was to project forward the lighting demand for each year through 2030. To do this,
the 2013 lumen-hour demand was divided by the cumulative national floor space for each sector
to determine a lighting demand density in lumen-hours per square foot of building space. Then,
assumed floor space growth rates were applied to these densities to project total lighting demand
for each sector from 2013 to 2030, holding lighting demand density (kilolumen-hours per square
foot) constant. In the residential sector, the average lighting demand density in 2013 was
approximately 16.3 kilolumen-hours per square foot, while density in the commercial sector was
more than fifteen times higher, at 304 kilolumen-hours per square foot. The commercial lighting
service was higher due to the longer operating hours and higher levels of illumination in
commercial floor space.
Annual Energy Outlook (AEO) 2014 provides annual average growth forecasts of floor space in
the residential and commercial sectors, which are used to project increases in lumen demand
moving forward (U.S. EIA, 2014). Projections suggest that residential floor space will increase
by an average of 1.31% per annum over the 20-year analysis period, and the commercial sector
floor space will increase by an average of 1.00% per annum. AEO 2014 does not provide a
growth forecasts for the industrial or outdoor sectors. Because the outdoor sector includes
buildings-related outdoor lighting, it was assumed that its growth rate would match that of the
commercial sector. For the industrial sector, the AEO 2014 annual projections for
manufacturing employment growth were used as a proxy for annual average floor space growth
estimates of floor space.
In summary, the average annual floor space growth rates used in the analysis, representing the
annual change in lumen-hour demand between 2013 and 2030, are:
Residential: 1.31% growth
Commercial: 1.00% growth
Industrial: 0.24% growth
Outdoor: 1.00% growth
Appendix C.2 Annual Available Market
After estimating the national annual lumen-hour demand, the next step is to determine how much
of the lighting market is replaced or added each year. This turnover and growth represents the
available market opportunity for LED products to compete with conventional lighting
technologies within each of the submarkets. To estimate this, the lighting market model
evaluates three events that determine the available lumen-hours on the lighting market each year:
New construction. New fixtures installed each year due to floor space growth in each
sector, determined by growth or retirement projections and the apportionment of lighting
intensity per unit floor space. For the lumen-hours of service in this category, the costs
considered for conventional technologies include the costs of the lamp, fixture, and
Page 40
ballast (if appropriate). For LED lamp products, the costs considered include the costs of
lamp and fixture, while LED luminaire products include only the cost of the complete
luminaire system. Luminaires are defined as fully integrated lighting products designed
to replace an entire fixture (not just the lamp). An example of an LED luminaire would
be a fully integrated 2’ X 2’ troffer replacement.
Renovations. Lamps (and ballasts, if appropriate) and fixtures being installed to replace
existing lamps and fixtures during renovation, retrofit/upgrade, or remodeling. This
replacement generally occurs before a lamp has burned out, providing an additional
opportunity for the penetration of new technologies into the building stock. It is assumed
that this occurs at a rate of 5% each year in each sector, for a mean renovation cycle of 20
years. The lighting market model assumes a constant rate of lighting fixture retrofits and
renovations of five percent of the installed base in both the no LED and LED scenarios.
As with the new construction category, LED lamps in this market will compete with
conventional lighting technologies on a basis that includes new fixture costs. It is
important to note however that utility and government incentive programs are starting to
compensate consumers who retrofit using LED lighting products, potentially causing a
future increase in the rate of retrofits due to the presence of LEDs. Due to the high
uncertainty in these inputs, the lighting market model does not attempt to quantify these
trends and, consequentially, likely underestimates the turnover rate of the installed base
of LED lamps and luminaires, and thus also underestimates the forecasted LED market
penetration and energy savings.
Replacements. Lamps or lamp and ballast systems that burn out and are replaced during
a calendar year. This calculation of the available lighting market is based on the
operating hours and the lifetime (in hours) of the lamps and ballasts installed. For this
analysis, the lighting market model assumes that manufacturers of LED technology
produce either lamps that match conventional screw-base and pin-based technologies
which can be installed directly into existing lighting fixtures, or luminaires which
represent a fixture change-out.
These three components—new construction, replacements and renovations—together determine
the total available market in each submarket and sector. With a projected lumen-hour market for
each year, the next step is to determine how the lighting technologies will develop and improve
over time.
Page 41
Appendix D Conventional Technology Improvement Projection
Due to continued R&D investment, competition from LED lighting products, and general market
demand for cost-effective lighting, the performance and cost characteristics of conventional
lighting technologies are expected to improve over the analysis period. However, the ability of
these conventional technologies to react rapidly (in terms of performance improvement) to the
emergence of a new light source such as LED lighting is relatively small because these are
mature technologies (particularly incandescent and fluorescent) and established market
competitors. The following tables present performance characteristics in 2013. Lighting
technologies that do not appear in the tables for a given sector indicate that the 2010 LMC did
not record any lighting consumption by that technology in that sector. The efficacies presented
in these tables represent mean system efficacies (including ballast losses, where appropriate),
rather than initial efficacies. When comparing conventional technologies to LED luminaires, the
model also incorporates additional assumptions related to conventional technology fixture
efficiencies. However, these fixture efficiencies are not incorporated into the mean system
efficacies presented in the following tables.

Page 42
Table D.2 Commercial Sector Conventional Technology Performance 2013
*The model also incorporates system lifetime assumptions for technologies that use a ballast (i.e., linear fluorescent and HID lamps).
Com m ercial Sector
Subm arkets
Mean System
W attage (W )
Lam p Life
(1,000 hr)*
Mean Efficacy
(lm /W )
Lam p
Price ($)
Ballast
Price ($)
Fixture
Price ($)
General Service
Incandescent Om ni 16 1.8 16 0.5$ -$ 16$
Halogen Om ni 15 1.5 15 1.9$ -$ 15$
CFL Om ni 55 10 55 3.0$ -$ 55$
Dow nlights
Incandescent Om ni 12 1.8 12 0.5$ -$ 12$
Incandescent Directional 10 2.5 10 3.1$ -$ 10$
Halogen Om ni 15 1.5 15 1.9$ -$ 15$
Halogen Directional 15 3.0 15 4.6$ -$ 15$
CFL Directional 46 10 46 10$ -$ 46$
CFL Pin 59 12 59 5.4$ 18$ 59$
Track Lighting
Incandescent Om ni 16 1.8 16 0.5$ -$ 16$
Incandescent Directional 10 2.5 10 3.1$ -$ 10$
Halogen Om ni 15 1.5 15 1.9$ -$ 15$
Halogen Directional 15 3.0 15 4.6$ -$ 15$
CFL Directional 46 10 46 10$ -$ 46$
Sm all Directional (MR16)
Halogen 18 4.1 18 4.5$ -$ 18$
General Service Linear Fixtures
T12 <4ft 56 15 56 3.0$ 17$ 56$
T8 <4ft 73 20 73 5.4$ 18$ 73$
T5 <4ft 77 30 77 6.2$ 22$ 77$
T12 4ft 71 20 71 2.5$ 17$ 71$
T8 4ft 79 24 79 4.4$ 18$ 79$
T5 4ft 91 30 91 6.2$ 22$ 91$
T12 >4ft 77 12 77 5.7$ 19$ 77$
T8 >4ft 84 24 84 7.0$ 22$ 84$
Low /High Bay
T12 71 12 71 5.7$ 19$ 71$
T8 79 18 79 8.4$ 22$ 79$
T5 91 30 91 6.2$ 25$ 91$
Metal Halide 74 20 74 40$ 205$ 74$
High Pressure Sodium 109 24 109 51$ 260$ 109$
Other
CFL Pin 59 12 59 5.4$ 18$ 59$
Halogen 11 1.0 11 0.5$ -$ 11$
CFL 16 4.1 16 4.5$ -$ 16$
Metal Halide 74 20 74 40$ 205$ 74$
High Pressure Sodium 109 24 109 51$ 260$ 109$
Miscellaneous 67 4.1 67 5.4$ 18$ 67$
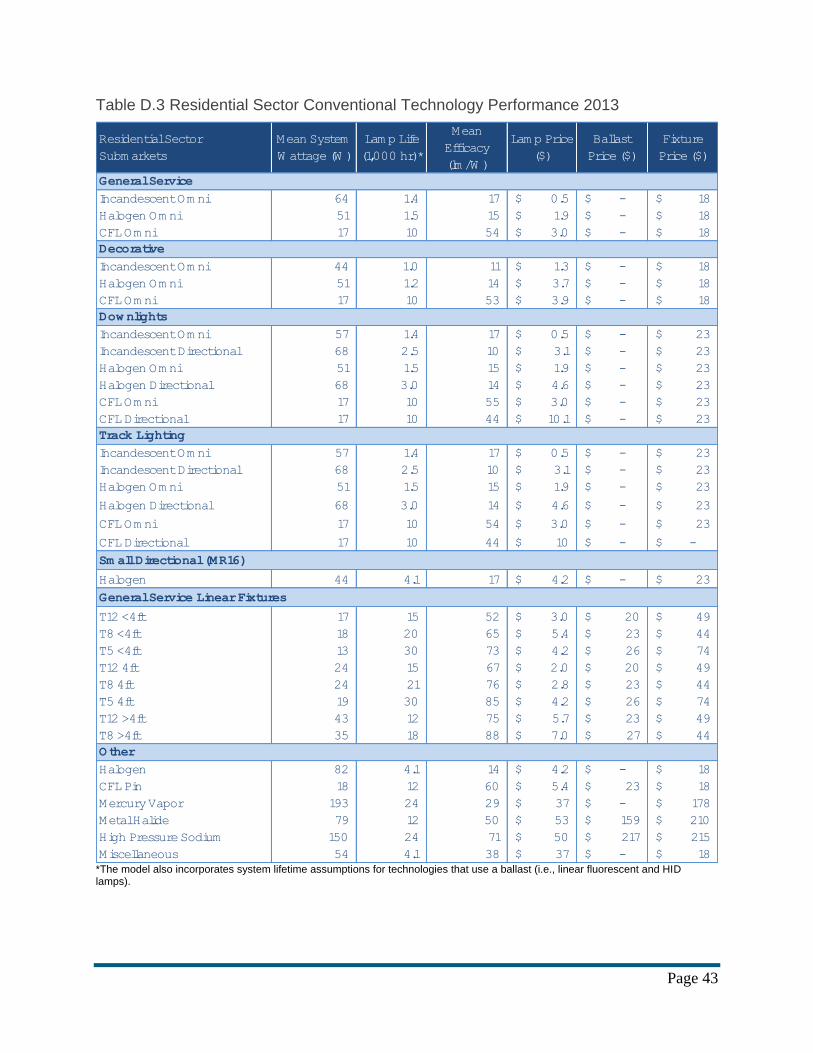
Page 43
Table D.3 Residential Sector Conventional Technology Performance 2013
*The model also incorporates system lifetime assumptions for technologies that use a ballast (i.e., linear fluorescent and HID lamps).
Residential Sector
Subm arkets
Mean System
W attage (W )
Lam p Life
(1,000 hr)*
Mean
Efficacy
(lm /W )
Lam p Price
($)
Ballast
Price ($)
Fixture
Price ($)
General Service
Incandescent Om ni 64 1.4 17 0.5$ -$ 18$
Halogen Om ni 51 1.5 15 1.9$ -$ 18$
CFL Om ni 17 10 54 3.0$ -$ 18$
Decorative
Incandescent Om ni 44 1.0 11 1.3$ -$ 18$
Halogen Om ni 51 1.2 14 3.7$ -$ 18$
CFL Om ni 17 10 53 3.9$ -$ 18$
Dow nlights
Incandescent Om ni 57 1.4 17 0.5$ -$ 23$
Incandescent Directional 68 2.5 10 3.1$ -$ 23$
Halogen Om ni 51 1.5 15 1.9$ -$ 23$
Halogen Directional 68 3.0 14 4.6$ -$ 23$
CFL Om ni 17 10 55 3.0$ -$ 23$
CFL Directional 17 10 44 10.1$ -$ 23$
Track Lighting
Incandescent Om ni 57 1.4 17 0.5$ -$ 23$
Incandescent Directional 68 2.5 10 3.1$ -$ 23$
Halogen Om ni 51 1.5 15 1.9$ -$ 23$
Halogen Directional 68 3.0 14 4.6$ -$ 23$
CFL Om ni 17 10 54 3.0$ -$ 23$
CFL Directional 17 10 44 10$ -$ -$
Sm all Directional (MR16)
Halogen 44 4.1 17 4.2$ -$ 23$
General Service Linear Fixtures
T12 <4ft 17 15 52 3.0$ 20$ 49$
T8 <4ft 18 20 65 5.4$ 23$ 44$
T5 <4ft 13 30 73 4.2$ 26$ 74$
T12 4ft 24 15 67 2.0$ 20$ 49$
T8 4ft 24 21 76 2.8$ 23$ 44$
T5 4ft 19 30 85 4.2$ 26$ 74$
T12 >4ft 43 12 75 5.7$ 23$ 49$
T8 >4ft 35 18 88 7.0$ 27$ 44$
Other
Halogen 82 4.1 14 4.2$ -$ 18$
CFL Pin 18 12 60 5.4$ 23$ 18$
Mercury Vapor 193 24 29 37$ -$ 178$
Metal Halide 79 12 50 53$ 159$ 210$
High Pressure Sodium 150 24 71 50$ 217$ 215$
Miscellaneous 54 4.1 38 37$ -$ 18$

Page 44
Table D.4 Industrial Sector Conventional Technology Performance 2013
*The model also incorporates system lifetime assumptions for technologies that use a ballast (i.e., linear fluorescent and HID lamps).
Industrial Sector Subm arketsMean System
W attage (W )
Lam p Life
(1,000 hr)*
Mean Efficacy
(lm /W )
Lam p
Price ($)
Ballast
Price ($)
Fixture
Price ($)
General Service
Incandescent Om ni 46 2 16 0.5$ -$ 15$
Halogen Om ni 44 2 15 1.9$ -$ 15$
CFL Om ni 17 10 54 3.0$ -$ 15$
Directional
Incandescent Directional 65 3 10 1.3$ -$ 23$
Halogen Directional 70 3 13 3.7$ -$ 23$
CFL Directional 16 10 43 3.9$ -$ 23$
General Service Linear Fixtures
T12 <4ft 41 15 49 3.0$ 17$ 44$
T8 <4ft 26 20 73 5.4$ 18$ 44$
T12 4ft 39 20 72 2.0$ 17$ 44$
T8 4ft 30 24 79 2.8$ 18$ 44$
T5 4ft 58 30 85 4.2$ 22$ 49$
T12 >4ft 84 12 78 5.7$ 19$ 44$
T8 >4ft 73 18 83 7.0$ 22$ 44$
Low /High Bay
T12 62 12 72 5.7$ 19$ 44$
T8 52 18 79 8.4$ 22$ 44$
T5 58 30 85 6.2$ 25$ 49$
Metal Halide 435 20 77 40$ 211$ 306$
High Pressure Sodium 295 24 106 51$ 260$ 224$
Other
CFL Pin 45 12 70 5.4$ 18$ 15$
Metal Halide 435 20 77 53$ 208$ 306$
High Pressure Sodium 295 24 106 50$ 256$ 224$

Page 45
Table D.5 Outdoor Sector Conventional Technology Performance 2013
*The model also incorporates system lifetime assumptions for technologies that use a ballast (i.e., linear fluorescent and HID lamps).
The lighting market model introduces price and performance changes linearly as percentage
improvements over the analysis period, 2013 to 2030. The lighting market model improves the
lamp efficacy, ballast efficiency (if applicable), lifetime, and equipment costs for each of the
conventional lighting technologies. Labor costs are assumed to remain unchanged. These
incremental performance improvements were developed in consultation with industry experts,
with consideration given to the historical performance trajectory of each lighting technology.
Outdoor Sector Subm arketsMean System
W attage (W )
Lam p Life
(1,000 hr)*
Mean Efficacy
(lm /W )
Lam p
Price ($)
Ballast
Price ($)
Fixture
Price ($)
Street/Roadw ay
Incandescent 181 1.4 12 0.5$ -$ 15$
CFL 44 10 55 6.6$ -$ 15$
Linear Fluorescent 50 21 75 2.8$ 19$ 70$
Metal Halide 233 20 61 40$ 187$ 323$
High Pressure Sodium 230 24 85 50$ 260$ 314$
Low Pressure Sodium 78 25 90 39$ 109$ 271$
Other 62 18 76 26$ -$ 295$
Parking Lot
Incandescent 112 1.4 12 0.5$ -$ 15$
Halogen 108 1.5 17 3.3$ -$ 15$
Metal Halide 449 20 61 40$ 163$ 323$
High Pressure Sodium 280 24 85 50$ 260$ 314$
Parking Garage
Incandescent 79 1.4 12 0.5$ -$ 15$
Halogen 75 1.5 17 3.3$ -$ 15$
Linear Fluorescent 73 21 75 2.8$ 19$ 70$
Metal Halide 203 20 61 40$ 163$ 323$
High Pressure Sodium 160 24 85 50$ 260$ 314$
Other 97 13 76 18$ -$ 320$
Building Exterior
Incandescent 61 1.4 12 0.5$ -$ 15$
Halogen 74 1.5 17 3.3$ -$ 15$
CFL 22 10 55 6.7$ -$ 15$
Linear Fluorescent 43 21 75 2.8$ 19$ 70$
Metal Halide 72 12 61 38$ 159$ 358$
High Pressure Sodium 78 24 85 45$ 195$ 224$
Low Pressure Sodium 74 25 89 40$ 106$ 172$
Other 68 15 76 21$ -$ 232$
Other
Incandescent 86 1.4 12 0.5$ -$ 15$
Halogen 544 1.5 17 3.3$ -$ 15$
Linear Fluorescent 148 21 75 2.8$ 19$ 70$
Metal Halide 1,122 20 61 98$ 211$ 517$
High Pressure Sodium 1,000 24 85 141$ 260$ 542$

Page 46
The percent improvement therefore varies depending on a particular lighting technology’s
seniority in the lighting market.
For nearly all technologies the lamp, ballast (if applicable), and fixture costs are expected to
decrease at a rate of 0.5% per year. The exceptions are incandescent omnidirectional, T12,
mercury vapor lamps, and low pressure sodium lamps, which are expected to show no
improvement for any of the cost and performance parameters. These technologies are mature
and there is little if any room for improvement. The market is moving away from mature
technologies to more efficient options, instead of trying to improve their performance. For all
applicable technologies we see that ballast lifetime and costs are expected to improve, but not
ballast efficiency. For all technologies the only improvements expected to be made to fixtures
are in reducing first cost. While manufacturing costs may decrease, the technology used in
lighting fixtures themselves will remain largely unchanged.
Appendix D.1 Legislation and DOE Regulations
The lighting market model accounts for several regulatory measures on conventional light
sources. Efficiency standards result in changes to both the performance and price of the affected
conventional sources and force market trends to more efficient technologies. These include both
standards prescribed via congressional action (e.g., general service incandescent lamp standards
established in EISA 2007) as well as energy efficiency standards that are promulgated by DOE
(e.g., the fluorescent lamp efficacy standard published in July 2009). The analysis considers
only legislation and DOE regulations that are final (i.e., enacted in the Code of Federal
Regulations16) and effective. The lighting market model does not take into account draft or
pending legislation or regulations, as both the compliance dates and standard levels are
uncertain. The lighting market model accounts for the new regulations by modifying the
anticipated efficacy improvements and resulting price increases based on the performance
criteria specified by the standard.
These regulatory measures force an improvement in the efficacy of conventional technologies, in
some cases making it more difficult for LED technology to penetrate the general illumination
market. This then requires that LEDs achieve higher efficacy levels and lower price points
before the market starts to shift. The following list summarizes the existing regulatory measures
that come into effect during the analysis period and are taken into account in this iteration.
1. General service lamps. Section 321 of EISA 2007 prescribed maximum wattage
standards for medium screw-base general service incandescent lamps, which took effect
between 2012 and 2014. The lighting market model assumes that covered non-halogen
incandescent products are unlikely to meet the 2012–2014 maximum wattage standards.
As such, this analysis models the EISA 2007 standards by manually removing covered
incandescent MSB products from the modeled marketplace, with the standard becoming
effective in each sector in the year corresponding to its mean incandescent MSB lamp
wattage. This causes a market transition toward more efficient lamps, such as standard-
16 For more information on the Code of Federal Regulations visit:
http://www.gpo.gov/fdsys/browse/collectionCfr.action?collectionCode=CFR

Page 47
compliant halogen and CFLs.17 DOE is also required to conduct another rulemaking
amending the standards for general service incandescent lamps, scheduled to be effective
in 2020. If that rule does not produce energy savings equivalent to a minimum efficacy
standard of 45 lumens per watt for GSLs, a backstop provision will prohibit the sale of
any general service lamp that does not meet a minimum efficacy of 45 lumens per watt.
The current market share model predicts that even without the penetration of LED
lighting products the average marketplace efficacy of general service lamps will exceed
45 lumens per watt by 2020 through the increased sales of CFL products in both the
commercial and residential sectors. Because it is not conclusive that the backstop
requirement will be activated and due to the uncertainty in DOE’s future actions, the
lighting market model does not assume any change in the products sold in 2020. It is
important to emphasize that the analysis and assumptions for this model regarding EISA
2007 have no implications for DOE’s position or future actions. See Section 321 of
EISA 2007.
2. Candelabra-base and intermediate-base incandescent lamps. Section 321 of EISA
2007 also prescribed maximum wattage standards for candelabra-base incandescent
lamps (60W) and intermediate-base incandescent lamps (40W), which became effective
immediately on December 19, 2007. Due to lack of installed base data as presented in
the LMC, it was not possible to disaggregate the installed inventory of candelabra and
intermediate base incandescent lamps. Thus, this analysis assumes that currently
available covered products already meet the EISA 2007 standards.
3. Fluorescent lamps. The Energy Policy Act of 1992 (EPAct 1992) amendments to the
Energy Policy and Conservation Act of 1975 (EPCA) established energy conservation
standards for certain classes of general service fluorescent lamps (GSFLs). DOE
published amendments to these standards in July 2009, which became effective July 14,
2012. These amendments set new efficacy requirements for 4-foot medium bipin, 2-foot
U-shaped, 8-foot slimline, 8-foot high output, 4-foot miniature bipin standard output, and
4-foot miniature bipin high output GSFLs by specific correlated color temperature (CCT)
ranges. The lighting market model incorporates these standards by increasing the
efficacy and price of linear fluorescent lamps accordingly. (10 CFR 430.32(n)).
4. Fluorescent ballasts. This DOE regulation applies to covered fluorescent ballasts
manufactured on or after November 14, 2014, and prescribes minimum ballast efficiency
standards that will effectively shift the fluorescent market from T12 magnetic ballasts to
T8 and T5 electronic ballast systems. Because covered magnetic ballasts are unlikely to
meet the standards, this analysis manually removes T12 systems from the modeled
marketplace in their respective years. (10 CFR 430.32(n))
5. Incandescent reflector lamps. This DOE energy conservation regulation, which applies
to lamps manufactured on or after July 14, 2012, amends EPCA to prescribe minimum
17 The Energy and Water Development and Related Agencies Appropriations Act, 2014, passed by the U.S.
Congress on January 17, 2014, contains a provision that prohibits DOE from enforcing the GSIL, candelabra-base
incandescent lamp, and intermediate- base incandescent lamp standards contained in Section 321 of EISA 2007 in
fiscal year 2014. The standards, however, have not been repealed and remain in effect.

Page 48
efficacy standards for covered products in the 40-205W range, determined by lamp
spectrum, lamp diameter, and rated voltage. Certain small diameter, elliptical reflector,
and bulged reflector incandescent reflector lamps (IRLs) are excluded. These standards
promote the adoption of halogen infrared technologies. The lighting market model
incorporates these standards by increasing the efficacy and price of halogen reflector
lamps accordingly. (10 CFR 430.32(n)).
6. Mercury vapor ballasts. The Energy Policy Act of 2005 (EPAct 2005) banned the
manufacture and importation of mercury vapor lamp ballasts (except specialty application
mercury vapor lamp ballasts) after January 1, 2008. These ballasts are no longer
available for purchase in the United States and were thus removed from the analysis of
the commercial, industrial, and outdoor sectors. Mercury vapor lamps used in the
residential sector, however, are assumed to be self-ballasted and not covered by this
regulation. They were therefore retained in the residential analysis.

Page 49
Appendix E LED Technology Improvement Projection
Pacific Northwest National Laboratory (PNNL) prepared the SSL Pricing and Efficacy Trend
Analysis for Utility Program Planning report for the U.S. DOE in October of 2013 (PNNL,
2013(b)). This work yielded price and efficacy projection curves that served as the basis for the
lighting market model’s LED improvement projections. For complete transparency on the
inputs, LED price and performance improvement projections used in this analysis are found in
Table E.6, Table E.8, and Table E.9.
In the previous model, to simplify the analysis, either LED lamps or LED luminaires could
compete within the same submarket, but not both. While this restriction allowed the lighting
market model to assign separate performance and costs to LED lamps and luminaires, it did not
allow for competition between lamps and luminaires for the same application. In the updated
lighting market model, both LED lamps and luminaires may compete for market share in the
same application. For example LED linear replacement lamps and LED luminaires, such as
troffers, can both compete in the linear fixture submarket. The updated model also allows for
variation in price and performance parameters for LED lamps and luminaires across the different
submarkets. This feature vastly improves the sophistication of the lighting market model and
allows for a more accurate analysis.
Table E.6 provides the efficacy improvement curves for various LED lamps and luminaires. For
comparison purposes, Table E.7 contains the performance parameters used in the 2012 model,
which were derived from the 2011 DOE MYPP projections. We see that using the PNNL
projections results in lower projected efficacies, and also a larger difference in performance
between LED lamps and luminaires.

Page 50
Table E.6 Average LED Lamp and Luminaire Efficacy Projections by Sector and Submarket
Table E.7 Previous 2012 Lighting Market Model Best-in-Class LED Efficacy Projections
LED Product Type Efficacy (lm/W)
2015 2020 2025 2030
LED Lamp 113 182 199 203
LED Luminaire 145 193 202 203
The MYPP identifies a target lifetime of 50,000 hours for LED lamps and 100,000 hours for
LED luminaires. In 2010, LED lamps typically had reported lifetimes of approximately 25,000
hours, while early LED luminaires had longer lifetimes of approximately 50,000 hours. The
lifetime projections for LED lamps and luminaires use the same logistic curve (i.e. an S-curve)
from the previous model iteration. Lifetime is logistically interpolated for each year of the
analysis period assuming lifetimes of 50,000 hours and 100,000 hours for LED lamps and
2013 2015 2020 2030 2013 2015 2020 2030
Com m ercial
General Service 70 81 102 131 - - - -
Directional 62 72 91 117 57 66 82 113
Sm all Directional (MR16) 58 66 81 103 57 66 82 113
General Service Linear Fixtures 86 91 109 132 98 106 131 181
Low/High Bay - - - - 95 101 121 160
Other 62 72 91 117 98 106 131 181
Residential
General Service 70 81 102 131 - - - -
Decorative 58 73 100 148 - - - -
Directional 62 72 91 117 57 66 82 113
Sm all Directional (MR16) 58 66 81 103 57 66 82 113
General Service Linear Fixtures 86 91 109 132 98 106 131 181
Other 70 81 102 131 57 66 82 113
Industrial
General Service 70 81 102 131 - - - -
Directional 62 72 91 117 57 66 82 113
General Service Linear Fixtures 86 91 109 132 98 106 131 181
Low/High Bay - - - - 95 101 121 160
Other 62 72 91 117 98 106 131 181
Outdoor
Street/Roadway - - - - 80 92 111 150
Parking Lot - - - - 80 92 111 150
Parking Garage 86 72 91 132 81 91 106 136
Building Exterior 86 72 91 132 81 91 106 136
Other 86 72 91 132 80 92 111 150
LED Lum inaire EfficacySector Subm arkets
LED Lam p Efficacy

Page 51
luminaires respectively in 2030. Table E.8 and Figure E.1 present the LED operating life
projections used in this analysis.
Table E.8 LED Lamp and Luminaire Lifetime Projections
LED Product Type Lifetime (1,000 hours)
2015 2020 2025 2030
LED Lamp 44 49 50 50
LED Luminaire 84 97 99 100
Figure E.1 LED Lamp and Luminaire Lifetime Projections
Table E.9 present the price improvement forecasts for LED products. These curves depict the
price reduction from a high initial equipment cost to a lower projected first cost. For early LED
products, the small form factors of replacement presented manufacturing challenges which led to
very high first costs. Over time however, LED lamp prices are expected to decrease
significantly, and much more so than luminaire products because luminaires are more material-
intensive and therefore more expensive on a first cost per kilolumen basis. For comparison
purposes, Table E.10 contains the price projections used in the 2012 model, which were derived
from MYPP projections. These projected faster price reductions in the near term, but the old
projections for 2030 were comparable to the updated projections for general service and
directional lamps and outdoor luminaires.
0
20
40
60
80
10 0
120
20 10 20 15 20 20 20 25 20 30
Lif
eti
me
(1,
00
0 h
ou
rs)
LED Lamp LED Luminaire

Page 52
Table E.9 Average LED Lamp and Luminaire Price Projections by Sector and Submarket
Table E.10 Previous 2012 Lighting Market Model LED Price Projections
LED Product Type Price ($/klm)
2015 2020 2025 2030
LED Lamp $11 $6.3 $4.4 $3.34
LED Luminaire $42 $24 $16 $12
2013 2015 2020 2030 2013 2015 2020 2030
Com m ercial
General Service 43$ 24$ 8.7$ 1.3$ - - - -
Directional 61$ 36$ 15$ 2.7$ 96$ 82$ 59$ 24$
Sm all Directional (MR16) 99$ 59$ 25$ 4.9$ 96$ 82$ 59$ 24$
General Service Linear Fixtures 104$ 89$ 60$ 28$ 112$ 89$ 62$ 30$
Low/High Bay - - - - 112$ 89$ 62$ 30$
Other 61$ 36$ 15$ 3$ 112$ 89$ 62$ 30$
Residential
General Service 43$ 24$ 8.7$ 1.3$ - - - -
Decorative 70$ 39$ 12$ 2.2$ - - - -
Directional 61$ 36$ 15$ 2.7$ 96$ 82$ 59$ 24$
Sm all Directional (MR16) 99$ 59$ 25$ 4.9$ 96$ 82$ 59$ 24$
General Service Linear Fixtures 104$ 89$ 60$ 28$ 112$ 89$ 62$ 30$
Other 43$ 24$ 8.7$ 1.3$ 96$ 82$ 59$ 24$
Industrial
General Service 43$ 24$ 8.7$ 1.3$ - - - -
Directional 61$ 36$ 15$ 3$ 96$ 82$ 59$ 24$
General Service Linear Fixtures 104$ 89$ 60$ 28$ 112$ 89$ 62$ 30$
Low/High Bay - - - - 112$ 89$ 62$ 30$
Other 61$ 36$ 15$ 2.7$ 112$ 89$ 62$ 30$
Outdoor
Street/Roadway - - - - 55$ 42$ 27$ 11$
Parking Lot - - - - 55$ 42$ 27$ 11$
Parking Garage 104$ 89$ 60$ 28$ 55$ 42$ 27$ 11$
Building Exterior 104$ 89$ 60$ 28$ 55$ 42$ 27$ 11$
Other 104$ 89$ 60$ 28$ 55$ 42$ 27$ 11$
LED Lam p Price ($/klm ) LED Lum inaire Price ($/klm )Sector Subm arkets

Page 53
Appendix F Lighting Market Penetration Model
Each year, new lamps and luminaires are sold as old lamps are replaced or fixtures are installed
or upgraded. This creates an annual lumen market demand, which may be satisfied by a suite of
lighting technologies, and represents an opportunity for a consumer to switch or adopt a new
lighting technology. The lighting market penetration model predicts market share as an
aggregate of many individual purchasing decisions by way of three components: an econometric
logit model that considers economic factors, a technology diffusion curve that considers existing
marketplace presence, and an acceptance factor that considers non-economic biases. This
approach of using a logit model and a technology diffusion model in concert has been previously
used in several analyses (Cao, 2004; Paidipati, Frantzis, Sawyer, & Kurrasch, 2008).
Appendix F.1 Econometric Logit Model
The current forecast model uses a conditional logit model to award available market to multiple
competing lighting technologies, similar to the model used in the National Residential Sector
Demand Module of NEMS 2013 (U.S. EIA, 2013) for the lighting technology choice component.
The conditional logit model is a widely recognized method of forecasting a product’s market
penetration based on several quantitative or categorical explanatory variables. The result of the
conditional logit is a probability of purchase, which represents an aggregation of a large number
of individual consumer purchasing decisions. The logit model is predicated on the assumption
that these individual decisions are governed by consumer utility (i.e., the relative value) that
consumers place on the various technology attributes of an alternative. For example, consumers
may be strongly influenced by a product’s first cost, but may also place some lesser value on a
product’s efficacy. In the lighting market model, it is assumed that lighting purchasing decisions
are primarily governed by two economic parameters, both of which are expressed in dollars per
kilolumen, for comparison among technologies:
First Cost includes the lamp price, ballast price (if applicable), and, in the case of the new
and retrofit market segments, the fixture price. For LED luminaires, first cost indicates the
price of the complete luminaire. This also includes a labor charge, where applicable.
Annual Operation and Maintenance (O&M) Cost includes annual energy cost and annual
replacement cost. It is a function of the mean lamp or ballast life; annual operating hours;
lamp price, ballast price (if applicable), and a labor charge (if applicable).
These parameters, which collectively determine the life-cycle cost of a lighting product, were
chosen to help characterize two types of lighting consumers:
Those who prefer low retail price. These consumers place less importance on annual cost
savings, which is derived from the efficacy and lifetime performance of a lighting product.
Those who make purchasing decisions based primarily on the life-cycle or annual cost of a
lighting product. These consumers place less importance on the upfront product cost.
The market penetration model bases market share calculations in each lighting application on
one of these two characteristic consumers. In order to estimate how purchasing decisions are
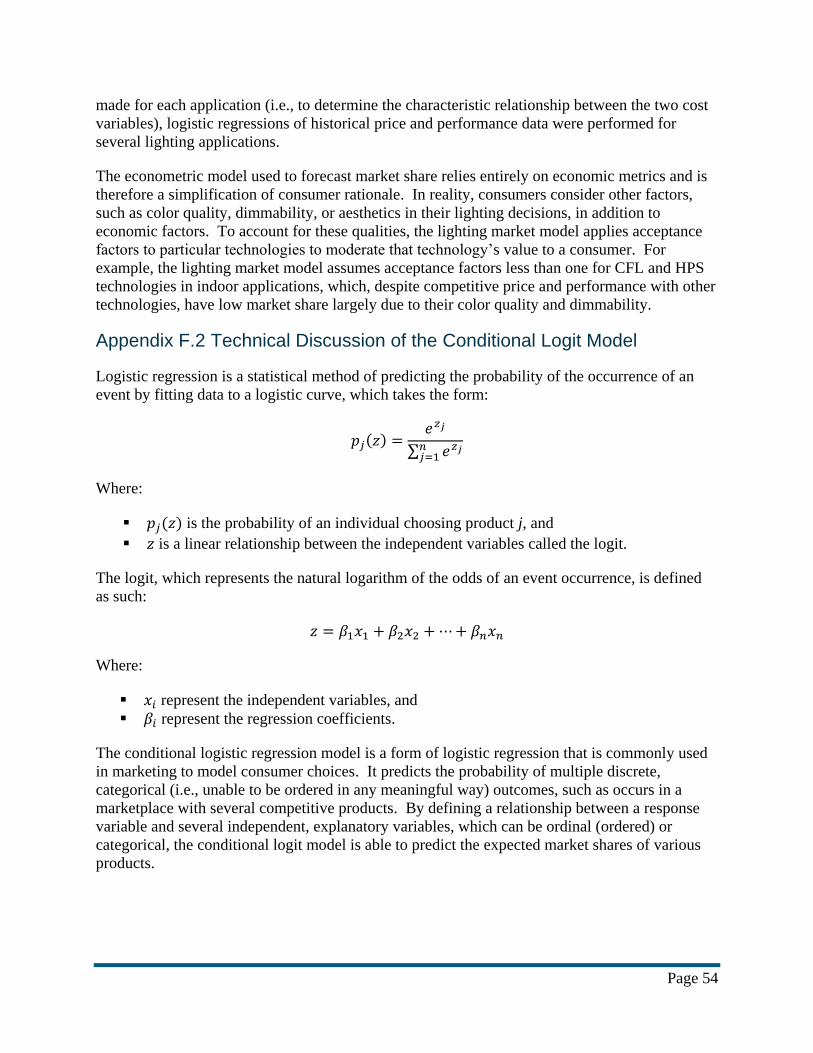
Page 54
made for each application (i.e., to determine the characteristic relationship between the two cost
variables), logistic regressions of historical price and performance data were performed for
several lighting applications.
The econometric model used to forecast market share relies entirely on economic metrics and is
therefore a simplification of consumer rationale. In reality, consumers consider other factors,
such as color quality, dimmability, or aesthetics in their lighting decisions, in addition to
economic factors. To account for these qualities, the lighting market model applies acceptance
factors to particular technologies to moderate that technology’s value to a consumer. For
example, the lighting market model assumes acceptance factors less than one for CFL and HPS
technologies in indoor applications, which, despite competitive price and performance with other
technologies, have low market share largely due to their color quality and dimmability.
Appendix F.2 Technical Discussion of the Conditional Logit Model
Logistic regression is a statistical method of predicting the probability of the occurrence of an
event by fitting data to a logistic curve, which takes the form:
𝑝𝑗(𝑧) =𝑒𝑧𝑗
∑ 𝑒𝑧𝑗𝑛𝑗=1
Where:
𝑝𝑗(𝑧) is the probability of an individual choosing product j, and
𝑧 is a linear relationship between the independent variables called the logit.
The logit, which represents the natural logarithm of the odds of an event occurrence, is defined
as such:
𝑧 = 𝛽1𝑥1 + 𝛽2𝑥2 +⋯+ 𝛽𝑛𝑥𝑛
Where:
𝑥𝑖 represent the independent variables, and
𝛽𝑖 represent the regression coefficients.
The conditional logistic regression model is a form of logistic regression that is commonly used
in marketing to model consumer choices. It predicts the probability of multiple discrete,
categorical (i.e., unable to be ordered in any meaningful way) outcomes, such as occurs in a
marketplace with several competitive products. By defining a relationship between a response
variable and several independent, explanatory variables, which can be ordinal (ordered) or
categorical, the conditional logit model is able to predict the expected market shares of various
products.

Page 55
Appendix F.3 Logit Model Input Data
Appendix D and Appendix E discuss how the lighting market model tracks the evolution of price
and performance attributes for conventional lighting technologies and LEDs, respectively. These
attributes are used as input data to the logit model in the form of two economic metrics: first cost
and annual operation and maintenance cost. First cost is a straightforward measure of the
purchase price that the consumer pays. Annual O&M cost includes annual energy, replacement
and labor costs. Annual replacement cost is an annualized estimate of the cost of replacing
burned out lighting equipment, distributed over the average lifetime of the lighting product in
years. It is calculated from average lamp or ballast lifetime in hours, average operating hours per
year, and the cost of the replacement unit. Annual energy cost is based on average efficacy
values and average operating hours per year by application, which is also discussed in Appendix
D and Appendix E, and average electricity prices by sector. Electricity prices used for the
operating cost evaluation are taken from the EIA’s AEO 2014 reference scenario, and then
converted from 2012 to 2014 dollars. Because the majority of outdoor lighting is used on and
around commercial buildings, we assumed that commercial electricity prices apply to the
outdoor sector. The AEO 2014 also provides several alternative electricity price scenarios, but
variation is minor such that their effect on the logit model was negligible. The electricity prices
used in the analysis are shown in Table F.11.
Table F.11 Electricity Price Projections in 2014 Dollars per Kilowatt-Hour
Sector Average Electricity Price ($/kWh)
2013 2015 2020 2025 2030
Residential $0.116 $0.119 $0.123 $0.123 $0.126
Commercial $0.101 $0.102 $0.105 $0.104 $0.107
Industrial $0.069 $0.069 $0.071 $0.072 $0.075
Outdoor $0.101 $0.102 $0.105 $0.104 $0.107
Source: EIA, 2014
Appendix F.4 Technology Diffusion Curve
While the conditional logit model provides a probability of purchase for each technology under
perfect competition, the lighting market model also recognizes that newer technologies are at a
relative disadvantage compared with well-established incumbent technologies. The rate of
market penetration is subject to certain market barriers, including, but not limited to, acceptance
and availability of the technology. Typically, these barriers only apply to new market entrants,
such as LED technologies, as technologies may initially be unknown to consumers or may not be
readily available to purchase. However, as a product establishes itself on the market, benefits are
communicated by word-of-mouth to the consumer base, manufacturers are able to ramp up
production capacity, and stocking distribution channels emerge. To simulate this lag effect on
newer technologies, the lighting market model applies a Bass technology diffusion model to the
logit model market share predictions. The Bass diffusion model is a widely recognized
marketing tool used in technology forecasting that effectively slows the rate of technology
adoption based on the time necessary for consumers to become aware of and adopt a new
lighting technology. In today’s lighting market, the effect of technology diffusion is primarily
limited to LED lighting as it is the only significant emerging technology on the market.

Page 56
Therefore, the lighting market model tends to delay the adoption of LED products despite rapid
gains in efficacy improvement and cost reduction.
In this analysis, the Bass curve used for conventional (non-LED) technologies is based on a
PNNL report, which uses historical market penetration data for electronic ballasts, T8 fluorescent
lamps, and CFLs to create a lighting-specific diffusion curve (PNNL, 2004). Considering the
historical diffusion of CFLs into the marketplace to be atypical due to various early performance
issues such as poor light levels and color rendition, discussed at length in a 2006 DOE report
(PNNL, 2006), this analysis modified the PNNL diffusion curve to be based only on electronic
ballasts and T8 fluorescent lamps. These technologies are common in the commercial and
industrial sectors, which causes the curve to be more representative of these sectors than the
residential and outdoor sectors.
Additionally, LEDs are a versatile, promising technology that has begun to demonstrate
significant benefits over incumbent competitors. The previous iteration of the DOE forecast
model assumed that LED technology would diffuse at the same rate as conventional technology;
however, LED adoption estimates for several lighting applications indicate that the diffusion of
LED technology is occurring at a faster rate. Figure F.1 below shows the average estimated LED
market share for all general illumination applications as compared to incumbent technologies.
To account for this difference, this updated analysis assigns to LED products a faster diffusion
rate compared to the incumbent competitors.
Figure F.1 LED Market Share vs. Conventional Lighting Technology Diffusion
0%
2%
4%
6%
8%
10%
0 1 2 3 4 5
Cu
lmu
lati
ve A
do
pti
on
(%
)
Years on Market
Estimated Total LED Market Share
Diffusion Curve - Conventional Lighting

Page 57
6 References
Cao, X. (2004). The Future Demand For Alternative Fuel Passenger Vehicles: A Diffusion of
Innovation Approach. Prepared by Xinyu Cao for the California Department of
Transportation, Sacramento, CA.
Navigant. (2002). U.S. Lighting Market Characterization, Volume I: National Inventory and
Energy Consumption Estimate. Prepared by Navigant Consulting, Inc. for the U.S.
Department of Energy, Office of Energy Efficiency and Renewable Energy, Washington
DC.
Navigant. (2012). U.S. Lighting Market Characterization, Volume I: National Inventory and
Energy Consumption Estimate. Prepared by Navigant Consulting, Inc. for the U.S.
Department of Energy, Office of Energy Efficiency and Renewable Energy, Washington,
DC.
Navigant. (2014). Adoption of Light Emitting Diodes in Common Lighting Applications:
Snapshot of 2013 Trends. Prepared by Navigant Consulting, Inc. for the U.S. Department
of Energy, Office of Energy Efficiency and Renewable Energy, Building Technologies
Program. Washington, DC: Department of Energy.
Navigant. (2014). Adoption of Light Emitting Diodes in Common Lighting Applications:
Snapshot of 2013 Trends. Prepared by Navigant Consulting, Inc. for the U.S. Department
of Energy, Office of Energy Efficiency and Renewable Energy, Building Technologies
Program. Washington, DC: Department of Energy .
Paidipati, J., Frantzis, L., Sawyer, H., & Kurrasch, A. (2008). Rooftop Photovoltaics Market
Penetration Scenarios. Prepared by Navigant Consulting, Inc. for the U.S. Department of
Energy, National Renewable Energy Laboratory, Golden, CO.
PNNL. (2004). Methodological Framework for Analysis of Buildings-Related Programs: The
GPRA Metrics Effort. Prepared by the Pacific Northwest National Laboratory for the U.S.
Department of Energy, Richland, WA.
PNNL. (2006). Compact Fluorescent Lighting in America: Lessons Learned on the Way to
Market. Prepared by Pacific Northwest National Laboratory for the U.S. Department of
Energy, Office of Energy Efficiency and Renewable Energy, Building Technologies
Program, Washington, DC.
PNNL. (2013(a)). Residential Lighting End-Use Consumption Study. Washington, DC: Prepared
for the U.S. Department of Energy.
PNNL. (2013(b)). SSL Pricing and Efficacy Trend Analysis for Utility Program Planning.
Prepared by Pacific Northwest National Laboratory for the U.S. Department of Energy,
Office of Energy Efficiency and Renewable Energy, Building Technologies Program,
Washington, DC.

Page 58
Rensselaer Polytechnic Institute. (2002). Lighting Research Center, Lighting Answers: MR16
Lamps. Retrieved from
http://www.lrc.rpi.edu/programs/nlpip/lightinganswers/mr16/abstract.asp
U.S. DOE. (2014). Solid-State Lighting Research and Development Multi-Year Program Plan.
Prepared by Bardsley Consulting, Navigant Consulting, Inc., SB Consulting, and SSLS,
Inc. for the U.S. Department of Energy, Office of Energy Efficiency and Renewable
Energy, Building Technologies Program.
U.S. EIA. (2013). Residential Demand Module of the National Energy Modeling System: Model
Documention 2013. Washington, DC: U.S. Department of Energy.
U.S. EIA. (2014). Annual Energy Outlook 2014 with Projections to 2040. U.S. Department of
Energy, Energy Information Administration, Washington, DC.

DOE/EE-1133 • August 2014
For more information, visit: ssl.energy.gov


![Illumination-Aware Age Progressionnovel illumination-aware age progression technique, lever-aging illumination modeling results [1,31], that properly account for scene illumination](https://img.dokumen.tips/doc/110x75/5e72745a0ac7de5cbf4199be/illumination-aware-age-progression-novel-illumination-aware-age-progression-technique.jpg)