Embed Size (px)
Citation preview
ENERGY RECOVERYINVESTOR PRESENTATION(NASDAQ: ERII)
May 2019

FORWARD LOOKING STATEMENT
This presentation contains forward-looking statements within the “Safe Harbor” provisions of the Private Securities Litigation Reform Act of 1995. Forward-looking statements in this report include, but are not limited to, statements about our expectations, objectives, anticipations, plans, hopes, beliefs, intentions, or strategies regarding the future. Forward-looking statements that represent our current expectations about future events are based on assumptions and involve risks and uncertainties. If the risks or uncertainties occur or the assumptions prove incorrect, then our results may differ materially from those set forth or implied by the forward-looking statements. Our forward-looking statements are not guarantees of future performance or events. Words such as “expects,” “anticipates,” “believes,” “estimates,” variations of such words, and similar expressions are also intended to identify such forward-looking statements.
These forward-looking statements are subject to risks, uncertainties, and assumptions that are difficult to predict; therefore, actual results may differ materially and adversely from those expressed in any forward-looking statements. You should not place undue reliance on these forward-looking statements, which reflect management’s opinions only as of the date of this presentation. All forward-looking statements included in this presentation are subject to certain risks and uncertainties, which could cause actual results to differ materially from those projected in the forward-looking statements, as disclosed from time to time in our reports on Forms 10-K, 10-Q, and 8-K as well as in our Annual Reports to Stockholders and, if necessary, updated in our quarterly reports on Form 10 Q or in other filings. We assume no obligation to update any such forward-looking statements. It is important to note that our actual results could differ materially from the results set forth or implied by our forward-looking statements.
1
STRATEGIC AND COMMERCIAL UPDATE
2
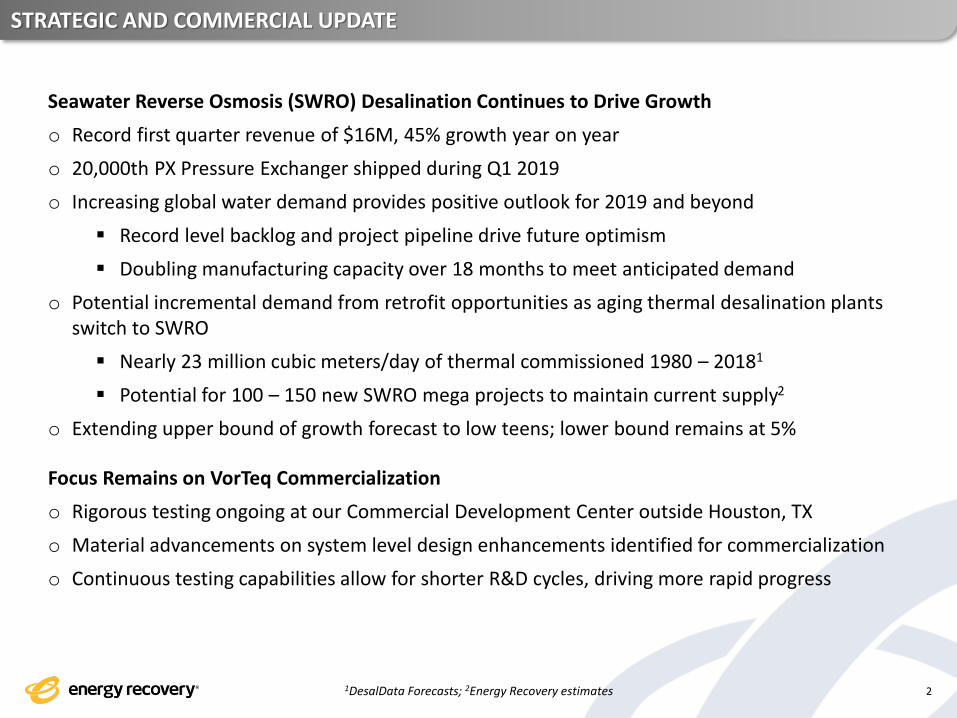
Seawater Reverse Osmosis (SWRO) Desalination Continues to Drive Growth
o Record first quarter revenue of $16M, 45% growth year on year
o 20,000th PX Pressure Exchanger shipped during Q1 2019
o Increasing global water demand provides positive outlook for 2019 and beyond
▪ Record level backlog and project pipeline drive future optimism
▪ Doubling manufacturing capacity over 18 months to meet anticipated demand
o Potential incremental demand from retrofit opportunities as aging thermal desalination plants switch to SWRO
▪ Nearly 23 million cubic meters/day of thermal commissioned 1980 – 20181
▪ Potential for 100 – 150 new SWRO mega projects to maintain current supply2
o Extending upper bound of growth forecast to low teens; lower bound remains at 5%
Focus Remains on VorTeq Commercialization
o Rigorous testing ongoing at our Commercial Development Center outside Houston, TX
o Material advancements on system level design enhancements identified for commercialization
o Continuous testing capabilities allow for shorter R&D cycles, driving more rapid progress
1DesalData Forecasts; 2Energy Recovery estimates

Q1 2019 FINANCIAL UPDATE
3
Strong Q1 Results
o 43% revenue growth year-over-year driven by water segment
o Water demand outlook continues to strengthen
o Net cash (and securities) position of over $91M
Compelling Product Gross Margins
o Profitability driven by PX Pressure Exchanger sales
o High margins expected to continue for foreseeable future
Revenue
Product Gross Margins
$14M
$20M
Q1'18 Q1 '19
Q1 2018 vs. Q1 2019
Q1'19
70.0% 69.3%
Q1'18 Q1 '19
Q1 2018 vs. Q1 2019
Q1'19

ABOUT ENERGY RECOVERY

ENERGY RECOVERY SNAPSHOT
Who Are We
o A global, engineering-driven technology company delivering solutions for industrial fluid flow processes
o We drive meaningful, immediate cost savings and operational efficiencies for customers
Our Approach
o Convert wasted pressure energy into a reusable asset
o Preserve or eliminate pumps that are subject to and destroyed by hostile process fluids
Our Current Markets
o Water
o Oil & Gas
5

ENGINEERING IS IN OUR DNA
o Energy Recovery is anchored by world-class engineers
o One-third of our company holds engineering degrees
▪ 9 Ph.Ds and 14 Masters Degrees
▪ Over 45% increase in R&D headcount since 2013
o Advanced testing capabilities in CA and at-scale in TX
o Rapid concept to prototype process
R&D Spend as % of OPEX
20.5%
27.8%
32.9%36.5%
2015 2016 2017 2018
Our In-House Expertise Spans Critical Engineering Disciplines
6
Fluid Mechanics & Aerodynamics
Solid Mechanics
CFD & FEA
Hydrodynamic Bearings
Multi-Phase Flow
Dynamics & Controls
Acoustics & Vibrations
Tribology
Material Science & Coatings
Pumps and Turbines
Turbomachinery
Rotating Equipment

OUR CORE TECHNOLOGY IS THE PX PRESSURE EXCHANGER
Transfers energy with only one moving part (rotor)
7
Fluid Flows in PX Pressure ExchangerPressure Exchanger Key Components
How the PX Pressure Exchanger Works
Two fluids on opposite sides of the PX; the rotor duct is sealed, isolating high and
low pressure fluid streams
Motive fluid
Driven fluid that will be pressurized
and sent into system
High pressure motive fluid enters PX
High pressure motive fluid contacts driven fluid, expelling
driven fluid at high pressureinto system
Low pressure driven fluid enters PX
Low pressure driven fluid contacts motive fluid, expelling motive
fluid at low pressure
This fluid energy exchange happens
continuously as the rotor spins at high speed
Rotor duct rotates to pressure exchange phase
Rotor duct rotates to sealed phase
Housing
Rotor
Sleeve
End cover
Cartridge

OUR PRODUCTS AND SOLUTIONS
8
Energy Recovery Devices
Pumps
Hydraulic Fracturing Solution
Mud Pumping Solution
Oil & GasWater
PX® Pressure Exchanger®
AT™ Turbocharger
AquaBold™ High Pressure Pump
Vertical Circulation Pump
Horizontal Circulation Pump
VorTeq™
MTeq™

STATE OF THE ART MANUFACTURING: A PREREQUISITE FOR INDUSTRY LEADERSHIP
Advanced Ceramics Manufacturing Capabilities Help Drive Water Success
o Vertically integrated ceramics manufacturing facility located in-house in CA
▪ Creates potential competitive barrier to entry
o Best practices ensure high-quality production process
▪ Approximately 99.9% of every PX Pressure Exchanger passes final stringent quality control before shipping
Ceramics Expertise Directly Translates to Tungsten Carbide for Oil & Gas Applications
o Similar manufacturing process for tungsten carbide PX Pressure Exchanger
▪ Production follows comparable path – from powder to final machining
▪ Rigid quality control and precision manufacturing
9

DISTRIBUTION STRATEGY LEVERAGES OUR STRENGTHS IN EACH MARKET
Seasoned Water Salesforce and Global Distribution Channel
o Salesforce’s tenure delivers strategic advantages in a relationship-driven market
▪ Business unit leader Rodney Clemente, a 20 year industry veteran, has overseen rapid water growth
▪ Entrenched, stable global water team
o Strong relationships and extensive database enable early project identification
Oil & Gas Sales Strategy Differs Due to Our Position
o Licensing model is more effective for a newcomer in a large, mature and vastly competitive industry
▪ De-risks market entry
▪ The right partnerships provide quicker credibility
▪ Eliminates need to build our own distribution channel
▪ Reduces time to market
HeadquartersSan Leandro, California
Madrid, Spain Dubai, UAE Shanghai, China
Water Sales Offices
10

STRATEGIC OBJECTIVES
Build and enhance infrastructure for growth
Commission Commercial Development Center
Commercialize VorTeqGrow and expand existing market presence in seawater desalination and beyond
11

HISTORICAL FINANCIAL RESULTS
o We are positioned to make critical investments in our business
▪ Organic or inorganic opportunities to expand our water business
▪ Commercialization and subsequent launch of VorTeq, further development of operational infrastructure
o Financially prepared for market fluctuations
Product Gross Margin StrengthRevenue: 25% CAGR 2014-2018
$30M
$45M
$58M
$69M$75M
2014 2015 2016 2017 2018
Net Cash and Securities Position of over $91M
54.9% 56.2%
64.1% 67.1%
70.7%
2014 2015 2016 2017 2018
12

13
Water – Our First Market Transformed

WE MAINTAIN A STRONG MARKET SHARE IN SWRO ENERGY RECOVERY DEVICES
o The PX Pressure Exchanger, our flagship desalination solution, delivers meaningful benefits
▪ Reduces energy costs by up to 60%, delivering nearly $2B savings/year1
▪ Lowers project lifecycle costs due to durability of products
▪ SWRO plants using PXs produce enough fresh water to meet daily consumption of 52M people1
o The PX was first introduced in 1997
▪ SWRO capacity began to grow exponentially around 2000
▪ Shipped our 20,000th PX in Q1 2019
141Energy Recovery estimates; 2DesalData Forecasts
0
5,000,000
10,000,000
15,000,000
20,000,000
25,000,000
30,000,000
35,000,000
1966 1980 1990 2000 2010 Present
SWRO Desalination Cumulative Capacity2
Tota
l in
stal
led
SW
RO
Cap
acit
y (m
³/ d
ay)

OUR PX PRESSURE EXCHANGER RECYCLES HYDRAULIC ENERGY, REDUCES ENERGY COSTS
o Energy consumption and costs made SWRO uneconomical historically
o Approx. 60% of energy wasted during SWRO prior to implementation of ERDs
o PX reduces energy consumption and cost by approx. 60%
o Recycles energy, reduces high pressure pump size making SWRO more economical
15
Energy wasted as high pressure brine
hits valve
Seawater
Low pressure potable water
Pump pushes high pressure seawater
through membranes
The Ocean1
Without Energy Recovery Devices (ERDs) With PX Pressure Exchanger
PX transfers energy from high pressure brine to seawater
Incoming seawater routed to pump and PX
The Ocean1
Main pump size reduced by 60%
Low pressure potable water
1Ocean or other geological mass

OUR WATER SOLUTIONS
PX Pressure Exchanger
o Unmatched efficiencies for desalination up to 98%
o Highest uptime in the market (99.8%)
o Designed for up to 25+ years of useful life
AT Turbocharger
o Efficiencies up to 80%
o Volute insert technology for best efficiency range
o Lower initial capital costs
AquaBold High Pressure Pump
o Water lubricated bearing for long life and low maintenance
o Cast, duplex stainless steel hydraulics for higher quality and uptime
Vertical and Horizontal Circulation Pumps
o Specialized pumps pair with PX application
o Designed for long life with low maintenance
o Reliable performance in high suction pressure operating environments
16
Pump ProductsEnergy Recovery Devices

GLOBAL REACH OF ENERGY RECOVERY PRODUCTS
17
~17M cubic meters/day of potable water produced1
~20,000 devices installed worldwide
~$2.0B/year saved for customers2
1Assuming all deployed devices are in operation; 2Energy Recovery estimates

FRESH WATER SCARCITY IS INCREASING
Fresh water demand is increasing, creating global demand gaps
o The world will only have 60% of the water it needs by 20301
o Potable water demand expected to increase by roughly 30 percent by 20502
o Water demand for agriculture is growing as salinity intrusion negatively impacts farm land
Desalinating seawater is an increasingly important part of meeting global water demand
o We are well-positioned to be part of the global supply solution
o SWRO expertise and commanding market position offers a springboard to growth
181Organisation for Economic Co-operation & Development (OECD); 2United Nations World Wide Water Report; 3DesalData Forecasts
$2.1B $2.0B$2.5B
$3.0B
$3.7B
$5.2B
$6.6B$6.8B
2014 2015 2016 2017 2018 2019 2020 2021
Continued Growth in SWRO Desalination CAPEX Spend 2014 – 20213
Actual Projected

THERMAL DESALINATION DECOMMISSIONING CREATING INCREMENTAL DEMAND
o Thermal seawater desalination was the dominant technology before the PX
o Operational savings from devices like the PX made SWRO more economic than thermal
o Thermal plants being replaced by SWRO, creating incremental opportunity for Energy Recovery
▪ Potential for 100 - 150 new SWRO mega projects to maintain water supply status quo1
o SWRO savings potential is significant vs. thermal
19
Tho
usa
nd
cu
bic
me
ters
/day
16%
41%
55%
74%
0
2,000
4,000
6,000
8,000
10,000
12,000
14,000
16,000
1961-1970 1971-1980 1981-1990 1991-2000 2001-2010 2011-2018
Desalination Capacity Increases by Decade3
Thermal SWRO % market share of desalination technology
84%
First PX Pressure
Exchanger installed 1997
in Canary Islands
59%
45%
26%
100%
97%
3%
1Energy Recovery estimates; 2,3DesalData Forecasts

OUR IP AND GLOBAL FOOTPRINT HAVE DRIVEN GROWTH AND PROFITABILITY
Consistent Revenue Growth
o Mega projects continue to drive 2019 revenues
o Owing to our robust pipeline and backlog, we expect strong growth to continue into 2020 and beyond
Extended Growth Cycle
o Upward revenue trend since 2014
o Evidence of extended cycle and upward shift in global demand curve
Exceptional Margins
o Water gross margins have grown from less than 54% in 2014 to roughly 70% today
o Margin strength provides optionality as growth initiatives are explored
20
Water Revenue and Gross Margin
Historical Water Revenues
Historical Water Gross Margins
70.8% 70.3%
Q1'18 Q1'19
Water Gross Margin
$11M
$16M
Q1'18 Q1'19
Water Revenue
53.7% 56.2% 65.6%
70.5% 71.6%
2014 2015 2016 2017 2018
$30M$44M $48M $54M $61M
2014 2015 2016 2017 2018
+47% +9% +14% +11%

WE ARE FOCUSED ON EXPANDING OUR WATER BUSINESS
We Currently Focus on Only 1-2% of a Project’s Capital Spend
o Energy recovery devices are critical to make plant operations affordable
▪ We dominate this market
o Current standing serves as competitive barrier to entry
o Limited exposure to other areas of desalination spend
▪ Small offering in Pumps (<1%)
Leverage Our Market Leadership Presence
o Our desalination position and distribution channel is a springboard to expand sales
o Focused on increasing offering in pumps and packaged/engineered solutions
o Utilize demand for and recognition of our strong PX Pressure Exchanger brand
21
Average Desal Project Capital Spend1
Engineering & Design
22%
Pumps8%
Membranes6%
Energy Recovery Devices(ERD)
1%Permitting1%
Other Equipment &
Materials41%
Installation & Fabrication
8%
Intake/Outfalls7% Pretreatment
6%
Energy Recovery dominates the ERD segment and has select offerings in Pumps
1DesalData Forecasts for 2023

22
Oil & Gas – Our Next Market to Transform

o Our PX Pressure Exchanger technology can add strategic value to the Oil & Gas industry
o Water and Oil & Gas have similarities
▪ High pressure fluid environments
▪ Transference of hydraulic energy from a high-pressure fluid to a low-pressure fluid
o We have leveraged our Water experience to evolve our core competencies for Oil & Gas success
▪ Advanced fluid & structural mechanics, bearing performance and material expertise of R&D
▪ Precision manufacturing coupled with enhanced experimental capabilities
▪ In-house simulation tools to model performance and results
✓ Increased life expectancy
✓ Increased reliability ✓ Reduced
maintenance costs✓ Lower CAPEX
(less required redundancy)
Our technology helps protect
pumps: hostile fracing and drilling fluids handled by
the PX, clean water processed by
pumps
Oil & Gas high pressure
pumps present design and material
challenges: Susceptible to abrasion, erosion,
fatigue and corrosion
WE ARE APPLYING OUR WATER EXPERTISE TO OIL & GAS
23
Pump Preservation

OUR SOLUTIONS
o Hydraulic fracturing technology solution
o Houses 12 PX Pressure Exchangers
o Designed to isolate and save frac pumps
o Addresses pump failure at frac sites
o Re-routes hostile frac fluid away from critical and costly pumps
o Currently in R&D stage
o Mud pumping technology solution
o Houses three PX Pressure Exchangers
o Designed to isolate and save mud pumps
o Addresses pump failure at drilling sites
o Re-routes hostile drilling fluid away from critical and costly pumps
o Currently in R&D stage
24
VorTeq MTeq

VORTEQ PROTECTS HIGH PRESSURE PUMPS, REDUCES COSTS
o Pumps process water, chemicals and sand
o Pump assets quickly destroyed
o Maintenance savings ($3M - $4M1)
o Lower pump redundancy and CAPEX ($1M - $2M1)
25
Status Quo With VorTeq
1Energy Recovery Estimates – savings measured in p/y p/fleet
Longer-term it may be possible to pair VorTeq with centrifugal pumpsFurther decreases need for pumps ($8M to $12M savings1)
Pumps are isolated, clean water fed to
pumps
VorTeq processes water,
sand and chemicals
Hostile fluids processed by
pumps

WE HAVE INVESTED TO ACCELERATE THE COMMERCIALIZATION PROCESS
We are accumulating runtime in the testing yard at our Commercial Development Center
o Energy Recovery personnel and equipment moved to our center in Q1 2019
o Rigorous VorTeq system testing and validation ongoing
▪ Investing in additional personnel to expand testing capabilities to seven days/week
o Facility uses industry standard equipment to simulate the pressures, flow, and operating conditions of a real frac site
▪ Allows us to confirm system reliability and repeatability in variable real-world conditions
Expanded testing capabilities help accelerate the path to commercialization
o Continuous access to testing resources speeds R&D cycle from design concept to validation and implementation
o Substantial progress made advancing and implementing system level design enhancements
The Center is an investment in the long-term success of our Oil & Gas business
o Houses advanced equipment to machine, inspect and test tungsten carbide components
o Enables rigorous testing of tungsten carbide pressure exchangers prior to field deployment
26

VORTEQ AGREEMENT & COMMERCIALIZATION PATH
Entered into a 15 year license agreement with Schlumberger Technology Corporation
o Exclusive rights to VorTeq for on-shore hydraulic fracturing
▪ Upfront $75M exclusivity fee
▪ Two separate $25M milestone payments (for a total of $50M) subject to certain KPIs
✓ Milestone 1 (M1): Frac at product licensee test facility
✓ Milestone 2 (M2): Frac at customer exploration & production (E&P) well
▪ Commercialization Highlights:
✓ $1.5MM per VorTeq per year
✓ Acceptance standards inclusive of M1 and M2, as well as other performance tests
✓ Product licensee responsible for missile manufacturing; ERI provides PX Pressure Exchangers, housing and motors
✓ Five years from first unit to full deployment across product licensee fleets
Liberty Oilfield Services carve-out (our early-stage test partner)
o Rights for up to 20 VorTeq units for up to 5 years
o We provide full missile and cartridges – vendors have been qualified
o Commercialization standards differ and thus speed to market may be faster
o Pricing based on contractual ROIC
27

MTEQ REPLACES POSITIVE DISPLACEMENT PUMPS, REDUCES COSTS
Positive displacement pumps process drilling fluid today, wearing down
and destroying pump assets
Highly efficient centrifugal pumps process clean water, reduce/preserve pump
assets, lengthen life and reduce costs
28
Status Quo With MTeq

STRATEGIC SUMMARY
ENERGY RECOVERY – A BALANCED RISK/REWARD APPROACH
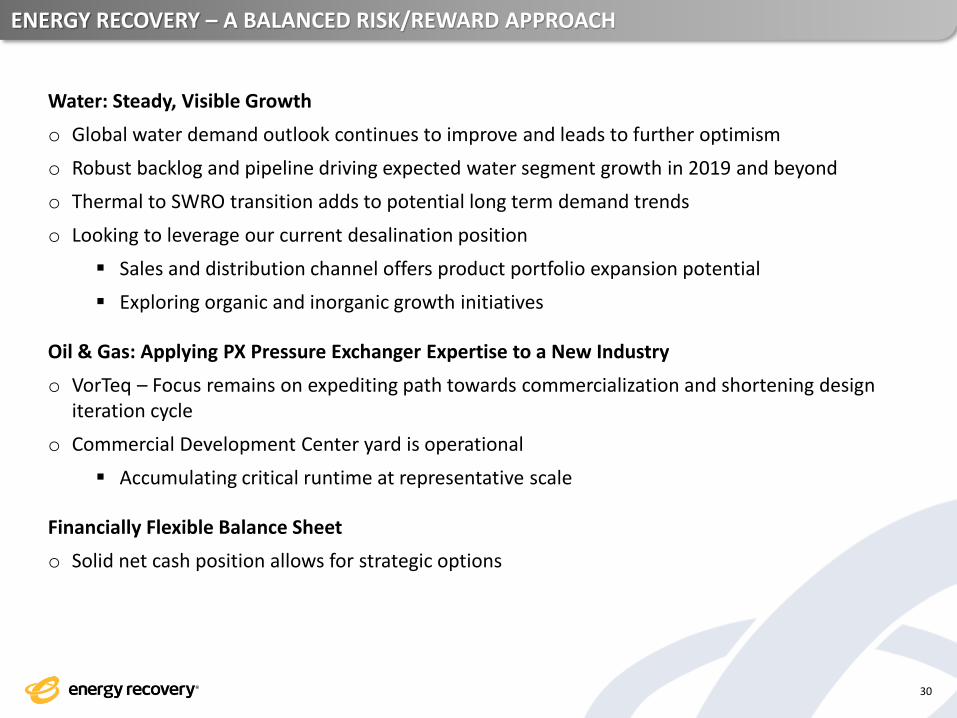
Water: Steady, Visible Growth
o Global water demand outlook continues to improve and leads to further optimism
o Robust backlog and pipeline driving expected water segment growth in 2019 and beyond
o Thermal to SWRO transition adds to potential long term demand trends
o Looking to leverage our current desalination position
▪ Sales and distribution channel offers product portfolio expansion potential
▪ Exploring organic and inorganic growth initiatives
Oil & Gas: Applying PX Pressure Exchanger Expertise to a New Industry
o VorTeq – Focus remains on expediting path towards commercialization and shortening design iteration cycle
o Commercial Development Center yard is operational
▪ Accumulating critical runtime at representative scale
Financially Flexible Balance Sheet
o Solid net cash position allows for strategic options
30

THANK YOU