Embed Size (px)
Citation preview

Energy Profile of Rollback-Recovery Strategies in
High Performance Computing
Esteban Meneses, Osman Sarood and Laxmikant V. Kale
Parallel Programming LaboratoryDepartment of Computer Science
University of Illinois at Urbana-Champaign
Abstract
Extreme-scale computing is set to provide the infrastructure for the advancesand breakthroughs that will solve some of the hardest problems in scienceand engineering. However, resilience and energy concerns loom as two ofthe major challenges for machines at that scale. The number of componentsthat will be assembled in the supercomputers plays a fundamental role inthese challenges. First, a large number of parts will substantially increasethe failure rate of the system compared to the failure frequency of currentmachines. Second, those components have to fit within the power envelope ofthe installation and keep the energy consumption within operational margins.Extreme-scale machines will have to incorporate fault tolerance mechanismsand honor the energy and power restrictions. Therefore, it is essential tounderstand how fault tolerance and energy consumption interplay. This pa-per presents a comparative evaluation and analysis of energy consumptionin three different rollback-recovery protocols: checkpoint/restart, messagelogging and parallel recovery. Our experimental evaluation shows parallelrecovery has the minimum execution time and energy consumption. Addi-tionally, we present an analytical model that projects parallel recovery canreduce energy consumption more than 37% compared to checkpoint/restartat extreme scale.
Keywords: rollback-recovery, checkpoint/restart, message logging, parallelrecovery, energy consumption
Preprint submitted to Parallel Computing January 23, 2014

1. Introduction
The eventual arrival of extreme-scale supercomputers will help in solv-ing some of the hardest problems in science and engineering. From high-resolution climate modeling to patient-specific drug design, many high-impactapplications require a massive amount of computation that only very largesystems can provide. However, there are at least two major challenges thathave to be addressed to really make extreme-scale systems functional [1, 2].The first problem is the significant increase in the failure frequency. As manycomponents have to be assembled together to provide all the required com-puting power, large systems will inevitably have a high failure rate. It isestimated that exascale machines will have a failure every few minutes [2].Therefore, a fault tolerance mechanism has to be employed to allow applica-tions run on large systems. The second problem is power management andenergy consumption. Power will be the driver in the design of architectures,systems and applications for extreme-scale computing. Installations will havestrict power limits and all the layers of the system will have to meet thatpower budget. Energy will also be a crucial consideration, given the highcost of managing large systems. It will be fundamental to decrease the en-ergy consumption. Reducing power consumption by one megawatt may savearound $1M/year even in a relatively inexpensive energy contract [2].
There are several promising fault-tolerance strategies to solve the re-silience challenge at extreme scale. We present a set of three rollback-recoveryprotocols and offer a comparative evaluation and analysis in terms of theirenergy and power profiles. These protocols are organized as a hierarchy,where each protocol is an incremental extension of the previous. The baseprotocol is the traditional checkpoint/restart based on local storage [3, 4].The tasks in the application periodically save their state and rollback to thelatest global checkpoint in case of a failure. The next method is a particu-lar version of message logging [5] that requires messages to be stored, butavoids a global rollback in case of a failure. Should a node fail, only thetasks running on that node are rolled back. The rest of tasks will re-sendthe messages to the failed tasks and make progress or wait idle until recoveryis finished. Finally, the third approach is called parallel recovery [6] thatextends message logging by allowing the migration of tasks after a failure toaccelerate their recovery.
This paper extends the material presented in our previous publication [7]by refining the analytical formulation to model the energy consumption of
2

the different fault-tolerance protocols, extending the experimental resultson new and more accurate power-measuring hardware, and improving theprojections to extreme scale systems. The contributions of this paper are thefollowing:
• An analytical model to understand and represent the energy consump-tion of three different rollback-recovery mechanisms (§ 3). This modelincorporates the main factors that affect the power draw in each mech-anism. At the same time, the model is flexible enough to be extendedto more strategies and more factors.• An experimental evaluation of the energy consumed by the three rollback-
recovery techniques (§ 4). We present results using several programs ontwo different parallel programming models. These results were collectedon a cluster enhanced to provide the power draw of various componentsat the millisecond level.• Projections of the energy profile of the rollback-recovery strategies at
extreme scale (§ 5). These estimations highlight the advantage of usinglocal rollback protocols. For instance, on a machine with more than512,000 sockets, the total energy consumed by a 24-hour job can bereduced by more than 37% using parallel recovery, compared to check-point/restart.
2. Rollback-Recovery
We conceive an application as a set of tasks Π. Each task holds a por-tion of the application’s data and performs part of the computation. Theonly mechanism for the tasks to share information is through message pass-ing. Each message is associated with a particular method at the target task.Upon reception of a message, a task executes the associated method untilcompletion. An application is run on a parallel architecture that is repre-sented as a set of nodes Σ. The number of tasks is independent of the numberof nodes. The fraction |Π||Σ| is called the virtualization ratio. All nodes are con-nected through a network that does not guarantee FIFO delivery betweenpairs of nodes. A runtime system orchestrates the execution of the applica-tion and is in charge of assigning tasks to nodes. In addition, the runtimesystem can migrate tasks from one node to another. Fault tolerance andload balancing are usually the main reasons for task migration. This com-putational model is general enough to accommodate well established parallelprogramming languages, such as MPI [8] and Charm++ [9].
3

Parallel Recovery
Message Logging
Checkpoint/Restart
Tasks can migrate at restart
Messages are stored and re-sent at restart
Tasks can be serialized at checkpoint
Figure 1: Organization of the three rollback-recovery protocols explored in this paper.Each protocol adds an incremental set of features that potentially reduces energy con-sumption in a faulty scenario.
The nodes in the system may fail according to the fail-stop model. Thatmeans, after a node crashes, it ceases to communicate and does not comeback. Other node from a pool of spare nodes will replace the failed one.Therefore, the number of nodes dedicated to an application is constant duringexecution, regardless of the number of node failures. Nodes are assumed tobe homogeneous and fail according to an exponentially distributed randomvariable. The system assembles all the nodes together and combines theindividual resilience descriptors into a single value that is commonly referredas mean-time-between-failures (MTBF). This random variable represents thefailure frequency of a machine. The runtime system must employ a fault-tolerance mechanism to allow an application run through failures. In thispaper, we examine rollback-recovery techniques [10]. These protocols arebased on the principle that a failure will force the system to roll back to apreviously stored consistent state, and recover from that state. A typicalrealization of this principle is through checkpoint/restart, where the systemperiodically stores its state. Should a node fail, the system rolls back to themost recent valid checkpoint and restart.
This paper explores three rollback-recovery strategies: checkpoint/restart,message logging, and parallel recovery. They can be organized as a sequenceof incremental additions to the fundamental checkpoint/restart scheme. Fig-ure 1 shows the three protocols and the features each of them adds to reduceenergy consumption when an application runs through failures.
2.1. Checkpoint/Restart
The most popular strategy to provide fault tolerance in HPC is check-point/restart. The basic tenet of this protocol is to checkpoint, or save thestate of the application with certain periodicity, such that a failure will rollback all the nodes to a previous state and resume the execution from thatstate. The principle is simple and effective for the failure frequency of petas-
4

cale machines. There are several libraries implementing this protocol forHPC systems [3, 4, 11, 12].
There are at least three main approaches to determine what is included ina checkpoint [13]. In system-level checkpointing, the state of all the systemis stored. That includes the memory pages used by the application, but alsothe rest of the hardware state (register, buffers, caches, etc). In contrast,application-level checkpointing allows the programmer to write a checkpointmethod and define exactly what is saved. This approach enforces a more dis-ciplined use of the checkpoint calls, by placing them at convenient locationsin the code (for instance, after global synchronization operations). Finally,runtime-system-based checkpointing extends the previous approach by hav-ing the runtime system automatically store the state of some structures. Theprogrammer has to implement the checkpoint routines and make the check-point calls. However, there is a major role played by the runtime system atcheckpoint time. In some situations, the runtime system may decide not tocheckpoint if the failure frequency is lower than a threshold.
A checkpoint is called uncoordinated if the tasks are allowed to checkpointat their own pace. Such strategy does not incur any overhead in synchroniz-ing the tasks for checkpoint, but the collection of checkpoints from all thetasks may not be consistent. To alleviate that problem, either some messageshave to be stored, or there is a risk of having cascading rollbacks. This lastsituation means that a failure may roll back the system several checkpointsuntil a valid collection of checkpoints is found. A coordinated checkpoint, onthe contrary, requires the set of tasks to collaborate in deciding the time tocheckpoint or what to include in the checkpoint. Alternatively, the program-mer can use globally synchronization points in the application to trigger thecheckpoint. This way, the set of checkpoints form a consistent global check-point that can be safely used to restart from a failure.
There are several alternatives for the checkpoint storage. The traditionalapproach has been to use the network shared file system. However, it isclear this scheme will not scale very far and it quickly bottlenecks [1, 14, 15].Therefore, an alternative approach is to use storage local to the nodes. Onestrategy is called double-local checkpoint/restart [3], where either memory,local disks or solid state drives (SSDs) are used to save the checkpoint. Thisstrategy requires each node to have a checkpoint buddy. At checkpoint, everynode saves its state in its own local storage and in the local storage of itsbuddy. If a node crashes, the buddy provides the latest checkpoint to thereplacement node. All other nodes in the system roll back to the latest
5

checkpoint stored in their local storage.In the rest of the paper we assume checkpoints are runtime-system-based,
coordinated and double-local. We build the next two fault tolerance strate-gies on top of this checkpoint/restart scheme.
2.2. Message Logging
A node failure provokes the loss of the current state of the tasks runningon the failed node. To reconstruct that state, checkpoint/restart rolls backthe set of all tasks to a previous consistent checkpoint and resumes execution.Rolling back the tasks that did not fail is unnecessary, provided that themessages those tasks sent to the failed tasks can be somehow recovered.This is the spirit of message logging. In principle, all messages between tasksare stored and replayed in case of a failure. That means, only the taskson the failed node have to roll back, the rest of the system is free to keepmaking progress or to wait idle. Message logging provides local recovery,as opposed to global recovery in checkpoint/restart. This ability has a highenergy-saving potential.
In addition to store messages between tasks, message-logging protocolsusually require more mechanisms to work properly. To recover the failednode correctly (i.e., bring its state to a consistent global state with the rest ofnodes), it is often necessary that the recovering node processes the messagesin the same order as it did before the crash. Even more, all non-deterministicdecisions must be executed with the same output during recovery. We usethe piece-wise deterministic (PWD) assumption [16] that states saving allthe output of the non-deterministic events is sufficient for a correct recov-ery. These bits of information are called determinants. The only type ofnon-determinism we consider in this paper is message reception. Thus, everytime a message is received, a determinant gets created. There are differentprotocols to handle determinants and how they get stored and recovered.The major message-logging protocols are called optimistic, pessimistic andcausal [17]. In this paper, we will use a variant called simple causal mes-sage logging [5]. Additionally, we will also used the fast message loggingprotocol [15] for programs with a high-level representation that allows thesuppression of determinants. The major concern in designing a message-logging protocol is to keep small the performance overhead µ associated withmanaging messages and determinants. The value of µ depends on severalfactors. However, for the applications used in this paper, the aforementionedprotocols have a µ lower than 5%.
6

2.3. Parallel Recovery
A useful extension to message logging that aims to further reduce recoverytime is called parallel recovery [6]. The main idea of this strategy consists indistributing the tasks on the failed node among other nodes during restart.That way, if the application is tightly coupled and most nodes are idle duringrecovery, the recovering tasks can recover on different nodes and in parallel.A faster recovery provides a mechanism to achieve a faster execution in afaulty environment. Therefore, the acceleration factor during recovery σaims to offset the performance overhead of message logging µ.
The design of parallel recovery assumes tasks can only migrate duringcheckpoint or restart1. That means parallel recovery will accelerate a portionof the execution and slow down another portion. More explicitly, if thecheckpoint period is τ and the failure occurs t units after the last checkpoint,then parallel recovery accelerates the recovery of the portion t
τ, but incurs a
performance penalization λ in the portion τ−tτ
. The factor λ appears thanksto the task migration for recovery. Some nodes will receive tasks to recoverand these tasks can only go back to their origin node until the next checkpointis reached.
Figure 2 presents a sample execution and how recovery works with thethree different protocols examined in this paper. Part a) shows a system with4 nodes and 6 tasks. This scenario depicts a failure on node Y after a fewmessages have been exchanged from the last checkpoint. Part b) presentsthe recovery using checkpoint/restart, where all the nodes roll back to theprevious checkpoint and resume execution. Note that recovery may proceeddifferently than the original execution. Part c) shows message logging thatonly requires node Y to roll back. In this case, the same delivery sequencehas to be reproduced. Determinants provide such guarantee. Part d) showsparallel recovery that migrates task D to node X, accelerating the recoveryof tasks D and E.
3. Modeling Energy Consumption
Rollback-recovery mechanisms based on checkpoint/restart, like the threeprotocols described in the previous section, face an important challenge re-
1This restriction is used to build a more efficient implementation and does not comefrom the computational model.
7

Node W
Node X
Node Y
Node Z
m2
m1
m3
m4
m5
m2m1
m3
m4
m5
Node W
Node X
Node Y
Node Z
m1
m3m5
m1
m3m5
Task A Task B Task C Task D Task E Task F Failure
Recovery
Recovery Recovery
a) Sample Execution b) Checkpoint/Restart
c) Message Logging d) Parallel Recovery
Checkpoint
Figure 2: A sample execution and recovery with the three rollback-recoveryschemes.
garding the checkpoint frequency. If checkpoints are too frequent, the over-head of saving the state of the application will negatively impact the per-formance. Contrarily, if checkpoints are too infrequent, the amount of workto recover after a failure may even prevent the system from making anyprogress. Therefore, an optimal checkpoint period must be found. The sym-bol τ will denote the amount of work that must be performed between twoconsecutive checkpoints. For failures exponentially distributed, an optimal τis periodic [18]. The optimal value of τ depends on other factors, includingcheckpoint time δ, and the MTBF of the system M . A popular approxima-tion [19] is given by the formula τ =
√2δM − δ. This expression provides
the optimal τ to reduce the overall execution time, considering the failuresthat may occur during execution.
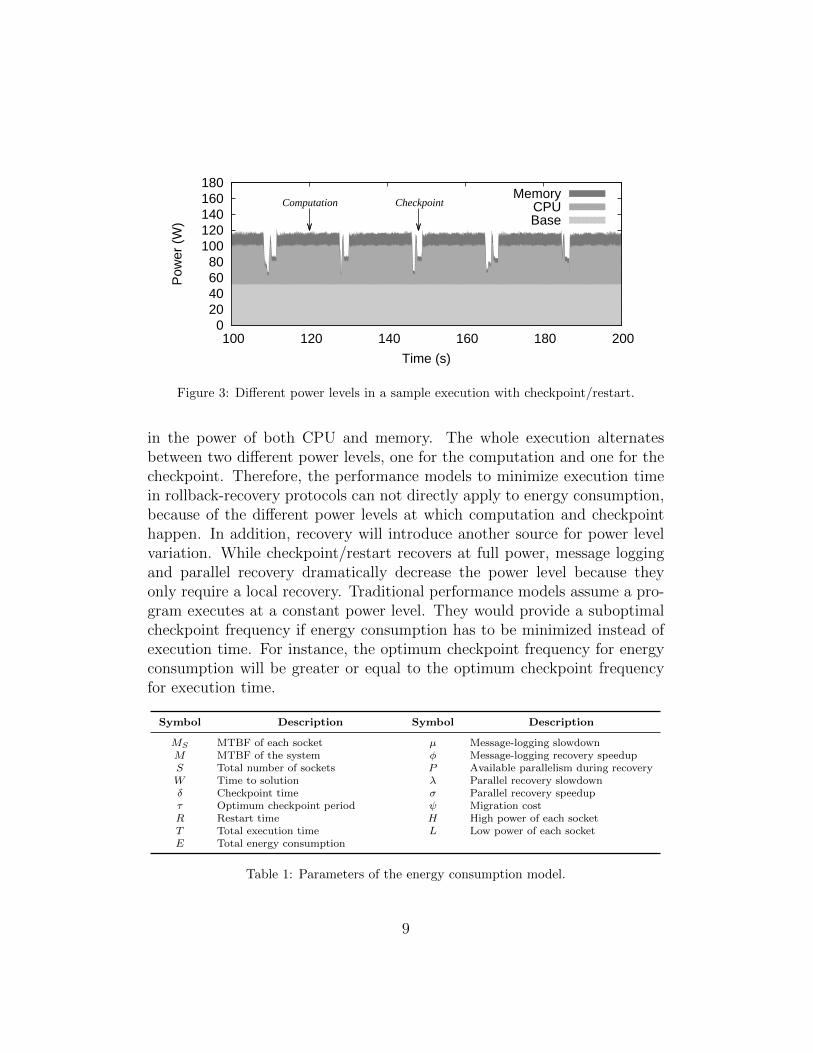
However, in minimizing the energy consumption of rollback recovery pro-tocols, it is important to understand how execution time and energy con-sumption are related and how they differ. Figure 3 shows an example run ofa stencil code that checkpoints its state to memory. The figure reports thetotal power on one node into three components: base, CPU and memory.The power reading granularity is one tenth of a second. The application pe-riodically checkpoints its state, and at those points there is a visible decrease
8
0 20 40 60 80
100 120 140 160 180
100 120 140 160 180 200
Pow
er (
W)
Time (s)
Computation CheckpointMemory
CPUBase
Figure 3: Different power levels in a sample execution with checkpoint/restart.
in the power of both CPU and memory. The whole execution alternatesbetween two different power levels, one for the computation and one for thecheckpoint. Therefore, the performance models to minimize execution timein rollback-recovery protocols can not directly apply to energy consumption,because of the different power levels at which computation and checkpointhappen. In addition, recovery will introduce another source for power levelvariation. While checkpoint/restart recovers at full power, message loggingand parallel recovery dramatically decrease the power level because theyonly require a local recovery. Traditional performance models assume a pro-gram executes at a constant power level. They would provide a suboptimalcheckpoint frequency if energy consumption has to be minimized instead ofexecution time. For instance, the optimum checkpoint frequency for energyconsumption will be greater or equal to the optimum checkpoint frequencyfor execution time.
Symbol Description Symbol Description
MS MTBF of each socket µ Message-logging slowdownM MTBF of the system φ Message-logging recovery speedupS Total number of sockets P Available parallelism during recoveryW Time to solution λ Parallel recovery slowdownδ Checkpoint time σ Parallel recovery speedupτ Optimum checkpoint period ψ Migration costR Restart time H High power of each socketT Total execution time L Low power of each socketE Total energy consumption
Table 1: Parameters of the energy consumption model.
9

We introduce an analytical model to estimate the total energy consump-tion of rollback-recovery mechanisms. The model requires several parame-ters, which are listed in Table 1. Usually, MS,M, S,W, δ and R are inputsto the model. For simplicity, we will assume M = MS
S. The model deter-
mines the optimal checkpoint period τ to either minimize T or E. We willdenote by τT and τE the optimum value of τ to minimize time and energy,respectively. Message logging parameters are µ and φ, while parallel recov-ery is represented by P, λ, σ, and ψ. Finally, the model considers two powerlevels, H and L, depending on whether the system is doing computation orcheckpointing, respectively. We will assume L is also the idle power. Hereare the general formulas for execution time and energy consumption:
T = TSolve + TCheckpoint + TRecover + TRestart (1)
E = ESolve + ECheckpoint + ERecover + ERestart (2)
These formulas are separated into four different components, according tothe state in which the execution is. For each of the rollback-recovery proto-cols, we provide approximations for each of the components in equations 1and 2. Table 2 shows the equations for TC , TM , and TP , representing check-point/restart, message logging and parallel recovery, respectively. Similarly,the table lists the formulas for EC , EM , and EP .
Protocol Formulas
Checkpoint/Restart
TC = W +(Wτ− 1
)δ + TC
M
(τ+δ2
)+ TC
MR
EC = WSH +(Wτ− 1
)δSL+ TC
MΩC + TC
MRSL
ΩC = ττ+δ· τ2SH + δ
τ+δ(τSH + δ
2SL)
MessageLogging
TM = Wµ+(Wµτ− 1
)δ + TM
M
(ττ+δ· τ2φ
+ δτ+δ
(τφ
+ δ2
))+ TM
MR
EM = WµSH +(Wµτ− 1
)δSL+ TM
MΩM + TM
MRSL
ΩM = ττ+δ· τ2φ
(H + (S − 1)L) + δτ+δ
( τφ
(H + (S − 1)L) + δ2SL)
ParallelRecovery
TP = Wµ+(Wµτ− 1
)δ + TP
M
(ττ+δ
(τ2σ
+ τ2
(λ− 1))
+ δτ+δ
(τσ
+ δ2
))+ TP
M(R+ ψ)
EP = WµSH +(Wµτ− 1
)δSL+ TP
MΩP + TP
M(R+ ψ)SL
ΩP = ττ+δ
(τ2σ
(PH + (S − P )L) + τ2
(λ− 1)SH)
+ δτ+δ
(τσ
(PH + (S − P )L) + δ2SL
)Table 2: Execution time and energy consumption formulas.
The equations in Table 2 assume the number of failures in an executioncan be approximated by T
M. The equations for TC , TM , and TP all have
the similar expressions for TSolve and TCheckpoint. The only difference comes
10
from the associated overhead of message logging. These formulas, though,markedly differ in the expression for TRecover. Message logging uses φ torepresent the speedup in recovery, while parallel recovery adds σ and λ duringrecovery. The migration cost of distributing tasks in parallel recovery iscaptured by ψ and added to the restart cost TRestart. The equations for EC ,EM , and EP extend their execution time counterparts by adding appropriatepower levels to each component.
4. Experimental Evaluation
4.1. Setup
The testbed used in this paper is called the Energy Cluster. It has twosections, named A and C. Section A contains 32-nodes (128 cores). Each nodehas a single socket with a four-core Intel Xeon X3430 processor chip runningCentOS 5.7. Section C is a 20-node Dell PowerEdge R620 cluster. Eachnode has a single socket containing the Intel Xeon E5-2620 Sandy-bridgeserver with 6 physical cores @ 2GHz, 2-way SMT with 16 GB of DRAM.The Package (CPU) corresponds to the processor die that includes the cores,L1, L2, and L3 caches in addition to the memory controller. This processorsupports on board power measurement and capping through Intel’s RunningAverage Power Limit (RAPL) interface [20]. RAPL is implemented using aseries of Machine Specific Registers (MSRs). These MSRs can be accesses toget power readings for each of the supported power planes at a granularityof 1 millisecond. Any power consumed other than the package and DRAMdomains is referred as the base power. It includes the power consumed byall the remaining components (e.g. power supply, mother board, fans andnetwork cards). The base power of a machine does not fluctuate a lot. Forthis cluster, the base power for each of the nodes came out to be between38-44W. These base power measurements are taken from the built-in powermeters on the Power Distribution Unit (PDU) that powers the cluster. Eachsection of the Energy Cluster is connected through a gigabit Ethernet switch.
The three fault-tolerance protocols presented in the previous sections wereimplemented in the Charm++ runtime system [21]. Charm++ imple-ments a parallel programming paradigm called migratable objects that fitsinto our computational model of Section 2. In Charm++, an application isover -decomposed into objects. The number of objects is usually independentof the number of nodes on which the application will run. An adaptive run-time system allows Charm++ distribute the objects among the nodes and
11

migrate objects from one node to another. That migration is traditionallyused to bring a better load balancing to the execution, reducing the totaltime to completion. An extension to Charm++, called Adaptive MessagePassing Interface (AMPI) permits the execution of any MPI application onthe Charm++ runtime. In AMPI each MPI rank becomes an object thatenjoys all the benefits of Charm++, such as load balancing, fault toleranceand general adaptivity of the system.
Table 3 presents a summary of all the applications used in the experimen-tal evaluation of the different protocols. The program Wave2D runs a finitedifference method to compute pressure information on a two-dimensionalgrid. Jacobi3D is a 7-point stencil that computes the transmission of heaton a three-dimensional space. The Livermore Unstructured Lagrangian Ex-plicit Shock Hydrodynamics (LULESH ) is a code for modeling hydrodynam-ics. This code describes the motion of materials relative to each other whensubject to forces in a three-dimensional space. The MPI programs NPB-BTand NPB-SP correspond to the block-tridiagonal and scalar penta-diagonalkernels from the NAS Parallel Benchmarks (NPB). To inject a failure in arunning application, we execute kill -9 PID, where PID represents a pro-cess running on one physical core with multiple tasks.
Application Wave2D Jacobi3D LULESH NPB-BT NPB-SP
Language Charm++ Charm++ Charm++ MPI MPIDomain Physics Physics Physics Linear Algebra Linear AlgebraVirtualization Ratio 32 32 32 4 4Max Power (C/R) 108 103 105 102 95Max Power (ML) 103 103 105 102 96
Table 3: List of features of applications used in the experiments.
4.2. Results
We ran Jacobi3D with the three protocols and analyze the power andenergy profile of each run. The program was run over a space of size 1500×800 × 400, decomposed into blocks size 503 for a virtualization ratio of 32.The program ran for a total of 1,600 iterations with checkpoints at iterations400 and 1,200. A failure on one core was injected at time 41 seconds. Weused all the 20 nodes and 120 physical cores of the Energy Cluster Section C.Figure 4 presents the results of this experiment. On the left column we showthe progress diagram of the execution, that shows the time at which certainiteration was completed. The diagram for checkpoint/restart illustrates a
12

0 200 400 600 800
1000 1200 1400 1600
0 20 40 60 80 100
Pro
gres
s (it
erat
ion)
Time (seconds)
Fai
l
Ckpt
CkptParallel Recovery
0 200 400 600 800
1000 1200 1400 1600
0 20 40 60 80 100
Pro
gres
s (it
erat
ion)
Fai
l
Ckpt
CkptMessage Logging
0 200 400 600 800
1000 1200 1400 1600
0 20 40 60 80 100
Pro
gres
s (it
erat
ion)
Fai
l
Ckpt
CkptCheckpoint/Restart
1000
1500
2000
2500
0 20 40 60 80 100
Pow
er (
W)
Time (seconds)
MemoryCPU
Base
Parallel Recovery
1000
1500
2000
2500
0 20 40 60 80 100
Pow
er (
W)
MemoryCPU
Base
Message Logging
1000
1500
2000
2500
0 20 40 60 80 100
Pow
er (
W)
MemoryCPU
Base
Checkpoint/Restart
Figure 4: Progress rate of different rollback-recovery strategies in a faulty scenario.
global recovery mechanism that rolls all the tasks back to the latest check-point. In contrast, message-logging techniques only force a local recoveryof the failed tasks. The flat section of the progress rate in message loggingand parallel restart corresponds to the recovery of the work lost in a failure.In this case, parallel recovery used a value for P equals to 4. The recoveryspeedup achieved was 3.74. The final execution time for checkpoint/restart,message logging, and parallel recovery was 103.13 s, 95.34 s, and 89.82 s,respectively.
The right column in Figure 4 shows the total power of the machine forthe same execution. During recovery, checkpoint/restart does not reducethe power level, because recovery is global. However, message logging andparallel recovery dramatically decrease their power consumption because therest of tasks on other nodes are waiting idle while the failed tasks catch up.That alone decreases the total energy consumption and in the end check-point/restart, message logging and parallel recovery use 218.96 kJ, 193.96 kJ,and 190.97 kJ, respectively. The values predicted by the energy consump-tion model of Section 3 for this particular scenario are 220.69 kJ, 195.65 kJ,
13

and 191.45 kJ, for checkpoint/restart, message logging, and parallel recov-ery, correspondingly. All projected values lie within 1% error margin withrespect to the experimental values. Note that message logging outperformscheckpoint/restart even considering the message logging slowdown (µ). Thisis the result of message logging having a speedup during recovery (φ) due tothe immediate availability of messages while recovering.
We ran the MPI programs using the AMPI extension on 25 nodes (100cores) of the Energy Cluster Section A. In both cases (BT and SP), theprogram used periodic checkpoints. A failure was inserted in the middle ofone checkpoint period. Each failure point was carefully calibrated for eachprotocol. We measured the total energy consumption for each protocol inthe faulty interval. The results are shown in Figure 5(a) and it presentsthe energy consumption of message logging and parallel recovery relative tocheckpoint/restart. Parallel recovery manages to execute through the failurewith the minimum amount of energy consumed. For this particular case,both benchmarks show similar results, with message-logging using around70% of checkpoint/restart and parallel recovery using close to 63%.
0 0.1 0.2 0.3 0.4 0.5 0.6 0.7 0.8 0.9
1 1.1 1.2 1.3
NPB-BT NPB-SP
Rel
ativ
e E
nerg
y C
onsu
mpt
ion
Checkpoint/RestartMessage-LoggingParallel Recovery
(a) Energy consumed in a faulty checkpointperiod.
2
4
6
8
10
2 4 8 16 32
Par
alle
l Rec
over
y S
peed
up (
σ)
Available Parallelism during Recovery (P)
Wave2DLULESHJacobi3D
(b) Parallel recovery speedup.
Figure 5: Potential for parallel recovery. The higher the virtualization ratio, the moreroom for acceleration during recovery and less energy consumed.
Finally, we ran the three Charm++ programs on 120 cores of the En-ergy Cluster Section C to understand how much speedup is achievable withdifferent applications. Figure 5(b) shows the speedup in recovery (σ) andthe available parallelism P increases. Some programs benefit more than oth-ers from parallel recovery. Wave2D shows the highest speedup, reaching
14
almost a factor of 10. LULESH and Jacobi3D reach up a factor of 6 and 4,respectively.
5. Extreme-Scale Projections
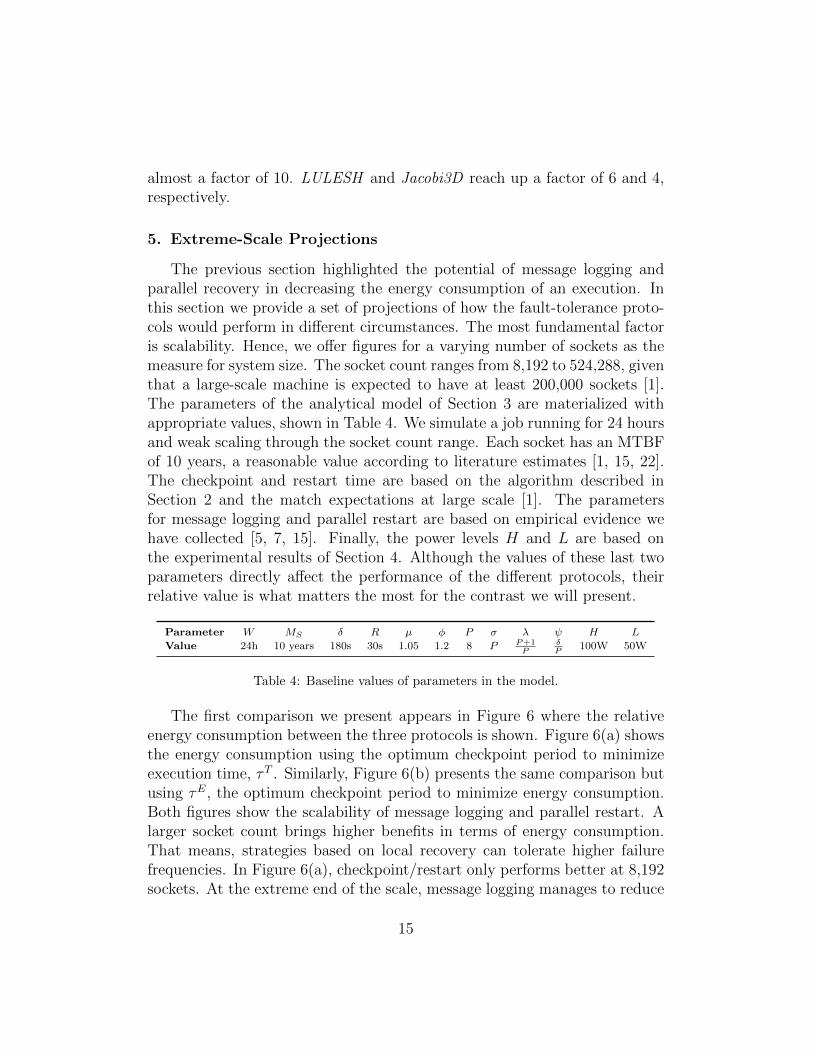
The previous section highlighted the potential of message logging andparallel recovery in decreasing the energy consumption of an execution. Inthis section we provide a set of projections of how the fault-tolerance proto-cols would perform in different circumstances. The most fundamental factoris scalability. Hence, we offer figures for a varying number of sockets as themeasure for system size. The socket count ranges from 8,192 to 524,288, giventhat a large-scale machine is expected to have at least 200,000 sockets [1].The parameters of the analytical model of Section 3 are materialized withappropriate values, shown in Table 4. We simulate a job running for 24 hoursand weak scaling through the socket count range. Each socket has an MTBFof 10 years, a reasonable value according to literature estimates [1, 15, 22].The checkpoint and restart time are based on the algorithm described inSection 2 and the match expectations at large scale [1]. The parametersfor message logging and parallel restart are based on empirical evidence wehave collected [5, 7, 15]. Finally, the power levels H and L are based onthe experimental results of Section 4. Although the values of these last twoparameters directly affect the performance of the different protocols, theirrelative value is what matters the most for the contrast we will present.
Parameter W MS δ R µ φ P σ λ ψ H L
Value 24h 10 years 180s 30s 1.05 1.2 8 P P+1P
δP
100W 50W
Table 4: Baseline values of parameters in the model.
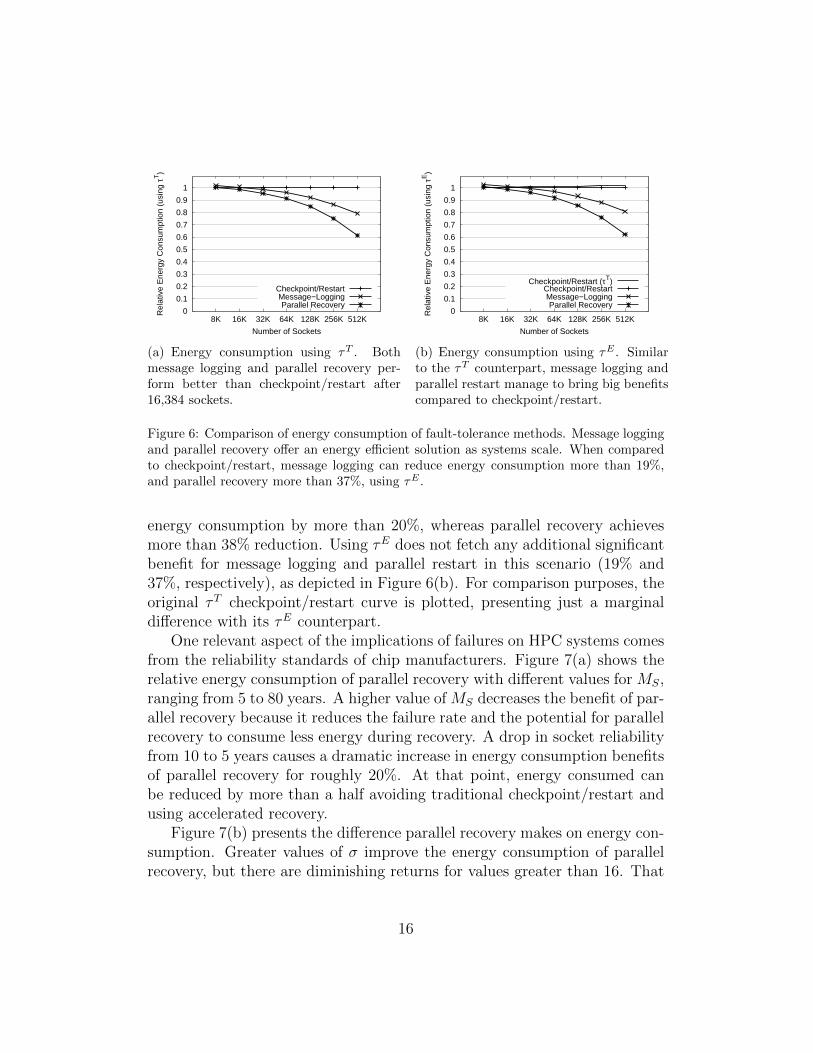
The first comparison we present appears in Figure 6 where the relativeenergy consumption between the three protocols is shown. Figure 6(a) showsthe energy consumption using the optimum checkpoint period to minimizeexecution time, τT . Similarly, Figure 6(b) presents the same comparison butusing τE, the optimum checkpoint period to minimize energy consumption.Both figures show the scalability of message logging and parallel restart. Alarger socket count brings higher benefits in terms of energy consumption.That means, strategies based on local recovery can tolerate higher failurefrequencies. In Figure 6(a), checkpoint/restart only performs better at 8,192sockets. At the extreme end of the scale, message logging manages to reduce
15
0
0.1
0.2
0.3
0.4
0.5
0.6
0.7
0.8
0.9
1
8K 16K 32K 64K 128K 256K 512K
Rel
ativ
e E
nerg
y C
onsu
mpt
ion
(usi
ng τ
T)
Number of Sockets
Checkpoint/RestartMessage−LoggingParallel Recovery
(a) Energy consumption using τT . Bothmessage logging and parallel recovery per-form better than checkpoint/restart after16,384 sockets.
0
0.1
0.2
0.3
0.4
0.5
0.6
0.7
0.8
0.9
1
8K 16K 32K 64K 128K 256K 512K
Rel
ativ
e E
nerg
y C
onsu
mpt
ion
(usi
ng τ
E)
Number of Sockets
Checkpoint/Restart (τT)Checkpoint/RestartMessage−LoggingParallel Recovery
(b) Energy consumption using τE . Similarto the τT counterpart, message logging andparallel restart manage to bring big benefitscompared to checkpoint/restart.
Figure 6: Comparison of energy consumption of fault-tolerance methods. Message loggingand parallel recovery offer an energy efficient solution as systems scale. When comparedto checkpoint/restart, message logging can reduce energy consumption more than 19%,and parallel recovery more than 37%, using τE .
energy consumption by more than 20%, whereas parallel recovery achievesmore than 38% reduction. Using τE does not fetch any additional significantbenefit for message logging and parallel restart in this scenario (19% and37%, respectively), as depicted in Figure 6(b). For comparison purposes, theoriginal τT checkpoint/restart curve is plotted, presenting just a marginaldifference with its τE counterpart.
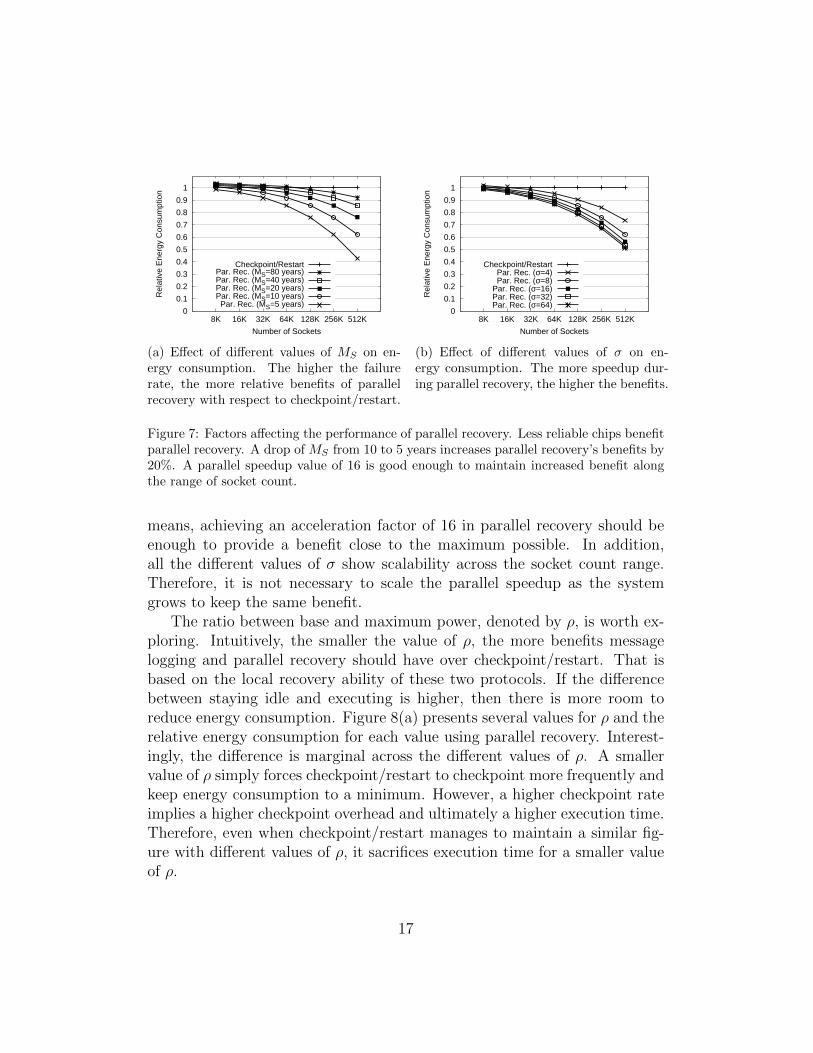
One relevant aspect of the implications of failures on HPC systems comesfrom the reliability standards of chip manufacturers. Figure 7(a) shows therelative energy consumption of parallel recovery with different values for MS,ranging from 5 to 80 years. A higher value of MS decreases the benefit of par-allel recovery because it reduces the failure rate and the potential for parallelrecovery to consume less energy during recovery. A drop in socket reliabilityfrom 10 to 5 years causes a dramatic increase in energy consumption benefitsof parallel recovery for roughly 20%. At that point, energy consumed canbe reduced by more than a half avoiding traditional checkpoint/restart andusing accelerated recovery.
Figure 7(b) presents the difference parallel recovery makes on energy con-sumption. Greater values of σ improve the energy consumption of parallelrecovery, but there are diminishing returns for values greater than 16. That
16
0
0.1
0.2
0.3
0.4
0.5
0.6
0.7
0.8
0.9
1
8K 16K 32K 64K 128K 256K 512K
Rel
ativ
e E
nerg
y C
onsu
mpt
ion
Number of Sockets
Checkpoint/RestartPar. Rec. (MS=80 years)Par. Rec. (MS=40 years)Par. Rec. (MS=20 years)Par. Rec. (MS=10 years)Par. Rec. (MS=5 years)
(a) Effect of different values of MS on en-ergy consumption. The higher the failurerate, the more relative benefits of parallelrecovery with respect to checkpoint/restart.
0
0.1
0.2
0.3
0.4
0.5
0.6
0.7
0.8
0.9
1
8K 16K 32K 64K 128K 256K 512K
Rel
ativ
e E
nerg
y C
onsu
mpt
ion
Number of Sockets
Checkpoint/RestartPar. Rec. (σ=4)Par. Rec. (σ=8)
Par. Rec. (σ=16)Par. Rec. (σ=32)Par. Rec. (σ=64)
(b) Effect of different values of σ on en-ergy consumption. The more speedup dur-ing parallel recovery, the higher the benefits.
Figure 7: Factors affecting the performance of parallel recovery. Less reliable chips benefitparallel recovery. A drop of MS from 10 to 5 years increases parallel recovery’s benefits by20%. A parallel speedup value of 16 is good enough to maintain increased benefit alongthe range of socket count.
means, achieving an acceleration factor of 16 in parallel recovery should beenough to provide a benefit close to the maximum possible. In addition,all the different values of σ show scalability across the socket count range.Therefore, it is not necessary to scale the parallel speedup as the systemgrows to keep the same benefit.
The ratio between base and maximum power, denoted by ρ, is worth ex-ploring. Intuitively, the smaller the value of ρ, the more benefits messagelogging and parallel recovery should have over checkpoint/restart. That isbased on the local recovery ability of these two protocols. If the differencebetween staying idle and executing is higher, then there is more room toreduce energy consumption. Figure 8(a) presents several values for ρ and therelative energy consumption for each value using parallel recovery. Interest-ingly, the difference is marginal across the different values of ρ. A smallervalue of ρ simply forces checkpoint/restart to checkpoint more frequently andkeep energy consumption to a minimum. However, a higher checkpoint rateimplies a higher checkpoint overhead and ultimately a higher execution time.Therefore, even when checkpoint/restart manages to maintain a similar fig-ure with different values of ρ, it sacrifices execution time for a smaller valueof ρ.
17

0
0.1
0.2
0.3
0.4
0.5
0.6
0.7
0.8
0.9
1
8K 16K 32K 64K 128K 256K 512K
Rel
ativ
e E
nerg
y C
onsu
mpt
ion
Number of Sockets
Checkpoint/RestartPar. Rec. (ρ=0.1)Par. Rec. (ρ=0.3)Par. Rec. (ρ=0.5)Par. Rec. (ρ=0.7)Par. Rec. (ρ=0.9)
(a) Effect of different values of ρ. There islittle difference between the different values,but it comes at a cost of higher executiontime in checkpoint/restart.
0
0.1
0.2
0.3
0.4
0.5
0.6
0.7
0.8
0.9
1
8K 16K 32K 64K 128K 256K 512K
Rel
ativ
e E
nerg
y C
onsu
mpt
ion
Number of Sockets
Checkpoint/RestartPar. Rec. (δ=0.75 m)Par. Rec. (δ=1.5 m)
Par. Rec. (δ=3 m)Par. Rec. (δ=6 m)
Par. Rec. (δ=12 m)
(b) Effect of different checkpoint duration.A greater checkpoint time increases the ben-efit of parallel recovery.
Figure 8: Understanding the effect of different parameters in the model and its overallbenefit is fundamental in deciding what factors should be explored when designing faulttolerance mechanisms. The ratio of base to maximum power does not have a high impacton energy consumption, but it does on execution time. Higher values of checkpoint timemay cause checkpoint/restart to collapse.
Figure 8(b) explores the relative benefit of parallel restart with differentcheckpoint durations, ranging from 0.75 minutes to 12 minutes. If the valueof δ grows, so does the checkpoint period τ . That means, a failure will makethe system recover more work. Since parallel recovery benefits of more workto recover, then it has a better contrast to checkpoint/restart. At the extremescale, a checkpoint time of 12 minutes causes checkpoint/restart to collapse,being unable to make progress in that case. Parallel recovery can still finishexecution.
6. Discussion
This paper aims to provide some insight about the interaction betweenfault tolerance and energy consumption. Providing effective resilience at ex-treme scale is imperative. However, different mechanisms show a variety ofpower and energy profiles. These differences help to disprove one traditionalthinking about energy consumption: minimize execution time will minimizeenergy consumption. That statement is not true, at least in a faulty envi-ronment. It heavily depends on what fault tolerance mechanism is in placeand under what conditions. The analytical model presented in Section 3
18

provides the theoretical foundations to understand why. For instance, mes-sage logging incurs performance overhead that may lead to longer executiontimes compared to checkpoint/restart. But, message logging recovers from afailure using a fraction of the energy checkpoint/restart uses. If the failurerate is not too high, message logging may have longer execution time but lessenergy consumed than checkpoint/restart [15].
Despite the fact that message logging techniques (including parallel re-covery) have to deal with message storage and determinism management,these protocols do not significantly increase the power draw. Figure 4 showson the right column the power levels of the three protocols compared inthis paper and there is no evidence message logging draws more power thancheckpoint/restart. The extra operations performed by message logging havean impact on performance, though. That effect is captured by parameter µin the performance model of Section 3. This finding is important to ensuremessage logging and parallel restart will honor the power limitations and notpush the power envelope beyond the capacity of the installation.
The ratio between idle and maximum power plays a crucial role in therelation between execution time and energy consumption. Figure 8(a) showsthe effect on energy consumption of different base to maximum power ratios.Although checkpoint/restart manages to keep relatively the same differencewith respect to parallel recovery, it does it by increasing the checkpoint fre-quency and sacrificing execution time. A smaller value of this ratio benefitsmessage logging and parallel restart, because these two protocols exploit thatratio to decrease energy consumption. Table 5 presents a list of different ar-chitectures and an approximation of their respective ratios. For the Intelchips, we experimentally measured the power levels running Wave2D. TheNVIDIA data can be found elsewhere [23]. The goal to decrease the basepower has been a constant in the design of new chips. That leads to a smallerbase to maximum power ratio that can be better incorporated by messagelogging and parallel recovery. Similarly, a GPU architecture has a small ratioand hybrid architectures (processors and accelerators) will be more appeal-ing to protocols that are based on local recovery. Our performance modeldirectly applies to hybrid architectures.
Figure 7(b) shows the effect of increasing the parallel recovery speedup.This ability comes from the fact that the application can be over-decomposedinto small chunks of work. Parallel programming paradigms that allow thistype of decomposition will be able to accelerate recovery and decrease energyconsumption. What is more important is that the parallelism does not need
19

ArchitectureRelease Base Max Base/MaxDate Power Power Ratio
Intel Xeon E5520 Q1,09 60 125 0.48Intel Nehalem i7 860 Q3,09 52 151 0.34Intel Sandy Bridge i7 2600 Q1,11 21 101 0.21NVIDIA GTX280 Q2,08 56 224 0.25
Table 5: Comparison of base and maximum power for different architectures.
to scale with the system size. In fact, a parallelism degree of 16 seems tobe a good value to provide big benefits. Additional parallelism only brings amarginal benefit.
The type of failures this paper deals with is one-node failures. Althoughthis might look a little restrictive, there is enough evidence a vast majorityof failures only affect one node [4, 24]. A different type of failures thatmay become more relevant in the future is correlated failures, where severalcomponents fail in tandem given the particular architecture of the machine.For instance, nodes plugged to the same power supply will fail together givena failure of the common power supply. These type of considerations canbe incorporated into a message-logging protocol to decrease the protocol’soverhead and further decrease energy consumption [15].
7. Related Work
Literature on the interplay of energy consumption and fault tolerance forHPC is scarce. To the best of our knowledge, the work by Diouri et al [25, 26]is the only related work. In a first study [25], they presented the powerdraw and energy consumption of three building blocks of fault toleranceprotocols: checkpointing, task coordination, and message logging. Theirresults show that neither of these tasks significantly increases the power drawof a node. However, message logging increases the total energy consumed bya program due to the overhead it incurs. Their initial work was later extendedinto ECOFIT [26], a framework for predicting the energy consumption of anapplication using certain fault tolerance protocol on a particular architecture.ECOFIT calibrates the power of each of the four fundamental operations(checkpointing, coordination, logging, and recovery) and then estimates thetotal number of these operations in an execution. They evaluated three typesof protocols: coordinated, uncoordinated and hierarchical.
20

Our philosophy differs from theirs in that we consider coordinated pro-tocols are the most viable way for fault tolerance in HPC. In particular,coordinated application-level checkpoint is supported by most of the faulttolerance libraries available for HPC [3, 4, 12]. The advantages of such check-point variant are a smaller checkpoint size (because often time it is possibleto checkpoint when the state of the application is minimal), and a low cost atcheckpoint (since most HPC applications have global synchronization pointsthat hide the coordination cost). In addition, we emphasize the importanceof recovery, both experimentally and analytically. The more efficient the re-covery, the better the fault tolerance protocol. Parallel recovery is a goodexample of that.
8. Conclusions
This paper presents a comparative evaluation of three rollback-recoverymechanism according to their energy profile. We present an analytical modelto describe the energy consumption of each protocol and to make projectionsfor large-scale systems under different conditions. We also show experimentalresults that support our model predictions.
We conclude the following:• The reasoning minimize execution time will minimize energy consump-tion is invalid in the context of faulty machines. Message logging isa good example of that. It incurs performance overhead due to theadditional function it performs (storing messages and determinants),but recovery is significantly more efficient in energy terms.• Neither message logging nor parallel recovery significantly increase power
draw. Our empirical results support that claim. These protocols may,though, increase energy consumption in a failure-free execution due tothe performance overhead of the message logging protocol.• Parallel recovery can reduce both execution time and energy consump-
tion in a faulty scenario. It achieves that by accelerating recoverythrough parallel re-execution of tasks. In an HPC environment, paral-lel recovery satisfies the requirements of both users (minimum executiontime) and system administrators (minimum energy consumption).• The analytical model predicts a substantial reduction in energy con-
sumption by using parallel recovery. For a large-scale system withmore than 512,000 sockets, parallel recovery will be able to reducethe total energy consumption by more than 37%, compared to check-point/restart.
21

Acknowledgments
This research was supported in part by the US Department of Energyunder grant DOE DE-SC0001845. We thank Prof. Tarek F. Abdelzaher ofthe University of Illinois at Urbana-Champaign for granting us access to thetestbed used in this paper.
References
[1] P. Kogge, K. Bergman, S. Borkar, D. Campbell, W. Carlson, W. Dally,M. Denneau, P. Franzon, W. Harrod, J. Hiller, S. Karp, S. Keckler,D. Klein, R. Lucas, M. Richards, A. Scarpelli, S. Scott, A. Snavely,T. Sterling, R. S. Williams, K. Yelick, Exascale computing study: Tech-nology challenges in achieving exascale systems (2008).
[2] J. Dongarra, P. Beckman, T. Moore, P. Aerts, G. Aloisio, D. Barkai,T. Boku, B. Chapman, X. Chi, A. Choudhary, S. Dosanjh, T. Dun-ning, R. Fiore, A. Geist, R. Harrison, M. Hereld, M. Heroux, K. Hotta,Y. Ishikawa, Z. Jin, F. Johnson, S. Kale, R. Kenway, D. Keyes,B. Kramer, J. Labarta, A. Lichnewsky, B. Lucas, S. Matsuoka,P. Messina, P. Michielse, B. Mohr, M. Mueller, J. Shalf, D. Skinner,M. Snir, T. Sterling, R. Stevens, F. Streitz, B. Sugar, A. V. D. Steen,J. Vetter, P. Williams, R. Wisniewski, K. Yelick, The international ex-ascale software project roadmap 1.
[3] G. Zheng, L. Shi, L. V. Kale, FTC-Charm++: An In-MemoryCheckpoint-Based Fault Tolerant Runtime for Charm++ and MPI, in:2004 IEEE Cluster, San Diego, CA, 2004, pp. 93–103.
[4] A. Moody, G. Bronevetsky, K. Mohror, B. R. de Supinski, Design, mod-eling, and evaluation of a scalable multi-level checkpointing system, in:SC, 2010, pp. 1–11.
[5] E. Meneses, G. Bronevetsky, L. V. Kale, Evaluation of simple causalmessage logging for large-scale fault tolerant HPC systems, in: 16thIEEE Workshop on Dependable Parallel, Distributed and Network-Centric Systems in 25th IEEE International Parallel and DistributedProcessing Symposium (IPDPS 2011)., 2011.
22

[6] S. Chakravorty, L. V. Kale, A fault tolerance protocol with fast faultrecovery, in: Proceedings of the 21st IEEE International Parallel andDistributed Processing Symposium, IEEE Press, 2007.
[7] E. Meneses, O. Sarood, L. V. Kale, Assessing Energy Efficiency of FaultTolerance Protocols for HPC Systems, in: Proceedings of the 2012 IEEE24th International Symposium on Computer Architecture and High Per-formance Computing (SBAC-PAD 2012), New York, USA, 2012.
[8] S. O. Marc Snir, etc, MPI: The Complete Reference, Vol. 1, The MITPress, 1998.
[9] L. Kale, S. Krishnan, CHARM++: A Portable Concurrent Object Ori-ented System Based on C++, in: A. Paepcke (Ed.), Proceedings ofOOPSLA’93, ACM Press, 1993, pp. 91–108.
[10] E. N. Elnozahy, L. Alvisi, Y.-M. Wang, D. B. Johnson, A survey ofrollback-recovery protocols in message-passing systems, ACM Comput.Surv. 34 (3) (2002) 375–408.
[11] P. H. Hargrove, J. C. Duell, Berkeley lab checkpoint/restart (blcr) forlinux clusters, in: SciDAC, 2006.
[12] L. Bautista-Gomez, D. Komatitsch, N. Maruyama, S. Tsuboi, F. Cap-pello, S. Matsuoka, FTI: High performance fault tolerance interface forhybrid systems, in: Supercomputing, 2011, pp. 1 –12.
[13] M. Schulz, Checkpointing, in: Encyclopedia of Parallel Computing,2011, pp. 264–273.
[14] E. N. Elnozahy, R. Bianchini, T. El-Ghazawi, A. Fox, F. Godfrey, A.Hoisie, K. McKinley, R. Melhem, J. S. Plank, P. Ranganathan and J.Simons, System resilience at extreme scale, Defense Advanced ResearchProject Agency (DARPA), Tech. Rep. (2008).
[15] E. Meneses, Scalable message-logging techniques for effective fault tol-erance in HPC applications, Ph.D. thesis, Dept. of Computer Science,University of Illinois, http://charm.cs.uiuc.edu/papers/13-17/ (2013).
[16] R. Strom, S. Yemini, Optimistic recovery in distributed sys-tems, ACM Trans. Comput. Syst. 3 (3) (1985) 204–226.doi:http://doi.acm.org/10.1145/3959.3962.
23

[17] L. Alvisi, K. Marzullo, Message logging: pessimistic, optimistic, andcausal, International Conference on Distributed Computing Systems(1995) 229–236.
[18] M. Bougeret, H. Casanova, M. Rabie, Y. Robert, F. Vivien, Checkpoint-ing strategies for parallel jobs, in: Supercomputing, SC ’11, ACM, NewYork, NY, USA, 2011, pp. 33:1–33:11. doi:10.1145/2063384.2063428.URL http://doi.acm.org/10.1145/2063384.2063428
[19] J. T. Daly, A higher order estimate of the optimum checkpoint intervalfor restart dumps, Future Generation Comp. Syst. 22 (3) (2006) 303–312.
[20] Intel, Intel-64 and IA-32 Architectures Software Developer’s Manual ,Volume 3A and 3B: System Programming Guide, 2011.
[21] L. Kale, S. Krishnan, Charm++ : A Portable Concurrent Object Ori-ented System Based on C++, in: Proceedings of the Conference onObject Oriented Programmi ng Systems, Languages and Applications,1993.
[22] K. Ferreira, J. Stearley, J. H. Laros, III, R. Oldfield, K. Pedretti,R. Brightwell, R. Riesen, P. G. Bridges, D. Arnold, Evaluating the vi-ability of process replication reliability for exascale systems, in: Su-percomputing, ACM, New York, NY, USA, 2011, pp. 44:1–44:12.doi:10.1145/2063384.2063443.URL http://doi.acm.org/10.1145/2063384.2063443
[23] S. Hong, H. Kim, An integrated gpu power and performance model, in:ISCA, 2010, pp. 280–289.
[24] E. Meneses, X. Ni, L. V. Kale, A Message-Logging Protocol for MulticoreSystems, in: Proceedings of the 2nd Workshop on Fault-Tolerance forHPC at Extreme Scale (FTXS), Boston, USA, 2012.
[25] M. Diouri, O. Gluck, L. Lefevre, F. Cappello, Energy considerationsin checkpointing and fault tolerance protocols, in: 2nd Workshop onFault-Tolerance for HPC at Extreme Scale (FTXS 2012), Boston, USA,2012.
24

[26] M. el Mehdi Diouri, O. Gluck, L. Lefevre, F. Cappello, Ecofit: A frame-work to estimate energy consumption of fault tolerance protocols forHPC applications, in: CCGRID, 2013, pp. 522–529.
25