Embed Size (px)
Citation preview

Energy Modelling Lab.Department of Energy Studies,
Energy Systems Division, Ajou University Prof. Suduk Kim
Introduction to the Energy Issues:Starting from Power Sector

Question!
010000011 Byte = 8 bits
ASCII Code
American Standard Code for Information Interchange

Apple II -> Year 1977My First personal Computer, year
1985!!!
1 Byte = 8 bits
X 2^10 1024 Byte = 1KB
48KB
Question! How many times bigger?
USD 1 = KRW 1150USD 214= KRW 247,000

Electric Power & Tariff
How much of electric power to be consumed if this computer is ‘power on’ for one whole month?
150W x 24Hour x 30Days= 108,000Wh= 108kWh
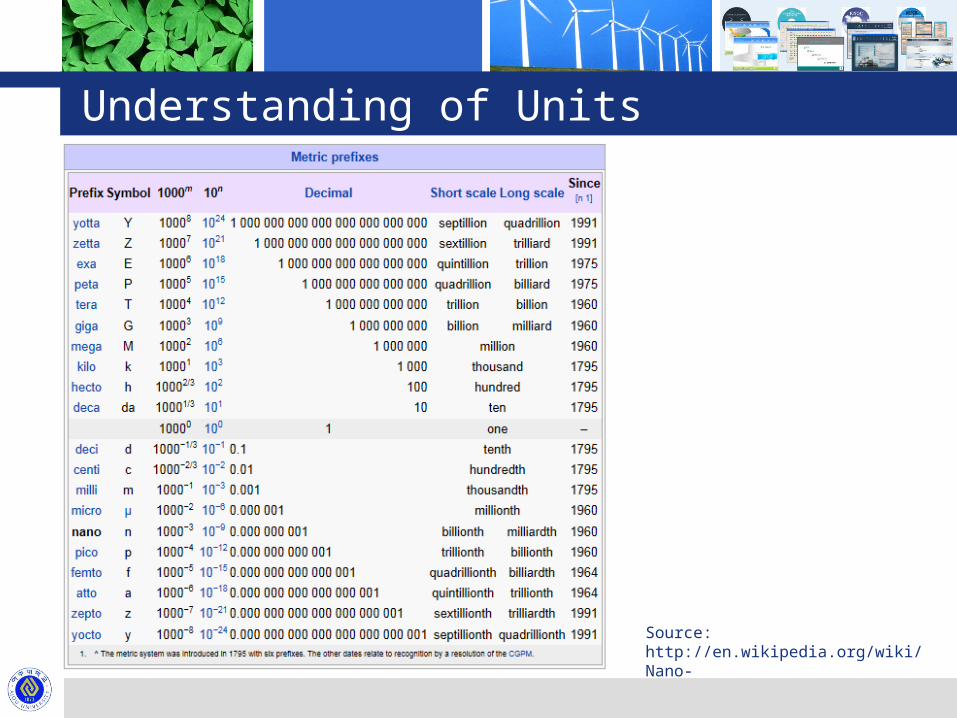
Understanding of Units
Source:http://en.wikipedia.org/wiki/Nano-

Korea Nuclear Power Plants (Kori)
One Nuclear Power Plant Capacity 1GW = 1,000MW = 1,000,000kW

Photovoltaic
77
East Sun Power Gen. Co.-24MW, 0.7Mil m2 , US 200Mil.
1 Nuclear Power Plant => 1GW = 1000MW
24MW x 40 approx. 1000MW
Capacity : to be equivalent to 1 Nuclear Power Plant (x 40 times)-> 28 Mil m2 , US 8,000 Mil. (US 8 Bil.)
Power Generation: to be equivalent to 1 Nuclear Power Plant (x 5 times)
(with capacity factor of 20%, tracking device) -> 140 Mil. m2 , US 40 Bil.
** Still we don’t get power during the night, rainy days,…
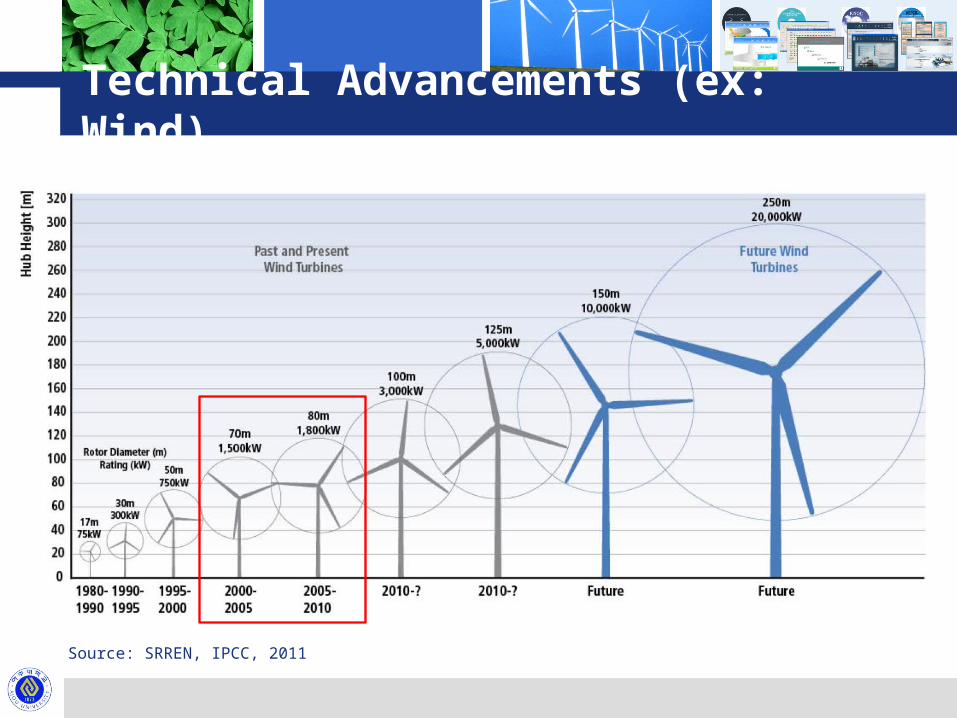
Technical Advancements (ex: Wind)
Source: SRREN, IPCC, 2011

Power Mix Change Since Late 1970s
99
22.38
69.87
52.94
86.12
13.03
35.69
20.50
12.16
26.22
93.66
61.7
77.24
0
10
20
30
40
50
60
70
80
90
100
0
100
200
300
400
500
600
700
1978 1980 1982 1984 1986 1988 1990 1992 1994 1996 1998 2000 2002 2004 2006 2008 2010 2012 2014 2016 2018 2020 2022 2024
TWh
Retail Rate of Electricity (Won/kWh)
Dubai($/barrel)
Coal-fired
Oil-fired
Gas-fired
Nuclear
Renewable and etc.
Planed power generationHistory of power generation
Hydro
Source: Data compiled from KESISNote: Figures after 2010 are projections taken from MKE (2010).

Ilustration of SMP, based on the merit order of March 2010
1010
Load Forecast(Hourly)
Available Capacity(Hourly)
Regulated VC
Hydro Nuclear
Coal LNG
Oil
Variable Cost(Won/kWh)
Power Capacity (MW)
SMP
Q: Is hydropower to be included in this merit order?
Q: Is Hourly load always to be vertical? What if it is not?

1111
- the need to have a framework to facilitate the Demand Response in power market- the Importance of the bilateral information exchange
Economics of Smart Grid (Demand Response)