Embed Size (px)
Citation preview

Pergamon Energy Convers. Mgmt Vol. 38, No. 2, pp. 167-171, 1997
Copyright © 1996 Elsevier Science Ltd Printed in Great Britain. All rights reserved
PII: S0196-890,1(96)00029-5 0196-8904/97 $15.00 + 0.00
E N E R G Y I N E F F I C I E N C Y O F I N D I A N S T E E L I N D U S T R Y
- - S C O P E F O R E N E R G Y C O N S E R V A T I O N
RATNA CHOUDHURY and A. K. BHAKTAVATSALAM Centre for Energy Studies, Indian Institute of Technology, Hauz Khas, New Delhi 110 016, India
(Received 27 March 1995)
Abstract--The steel industry, by its very nature, is highly energy intensive with many heating and cooling, melting and solidification cycles. Typically, the specific energy consumption of Indian steel plants is quoted in the range of 35-50 GJ/tcs, compared to 17-25 GJ/tcs quoted for steel plants in advanced countries. The present paper analyses the reasons for the low level of energy efficiency in Indian steel plants. Certain incorrect notions are placed in proper perspective. Amongst the various technological reasons, the poor quality of coking coal is identified to be the single most important factor for the energy inefficiency of Indian steel plants. The impact of use of good quality coal (10% ash) on the overall specific energy consumption is quantified. Copyright © 1996 Elsevier Science Ltd
Energy efficiency Steel industry Coal ash
I N T R O D U C T I O N
The steel industry by its very nature is highly energy intensive with its many heating and cooling, melting and solidification cycles. The specific energy consumption (SEC) in integrated steel plants (ISPs) is computed per the standardised methodology prescribed by the International Iron and Steel Institute (IISI), Brussels. Typically, the SEC of Indian steel plants is quoted in the range of 35-50 GigaJoules per tonne of crude steel (GJ/tcs); whereas figures quoted for foreign countries are in the range of 17-25 GJ/tcs.
T H E I S S I M E T H O D O L O G Y
The presentation of energy consumption data in the iron and steel industry has been standardised by the IISI. The harmonised system was designed to facilitate maintaining a common base for the purpose of comparison. The energy consumption is expressed in terms of the total energy consumed for the production of one tonne of crude steel, i.e. ingot, continuously cast blooms, billets or slabs. The total energy consumption is obtained by summing the proportionate energy consumption at different stages of processing, i.e. in the coke ovens, sinter plant, blast furnace, steel making, casting etc., which go into the production of one tonne of crude steel. This is achieved by a three step process, viz:
(i) stage-wise input-output analysis of various energies, viz. coal, oil, electricity, coke oven gas, blast furnace gas, oxygen etc., on the basis of per tonne of product of the respective stage. The difference between the total energy input and total energy output of a particular stage is the net energy consumption per tonne of product of that stage.
(ii) for each stage, a balanced production ratio is determined which is the output of the stage product which is required to produce one tonne of crude steel, i.e. it assumes that there are no surpluses or deficiencies and no stocking or destocking of the intermediate product.
(iii) the product of (i) and (ii) above for each stage, is summed to determine the overall SEC for the entire plant on the basis of per tonne of crude steel [1].
All forms of energy used in the steel plant, like coal, oil, gas, steam and electricity, are converted to the thermal energy form by using appropriate conversion factors, and the overall energy consumption is expressed in terms of GigaJoules per tonne of crude steel.
167

168 CHOUDHURY and BHAKTAVATSALAM: ENERGY INEFFICIENCY OF INDIAN STEEL INDUSTRY
Table 1. Table 2. Table 3.
Country SEC (GJ/tcs) ISP route of EAF route of Country SEC (GJ/tpi) Australia 22.9 steel making steel making Australia 18.7 U.K. 19.8 Country (%) (%) U.K. 17.9 U.S.A. 21.4 Australia 99.5 0.5 U.S.A. 20.5 Germany i 9.9 U.K. 74.8 25.2 Japan 16.8 Japan 17.6 U.S.A. 58.0 42.0 India 24-28 Italy 18.9 Germany 82.7 17.3 Spain 15.9 Japan 70.3 29.7 Data for India: Authors' Sweden 19.7 Italy 44.3 55.7 estimates, Others: IISI India 35-50 Spain 40.5 59.5 Data modified for in-
Sweden 51.9 48.1 cluding energy consumed (Source: Ref. [2]) India 81.7 18.3 in coke ovens by adding
4.2 GJ/tpi.
Statement: "The energy consumption level of the Indian steel industry is double that of those in advanced countries".
In support of the statement above, Table 1 is often quoted. However, the reality is that such comparisons are often not in correct perspective and are biased
for the following reasons: (i) The figures presented for foreign countries are averages, encompassing most or all of the
country's steel production. Such national figures also include the electric arc furnace (EAF) route of steel making. The scrap based EAF method of steel production requires considerably less energy than the integrated route, which involves first the reduction of iron ore to pig iron in a blast furnace and then conversion of the pig iron to steel. Thus, on the one hand, the SECs of 17-25 GJ/tcs presented for foreign countries also include the EAF route. On the other hand, 35-50 GJ/tcs are quoted for India which includes only the integrated steel plants.
In order to estimate the extent of bias arising from inclusion of the EAF route, an analysis was made on the percentage of the different routes of steel making in different countries, which is presented in Table 2.
If we assume that the SEC of the EAF route in India is 12 GJ/tcs, and the average SEC of Indian ISPs is 38 GJ/tcs, the country average (weighted) for India is 33 GJ/tcs. Further, a comparison of the energy consumption data per tonne of pig iron of the integrated route (i.e. including coke ovens, sinter plant and blast furnace) reveals that the SECs in Indian ISPs are higher only by 17-35% compared to the U.S.A. and 43-67% compared to Japan, where ISPs are known to be the most energy efficient.
(ii) A steel plant is described as an integrated steel plant when it follows the coke ovens-sinter plant-blast furnace-steel making-steel rolling route and, further, when most or all of the intermediate products and services are produced within a common boundary wall of a plant.
Thus, the various products of an ISP include coke, sinter, pig iron, steel, oxygen, steam, calcined lime, dolomite, refractory materials, power, compressed air, and by-products such as slag from the blast furnace (BF) and basic oxygen furnace (BOF), ammonium sulphate, crude benzol/benzol products (such as benzene, toluene, xylene), crude tar/tar products (such as anthracene, naphthalene, creosote oil, tar etc.). The ISPs in India are truly integrated, as they produce all the aforementioned products. On the contrary, many of the integrated steel plants abroad do not have facilities like an oxygen plant, lime calcination plant, coke oven batteries, captive power plant etc. integrated with the steel plant. These items are purchased from outside sources. The energy consumption of these facilities does not get counted. For instance, in the SEC computation for selected foreign countries quoted in Table 1, coke making has been excluded by definition [2]. Although coke, coke oven gas etc. are treated as purchased energies and are counted as inputs, the energy consumption of the coke making process does not get counted. Typically, the contribution of the coke making process to the overall SEC in the Indian ISPs is circa 6 GJ/tcs.
TECHNOLOGICAL BACKWARDNESS
Although the Indian ISPs were constructed with the latest technologies available, continuous technological upgradation has not been undertaken, and consequently, the Indian ISPs are caught
CHOUDHURY and BHAKTAVATSALAM: ENE/~GY INEFFICIENCY OF INDIAN STEEL INDUSTRY 169
Table 4. Table 5.
CC technology BOF OH Country (%) Indian ISPs (%) (%)
Australia 25 SAIL (average) 60 40 U.K. 71 TISCO 52 48 U.S.A. 61 VSP 100 0 Germany 89 Japan 93 Italy 93 Spain 75 Sweden 83 India
SAIL (average) 15 TISCO 23 VSP 100
SAIL: Steel Authority of India Limited, TISCO: Tata Iron and Steel Company, VSP: Vizag Steel Plant under Rashtriya Ispat Nigam Limited.
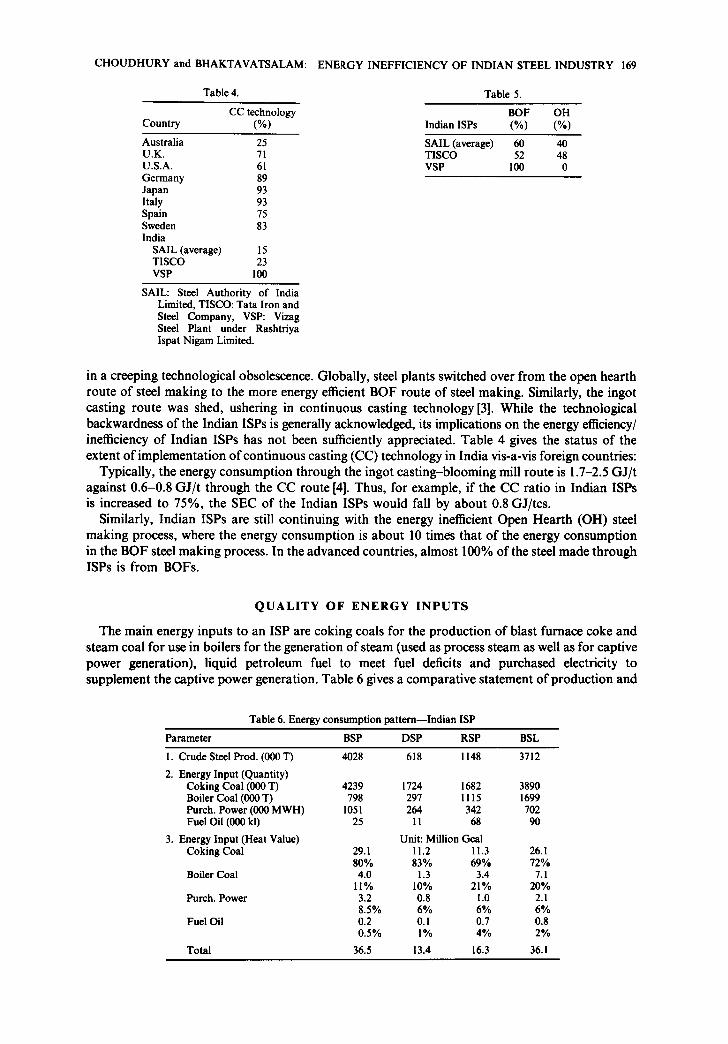
in a creeping technological obsolescence. Globally, steel plants switched over from the open hearth route of steel making to the more energy efficient BOF route of steel making. Similarly, the ingot casting route was shed, ushering in continuous casting technology [3]. While the technological backwardness of the Indian ISPs is generally acknowledged, its implications on the energy efficiency/ inefficiency of Indian ISPs has not been sufficiently appreciated. Table 4 gives the status of the extent of implementation of continuous casting (CC) technology in India vis-a-vis foreign countries:
Typically, the energy consumption through the ingot casting-blooming mill route is 1.7-2.5 GJ/ t against 0.6-0.8 GJ/ t through the CC route [4]. Thus, for example, if the CC ratio in Indian ISPs is increased to 75%, the SEC of the Indian ISPs would fall by about 0.8 GJ/tcs.
Similarly, Indian ISPs are still continuing with the energy inefficient Open Hearth (OH) steel making process, where the energy consumption is about 10 times that of the energy consumption in the BOF steel making process. In the advanced countries, almost 100% of the steel made through ISPs is from BOFs.
Q U A L I T Y OF ENERGY I N P U T S
The main energy inputs to an ISP are coking coals for the production of blast furnace coke and steam coal for use in boilers for the generation of steam (used as process steam as well as for captive power generation), liquid petroleum fuel to meet fuel deficits and purchased electricity to supplement the captive power generation. Table 6 gives a comparative statement of production and
Table 6. Energy consumption pattern--Indian ISP
Parameter BSP DSP RSP BSL
1. Crude Steel Prod. (000 T) 4028 618 1148 3712
2. Energy Input (Quantity) Coking Coal (000 T) 4239 1724 1682 3890 Boiler Coal (000 T) 798 297 1115 1699 Purch. Power (000 MWH) 1051 264 342 702 Fuel Oil (000 kl) 25 i I 68 90
3. Energy Input (Heat Value) Unit: Million Gcai Coking Coal 29.1 I 1.2 11.3 26.1
80% 83% 69% 72% 4.0 1.3 3.4 7.1
11% 10% 21% 20% 3.2 0.8 1.0 2.1 8.5% 6% 6% 6% 0.2 0.1 0.7 0.8 0.5% 1% 4% 2%
36.5 13.4 16.3 36.1
Boiler Coal
Purch. Power
Fuel Oil
Total

170 CHOUDHURY and BHAKTAVATSALAM: ENERGY INEFFICIENCY OF INDIAN gTEEL INDUSTRY
Energy consumption pattern Indian 1SPs
Coking coal 75.8%
Fuel oil 1.8%
Purch. power 6.9%
Boiler coal 15.5%
Fig. 1. Energy consumption pattern of Indian ISPs.
energy inputs in terms of quantity and in terms of heat value for four leading Indian ISPs, viz. Bhilai Steel Plant (BSP), Durgapur Steel Plant (DSP), Rourkela Steel Plant (RSP) and Bokaro Steel Plant (BSL). Analysis of Table 6 reveals that coal (both coking and boiler grade) is the single largest form of energy input, at over 90%. Figure 1 is a pie diagram representation of the energy inputs (average) for the four ISPs under study.
With coal forming over 90% of the energy input in the Indian ISPs, it is logical to expect that the characteristics of the coal used in Indian ISPs should explain the high SECs in Indian plants, compared to the ISPs in developed countries.
Data regarding the ash content of the coking coal used in the four ISPs under study over the last 10 years is presented in Table 7.
The average ash content of the coking coals used in Indian ISPs is in the range of 15-22%. Compared to this, the ash content of coking coals used in foreign countries is usually less than 10%. The SEC of an ISP is mainly determined by the coke rate in the iron making process. The coke rate, defined as kilograms of coke consumed per tonne of pig iron (kg/tpi) [9] produced, is directly related to the ash content in the coke which, in turn, is directly related to the ash content in the coal.
Table 8 presents the data on fuel rate as achieved in foreign countries vis-a-vis Indian ISPs.
Table 8.
Country Fuel rate* (kg/tpi)
Australia 473 Table 7. % ash in the blend coking coal U.K. 508
Year BSP [5] DSP [6] RSP [7] BSL [8] U.S.A. 540 Germany 516
93-94 16.5 19.6 17.4 17.0 Japan 508 92-93 16.5 20.0 17.7 16.9 Italy 469 91-92 15.9 19.4 17.5 16.9 Spain 521 90-91 15.4 18.0 17.2 16.8 Sweden 458 89-90 15.6 18.6 17.0 21.8 India 88-89 15.4 19.7 16.9 16.9 SAIL (average) 680 87-88 16.7 19.5 17.0 17.8 TISCO [I0] 640 86-87 16.7 20.3 17.6 17.8 VSP[II] 563 85-86 17.1 21.3 18.3 18.4 84-85 19.3 20.4 20.0 20.0 *Includes injection of auxiliary fuels
such as oil and coal in blast furnace.

CHOUDHURY and BHAKTAVATSALAM: ENERGY INEFFICIENCY OF INDIAN STEEL INDUSTRY 171
Table 9.
Parameter Initial Final 1 Final 2
Coal ash (%) 20.0 15.0 10.0 Coke ash (%) 26.7 20.0 13.3 Coke rate (kg/tpi) 650 577 518 Slag volume (kg/tpi) 400 200 100 Reduction in the overall SEC (GJ/tcs) about 2 4
As can be observed from Table 8, the fuel rate is in the range of 458-540 kg/tpi; compared to this, the fuel rate in the Indian ISPs is in the range of 560-850 kg/tpi. The lowest is at VSP, where about three-quarters of the coking coal used is good quality imported coal. Thus, the high ash content in coking coal leads to high fuel rate in the blast furnace which, in turn, leads to a high SEC in Indian ISPs.
The reduction in the sensible heat carried away by the reduced quantity of slag formed because of lower ash in the coke (13.3 against 26.7%), considering a sensible heat of 350 kcal/kg for slag, amounts to over 100 Mcal/tpi. The slag volume is estimated to go down to one-quarter [12].
The following results were obtained using a computer model developed for evaluating the SEC of ISPs.
The change in coal ash level from 20 to 10% resulted in the changes shown in Table 9 in the other energy related parameters. Volatile matter content was assumed to be constant at 25%.
Thus, the poor quality of coal used is a major factor in the energy inefficiency of Indian ISPs.
RESULTS AND C O N C L U S I O N S
(i) The SEC of Indian ISPs is high compared to those in advanced countries. However, it is not twice as high, as is often projected.
(ii) The SEC data of foreign countries, as available in the literature, are to be used with abundant caution, as they are often country averages which include different routes of steel making.
(iii) The level of integration in Indian ISPs is much more than the level of integration in ISPs in foreign countries. Often units like coke oven batteries, oxygen plant etc. are not integrated with the steel plant, and consequently, the energy consumption in these units/processes do not get counted.
(iv) Though the technological backwardness of Indian ISPs is recognised, its impact and contribution to the energy inefficiency of Indian ISPs has not been sufficiently assessed and appreciated.
(v) Coal forms over 90% of the energy input in Indian ISPs. The poor quality of input energy in Indian ISPs, especially coal, seriously hampers the iron and steel making process and results in higher SECs. Sensitivity analysis of the ash content in coking coal reveals that every one percent variation in coal ash results in an approximately commensurate variation in the overall SEC of an integrated steel plant.
REFERENCES
1. Energy and the Steel Industry. Committee on Technology, International Iron and Steel Institute, Brussels (1982). 2. Statistics on Energy in the Steel Industry (1990 Update). Committee on Statistics, International Iron and Steel Institute,
Brussels (1990). 3. Energy Conservation in SAIL. Research and Development Centre for Iron and Steel, Ranchi (1991). 4. Energy Data for Steel Plants--1993--94. Energy Conservation Group, Research and Development Centre for Iron and
Steel, Ranchi (1991). 5. Annual Statistics 1993-94. Bhilai Steel Plant, Bhilai (1994). 6. Annual Statistics 1993-94. Durgapur Steel Plant, Durgapur (1994). 7. Annual Statistics 1993-94. Rourkela Steel Plant, Rourkela (1994). 8. Annual Statistics 1993-94. Bokaro Steel Plant, Bokaro (1994). 9. The Climate Change Agenda: An Indian Perspective--Strategies to Limit the Emissions of CO 2 in the Indian Coal
Intensive Sectors: A Scenario Analysis. Tata Energy Research Institute, New Delhi (1994). 10. Plant Performance Data 1993-94. Tata Iron and Steel Company, Jamshedpur (1994). il. Annual Statistics 1993-94. Vizag Steel Plant, Vizag (1994). 12. A. K. Biswas, Principles o f Blast Furnace lronmaking. Cootha Publishing House, Brisbane, Australia (1981).
ECM 38/2--D