Embed Size (px)
Citation preview

Energy in the Arab Region
RReeggiioonnaall CCoooorrddIIssssuueess BBrriieeff ffoorr tth
AArraabb SSuussttaaiinnaa
Energy in the Arab Region
rddiinnaattiioonn MMeecchhaanniissmm ((RRthhee
aabbllee DDeevveellooppmmeenntt RRee
Energy in the Arab Region
2015
RRCCMM))
eeppoorrtt

1 | P a g e
Authors: Habib El Andaloussi ([email protected])
Chief of Energy Section, Sustainable Development Policies Division, Economic and Social Commission for
Western Asia (ESCWA)
Lara Geadah ([email protected])
Research Assistant, Energy Section, Sustainable Development Policies Division, Economic and Social
Commission for Western Asia (ESCWA)
Reviewed by: UNEP United Nations Environment Programme
UNDP United Nations Development Programme
UNHABITAT United Nations Human Settlements Programme
ESCWA Economic and Social Commission for Western Asia
Disclaimer: This issues brief was prepared as a background document for the forthcoming Arab Sustainable
Development Report. The views expressed are those of the authors and do not necessarily reflect the views of
the United Nations. Document issued as received, without formal editing.
2 | P a g e
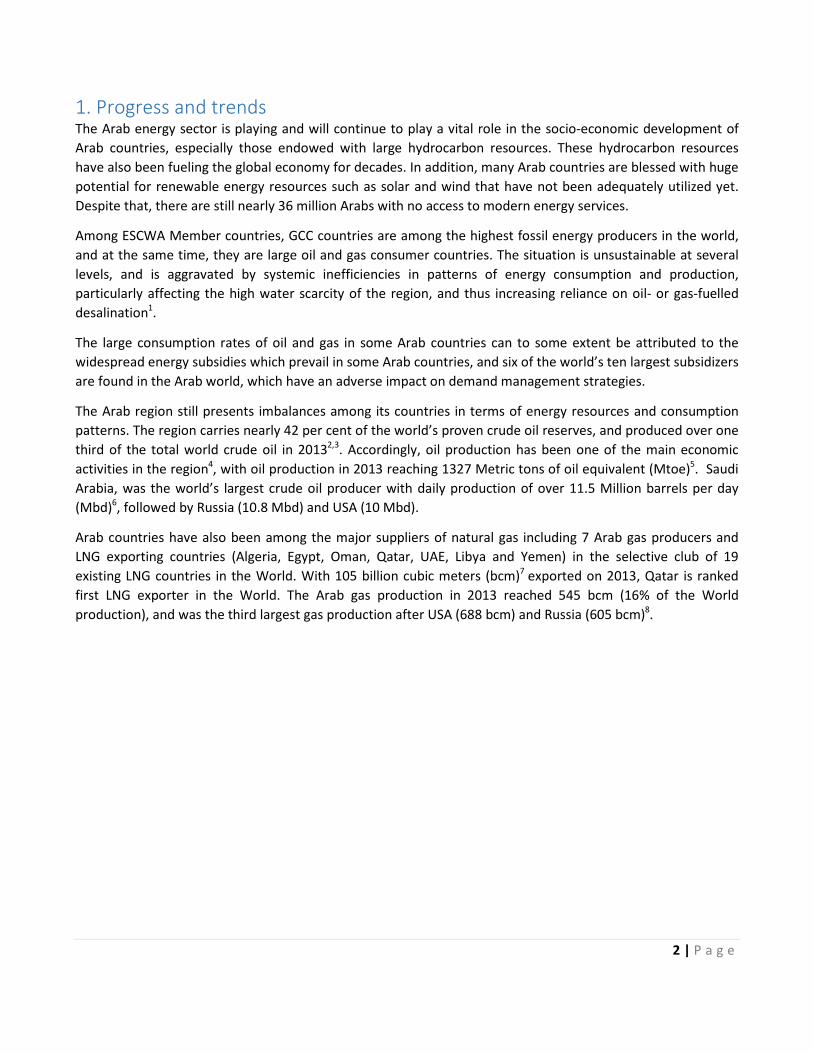
1. Progress and trends The Arab energy sector is playing and will continue to play a vital role in the socio-economic development of
Arab countries, especially those endowed with large hydrocarbon resources. These hydrocarbon resources
have also been fueling the global economy for decades. In addition, many Arab countries are blessed with huge
potential for renewable energy resources such as solar and wind that have not been adequately utilized yet.
Despite that, there are still nearly 36 million Arabs with no access to modern energy services.
Among ESCWA Member countries, GCC countries are among the highest fossil energy producers in the world,
and at the same time, they are large oil and gas consumer countries. The situation is unsustainable at several
levels, and is aggravated by systemic inefficiencies in patterns of energy consumption and production,
particularly affecting the high water scarcity of the region, and thus increasing reliance on oil- or gas-fuelled
desalination1.
The large consumption rates of oil and gas in some Arab countries can to some extent be attributed to the
widespread energy subsidies which prevail in some Arab countries, and six of the world’s ten largest subsidizers
are found in the Arab world, which have an adverse impact on demand management strategies.
The Arab region still presents imbalances among its countries in terms of energy resources and consumption
patterns. The region carries nearly 42 per cent of the world’s proven crude oil reserves, and produced over one
third of the total world crude oil in 20132,3. Accordingly, oil production has been one of the main economic
activities in the region4, with oil production in 2013 reaching 1327 Metric tons of oil equivalent (Mtoe)5. Saudi
Arabia, was the world’s largest crude oil producer with daily production of over 11.5 Million barrels per day
(Mbd)6, followed by Russia (10.8 Mbd) and USA (10 Mbd).
Arab countries have also been among the major suppliers of natural gas including 7 Arab gas producers and
LNG exporting countries (Algeria, Egypt, Oman, Qatar, UAE, Libya and Yemen) in the selective club of 19
existing LNG countries in the World. With 105 billion cubic meters (bcm)7 exported on 2013, Qatar is ranked
first LNG exporter in the World. The Arab gas production in 2013 reached 545 bcm (16% of the World
production), and was the third largest gas production after USA (688 bcm) and Russia (605 bcm)8.

3 | P a g e
FIGURE 1 PRIMARY ENERGY PRODUCTION AND CONSUMPTION (1971-2011, GTOE)
Source: Sketched by ESCWA/SDPD based on IEA data, non-OECD energy balances 2013
Energy consumption from hydrocarbons is significantly increasing. The oil and natural gas consumption rose
strongly at 5.9% per year for oil and 8.5% per year for gas during the period 1971 to 2011, reaching 306 Metric
Tons of Oil Equivalent (Mtoe)9 and 281 Mtoe respectively (source IEA 2013). In the coming years, some Arab
countries will suffer from the inability to meet growing electricity demand which is estimated to increase by
115% by 2024, from 969 TWh in 2013 to 2084 TWh by 2024. More than 35% of total primary energy is
consumed in electricity generation (96% of which from oil and gas), with the knock-on environmental impacts
of CO2 and other emissions contributing to climate change and deteriorating air quality)10
.
0
200
400
600
800
1000
1200
1400
1600
1800
1972
1973
1974
1975
1976
1977
1978
1979
1980
1981
1982
1983
1984
1985
1986
1987
1988
1989
1990
1991
1992
1993
1994
1995
1996
1997
1998
1999
2000
2001
2002
2003
2004
2005
2006
2007
2008
2009
2010
2011
2012
Arab O&G Production - Mtoe- Arab O&G Consumption -Mtoe-

4 | P a g e
FIGURE 2 ARAB OIL AND GAS CONSUMPTION (1971-2011)
Source: Sketched by ESCWA/SDPD based on IEA data, non-OECD energy balances 2013
The rural electrification rate differs widely in the Arab countries, as around half of the countries have access
rates above 90%, while the remaining countries’ access rates are still less than 50%11. Additionally, some 12%
of ESCWA region’s population does not have access to modern energy services, and about 15% of the
population suffers from a lack of supply of electricity, most of which is in rural remote areas. The lack of energy
services usually aggravates the cycle of extreme poverty in the majority of rural areas in developing countries,
resulting in poor socio-economic conditions12. In Yemen and Sudan for instance, about 48 % and 65.5 % of the
population respectively does not have access to electricity or is served intermittently13 . Despite the
improvement in energy access in the region, the region is not homogeneous in terms of energy access, as the
group of high-income oil producers has an average energy access rate of 99.5%, the upper-middle and middle-
income countries have an energy access rate of around 99%, while the third group of low-income countries
such as Yemen and Sudan, has an average access rate of about 43%.14
The average energy use per capita in the Arab region was somewhat close to the world average of
approximately 1,764 Kilogram of Oil Equivalent (kgoe) per capita for 201115, however Arab countries show
great heterogeneity in energy consumption patterns. Countries in the Gulf reported between 3.5 to 9.4 times
higher levels of energy use than the world average, while most countries in the Mashreq and Maghreb used
less energy than the world average except for Libya16. The per capita energy consumption in GCC countries is
among the highest in the world, ranging between 7080 Kgoe/capita to 18490 Kgoe/capita17. In particular,
Yemen and Sudan consumed less than one fifth of the world average with energy use of only 293 kgoe and 372
kgoe per capita respectively.18
For the whole Arab region, energy intensity increased from 134 kgoe/thousand 2005 USD in 1971, to 422
kgoe/thousand 2005 USD in 2011 with a growth rate of 2.9%19. While energy intensity has been decreasing in
0
50
100
150
200
250
300
350
1971
1972
1973
1974
1975
1976
1977
1978
1979
1980
1981
1982
1983
1984
1985
1986
1987
1988
1989
1990
1991
1992
1993
1994
1995
1996
1997
1998
1999
2000
2001
2002
2003
2004
2005
2006
2007
2008
2009
2010
2011
in M
to
e
Oil Natural Gas

5 | P a g e
Bahrain and Qatar from the 1990’s, other GCC countries have seen their energy intensity increase, particularly
Saudi Arabia20. Energy intensity has increased in the Arab region over the last few decades, while all other
regions have shown a major decrease in energy intensity.21
TABLE 1 PERCENTAGE OF POPULATION WITH ACCESS TO ELECTRICITY (2007 TILL 2013)
Country 2007 2008 2009 2010 2011 2012 2013
SUDAN 32 _ _ 25.0 27.8 34.0 34.5
YEMEN 47.0 47.0 50.0 52.0 52.0 52.0 52.0
ALGERIA _ _ _ _ 98.7 99.0 99.0
BAHRAIN _ _ 100.0 _ 100.0 _ _
EGYPT 99 _ 99.0 99.3 99.3 99.3 99.0
IRAQ _ _ _ _ _ _ _
JORDAN 99.9 99.9 99.9 99.9 99.9 99.9 99.9
KUWAIT _ _ _ 89 89 89 89
LEBANON _ _ 99 99 99 99 99
LIBYA 99 99 99 99 99 _ 99
MOROCCO 95 95 99 _ _ _ _
OMAN _ _ _ _ _ _ _
PALESTINE _ 99.0 99.0 99.8 99.0 99.5 99.5
QATAR _ _ 100 100 _ 100 100
SAUDI ARABIA 98.0 99.2 99.4 99.5 99.5 99.5 99.5
SYRIA _ 99.9 99.9 99.9 99.9 99.9 99.9
TUNISIA 99.4 99.5 99.5 99.5 99.5 99.5 99.5
UAE 100 100 100 100 100 100 100
Source: Arab Union of Electricity (2013, 2012, 2011, 2010, 2009, 2008, 2007)
The residential and service sectors represent an important part of the total energy consumption, and forecasts
indicate that electricity demand is set to rise in the near future. Such high electrical demands by the domestic
sector are often being satisfied at the expense of productive sectors, which are crucial for development. As
such, there’s a need to improve energy efficiency in the residential and services sectors through up-scaling
energy efficiency programs and related Green Building codes and consideration to reducing subsidies for
domestic consumption as part of demand management strategies which reinforce the security and
sustainability of energy supply22. Figure 4 below shows that growth in energy consumption and demand for
electricity in the region are outstripping both the population and GDP growth rates, highlighting an
unsustainable trend for the region.
This figure 4 also indicates that when economic growth has been multiplied by 5 since the year 1971, current
electricity and energy consumption have been multiplied by 35 and 12 respectively.

6 | P a g e
FIGURE 3 ENERGY AND ELECTRICITY CONSUMPTION IN THE ARAB REGION
Source: Sketched by ESCWA/SDPD based on IEA data, non-OECD 2013
FIGURE 4 INDICES OF ENERGY, ELECTRICITY, POPULATION AND GDP GROWTH
Source: Sketched by ESCWA/SDPD based on IEA data, non-OECD energy balances 2013
0
100
200
300
400
500
600
700
800
900
1971
1972
1973
1974
1975
1976
1977
1978
1979
1980
1981
1982
1983
1984
1985
1986
1987
1988
1989
1990
1991
1992
1993
1994
1995
1996
1997
1998
1999
2000
2001
2002
2003
2004
2005
2006
2007
2008
2009
2010
2011
Energy Consumption Mtoe Electricity TWh
0
500
1000
1500
2000
2500
3000
3500
1971
1972
1973
1974
1975
1976
1977
1978
1979
1989
1981
1982
1983
1984
1985
1986
1987
1988
1989
1990
1991
1992
1993
1994
1995
1996
1997
1998
1999
2000
2001
2002
2003
2004
2005
2006
2007
2008
2009
2010
2011
Energy Cons. (1971=100)- growth rate 6.4%
Electricity (1971=100) - growth rate 9.2%
Pop. (1971=100) - growth rate 2.6%
GDP (1971=100)- growth rate 3.4%

FIGURE 5 PER CAPITA ENERGY AND ELECTRICITY
Source: Sketched by ESCWA/SDPD based on IEA
FIGURE 6 ENERGY INTENSITY IN THE ARAB REGION
Source: Sketched by ESCWA/SDPD based on IEA
Renewable energy resources could play a major role in improving energy access and eradicating poverty. The
energy challenge can only be addressed through sound energy mix policies at national and regional levels,
where Renewable Energy (RE) and Energy Efficiency (EE) strategies and tools represent the cornerstone of the
energy mix.23
0
400
800
1200
1600
2000
2400
2800
1971 1975
Energy cons./capita (kgoe/cap)
0.000
0.050
0.100
0.150
0.200
0.250
0.300
0.350
0.400
0.450
1971 1980
Energy Intensity (toe/per
thousand 2005 USD)
Energy Intensity (toe/per
thousand 2005 USD ppp)
LECTRICITY CONSUMPTION IN THE ARAB REGION
IEA data, non-OECD energy balances 2013
EGION
IEA data, non-OECD energy balances 2013
Renewable energy resources could play a major role in improving energy access and eradicating poverty. The
addressed through sound energy mix policies at national and regional levels,
where Renewable Energy (RE) and Energy Efficiency (EE) strategies and tools represent the cornerstone of the
1980 1985 1990 1995 2000
Energy cons./capita (kgoe/cap) Electricity/capita (kWh/cap)
1980 1990 2000
Energy Intensity (toe/per
thousand 2005 USD)
Energy Intensity (toe/per
thousand 2005 USD ppp)
7 | P a g e
Renewable energy resources could play a major role in improving energy access and eradicating poverty. The
addressed through sound energy mix policies at national and regional levels,
where Renewable Energy (RE) and Energy Efficiency (EE) strategies and tools represent the cornerstone of the
2005 2011
2011

8 | P a g e
The adoption of the “Pan-Arab Strategy for the Development of Renewable Energy Applications: 2010 – 2030”
by the 3rd Arab Economic and Social Development Summit of January 2013 represents an important milestone
for the deployment of renewable energy technologies (RETs) in the region with a focus on electricity
generation. For the first time, Arab governments have come to a consensus on long-term targets for RET
deployment in the region. Based on the approved national targets, the strategy includes cumulative targets to
increase renewable energy that translate into about more than 117 gigawatts (GW) of installed power
generation capacity in the Arab countries by 2020-203224, which represents about 25% of the installed capacity
in this period25. In support of the strategy realization, the Energy Department of the League of Arab States
recently introduced the Arab Renewable Energy Framework (AREF) to provide guidance to member states in
developing their medium to long-term national renewable energy action plans (NREAP). Despite the Arab
region’s rich endowment of renewable energy resources, its installed base of RETs remains limited, and the
share of renewables (including large- scale hydro) in installed electricity capacity was about 5.3% or about 12
GW. In addition, total solar water heating installed capacity reached 3.3 Gigawatt thermal (GWth). Hydropower
currently stands at 5% of the installed capacity for electricity generation in the Arab region. In terms of
generation, it represents around 3.44%. There are 9.8 GW of installed hydro capacity in Arab countries, 2.8 GW
of which are in Egypt26, whereas Iraq, Morocco, Sudan and Syria account for over 1.6 GW of hydropower
each27.
TABLE 2 INSTALLED RENEWABLE ENERGY CAPACITY IN ARAB COUNTRIES (MW, END 2014)
Source: from direct interviews and/or from national publications, annual reports and PPP in workshops, as well as other sources as
MENA renewable status report, REN 21, IRENA, LAS, 2013
Countries/ Energy (MW) PV CSP Wind Biomass & Waste Hydro Total
Algeria 7.1 25 10 0 228 270 Egypt 15.0 20 550 0 2800 3385 Iraq 3.5 0 0 0 1864 1868 Libya 4.8 0 0 0 0 5
Syria 0.8 0 0 0 1151 1152 Djibouti 1.4 0 0 0 0 1 Jordan 1.6 0 1.4 4 10 17 Lebanon 1.0 0 0.5 0 282 284 Morocco 15.0 20 787 0 1745 2567 Palestine 1.0 0 0 0 0 1 Tunisia 4.0 0 214 0 66 284 Sudan 2 0 0 55 1590 1648 Bahrain 5.0 0 0.5 0 0 6
Kuwait 1.8 0 0 0 0 2 Oman 0.7 0 0 0 0 1 Qatar 1.2 0 0 40 0 41 S.Arabia 7.0 0 0 0 0 7
UAE 22.5 100 0 3 0 126 Yemen 1.5 0 0 0 0 2 Mauritania 15.0
48 63 Arab
Countries 112 165 1 563 102 9784 11 726
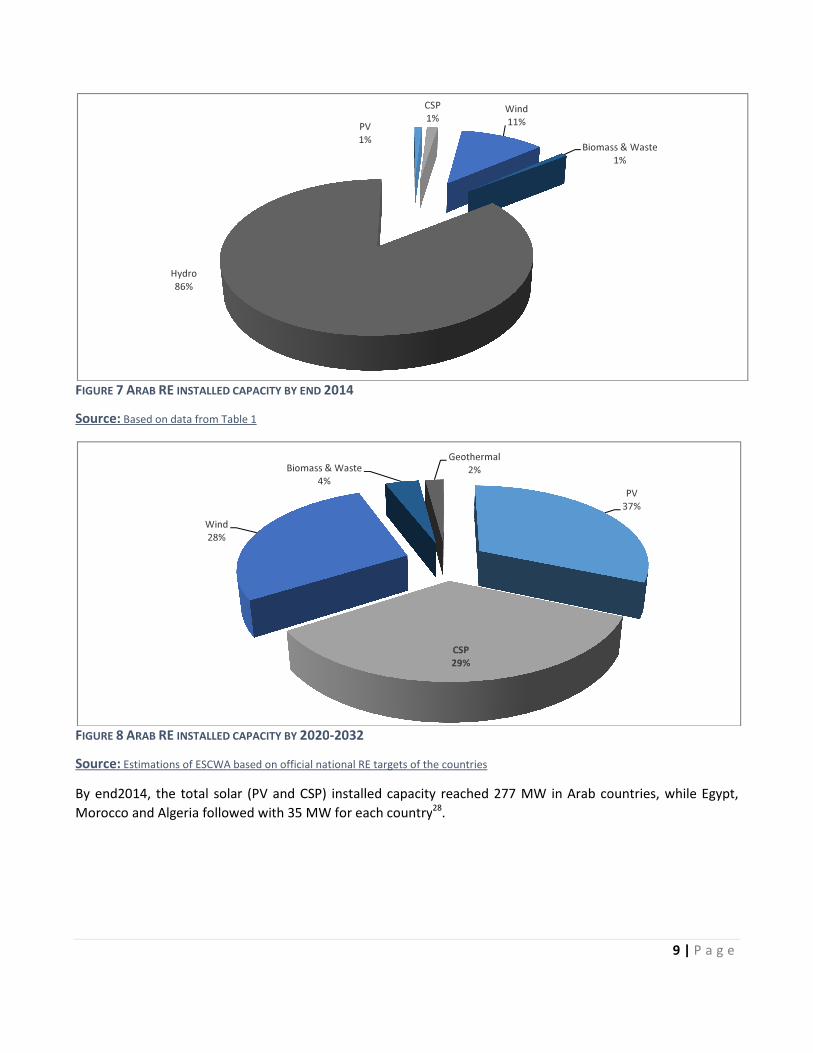
FIGURE 7 ARAB RE INSTALLED CAPACITY BY END
Source: Based on data from Table 1
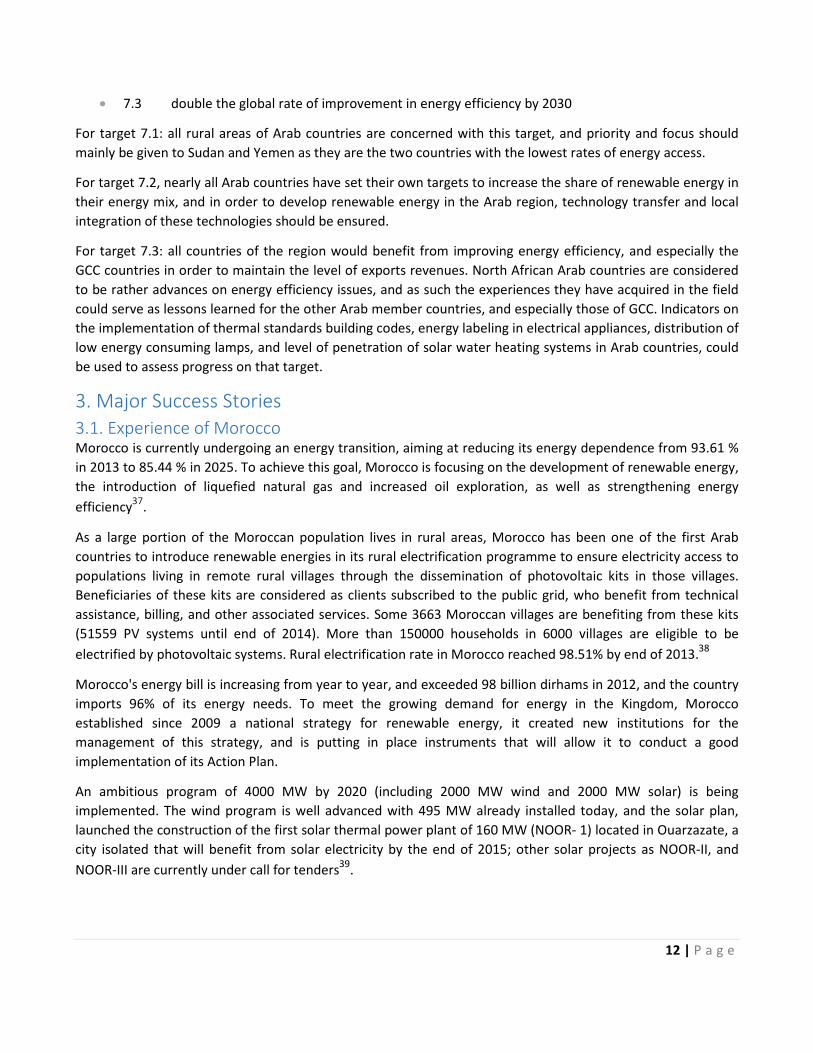
FIGURE 8 ARAB RE INSTALLED CAPACITY BY 2020
Source: Estimations of ESCWA based on official national RE targets of the countries
By end2014, the total solar (PV and CSP) installed capacity reached
Morocco and Algeria followed with 35 MW for each country
Hydro
86%
Wind
28%
Biomass & Waste
Y END 2014
2020-2032
Estimations of ESCWA based on official national RE targets of the countries
2014, the total solar (PV and CSP) installed capacity reached 277 MW in Arab countries, while Egypt,
Morocco and Algeria followed with 35 MW for each country28
.
PV
1%
CSP
1%Wind
11%
Biomass & Waste
CSP
29%
Biomass & Waste
4%
Geothermal
2%
9 | P a g e
countries, while Egypt,
Biomass & Waste
1%
PV
37%

FIGURE 9 INSTALLED CAPACITY BY TYPE OF GENERATIO
Source: Sketched by ESCWA/SDPD based on estimations from 2 tables page 4 (MW installed by technology) and page 6 (fuel inputs) of
the Issue no. 22 of the Arab Union of Electricity (2013)
The Arab countries’ RE market hasn’t reached its full potential, and there
through pipeline projects and increasing political commitments, and if the current efforts are continued
investments and progress should follow and lead to massive introduction of renewables
The total RE installed capacity of power generation in the Arab region, was about
(including hydro). Meanwhile the total existing installed capacity of renewable energy
about 112 MW for PV systems, 165 MW for CSP,
The estimated total capacity based on the national RE targets is about 107 GW planned between 2020 and
2032 (42.6 GW PV, 32.8 GW CSP, 32.8 GW wind,
Regarding renewable energy projects’ pipeline, most
renewable power projects. Twenty Arab states have announced renewable energy targets. Most of these
targets represent fractions of electricity generation or installed capacity. However, in the cases of J
Mauritania and Syria, the targets represent fractions of primary energy consumption. Morocco’s clean power
target of 42% installed capacity by 2020 stands out as the most ambitious target in the Arab region. Algeria,
Egypt, Qatar, Saudi Arabia, and Tunisia have also announced ambitious targets in excess of 20% of electricity
generated for different horizons. Fourteen Arab states have committed to one or more technology
targets. These targets reveal a regional focus on solar rather than wind
targets are more than double the wind targets. Among solar technologies, CSP’s targets are almost 40% higher
than PV targets. Targets for other renewable energy technologies such as geothermal and waste
substantially lower than solar or wind.
BY TYPE OF GENERATION FOR 2013
Sketched by ESCWA/SDPD based on estimations from 2 tables page 4 (MW installed by technology) and page 6 (fuel inputs) of
the Issue no. 22 of the Arab Union of Electricity (2013)
The Arab countries’ RE market hasn’t reached its full potential, and there are promising signs of development
through pipeline projects and increasing political commitments, and if the current efforts are continued
investments and progress should follow and lead to massive introduction of renewables29
city of power generation in the Arab region, was about
(including hydro). Meanwhile the total existing installed capacity of renewable energy at the
about 112 MW for PV systems, 165 MW for CSP, 1563 MW for wind farms and 102 for biomass.
The estimated total capacity based on the national RE targets is about 107 GW planned between 2020 and
GW wind, 5.0 GW biomass, 2.2 GW geothermal)31
.
Regarding renewable energy projects’ pipeline, most Arab states are procuring significant utility
renewable power projects. Twenty Arab states have announced renewable energy targets. Most of these
targets represent fractions of electricity generation or installed capacity. However, in the cases of J
Mauritania and Syria, the targets represent fractions of primary energy consumption. Morocco’s clean power
target of 42% installed capacity by 2020 stands out as the most ambitious target in the Arab region. Algeria,
Tunisia have also announced ambitious targets in excess of 20% of electricity
generated for different horizons. Fourteen Arab states have committed to one or more technology
targets. These targets reveal a regional focus on solar rather than wind technologies. The combined CSP and PV
targets are more than double the wind targets. Among solar technologies, CSP’s targets are almost 40% higher
than PV targets. Targets for other renewable energy technologies such as geothermal and waste 32
Natural Gas, 60%
Oil, 34%
Coal, 1.0%
Hydro, 4.6% Wind, 0.5%
, 0Solar, 0.1%
10 | P a g e
Sketched by ESCWA/SDPD based on estimations from 2 tables page 4 (MW installed by technology) and page 6 (fuel inputs) of
are promising signs of development
through pipeline projects and increasing political commitments, and if the current efforts are continued 29
.
city of power generation in the Arab region, was about 11726 MW by 2014
at the end of 2014, was
102 for biomass.30
The estimated total capacity based on the national RE targets is about 107 GW planned between 2020 and
Arab states are procuring significant utility-scale
renewable power projects. Twenty Arab states have announced renewable energy targets. Most of these
targets represent fractions of electricity generation or installed capacity. However, in the cases of Jordan,
Mauritania and Syria, the targets represent fractions of primary energy consumption. Morocco’s clean power
target of 42% installed capacity by 2020 stands out as the most ambitious target in the Arab region. Algeria,
Tunisia have also announced ambitious targets in excess of 20% of electricity
generated for different horizons. Fourteen Arab states have committed to one or more technology-specific
technologies. The combined CSP and PV
targets are more than double the wind targets. Among solar technologies, CSP’s targets are almost 40% higher
than PV targets. Targets for other renewable energy technologies such as geothermal and waste-to-energy are

11 | P a g e
2. Analysis of Proposed SDG and Targets from an Arab Perspective In the aftermath of Rio+20’s Conference, “Sustainable Energy for All” emerged as an important development
Agenda. ESCWA and the UN and other regional organizations have initiated a series of consultations with a
large group of stakeholders to position energy issues within the energy mix, the water-energy-food nexus, and
put it high on the global debate on Sustainable Development Goals (SDGs)33
.
There are clear interactions between water, food and energy that may result in synergies or trade-offs
between different sectors or interest groups. It is thus important to understand the synergies and tradeoffs in
order to develop response options to ensure the sustainability of the environment and people’s livelihoods. By
highlighting these interdependences, the Nexus concept highlights the need to view water, energy and food
not as being separate, but as being complex and inextricably entwined34
.
Stressing the need for a coherent, integrated approach to energy issues and the promotion of synergies across
the global energy agenda for sustainable development, the General Assembly, in its resolution 67/215, decided
to declare 2014-2024 the United Nations Decade of Sustainable Energy for All, to be promoted through all
sources of energy. Access to energy sources has been a major driver of development in industrialized countries
and emerging economies. Energy helps to eradicate poverty, increase food production, provide clean water,
improve public health, enhance education, address climate change, create economic opportunity and
empower young people and women. Nevertheless, the “energy-poor” suffer the health consequences of
inefficient combustion of solid fuels in inadequately ventilated buildings, which kills around four million people
a year, most of them women and children, as well as the economic consequences of insufficient power for
productive income-generating activities and for other basic services, such as health and education. In
particular, women and girls in the developing world are disproportionately affected in that regard. In response
to the 2010 declaration by the General Assembly of 2012 as the International Year of Sustainable Energy for All,
the Secretary-General launched the Sustainable Energy for All initiative in 2011. The initiative seeks to support
the objective of sustainable energy for all by identifying and mobilizing action by all stakeholders in support of
a major global transformation of energy systems. The initiative seeks to ensure sustainable energy for all by
2030 through the achievement of three major objectives: (a) ensuring universal access to modern energy
services; (b) doubling the rate of improvement in energy efficiency; and (c) doubling the share of renewable
energy in the global energy mix35
.
Sustainable energy provides new opportunities for growth. It enables businesses to grow, generates jobs, and
creates new markets. Children can study after dark, clinics can store life-saving vaccines, and countries can
grow more resilient, with competitive economies. With sustainable energy, countries can build the clean
energy economies of the future. Sustainable energy for all is an investment in our collective future. Universal
energy access, increasing the use of renewable energy, improved energy efficiency and addressing the nexus
between energy and health, women, food, water and other development issues are at the heart of all
countries’ core interest, which must be deeply integrated in the development agenda36.
Regarding the proposed SDG 7: Ensure access to affordable, reliable, sustainable, and modern energy for all
and its related targets:
• 7.1 by 2030 ensure universal access to affordable, reliable, and modern energy services
• 7.2 increase substantially the share of renewable energy in the global energy mix by 2030
12 | P a g e
• 7.3 double the global rate of improvement in energy efficiency by 2030
For target 7.1: all rural areas of Arab countries are concerned with this target, and priority and focus should
mainly be given to Sudan and Yemen as they are the two countries with the lowest rates of energy access.
For target 7.2, nearly all Arab countries have set their own targets to increase the share of renewable energy in
their energy mix, and in order to develop renewable energy in the Arab region, technology transfer and local
integration of these technologies should be ensured.
For target 7.3: all countries of the region would benefit from improving energy efficiency, and especially the
GCC countries in order to maintain the level of exports revenues. North African Arab countries are considered
to be rather advances on energy efficiency issues, and as such the experiences they have acquired in the field
could serve as lessons learned for the other Arab member countries, and especially those of GCC. Indicators on
the implementation of thermal standards building codes, energy labeling in electrical appliances, distribution of
low energy consuming lamps, and level of penetration of solar water heating systems in Arab countries, could
be used to assess progress on that target.
3. Major Success Stories
3.1. Experience of Morocco Morocco is currently undergoing an energy transition, aiming at reducing its energy dependence from 93.61 %
in 2013 to 85.44 % in 2025. To achieve this goal, Morocco is focusing on the development of renewable energy,
the introduction of liquefied natural gas and increased oil exploration, as well as strengthening energy
efficiency37
.
As a large portion of the Moroccan population lives in rural areas, Morocco has been one of the first Arab
countries to introduce renewable energies in its rural electrification programme to ensure electricity access to
populations living in remote rural villages through the dissemination of photovoltaic kits in those villages.
Beneficiaries of these kits are considered as clients subscribed to the public grid, who benefit from technical
assistance, billing, and other associated services. Some 3663 Moroccan villages are benefiting from these kits
(51559 PV systems until end of 2014). More than 150000 households in 6000 villages are eligible to be
electrified by photovoltaic systems. Rural electrification rate in Morocco reached 98.51% by end of 2013.38
Morocco's energy bill is increasing from year to year, and exceeded 98 billion dirhams in 2012, and the country
imports 96% of its energy needs. To meet the growing demand for energy in the Kingdom, Morocco
established since 2009 a national strategy for renewable energy, it created new institutions for the
management of this strategy, and is putting in place instruments that will allow it to conduct a good
implementation of its Action Plan.
An ambitious program of 4000 MW by 2020 (including 2000 MW wind and 2000 MW solar) is being
implemented. The wind program is well advanced with 495 MW already installed today, and the solar plan,
launched the construction of the first solar thermal power plant of 160 MW (NOOR- 1) located in Ouarzazate, a
city isolated that will benefit from solar electricity by the end of 2015; other solar projects as NOOR-II, and
NOOR-III are currently under call for tenders39
.

13 | P a g e
The Moroccan Solar Plan will enable the emergence of low-carbon and climate-friendly technology in Morocco,
as well as reducing energy imports. In addition, the project will create job opportunities and promote an
integrated local solar industry40
.
Concerning the solar programme, although Morocco only had one 20 MW operational plant as of 2014, it has
163 MW under construction and 300 MW under development. Moreover, it is worth noting that the country
achieved its 2012 target of supplying 8% of total energy from renewables. The Moroccan Markets Report
forecasts that the country will have between 440 MW and 2,303 MW of installed CSP capacity by 2025, largely
driven by the need for energy independence and security. On the other hand, decreasing freshwater resources
and ongoing exploration for unconventional fossil fuels may negatively affect the speed at which CSP is
deployed in Morocco.41
3.2. Experience of Tunisia The Tunisian government has proper institutional framework and the expertise to implement energy efficiency
improvement projects. The establishment of the National Fund for Energy Conservation (FNME) in 2005 was a
fundamental step forward for financing energy efficiency projects as well as renewable energy and energy
substitution, and this indicates the will of Tunisian government to improve energy efficiency. FNME has
resulted in great success, and contributed to the saving of $745 Million in energy expenditure through the
support of $102 Million, which shows a clear multiplier effect.
Improvement of energy efficiency in the country will actually help to reduce the negative impacts of energy
subsidy reform in many ways. Investment for energy efficiency projects will create and provide green jobs to
many Tunisians particularly to the youth. It will encourage more efficient use of energy and thus contribute to
reduce the impact of rising energy prices on household budget and on inflation. As such, current proposal is
timely and relevant to prevent the expected negative impacts of planned energy subsidy reform on the general
public and to contribute to the successful transition of Tunisian government’s financial problems.
The implementation cost of energy efficiency program 2005-2011 was $102 Million and allowed: (i) Reduction
of energy consumption by 878 000 toe; and (ii) Saving $745 million from the energy subsidy bill expenditure42
.
4. References • AFED (Arab Forum for Environment and Development), 2013, “Arab Environment 6: Sustainable
Energy”, Report of the Arab Forum for Environment and Development”/ ESCWA’s thematic session on
“Sustainable Energy in the GCC countries: is Energy Intensity a useful tool for GCC
countries?”ESCWA/SDD, 07 - Chapter-VII Energy 2014 and BP Statistical Review 2014 for no ESCWA
MCsBP Statistical Review 2014
• Calculated by ESCWA from World Bank, World Development Indicator
• ESCWA(2013), Survey of economic and social developments in the Arab region
• IEA data, 2013
• The Pan-Arab Renewable Energy Strategy 2030, LAS and IRENA and RCREEE
• Info note of Morocco meeting, Nov 2013
• Arab Union of Electricity, 2013
• Technical paper on EU-GCC energy cooperation, Dr. Emanuela Menichetti, OME, 17 January 2013
• ESCWA’s concept note on up-scaling energy efficiency in the residential and services sector
14 | P a g e
• REN21, 2013. MENA Renewables Status Report. REN 21, “Renewables 2014, Global Status Report”
• Walking the Nexus Talk: Assessing the Water-Energy-Food Nexus, in the Context of the Sustainable
Energy for All Initiative, FAO, 2014
• Report of the Secretary-General, A/69/395
• Sustainable energy for all website
• E/ESCWA/SDPD/2013/Booklet.1, Green Economy Initiatives Success Stories and Lessons Learned in the
Arab Region 21 February 2013
• From speech of his Excellency the Moroccan Minister of energy, mines, water and the environment Mr.
Abdelkader Amara at the Forum organized on 28 October 2014 on the subject of “Is Morocco at the
Eve of and Energy Transition?”
• ONE website Morocco, Office National de l’Electricité et de l’Eau Potable
• ESCWA’s Workshop, Tunis, 14-15 April 2014 on “Enabling Policies for Financing Energy Efficiency
Investments”, PPP on “Politique de l'Efficacité Energétique en Tunisie” by ANME
• CSP Today Markets Reports Series 2015
• BP Statistical Review 2014
• ESCWA/SDD, 07 - Chapter-VII Energy 2014
• Arab Human Development Report, Energy Subsidies in the Arab World, UNDP’s Regional Bureau for
Arab States, Research Paper Series, 2012, Bassam Fattouh & Laura El-Katiri
Flagship Publications: • E/ESCWA/SDPD/2013/IG.2/5, “The adoption and application of renewable energy technologies in the
ESCWA region”, June 2013
• E/ESCWA/SDPD/2012/2, “The role of renewable energy in climate change mitigation in the ESCWA
region”, Oct. 2012, • E/ESCWA/SDPD/2011/WG5/2, “Local manufacturing of solar and wind energies equipment to produce
electricity in the Arab region: potential and prospects”
• AREX Report from RCREEE
• Pan-Arab RE Strategy 2030: Roadmap of Actions for Implementation
• LAS, Arab Strategy for the Development of RE Applications 2010-2030, published in 2013
• AFED (Arab Forum for Environment and Development), 2013, “Arab Environment 6: Sustainable
Energy”, Report of the Arab Forum for Environment and Development”/ ESCWA’s thematic session on
“Sustainable Energy in the GCC countries: is Energy Intensity a useful tool for GCC countries?”
• ESCWA’s Statistical Abstract, Energy Data Chapter
• Arab Union of Electricity, 2014, Statistical Bulletin 2013
• IEA (International Energy Agency), 2013, Energy Balances in Non-OECD Countries
• LAS, 2014, Guidebook for RE and EE in Arab Countries
• RCREEE, 2013, Arab Future Energy Index: Renewable Energy
• RCREEE, 2013, Country Profiles
• REN 21, 2013, MENA RE Status Report REN 21,
• REN 21, “Renewables 2014, Global Status Report”REN21, Global Status report 2013, Saving Oil and Gas
in the Gulf, A Chatham House Report, by Glada Lahn, Paul Stevens and Felix Preston, August 2013

15 | P a g e
Note: In some figures given in this brief, the total given for the Arab region covers 18 over 22 Arab countries.43
5. Endnotes 1 AFED (Arab Forum for Environment and Development), 2013, “Arab Environment 6: Sustainable Energy”, Report of the Arab Forum for
Environment and Development”/ ESCWA’s thematic session on “Sustainable Energy in the GCC countries: is Energy Intensity a useful
tool for GCC countries?” 2 Arab Human Development Report, Energy Subsidies in the Arab World, UNDP’s Regional Bureau for Arab States, Research Paper
Series, 2012, Bassam Fattouh & Laura El-Katiri 3 ESCWA/SDD, 07 - Chapter-VII Energy 2014 and BP Statistical Review 2014 for no ESCWA MCs
4 Calculated by ESCWA from World Bank, World Development Indicator, and ESCWA(2013), Survey of economic and social
developments in the Arab region 5 BP Statistical Review 2014
6 BP Statistical Review 2014
7 1 Billion cubic meter (bcm)=1 Million ton of oil equivalent (Mtoe) approximately
8ESCWA/SDD, 07 - Chapter-VII Energy 2014 + BP Statistical Review 2014
9 1bcm=1 Mtoe approximately
10 Arab Union of Electricity, 2013
11 The Pan-Arab Renewable Energy Strategy 2030, LAS and IRENA and RCREEE
12 ESCWA, Information note of Morocco meeting, November 2013
13 Issue no. 22 of the Arab Union of Electricity (2013)
14 Issue no. 22 of the Arab Union of Electricity (2013)
15 IEA data, 2013
16 World Bank, World Development Indicators
17 IEA data, 2013
18 IEA data, 2013
19 IEA data, 2013
20 Technical paper on EU-GCC energy cooperation, Dr. Emanuela Menichetti, OME, 17 January 2013
21 World Bank, World Development Indicators
22 ESCWA’s concept note on up-scaling energy efficiency in the residential and services sector
23 AFED (Arab Forum for Environment and Development), 2013, “Arab Environment 6: Sustainable Energy”, Report of the Arab Forum
for Environment and Development”/ ESCWA’s thematic session on “Sustainable Energy in the GCC countries: is Energy Intensity a useful
tool for GCC countries?” 24
Estimation of ESCWA based on the national RE targets of Member countries 25
Based on Issue no. 22 of the Arab Union of Electricity (2013) 26
Arab Union of Electricity, 2013 27
Pan-Arab Renewable Energy Strategy 2030, LAS and IRENA and RCREEE 28
Information collected from direct interviews and/or from national publications, annual reports and PPP in workshops, as well as other
sources as MENA renewable status report, REN 21, IRENA, LAS, 2013 29
Arab Environment, 6, sustainable energy, prospects, challenges, and opportunities, AFED, 2013 30
Information collected from direct interviews and/or from national publications, annual reports and PPP in workshops, as well as other
sources as MENA renewable status report, REN 21, IRENA, LAS, 2013 31
Estimations of ESCWA by the author based on official national RE targets of the countries 32
Pan-Arab Renewable Energy Strategy 2030, LAS and IRENA and RCREEE 33
AFED (Arab Forum for Environment and Development), 2013, “Arab Environment 6: Sustainable Energy”, Report of the Arab Forum
for Environment and Development”/ ESCWA’s thematic session on “Sustainable Energy in the GCC countries: is Energy Intensity a useful
tool for GCC countries?” 34
Walking the Nexus Talk: Assessing the Water-Energy-Food Nexus, in the Context of the Sustainable Energy for All Initiative, FAO, 2014 35
Report of the Secretary-General, A/69/395 36
Sustainable energy for all website 37
From speech of his Excellency the Moroccan Minister of energy, mines, water and the environment Mr. Abdelkader Amara at the
Forum organized on 28 October 2014 on the subject of “Is Morocco at the Eve of and Energy Transition?” 38
ONE website Morocco, Office National de l’Electricité et de l’Eau Potable 39
CSP Today Markets Reports Series, 2015 40
Green Economy Initiatives Success Stories and Lessons Learned in the Arab Region, E/ESCWA/SDPD/2013/Booklet.1, 21 February 2013

16 | P a g e
41
CSP Today Markets Reports Series 2015 42
ESCWA’s Workshop, Tunis, 14-15 April 2014 on ‘’ Enabling Policies for Financing Energy Efficiency Investments”, PPP on ‘’Politique de
l'Efficacité Energétique en Tunisie’’ by ANME 43
The Arab region includes 22 countries. The Arab region referred to herein sometimes does not include figures for Palestine, Djibouti,
the Comoros and Mauritania.