Embed Size (px)
Citation preview

“Energy in the Americas”
Woodrow Wilson Center
1
Ambassador Carlos Pascual Special Envoy and Coordinator for
International Energy Affairs U.S. Department of State
May 11, 2012

Bureau of Energy Resources (ENR) Sustainable, Affordable, Reliable, Access to Diverse Energy Supplies
Wealth/Power/Influence
Market Dynamics
Energy Frontiers
Spare Capacity
Private and Donor Finance Innovation & Investment Access to Electricity/ Regional Interconnection Tariffs and Regulations Renewable/Efficient/Clean Technology
Resources: Budgets/People
Energy Poverty
Markets Amid Poverty
Entrepreneurship/Innovation
2
Managing the Geopolitics of Energy
Stimulate Markets for Energy Transformation
Transparency , Governance, and Access to Energy

0
100
200
300
400
500
600
700
800
900
2005 2006 2007 2008 2010 2015 2020 2025 2030 2035
Tota
l Prim
ary
Ener
gy
Qua
drill
ion
Btu
Total Non-OECD
Total OECD
United States
Canada
China
India
World Energy Consumption, 1990-2035
Source: U.S. Energy Information Administration, AEO 2011 3

0
20
40
60
80
100
120
2005 2006 2007 2008 2010 2015 2020 2025 2030 2035
Mill
ion
Barr
els P
er D
ay
0
20
40
60
80
100
120
2005 2006 2007 2008 2010 2015 2020 2025 2030 2035
Mill
ion
Barr
els P
er D
ay
0
20
40
60
80
100
120
2005 2006 2007 2008 2010 2015 2020 2025 2030 2035
Mill
ion
Barr
els P
er D
ay
0
20
40
60
80
100
120
2005 2006 2007 2008 2010 2015 2020 2025 2030 2035
Mill
ion
Barr
els P
er D
ay
Dozens of Others
Angola
Mexico
Nigeria
South Sudan/Sudan
Venezuela
Brazil
Canada
Iraq
Libya
United States
China
Russia
Saudi Arabia0
20
40
60
80
100
120
2005 2006 2007 2008 2010 2015 2020 2025 2030 2035
Mill
ion
Barr
els P
er D
ay
United States
China
Russia
Saudi Arabia0
20
40
60
80
100
120
2005 2006 2007 2008 2010 2015 2020 2025 2030 2035
Mill
ion
Barr
els P
er D
ay
Brazil
Canada
Iraq
Libya
United States
China
Russia
Saudi Arabia0
20
40
60
80
100
120
2005 2006 2007 2008 2010 2015 2020 2025 2030 2035
Mill
ion
Barr
els P
er D
ay
Angola
Mexico
Nigeria
South Sudan/Sudan
Venezuela
Brazil
Canada
Iraq
Libya
United States
China
Russia
Saudi Arabia4
Spare Capacity
Challenges to Oil Market Stability
Source: U.S. Energy Information Administration, IEO 2011
Field Depletion
Global Production
Annual U.S. Oil Production, 1990-2011
Source: U.S. Energy Information Administration
Million barrels per day
5

U.S. Oil Production from Shale Formations
6
0
100,000
200,000
300,000
400,000
500,000
600,000
700,000
800,000
900,000
2000 2002 2004 2006 2008 2010 2012
Barr
els p
er D
ay
Eagle Ford
Bakken
Granite Wash
Bonespring
Monterey
Woodford
Niobrara
Spraberry
Austin Chalk
Source: HPDI, Texas RRC, North Dakota department of mineral resources, and EIA, through February 2012;

U.S. Liquid Fuels Supply
7 Source: U.S. Energy Information Administration, AEO 2012
25
20
15
10
5
0
1970 1980 1990 2000 2010 2020 2030
36%
Net petroleum imports
Consumption
Domestic supply Mill
ion
barr
els p
er d
ay
2011
45% 60%
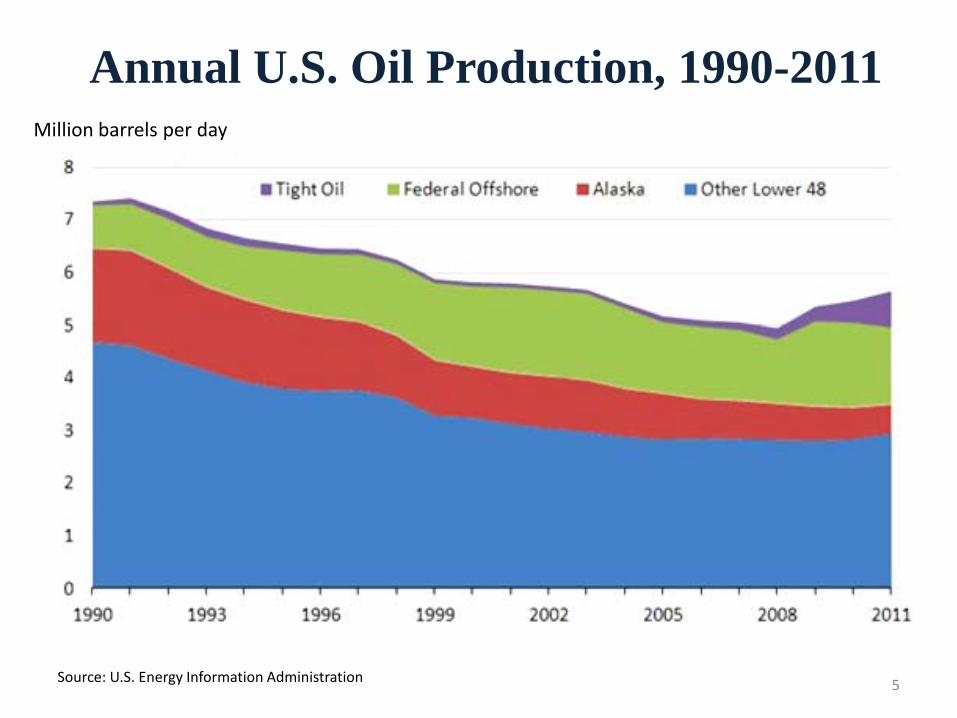
The Americas Supply ¼ of the World’s Oil
8
WHA, 25%*
Europe & Eurasia,
22%
Middle East, 31%
Africa, 12%
Asia Pacific,
10%
Global Oil Production, 2010

Western Hemisphere Producers, 2007-2015
Estimated increase of 1.5-2 mb/d over the time period 9
0.0
0.5
1.0
1.5
2.0
2.5
3.0
3.5
4.0
4.5
2007 2008 2009 2010 2011 2012 2013 2014 2015
mill
ion
barr
els p
er d
ay Canada
Brazil
Mexico
Venezuela
Colombia
Argentina
Ecuador

U.S. Petroleum Imports from Top 15 Suppliers
Total ~ 10,000 barrels per day, 2011
Canada 27%
Latin America 21%
Mexico 12%
Africa 16%
Saudi Arabia 12%
Middle East 6%
Russia 6%

U.S. Production By Fuel, 1980-2035
Source: U.S. Energy Information Administration, AE0 2012 11
30
1980 1990 2000 2010 2020 2035
Qua
drill
ion
Btu
20
10
0
2010 Projections History
Coal
Natural Gas
Nonhydro renewables Liquids
Nuclear
Hydropower
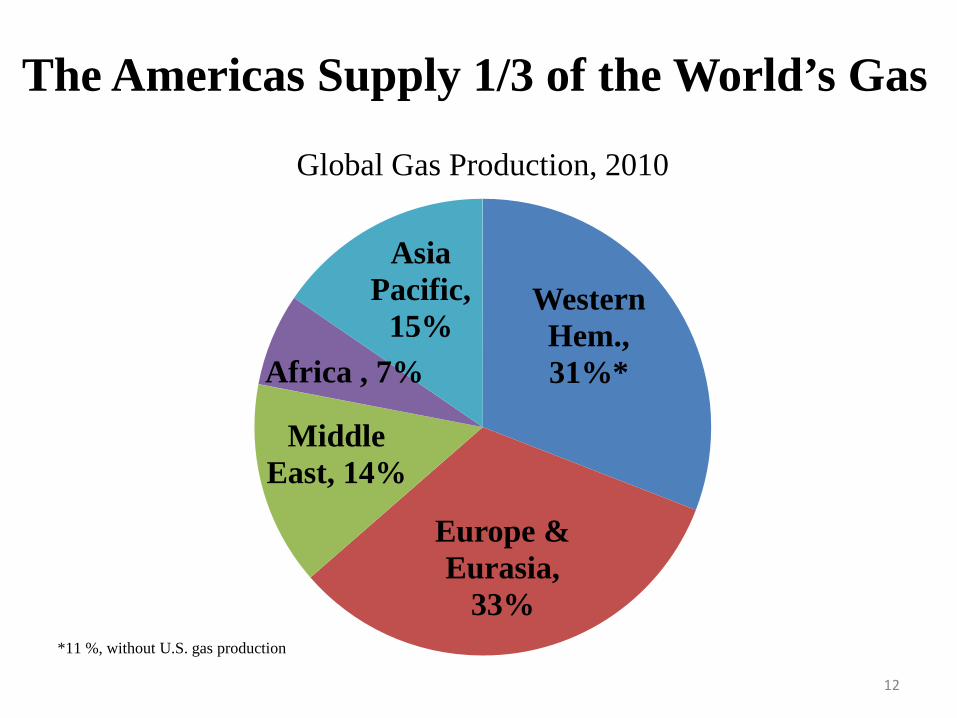
The Americas Supply 1/3 of the World’s Gas
12
Western Hem., 31%*
Europe & Eurasia,
33%
Middle East, 14%
Africa , 7%
Asia Pacific,
15%
Global Gas Production, 2010
*11 %, without U.S. gas production
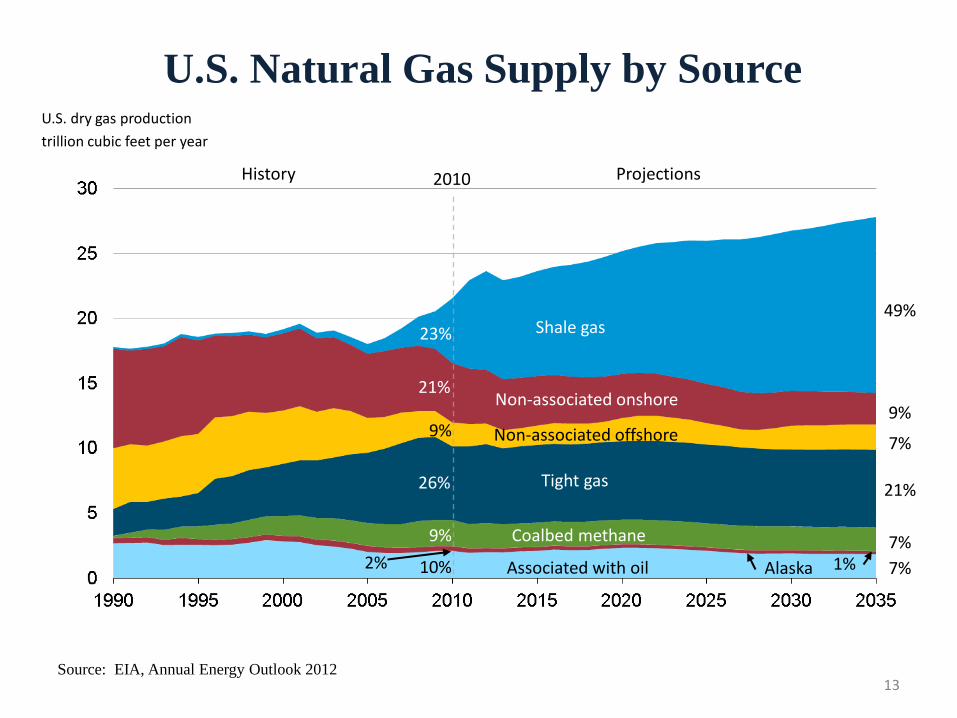
U.S. Natural Gas Supply by Source
Source: EIA, Annual Energy Outlook 2012 13
U.S. dry gas production trillion cubic feet per year
2%
Non-associated offshore
Projections History
Associated with oil
Coalbed methane
Non-associated onshore
Shale gas
2010
10% 7%
9% 7%
21%
23%
9%
9%
7%
49%
Alaska 1%
Tight gas 26% 21%

U.S. Shale Gas Production, 2000-2011
Source: EIA, Lippman Consulting (2010 estimated)
Trillion cubic feet
14

U.S. Secretary of Energy Advisory Board (SEAB) Select Recommendations to Improve Environmental Performance
U.S. federal agencies • Improve transparency in shale gas operations • Measure & disclose air emissions from development • Disclosure of chemicals used in hydraulic fracturing fluid • Fund R&D to increase safety and efficiency U.S. state agencies • Establish standards for waste water disposal • Measure and test groundwater Public-private partnerships or mechanisms • Comprehensive engagement with all stakeholders • Establish process to share best practices
• FracFocus: website on chemicals transparency
• STRONGER: evaluates and shares state regulatory policies 15

Foreign Investment in U.S. Shale Gas & Oil Plays
16

0
4
8
12
2009 2014 2019 2024 2029 2034
Projected U.S. Shale Gas Production, 2009-2035 Trillion cubic feet
Production by well vintage
17

Global Shale Gas Basins & Possible Resources
18

0
10
20
30
40
50
60
2000 2005 2010 2015 2020 2025
Indonesia
Australia
Pakistan
India
China
South Africa
Morocco
Algeria
Western Europe
Ukraine
Baltics
Poland
Southern Cone
Venezuela/Colombia
Mexico
Canada
US
Trillion cubic feet
Possible Impact on Global Gas Market
19
Key Assumptions • Recoverable resources one-quarter of EIA estimates • Environmental, regulatory, legal & policy measures in place • Production ramp up similar to U.S. Barnett shale play • Ultimate recovery per well & drilling rates similar to Barnett

World Gas Trade & Landed LNG Prices (April 2012)
Henry Hub $2.22/MMBtu
UK $9.01/MMBtu
Japan & South Korea $15.25/MMBtu
India $13.65/MMBtu

21
Evolving Global Gas Trade Dynamics: LNG preferred
Source: BP Statistical Review of World Energy

Other renewables
0
1 000
2 000
3 000
4 000
5 000
1980 1990 2000 2010 2020 2030
Mto
e Oil
Coal
Biomass
Nuclear
Gas
Hydro
2035
World Primary Energy Demand by Fuel in the IEA’s GAS Scenario
22
This is Not a Sustainable Future
650 ppm CO2 concentration
3.5°C rise in global temperatures
Response:
Reconfigure the Global Fuel Mix
Incorporate New Technologies and Energy Efficiency
Develop Commercial Markets for Clean Tech; Strong Power Markets

Demand-side Energy Efficiency has Greatest Potential for CO2 Emissions Reduction
23

The World at Night
24
New York State Population: 19.5 million Electricity Generation: ~40 Gigawatts Consumption per capita: 2,050 kWh
Sub-Saharan Africa (excluding South Africa) Population: 791 million Electricity Generation: ~40 Gigawatts Consumption per capita: 52 kWh

25
2011 2030
2.7 Billion
Investment for Access: 3% of total investment needed by 2030
$1.5 Trillion
$48 Billion
1.3 Billion
People Investment

The Americas Need Power Investment to Support Economic Growth
26 Source: IDB

Energy Poverty: Access and Affordability 93% electrified, but 31 million citizens without access
27
Barbados: consumer tariff $.32/kWh (2010)
Guadeloupe: France subsidizes to Paris price of $.11/kWh (2010)
Jamaica: Generation costs $.24/kWh and $.39/kWh residential consumer price (2011)
Mexico: average residential tariff $.09/kWh (2010)
Chile: residential tariff $.18/kWh (2011)
Central America: SIEPAC to enter full operation in 2012, with potential savings of 10-15% in the average generation cost (IDB)
Panama-Colombia: Central America could save up to $2.3 mn; marginal generation cost of hydro in Colombia is $.05/kWh; retail price in Panama $.19-22/kWh
Caribbean region: average consumer tariff $.20-.50/kWh (WB 2011)

Connecting the Americas 2022
28
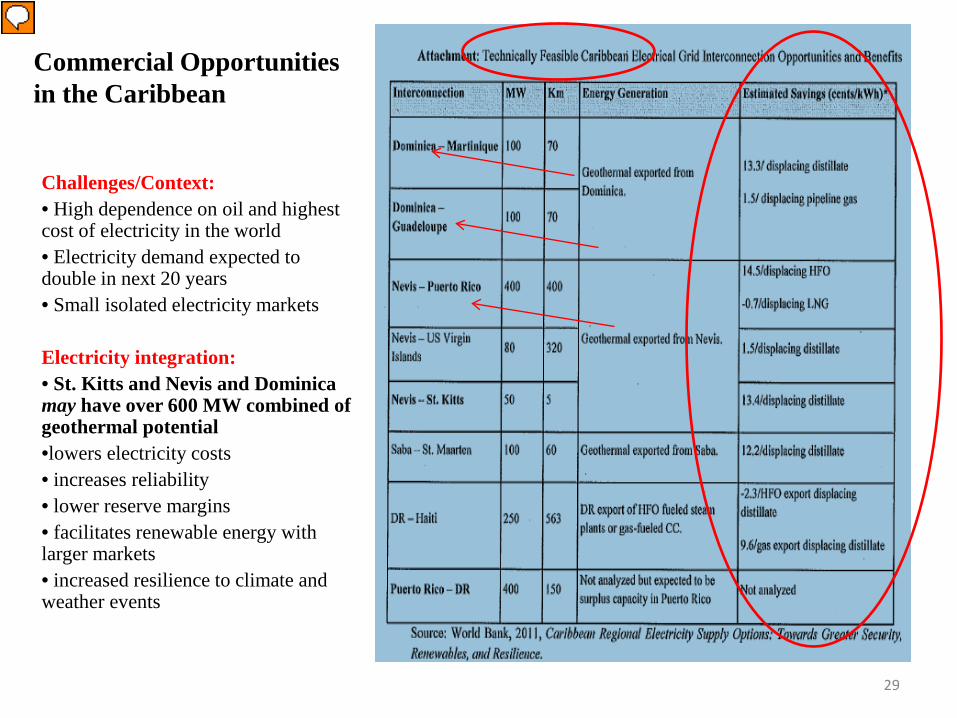
Commercial Opportunities in the Caribbean
Challenges/Context: • High dependence on oil and highest cost of electricity in the world • Electricity demand expected to double in next 20 years • Small isolated electricity markets
Electricity integration: • St. Kitts and Nevis and Dominica may have over 600 MW combined of geothermal potential •lowers electricity costs • increases reliability • lower reserve margins • facilitates renewable energy with larger markets • increased resilience to climate and weather events
29

North America: U.S.-Canada
• Over 30 transmission lines crossing the U.S.-Canada border • With the exception of Quebec, the U.S. is interconnected with Canada through synchronous ties • Complimentary load profiles: U.S. exports in winter and imports in summer Example: Manitoba Hydro and Minnesota Power approved a 250 MW PPA for Manitoba supplies of hydropower and North Dakota wind farms supply power
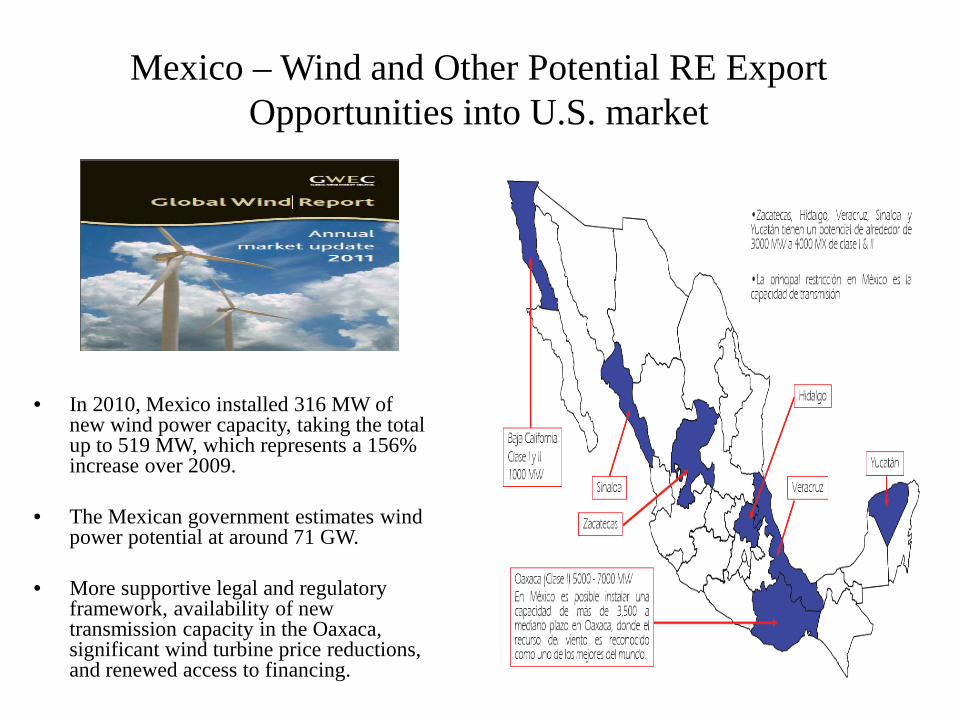
Mexico – Wind and Other Potential RE Export Opportunities into U.S. market
• In 2010, Mexico installed 316 MW of new wind power capacity, taking the total up to 519 MW, which represents a 156% increase over 2009.
• The Mexican government estimates wind power potential at around 71 GW.
• More supportive legal and regulatory framework, availability of new transmission capacity in the Oaxaca, significant wind turbine price reductions, and renewed access to financing.

Mesoamerica Mexico-Guatemala and Central America (SIEPAC)
Panama-Colombia (planned)
SIEPAC to enter full operation in 2012, with potential savings of 10-15% in the average generation cost (IDB).
• Allows cheaper Colombian hydro into Central America, beginning with 300 MW and doubling to 600 MW in Phase II.
• Central America could save up to $2.3 mn annually; marginal generation cost of hydro in Colombia is $.05/kWh; retail price in Panama $.19-22/kWh (IDB)

The Andes Southern Cone
• Colombia can export excess, cheaper hydro into Andean region and Chile. • Colombia, Ecuador, and Peru possess more than half of the hydropower potential outside of Brazil, and have developed only 10% of their hydroelectric potential. • UNDP and IDB supporting feasibility studies for infrastructure and regional market and regulatory harmonization
• Brazil is region’s largest electricity producer and accounts for roughly half of existing cross-border trade in electricity. • Brazil needs to double generation capacity over 10 years and is investing in hydro and other projects with Guyana, Paraguay, Peru to meet demand.

Electricity Investments Needed by Sub-region: 2008-2030
34
Billi
ons o
f U.S
. dol
lars
Source: World Bank; Conference Board of Canada (Canada)
050
100150200250300350
The Edison Foundation
estimates that the United States will
require $1.5-2 trillion in electricity
investments by 2030:

Connecting the Americas 2022
Possible Next Steps
• ECPA Ministerial • Increased Support for
regional work • Possible Regulators
Forum • Identify opportunities for
U.S. private sector
“Not only can we can make power more affordable, reliable, and efficient, but we can make it more economically viable to add renewable energy to the mix.“ – Secretary of State Clinton