Embed Size (px)
Citation preview
Energy Flow AnalysisDuring the Tennis Serve
Comparison Between Injured and Noninjured Tennis Players
Caroline Martin,*y Benoit Bideau,y Nicolas Bideau,y Guillaume Nicolas,y
Paul Delamarche,y and Richard Kulpay [AQ: 1][AQ: 2]Investigation performed at University of Rennes 2–ENS Cachan, Bruz, France [AQ: 3]
Background: Energy flow has been hypothesized to be one of the most critical biomechanical concepts related to tennis perfor-mance and overuse injuries. However, the relationships among energy flow during the tennis serve, ball velocity, and overuseinjuries have not been assessed.
Purpose: To investigate the relationships among the quality and magnitude of energy flow, the ball velocity, and the peaks ofupper limb joint kinetics and to compare the energy flow during the serve between injured and noninjured tennis players.
Study Design: Case-control study; Level of evidence, 3.
Methods: The serves of expert tennis players were recorded with an optoelectronic motion capture system. The forces and tor-ques of the upper limb joints were calculated from the motion captures by use of inverse dynamics. The amount of mechanicalenergy generated, absorbed, and transferred was determined by use of a joint power analysis. Then the players were followedduring 2 seasons to identify upper limb overuse injuries with a questionnaire. Finally, players were classified into 2 groups accord-ing to the questionnaire results: injured or noninjured.
Results: Ball velocity increased and upper limb joint kinetics decreased with the quality of energy flow from the trunk to the hand1 racket segment. Injured players showed a lower quality of energy flow through the upper limb kinetic chain, a lower ball veloc-ity, and higher rates of energy absorbed by the shoulder and elbow compared with noninjured players.
Conclusion: The findings of this study imply that improper energy flow during the tennis serve can decrease ball velocity,increase upper limb joint kinetics, and thus increase overuse injuries of the upper limb joints.
Keywords: tennis serve; energy flow; injuries; biomechanics
The tennis serve has been reported to be one of the mostimportant strokes for winning a match.18 This stroke isa sequence of motions referred to as a ‘‘kinetic chain’’that begins with lower limb actions and is followed by rota-tions of the trunk and the upper limb.12 This kinetic chainallows the generation, summation, and transfer of mechan-ical energy to generate high ball velocity.10,19 Energytransfer refers to the transmission of mechanical energyfrom one segment to another. Energy flow refers to themovement of energy into the human body: It includes
energy generation and absorption at the joints and energytransfer between segments. Although many investigationsof the tennis serve refer to the term energy trans-fer,2,10,14,15,23,32 the energy flow through the kinetic chainduring the tennis serve has not, to our knowledge, beendocumented. Yet understanding the ways that mechanicalenergy can be generated and transferred between seg-ments during the serve has considerable interests for ten-nis players, coaches, and medical practitioners.
From the perspective of orthopaedic sport biomechan-ics,6 energy transfer between segments is considered oneof the most critical concepts related to sports injury.4,35,38
Two parameters, magnitude and quality of energy trans-fer, are usually considered to be risk factors for injury insports.3,22,26 Concerning the magnitude of energy transfer,it is believed that injuries occur when mechanical energy istransferred or absorbed by the joints in amounts or at ratesthat exceed the threshold of human tissue damage.7,26,27
The quality of energy transfer refers to the proximodistalsequence pattern of energy transfer during theserve.19,22,29 It is hypothesized that upper limb joint inju-ries could be caused by alterations in the energy flow
*Address correspondence to Caroline Martin, M2S Laboratory, UFRAPS, University of Rennes 2–ENS Cachan, Campus de Ker Lann, AvenueRobert Schuman, 35170 Bruz, France (e-mail: [email protected]).
yM2S Laboratory, UFR APS, University of Rennes 2–ENS Cachan,Campus de Ker Lann, Bruz, France.
The authors declared that they have no conflicts of interest in theauthorship and publication of this contribution.
The American Journal of Sports Medicine, Vol. XX, No. XDOI: 10.1177/0363546514547173! 2014 The Author(s)
1
across segments during the tennis serve.11,19,22 Indeed, ifthe action of one joint in the kinetic chain is altered,then the contribution of the other joints increases toaccommodate the loss of energy, which may lead toincreased joint loadings and, consequently, overuse jointinjuries.10,19,20 However, the relationships among energyflow, upper limb joint kinetics, and overuse joint injurieshave never been assessed.
From the perspective of sport performance, it has beensuggested that an effective energy flow during the servewould allow the player to produce a high ball velocity,10
which is a key element of successful play.18 However, itis still unknown whether ball velocity is related to thequality and magnitude of the energy flow through theupper limb kinetic chain during the tennis serve. As a con-sequence, an analysis of the mechanical energy flow duringthe tennis serve is necessary because the mechanisms thatincrease ball velocity and reduce upper limb joint injuryrisks could be improved.
The purposes of this study were (1) to investigate therelationships among the quality and magnitude of energyflow, the ball velocity, and the peaks of upper limb jointkinetics and (2) to compare energy flow during the servebetween injured and noninjured tennis players.
MATERIALS AND METHODS
Participants
[AQ: 4] A total of 19 high-level male tennis players (rank-ing, international tennis number17 4 to 1; mean age, 25.1 65.9 years; height, 1.84 6 0.07 m; weight, 75.1 6 9.0 kg) par-ticipated voluntarily in this study. At the time of testing,all players were considered healthy, with no significantjoint injury or history of pain or surgery on the dominantarm. Kinematic data from the tennis serve of these sub-jects were previously published.25
Experiment Protocol
Before experimentation, participants were fully informedof the experimental procedures. Written consent wasobtained from each player. The local ethics committeeapproved the study. After a warm-up of 10 minutes, eachplayer performed 5 successful ‘‘flat’’ serves from the rightservice court to a 1.50 3 1.50–m target area borderingthe T of the ‘‘deuce’’ service box.
In Situ Motion Capture
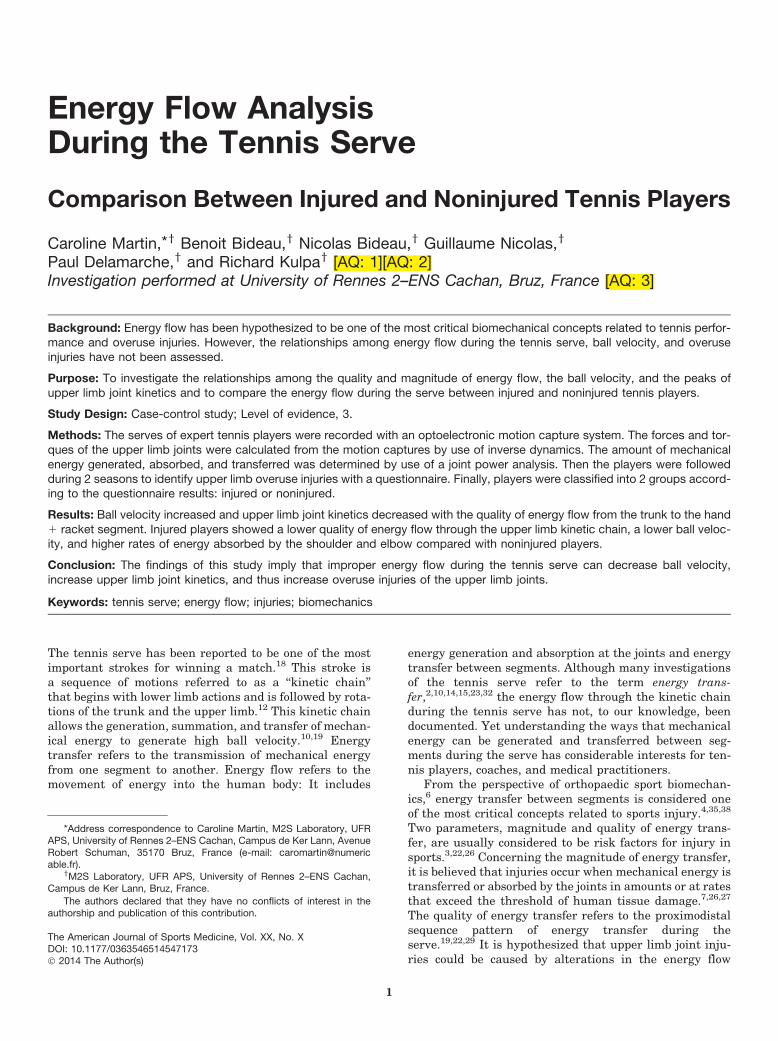
The experiment took place in an indoor tennis court duringan Association of Tennis Professionals (ATP) tournament.Players were equipped with 38 retroreflective markersplaced on anatomic landmarks. Five additional landmarkswere positioned on the racket (Figure 1). A Vicon MX-40motion capture system (Oxford Metrics Inc) was used torecord the trajectories of the 3-dimensional (3D) land-marks. The system was composed of 12 high-resolutioncameras (4 megapixels) operating at a nominal frame
rate of 300 Hz and positioned as shown in Figure 2. Playerswore only tight shorts to limit movement of the markersfrom their anatomic landmarks. After the capture, the3D coordinates of the landmarks were reconstructed withViconIQ software (IQ; Vicon) with a residual error of lessthan 1 mm. The 3D motions of each player were expressedin a right-handed inertial reference frame, where the ori-gin was at the center of the baseline. X represented theparallel direction to the baseline, Y pointed forward, andZ was vertical and pointed upward (Figure 2). The 3D coor-dinate data of the markers were smoothed using a Butter-worth low-pass filter with a cut-off frequency of 15 Hz.
Postimpact Ball Velocity
Postimpact ball velocity was measured for each trial by useof a radar (Stalker Professional Sports Radar; precision,61.6 km/h; frequency, 34.7 GHz; target acquisition time,0.01 seconds) fixed on a 2.5-m height tripod placed 2 mbehind the players in the direction of the serve.
Phases of the Serve
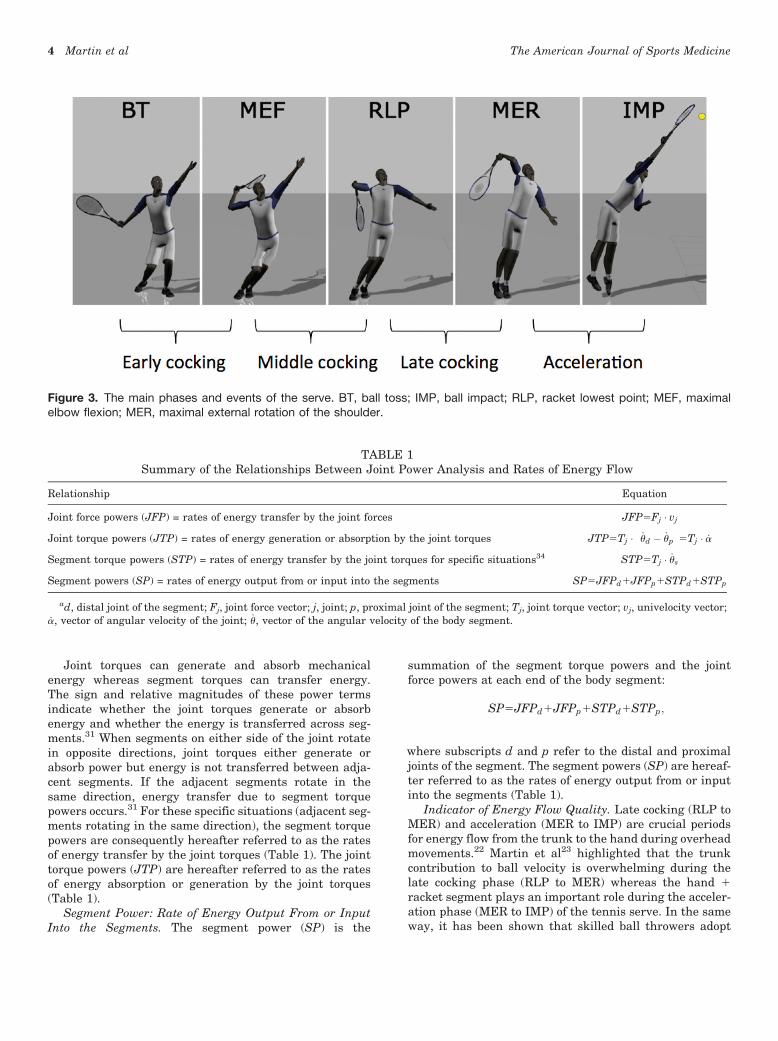
To simplify energy flow interpretation, the serve motionwas divided into 4 phases between meaningful eventsthat showed the importance of these temporal phases inrelation to serve kinetics and ball velocity, in accordance
Figure 1. The marker positions.
2 Martin et al The American Journal of Sports Medicine
with previous studies2,24 (Figure 3). The early cockingphase began when the server tossed the ball (BT); it endedwith the maximal elbow flexion (MEF). Next was the mid-dle cocking phase, from the MEF to the lowest point of theracket (RLP). Then the late cocking phase began with RLPuntil the maximal external rotation of the shoulder (MER).The arm acceleration phase followed, ending with ballimpact (IMP). We determined BT and IMP by direct obser-vation of the recorded data, and the other time events werecalculated from the kinematic data.
Determination of the Joint Forces and Torquesof the Racket Arm
The stroking arm was modeled as a 3-link kinetic chaincomposed of the hand 1 racket segment, the forearm,and the upper arm. The hand and racket were assumedto move as a single rigid segment during the serve. Seg-mental masses and moments of inertia used in the inversedynamics calculations were obtained from previously pub-lished data.9 The inverse dynamics approach was used tocalculate the joint forces and torques based on the strokingarm model. All these data were resolved in the inertialreference frame and were included in energy flowcalculations.
For the purpose of the study, kinetics values from themotion capture were calculated before the epidemiologicalfollow-up of the tennis players. The peaks of shoulder ante-rior and inferior forces, shoulder horizontal abduction andinternal rotation torques, elbow medial force, elbow varusand flexion torques, wrist flexion and radial deviation tor-ques were analyzed. [AQ: 5] These joint kinetics were firstcomputed in the inertial reference frame and were latertransformed to a series of noninertial, anatomically rele-vant, right-handed orthogonal reference frames at eachjoint. Kinetic peaks were normalized. Forces were normal-ized by body mass and torques were divided by the productof body mass by height.8 The moment of inertia of theracket about its mediolateral axis (IM) was computed usingthe parallel axis theorem and published racket ‘‘swing
weight’’ data.36 The racket moment of inertia about thelong-axis was calculated as used by Brody5:
IL kg:m!2! "
5mass kgð Þ3head width2m
17:75:
Racket moment of inertia about its anterior-posterior axis(IA) was the sum of the racket’s other 2 principal momentsof inertia.5
Energy Flow Calculations
Muscular joint forces and torques produce energy that flowsthrough the joints of the kinetic chain. In this study, varia-bles concerning energy flow were quantified from the resul-tant joint forces and torques using a joint power analysisdetailed by Robertson and Winter34 and Zatsiorsky.39 Thevariables of energy flow were the joint force powers (JFP),the segment torque powers (STP), the joint torque powers(JTP), and the segment powers (SP). All the power flow var-iables were normalized by the body mass of each participant.
Joint Force Power: Rate of Energy Transfer by the JointForces. The joint force power, JFP, is computed as the sca-lar product of the vectors of joint force (Fj) and linear uni-velocity (vj) of the joint center j:
JFP5Fj $ vj:
The role of the joint force has been described as a simplemechanism of energy transfer between adjacent segmentssince the rate at which mechanical energy is lost by onesegment is equivalent to the rate at which energy is gainedby its neighbor.34 The larger the joint force and linearvelocity of the joint center, the greater is the rate of energytransfer—that is, the amount of energy transmitted perunit of time from one body segment to another.39 As a con-sequence, the joint powers due to the joint forces (JFP) arehereafter referred to as the rates of energy transfer by thejoint forces (Table 1).
Segment Torque Power: Rate of Energy Transfer by theJoint Torques. The segment torque power, STP, for thebody segment is computed as the scalar product of the vec-tors of joint torque (Tj) and angular velocity _us of the bodysegment s:
STP5Tj $ _us:
Joint Torque Power: Rate of Energy Absorption or Gen-eration by the Joint Torques. The joint torque power, JTP,is computed as the scalar product of the vectors of joint tor-que (Tj) and angular velocity ( _a) of the joint j:
JTP5Tj $ _ud ! _up
! "5Tj $ _a;
where _u is the vector of the angular velocity of the body seg-ment and subscripts d and p refer to the distal and proxi-mal segments adjacent to the joint.
Figure 2. The filming setup.
Vol. XX, No. X, XXXX Energy Flow During the Tennis Serve 3
Joint torques can generate and absorb mechanicalenergy whereas segment torques can transfer energy.The sign and relative magnitudes of these power termsindicate whether the joint torques generate or absorbenergy and whether the energy is transferred across seg-ments.31 When segments on either side of the joint rotatein opposite directions, joint torques either generate orabsorb power but energy is not transferred between adja-cent segments. If the adjacent segments rotate in thesame direction, energy transfer due to segment torquepowers occurs.31 For these specific situations (adjacent seg-ments rotating in the same direction), the segment torquepowers are consequently hereafter referred to as the ratesof energy transfer by the joint torques (Table 1). The jointtorque powers (JTP) are hereafter referred to as the ratesof energy absorption or generation by the joint torques(Table 1).
Segment Power: Rate of Energy Output From or InputInto the Segments. The segment power (SP) is the
summation of the segment torque powers and the jointforce powers at each end of the body segment:
SP5JFPd1JFPp1STPd1STPp;
where subscripts d and p refer to the distal and proximaljoints of the segment. The segment powers (SP) are hereaf-ter referred to as the rates of energy output from or inputinto the segments (Table 1).
Indicator of Energy Flow Quality. Late cocking (RLP toMER) and acceleration (MER to IMP) are crucial periodsfor energy flow from the trunk to the hand during overheadmovements.22 Martin et al23 highlighted that the trunkcontribution to ball velocity is overwhelming during thelate cocking phase (RLP to MER) whereas the hand 1racket segment plays an important role during the acceler-ation phase (MER to IMP) of the tennis serve. In the sameway, it has been shown that skilled ball throwers adopt
Figure 3. The main phases and events of the serve. BT, ball toss; IMP, ball impact; RLP, racket lowest point; MEF, maximalelbow flexion; MER, maximal external rotation of the shoulder.
TABLE 1Summary of the Relationships Between Joint Power Analysis and Rates of Energy Flow
Relationship Equation
Joint force powers (JFP) = rates of energy transfer by the joint forces JFP5Fj $ vj
Joint torque powers (JTP) = rates of energy generation or absorption by the joint torques JTP5Tj $ _ud ! _up
! "5Tj $ _a
Segment torque powers (STP) = rates of energy transfer by the joint torques for specific situations34 STP5Tj $ _us
Segment powers (SP) = rates of energy output from or input into the segments SP5JFPd1JFPp1STPd1STPp
ad, distal joint of the segment; Fj, joint force vector; j, joint; p, proximal joint of the segment; Tj, joint torque vector; vj, univelocity vector;_a, vector of angular velocity of the joint; _u, vector of the angular velocity of the body segment.
4 Martin et al The American Journal of Sports Medicine
a hierarchical control in which the proximal muscle tor-ques create a dynamic foundation for the entire limbmotion that is beneficial for arm velocity.16
Moreover, the kinetic chain theory proposes that energyflows in the upper body by following a proximodistal pat-tern from the trunk to the hand 1 racket. Consequently,to estimate the quality of energy flow, it appears interest-ing to determine and compare the energy flow patternsbetween the trunk during late cocking (RLP to MER) andthe hand 1 racket during acceleration (MER to IMP). Inthis study, the ratio between the mean rate of energythat left the trunk during the cocking phase (RLP toMER) and the mean rate of energy that went in the hand1 racket during the acceleration phase (MER to IMP)was calculated. This ratio was proposed to be an indicatorof the quality of energy flow from the trunk to the hand 1racket during the last crucial phases of the serve.
Injury Data and Questionnaire
A questionnaire was used to prospectively determine allinjuries related to tennis for a given player during a 2-season period after the motion capture and the calculationof joint kinetics. In this questionnaire, players were asked,‘‘Did you have any injuries that prevented you from play-ing at 100% of capacity?’’ The players were asked to reportthe number of injuries, the name of injuries, the type ofinjuries (traumatic or overuse), the location of injuries,the injury severity, and the tennis strokes affected by inju-ries. The players received written information about thedefinition of injury and the injury reporting procedure.To reduce limitations of the questionnaire approach3 andverify injury data reported by players, we contacted thecoaches and physical therapists of the ATP tour. Moreover,we consulted TennisInsight, a website that gathers data oninjury location and withdrawal of each player during inter-national tournaments (www.tennisinsight.com). Among allthe injuries reported by the players, only the overuse inju-ries that were directly related to the dominant upper limbjoints (shoulder, elbow, and wrist) and that were painfulduring the serve were included in the analysis. Additionalconfounding factors possibly contributing to injury, includ-ing demographic information (age, height, mass, and bodymass index), were also reported.1
Injury Definition
In the present study, an injury was defined as any physicalcomplaint or manifestation sustained by a player thatresults from a tennis match or tennis training, irrespectiveof the need for medical attention or time loss from tennisactivities.30 Definitions of injury location, type of injury,and severity classification were based on the previous con-sensus statement of Pluim et al.30 Injury severity was mea-sured according to the period of missed tennis practice:slight (0 days), minimal (1-3 days), mild (4-7 days), moder-ate (8-28 days), severe (.28 days–6 months), and long-term (.6 months).30
Statistical Analyses
Means and standard deviations (5 trials for each player)were calculated for all variables. Student t tests wereused to compare rates of energy flow between injuredand noninjured players. When the normality test failed,Mann-Whitney tests were used. The relationships amongthe quality and magnitude of the energy flow, peaks ofupper limb joint kinetics, and ball velocity were analyzedwith Spearman or Pearson correlation coefficients. Thelevel of significance was established at P \ .05 (SigmaStat3.1; Jandel Corp).
RESULTS
Overuse Injuries
Among all the participants, 11 players had overuse injuriesinvolving an upper limb joint, including 6 players withshoulder tendinopathy, 5 players with elbow tendinopathy,and 1 with wrist tendinopathy (Table 2). Symptoms ofshoulder injuries reported by the players were clinicallyaccorded to rotator cuff tendinopathies, labral tears, ortype 2 superior labral anterior-posterior (SLAP) lesions.Symptoms of elbow injuries reported by players wereaccorded to medial or lateral ‘‘tennis elbow.’’ Demographicdata revealed no statistically significant differencebetween the injured and the noninjured groups (respectivemean age, 25 6 7 vs 25 6 5 years [P = .967]; height, 1.87 60.09 vs 1.83 6 0.06 m [P = .282]; weight, 75.4 6 10.4 vs 78.76 7.1 kg [P = .429]).
Rates of Energy Transferby the Joint Forces and the Joint Torques
Figure 4 presents the mean rates of energy transfer by thejoint forces and the joint torques during the phases ofserve. During the BT-to-MEF phase, the mean rates ofenergy transfer by the shoulder, elbow, and wrist forceswere higher for noninjured than for injured players. Dur-ing the MEF-to-RLP phase, the mean rate of energy trans-fer by the wrist forces was significantly larger fornoninjured players than for injured ones. Conversely, themean rate of energy transfer by the wrist torques was sig-nificantly larger during the same phase for injured playersthan for noninjured players. During the RLP-to-MERphase, injured players significantly transferred moreenergy by the shoulder, elbow, and wrist forces than didnoninjured players. Between MER and IMP, the meanrate of energy transfer by the shoulder forces was signifi-cantly higher for injured players than for noninjuredplayers.
Rates of Energy Generation:Absorption by the Joint Torques
The mean rates of energy generation and absorption by thejoint torques during the phases of the serve are presented
Vol. XX, No. X, XXXX Energy Flow During the Tennis Serve 5

in Table 3. The shoulder and the elbow torques of nonin-jured players generated significantly higher rates ofenergy than did the shoulder and the elbow torques ofinjured players, which absorbed energy, respectively, dur-ing the RLP-to-MER and MER-to-IMP phases of the serve(P \ .05). Concerning the wrist joint, noninjured playersgenerated energy at the wrist joint, whereas injured play-ers absorbed energy during the same phase. At the wrist,the joint torques of injured players absorbed higher ratesof energy between MEF and MER (P \ .001).
Rates of Energy Output From or Input Intothe Upper Limb Segments During the Serve Phases
Significantly higher rates of energy output from the trunk,the upper arm, the forearm, and the hand 1 racket werenoticed for noninjured players compared with injured play-ers for the BT-to-MEF phase (Table 4). Significant differ-ences existed between injured and noninjured players forthe rate of energy output from the trunk between RLPand MER and between MER and IMP.
TABLE 2Injury Dataa
Player Ranking Injury Location Severity
1 ITN 4 Type 2 SLAP lesions Shoulder Severe2 ITN 4 RC tendinopathy Shoulder Severe3 ITN 1 RC tendinopathy Shoulder Severe4 ITN 1 Labral tears Shoulder Severe5 ITN 3 RC tendinopathy Shoulder Moderate6 ITN 1 RC tendinopathy Shoulder Moderate
Tendinopathy Elbow Severe7 ITN 4 Medial tennis elbow Elbow Moderate8 ITN 4 Medial tennis elbow Elbow Moderate9 ITN 1 Lateral tennis elbow Elbow Moderate10 ITN 4 Medial tennis elbow Elbow Moderate11 ITN 1 Tendinopathy Wrist Severe
aITN, international tennis number, RC, rotator cuff; SLAP, superior labral anterior-posterior.
Figure 4. Mean 6 SD rates of energy transfer by the joint forces (W/kg) and segment torque powers (W/kg) during the phases ofthe serve. BT, ball toss; IMP, ball impact; RLP, racket lowest point; MEF, maximal elbow flexion; MER, maximal external rotationof the shoulder. ***P \ .001; **P \ .01; *P \ .05.
6 Martin et al The American Journal of Sports Medicine
Indicator of Energy Flow Quality. The indicator ofenergy flow quality was significantly higher for noninjuredplayers (88.1% 6 16.9%) than for injured players (71.1% 615.0%) (P \ .001). The indicator of energy flow quality wassignificantly correlated to the ball velocity and to severalpeaks of upper limb joint kinetics (Table 5).
Ball Velocity
Ball velocity was significantly higher for noninjured play-ers (170.9 6 19.5 km/h) than for injured players (159.5 623.9 km/h) (P = .023).
DISCUSSION
The aims of this study were (1) to investigate the relation-ships among the quality and magnitude of energy flow, ballvelocity, and the peaks of upper limb joint kinetics and (2)to compare the energy flow during the serve betweeninjured and noninjured players.
Relationships Among Energy Flow, Ball Velocity,and Upper Limb Joint Kinetics
The correlation analyses show that the quality of energyflow is positively related to joint kinetics and negativelyto ball velocity (Table 5). Consequently, the players withhigh quality of energy flow from the trunk to the hand 1racket are those with the highest ball velocities and thelowest upper limb joint kinetics. Based on these findings,it appears that minimizing the risk of injury (ie, decreasedkinetics) and maximizing performance quality (ie,increased ball velocity) are compatible with one another.
Conversely, these results confirm that a poor energy flowfrom the trunk to the hand 1 racket during the serve lim-its ball velocity and consequently decreases the perfor-mance of tennis players, as suggested by previousresearchers.21,22 These findings confirm also that poorenergy flow can cause a ‘‘catch-up’’ situation,19,22 duringwhich players with a poor energy flow must create moreloads at the most distal joints to offset energy dissipationalong the kinetic chain.
Comparison of Energy FlowBetween Injured and Noninjured Players
The results demonstrate that significantly higher rates ofenergy left the trunk and entered the upper arm and theforearm for noninjured players compared with injuredplayers for the BT-to-MEF phase. This result could explainwhy higher rates of energy came into the hand 1 racketsegment for noninjured players than for injured playersduring the BT-to-MEF and MEF-to-RLP phases.
Energy transfer seemed to be more efficient for nonin-jured players than for players who would be injured duringthe prospective follow-up. Consequently, the results sug-gest that an impairment of proximodistal energy transferpredisposed players to increased injury risk. It seemedthat injured players did not take advantage of the higheroutput of energy from the trunk during the last crucialphases of the serve. Although the mean rate of energythat left the trunk was significantly higher for injuredplayers during late cocking (RLP to MER), similar meanrates of energy came into the hand 1 racket for bothgroups of players during the acceleration (MER to IMP).The indicator of energy flow quality revealed that 71% of
TABLE 3Rates of Energy Generation or Absorption by the Joint Torques
During the Phases of the Serve in Noninjured and Injured Playersa
Phase Noninjured Players (n = 8)b Injured Players (n = 11)b Function P Value
ShoulderBT to MEF 0.14 6 0.15 0.10 6 0.12 Generation .151MEF to RLP 1.00 6 1.11 0.66 6 0.67 Generation .593RLP to MER 1.10 6 2.32c 20.35 6 2.71 Generation/absorption .013MER to IMP 6.60 6 2.85 5.78 6 3.79 Generation .168
ElbowBT to MEF 0.11 6 0.09 0.08 6 0.05 Generation .313MEF to RLP 0.17 6 0.30 0.13 6 0.11 Generation .419RLP to MER 1.26 6 1.23 0.79 6 0.68 Generation .348MER to IMP 1.28 6 1.40 21.63 6 1.88d Generation/absorption \.001
WristBT to MEF 0.02 6 0.03 0.02 6 0.04 Generation .170MEF to RLP 0.01 6 0.09 20.10 6 0.12e Generation/absorption \.001RLP to MER 20.21 6 0.26 20.35 6 0.35d Absorption .033MER to IMP 1.35 6 0.69 1.37 6 0.86 Generation .917
aBT, ball toss; IMP, ball impact; RLP, racket lowest point; MEF, maximal elbow flexion; MER, maximal external rotation of the shoulder.bRates of energy generation/absorption are expressed as W/kg, mean 6 SD.cP \ .01.dP \ .05.eP \ .001 [AQ: 6]
Vol. XX, No. X, XXXX Energy Flow During the Tennis Serve 7
the mean rate of energy that left the trunk during the latecocking phase (RLP to MER) entered the hand 1 racketsegment during the acceleration phase (MER to IMP) ininjured players, while this percentage reached about 88%in noninjured players (Table 5). Consequently, this resultsuggests a poor quality of energy flow from the trunk tothe hand 1 racket for injured players during the cruciallast phases (RLP to MER, MER to IMP) of the tennis serve.This poor quality of energy flow was probably responsiblefor the lower ball velocity noticed for injured players andcould be one of the causes of the upper limb joint injuriesregistered for injured players. An optimal use of the
sequential involvement of each link in the kinetic chainshould allow the generation, summation, transfer, and reg-ulation of mechanical energy from the legs to the hand 1racket.10,19,22,37 But for injured players, the results sug-gested that the energy was partly dissipated through theupper limb kinetic chain, decreasing ball velocity and prob-ably increasing the risk of upper limb joint injury. It hasbeen suggested that alterations in the energy flow acrosssegments during the tennis serve could lead to overuseinjuries of the upper limb joints.11,19,22 Indeed, it hasbeen hypothesized that if the action of one joint of thekinetic chain is altered, the contribution of the other joints
TABLE 4Rates of Energy Output From or Input Into the Upper Limb Segments
During the Phases of the Serve in Injured and Noninjured Playersa
Phase Noninjured Players (n = 8)b Injured Players (n = 11)b Energy Flow P Value
TrunkBT to MEF 20.5 6 0.6c 20.0 6 0.2 Output \.001MEF to RLP 211.8 6 5.2 210.8 6 4.7 Output .346RLP to MER 220.4 6 4.6 224.7 6 4.1c Output \.001MER to IMP 27.1 6 2.1 28.8 6 3.2c Output \.001
Upper armBT to MEF 0.3 6 0.3c 0.0 6 0.1 Input \.001MEF to RLP 5.4 6 2.7 5.2 6 2.0 Input .570RLP to MER 3.3 6 1.7 3.7 6 2.1 Input .345MER to IMP 25.3 6 1.8 24.8 6 1.9 Output .158
ForearmBT to MEF 0.3 6 0.2d 0.1 6 0.1 Input .002MEF to RLP 4.9 6 2.4 4.7 6 2.0 Input .617RLP to MER 8.3 6 1.6 8.8 6 2.2 Input .243MER to IMP 22.0 6 0.8 22.4 6 0.5 Output .087
Hand 1 racketBT to MEF 0.2 6 0.1d 0.1 6 0.1 Input .002MEF to RLP 2.4 6 1.4e 1.8 6 0.9 Input .048RLP to MER 11.8 6 3.3 12.2 6 3.0 Input .488MER to IMP 17.7 6 4.2 17.5 6 4.0 Input .978
aBT, ball toss; IMP, ball impact; RLP, racket lowest point; MEF, maximal elbow flexion; MER, maximal external rotation of the shoulder.bRates of energy output and input are expressed as W/kg, mean 6 SD.cP \ .001.dP \ .01.eP \ .05.
TABLE 5Spearman and Pearson Correlation Coefficients for Energy Flow Quality,
Ball Velocity, and Peaks of Upper Limb Joint Kineticsa
Shoulder Elbow
Ballvelocity
ProximalForce
AnteriorForce
InferiorForce
HorizontalAdduction Torque
InternalRotation Torque
AnteriorForce
MedialForce
VarusTorque
FlexionTorque
Indicator of energyflow quality
0.55b 20.28c 20.48b 20.63b 20.25d NS 20.27c 20.25d NS 20.25d
aNS, nonsignificant.bP \ .001.cP \ .01.dP \ .05.
8 Martin et al The American Journal of Sports Medicine
will increase to accommodate the loss of energy, which maylead to tissue overloads.10,19,20 According to our results, theenergy flow through the shoulder and the elbow jointsseemed to be impaired in the group of players who wouldbe injured during the prospective follow-up. Indeed,although the rate of energy that left the trunk to the upperarm was significantly higher in injured players than innoninjured players, it was mainly absorbed by the shoulderand elbow torques during the last cocking (RLP to MER)and acceleration (MER to IMP) phases for injured playersrather than transferred to the upper arm. [AQ: 7]
We have previously published results on the tennisserve kinematics of our 2 groups that can enlighten theenergy transfer differences observed between injured andnoninjured players.25 Our past results showed that playersin our injured cohort demonstrated later timing of trunkrotation and shoulder hyperangulation because they lefttheir arm in horizontal abduction for too long during theshoulder external rotation phase.25 Moreover, in injuredplayers, the maximal angular velocity of pelvis longitudi-nal rotation occurred after the maximal angular velocityof shoulder longitudinal rotation, while it was the oppositein noninjured players.25 Consequently, the proximodistalsequence of rotations from the pelvis to the shoulderswas not observed in injured players. To improve energytransfer, coaches should verify that their players longitudi-nally rotate their shoulders at maximal velocities aftertheir pelvis, allowing the energy to pass from the trunkto the shoulder at precisely the right timing within the cor-rect sequence of movements.
The shoulder, elbow, and wrist of injured playersabsorbed significantly higher rates of energy than thoseof noninjured players during the serve. During the latecocking phase, which is a crucial phase of the serve withregard to injury potential,12,24 the magnitude of energytransfer by the shoulder, elbow, and wrist forces washigher for injured than noninjured players (Figure 4).The Committee on Trauma Research7 included energyabsorption as a causal mechanism in musculoskeletal inju-ries. Moreover, energy flow can result in overuse jointinjury when the energy transferred exceeds the toleranceof the tissues involved.4,25,26 These statements about therelationships between the magnitude of energy transferand injuries are confirmed by our results, since therewere 6 players with shoulder injury, 4 players with elbowtendinopathy, and 1 with wrist tendinopathy among theinjured players (Table 2). We were aware that impairmentof proximodistal energy transfer precedes the reportedinjuries but may interact with several factors such as anat-omy, physical fitness, or body composition to produce clin-ical symptoms.3,4
Since joint power analysis assumes that the joint tor-ques are produced by one-joint muscles,33 the currentstudy was limited to the analysis of energy transferbetween adjacent segments due to muscular torques with-out taking account of multijoint muscles that can transferenergy between nonadjacent segments.31 Moreover, recentstudies have focused on energy transfer mechanisms witha state-power analysis13 to decompose the mechanicalenergy of the segments to causal components resulting
from the muscular and nonmuscular interactive torquesin complex human movements.28 Future research isneeded to investigate more precisely the energy redistribu-tion mechanisms among multiple segments involved in thetennis serve. Limitations of this study also include a smallsample size. The sample size was somewhat small becausewe only included male professional and advanced tennisplayers and participation was voluntary. Moreover, werestricted observation for injury to a limited period andwe did not specifically analyze the relationship betweenoveruse injury at a given joint and energy flow variables.Indeed, only 6 participants reported shoulder injuries, 5reported elbow injuries, and 1 reported wrist injury, sowe most likely lacked enough power for any meaningfulstatistical analysis.
CONCLUSION
This study illustrates the concept of mechanical energyflow through the kinetic chain for the tennis serve. Inthe tennis serve, the ball velocity increased and the upperlimb joint kinetics decreased with the quality of energyflow from the trunk to the hand 1 racket. Concerningthe relationship between the quality and magnitude ofenergy flow during the serve and the appearance of upperlimb injuries in tennis players, the results show thatenergy flow differences are present before the onset of clin-ical symptoms. Consequently, the alterations of energyflow from the trunk to the racket can play a predictiverole in both serve performance and injury. For injuredplayers, the results showed a poor quality of energy flowthrough the upper limb kinetic chain during the lastphases of the serve, decreasing ball velocity and probablyincreasing risks of overuse joint injuries, anywhere in thedominant arm, not only in the shoulder. Moreover, theshoulder, the elbow, and the wrist of injured playersabsorbed significantly higher rates of energy than did thejoints of noninjured players during the serve. This phe-nomenon could be responsible for the appearance of over-use joint injuries in the upper limb reported in thisstudy. Our results indicate that the development of an effi-cient energy flow appears to be crucial to reach optimalperformance and minimize injury risk.
REFERENCES
1. Anz AW, Bushnell BD, Griffin LP, Noonan TJ, Torry MR, Hawkins RJ.Correlation of torque and elbow injury in professional baseball pitch-ers. Am J Sports Med. 2010;38(7):1368-1374.
2. Bahamonde RE. Changes in angular momentum during the tennisserve. J Sports Sci. 2000;18(8):579-592.
3. Bahr R, Krosshaug T. Understanding injury mechanisms: a key com-ponent of preventing injuries in sport. Br J Sports Med.2005;39(6):324-329.
4. Bartlett R, Bussey M. Sports Biomechanics: Reducing Injury Risk andImproving Performance. 2nd ed. New York, NY: Routledge; 2009.
5. Brody H. The moment of inertia of a tennis racket. Phys Teacher.1985;23(4):213-216.
6. Chan KM, Fong DT, Hong Y, Yung PS, Lui PP. Orthopaedic sport bio-mechanics—a new paradigm. Clin Biomech. 2008;23(1):23-30.
Vol. XX, No. X, XXXX Energy Flow During the Tennis Serve 9
7. Committee on Trauma Research. Injury in America: A ContinuingPublic Health Problem. Washington, DC: National Academy Press,1985.
8. Davis JT, Limpisvasti O, Fluhme D, et al. The effect of pitching biome-chanics on the upper extremity in youth and adolescent baseballpitchers. Am J Sports Med. 2009;37(8):1484-1491.
9. De Leva P. Joint center longitudinal positions computed froma selected subset of Chandler’s data. J Biomech. 1996;29(9):1231-1233.
10. Elliott B. Biomechanics and tennis. Br J Sports Med. 2006;40(5):392-396.
11. Elliott B. Biomechanics of the tennis serve: a biomedical perspective.Sports Med. 1988;6(5):285-294.
12. Elliott B, Fleisig G, Nicholls R, Escamilia R. Technique effects onupper limb loading in the tennis serve. J Sci Med Sport.2003;6(1):76-87.
13. Fregly BJ, Zajac FE. A state-space analysis of mechanical energygeneration, absorption, and transfer during pedaling. J Biomech.1996;29(1):81-90.
14. Girard O, Micallef JP, Millet GP. Influence of restricted knee motionduring the flat first serve in tennis. J Strength Cond Res.2007;21(3):950-957.
15. Girard O, Micallef JP, Millet GP. Lower-limb activity during the powerserve in tennis: effects of performance level. Med Sci Sports Exerc.2005;37(6):1021-1029.
16. Hirashima M, Kudo K, Watarai K, Ohtsuki T. Control of 3D limb dynam-ics in unconstrained overarm throws of different speeds performed byskilled baseball players. J Neurophysiol. 2007;97(1):680-691.
17. International Tennis Federation. ITN on court assessment. http://www.itftennis.com/shared/medialibrary/pdf/original/IO_43630_origi-nal.PDF. Accessed August 10, 2009. [AQ: 8]
18. Johnson CD, McHugh MP, Wood T, Kibler B. Performance demandsof professional male tennis players. Br J Sports Med. 2006;40(8):696-699.
19. Kibler WB. Biomechanical analysis of the shoulder during tennisactivities. Clin Sports Med. 1995;14(1):79-85.
20. Kibler WB, Sciascia A. Kinetic chain contributions to elbow functionand dysfunction in sports. Clin Sports Med. 2004;23(4):545-552.
21. Kibler WB, Thomas SJ. Pathomechanics of the throwing shoulder.Sports Med Arthrosc. 2012;20(1):22-29.
22. Lintner D, Noonan TJ, Kibler WB. Injury patterns and biomechanicsof the athlete’s shoulder. Clin Sports Med. 2008;27(4):527-551.
23. Martin C, Bideau B, Ropars M, Delamarche P, Kulpa R. Upper limbjoint kinetic analysis during tennis serve: assessment of competitive
level on efficiency and injury risks [published online January 7, 2013].Scand J Med Sci Sports. doi:10.1111/sms.12043.
24. Martin C, Kulpa R, Delamarche P, Bideau B. Professional tennis play-ers’ serve: correlation between segmental angular momentums andball velocity. Sports Biomech. 2013;12(1):2-14.
25. Martin C, Kulpa R, Ropars M, Delamarche P, Bideau B. Identificationof temporal pathomechanical factors during the tennis serve. MedSci Sports Exerc. 2013;45(11):2113-2119.
26. McIntosh AS. Risk compensation, motivation, injuries, and biome-chanics in competitive sport. Br J Sports Med. 2005;39(1):2-3.
27. Meeuwisse WH, Tyreman H, Hagel B, Emery C. A dynamic model ofetiology in sport injury: the recursive nature of risk and causation. ClinJ Sport Med. 2007;17(3):215-219.
28. Naito K, Fukui Y, Maruyama T. Energy redistribution analysis ofdynamic mechanisms of multi-body, multi-joint kinetic chain move-ment during soccer instep kicks. Hum Mov Sci. 2012;31(1):161-181.
29. Naito K, Takagi H, Maryama T. Mechanical work, efficiency andenergy redistribution mechanisms in baseball pitching. Sports Tech-nology. 2011;4(1-2):48-64.
30. Pluim BM, Fuller CW, Batt ME, et al. Consensus statement on epide-miological studies of medical conditions in tennis. Br J Sports Med.2009;43(12):893-897.
31. Prilutsky BI, Zatsiorsky VM. Tendon action of two-joint muscles:transfer of mechanical energy between joints during jumping, landingand running. J Biomech. 1994;27(1):25-34.
32. Putnam C. Sequential motions of body segments in striking andthrowing skills: descriptions and explanations. J Biomech.1993;26:125-135.
33. Reid M, Elliott B, Alderson J. Lower-limb coordination and shoulderjoint mechanics in the tennis serve. Med Sci Sports Exerc.2008;40(2):308-315.
34. Robertson DG, Winter DA. Mechanical energy generation, absorptionand transfer amongst segments during walking. J Biomech.1980;13(10):845-854.
35. Shimada K, Ae M, Fujii N, Kawamura T, Takashi K. The mechanicalenergy flows between body segments during baseball pitching. JpnJ Biomech Sports Exerc. 2004;8(1):12-26.
36. USRSA. Racquet Sports Industry Magazine. April 2010. [AQ: 9]37. Van der Hoeven H, Kibler WB. Shoulder injuries in tennis players. Br J
Sports Med. 2006;40(5):453-440.38. Whiting WC, Zernicke RF. Biomechanics of Musculoskeletal Injury.
2nd ed. Champaign, IL: Human Kinetics; 2008.39. Zatsiorsky VM. Kinetics of Human Motion. Champaign, IL: Human
Kinetics; 2002.
For reprints and permission queries, please visit SAGE’s Web site at http://www.sagepub.com/journalsPermissions.nav
10 Martin et al The American Journal of Sports Medicine