Embed Size (px)
Citation preview

Energy Efficiency Trends in Residential and Commercial Buildings
October 2008

2 U.S. Department of Energy
Throughout history, buildings have changed to address social needs. A dramatic example: the advent of the skyscraper a century ago, which exploited the new technology of steel framing to overcome the
scarcity of real estate in teeming American cities. Suddenly real estate extended into a third dimension, enabling extraordinary growth in a contained footprint.
Today’s building industry appears to be entering another era of change, with a view toward minimizing a different kind of footprint: the energy, carbon, and environmental footprint of commercial and residential buildings. Once again, change is being driven by a need to optimize and conserve resources — this time, clean air, water, and energy as well as land. And, once again, transformative technologies may hold the key to meeting the challenges.
As designers, developers, and owners search for ways to minimize the operating costs and environmental impacts of buildings, while also increasing their functionality and appeal to occupants, “green” trends are becoming observable in the marketplace. This report attempts to quantify these emerging trends in the first of what is envisioned to be an ongoing series.
The report outlines key drivers in building construction and use and the resulting impacts on energy consumption. It then discusses the impacts of that energy — particularly fossil-fuel-generated electricity — on carbon released to the atmosphere. Subsequent sections describe building and energy efficiency trends specific to the residential and commercial building sectors. The report ends with a section on policy efforts, such as taxes and regulation, intended to influence building energy use.
While this report was sponsored by the Building Technologies Program within the U.S. Department of Energy’s Office of Energy Efficiency and Renewable Energy, it is not a description of the Department’s programs nor an attempt to make a case for energy efficiency. Its intent, rather, is to document apparent trends in energy efficiency in the U.S. buildings sector based on published data.
Preface
A note on scope: This report is not meant to be comprehensive nor symmetrical in its treatment of the residential and commercial building sectors, state or regional markets, or equipment markets. The analysis is limited by the uneven availability of data. The authors have selected what they viewed as the most pertinent publicly available data for providing insight into market trends.

Contents
Drivers of Energy Use in Buildings 4
Energy Mix and Impacts on Carbon Dioxide Emissions 8
Profile of Residential Energy Use 12
Profile of Commercial Energy Use 19
Impacts of Policy and Regulation 27
Conclusion 30
Figure Sources 31
Notes
• Dataavailabletoevaluateresidentialenergyperformancearemorerobustthanthoseavailabletoevaluatecommercialenergyperformance,andthatdisparityisreflected inthisreport.
• Commercialbuildingsaredefinedasbuildingswithmorethan50percentoffloorspaceusedforcommercialactivitiesincluding(butnotlimitedto)stores,offices,schools,churches,libraries,museums,hospitals,clinics,andwarehouses.
• AsdefinedbytheDOE’sEnergyInformationAdministration(EIA),commercialenergyuseismostly,butnotexclusively,attributabletocommercialbuildings;EIAcommercialdataalsoincludesewagetreatment,irrigationpumping,highwaylighting,andcertainindustrialfacilities.
Energy Efficiency Trends in Residential and Commercial Buildings 3

4 U.S. Department of Energy
Drivers of Energy Use in Buildings
1 http://buildingsdatabook.eren.doe.gov/docs/4.1.3.pdf2 Energy use per square foot of space
The services demanded of buildings — lighting, warmth in the winter, cooling in the summer, water heating, electronic entertainment, computing, refrigeration, and cooking — require significant energy
use, about 40 quadrillion Btu (quads) per year. Energy consumption in buildings has been growing in aggregate over time.
Today, the nation’s 114 million households and more than 4.7 million commercial buildings consume more energy than the transportation or industry sectors, accounting for nearly 40 percent of total U.S. energy use.
The total utility bill for energy used by U.S. buildings topped $369 billion in 2005.1 This energy use is driven by:
• Population,whichdrivesthenumberofhomes,schools,andothercommunity buildings
• Economicgrowth(realGDP),whichisamajordriverofnewfloorspacein offices and retail buildings
• Buildingsize(theamountofcommercialfloorspaceandthesize of homes)
• Servicedemands(lightingandspaceconditioning,electronics, process loads)
• Realenergyprices
• Theefficiencywithwhichenergyservicedemandsaremet
This final factor — energy efficiency trends in the building sector — is the focus of this report. Improvements in technologies and practices over the past three decades — in lighting fixtures, windows, insulation, building controls, and appliances, as well as whole-building design and construction — have made it possible to deliver many building services with lower energy intensity.2

Energy Efficiency Trends in Residential and Commercial Buildings 5
Figure1 GrowthinHousingUnits
Oneofthemajordeterminantsoftotalresidential energy use is the number of households3. The number of U.S. households rose nearly 40 percent (80 million to 113 million) from 1980 to 2005, despite three periods of economic recession. Households and housing are, in turn, driven by population growth. Overall, U.S. population rose from about 228 million in 1980 to nearly 300 million by 2005. This growth — about 30 percent — is slower than the growth in households; household size (persons per household) decreased by 7 percent over this same period.
Population growth drove an increase in the creation of new homes from 1993 to 2005. New housing starts have averaged around 1.5 million per year from 1960 to the present, but housing is highly cyclical. Year-to-year variation is driven by mortgage interest rates and other factors including overall economic activity as measured byGrossDomesticProduct(GDP).Theresidentialhousing industry is a bellwether for the economy, one of the first industries to slow and one of the last to recover from economic downturns as illustrated by the coincident troughs in residential construction and overall economicactivity.Seasonallyadjustedannualhousingstarts recently declined to less than 1 million in March 2008 after reaching a high of over 2 million houses per year during much of 2005 and 2006.
Figure2 CyclicalityinHousingStarts
The number of U.S. buildings has increased since 1980, driven by growth in population and economic activity
3 A household includes all persons who occupy a housing unit, which could be a single family or townhouse, an apartment, a mobile home, or a group of rooms or single room intended as separate living quarters.
0
500
1,000
1,500
2,000
2,500
1961
1963
1965
1967
1969
1971
1973
1975
1977
1979
1981
1983
1985
1987
1989
1991
1993
1995
1997
1999
2001
2003
2005
2007
0
2
4
6
8
10
12
14
16
18
RecessionLowPoints
November1970
March1975
July1980
November1982
March1991
November2001
New Privately Owned Housing Starts
30 Year Fixed MortgageInterest Rate (%)
NewPrivatelyOwned
HousingStarts(Thousands)
InterestRate(%
)
February1961
Population Households
Housing(Millions)
Population(Millions)
70
80
90
100
110
120
200520001995199019851980
225
250
275
300
325
350
375
400

6 U.S. Department of Energy
Figure3 GrowthinCommercialFloorspace
While households have grown, so has the amount of commercial floorspace. Overall economic activity, as measuredbyGDP,isakeydeterminantofcommercialsector growth, and, in turn, commercial floorspace growth.From1980to2005,GDPdoubledinrealtermsfrom $5.8 trillion to $12.4 trillion as measured in constant year 2005 dollars. Consequently, though not perfectly correlated, the absolute amount of commercial floor-space (as measured in square feet) grew by roughly 50 percent over this same period.
Figure4 ValueofCommercialBuildingConstruction
Data on annual additions to commercial floorspace are not publicly available. A proxy is the annual value of commercial building construction, which roughly tracks GDPgrowth.Duringthe1990s,theannualvalueofcommercial building construction roughly doubled before falling precipitously during the recession in the early part of this decade. The drop in commercial construction was felt most strongly in office, lodging, and warehouse construction, sectors that had seen the strongest growth during the preceding decade. By 2006, the annual value of commercial building construction had largely recovered and was again approaching the peak seen in 2000, when it surpassed $200 billion.
Floorspace GDP
2,000
2204,000
6,000
8,000
10,000
12,000
0
10
20
30
40
50
60
70
80
1980 1990 2000 2005
Floorspace(109squarefeet)
GDP($2005Billion)
100,000
120,000
140,000
160,000
180,000
200,000
220,000
8,000
9,000
10,000
11,000
12,000
13,000
14,000
200720062005200420032002200120001999199819971996199519941993
Value of Commercial Building Construction
GDP
ValueofCommercialBuildingConstruction
($2005Million)
GDP($2005Million)

Energy Efficiency Trends in Residential and Commercial Buildings 7
Figure6 ValueofBuildingImprovementsandRepairs
The value of residential and commercial repairs and retrofits reached nearly $400 billion in 2005. These improvements ranged from home remodeling or roofing to commercial lighting retrofits or complete building tear-outs. This activity, combined with the value of new construction, brought the buildings industry’s contributiontoGDPto9percentin2005.Aswithnewconstruction, residential improvements and retrofits are greater in dollar terms than commercial improvements and have seen significant additional growth this decade.
Housing starts have recently declined after strong growth
Figure7 TrendsinHousingStartsbyRegion
A contributor to the increasing value of residential new construction, single-family housing starts sustained solid growth during the early part of this decade, rising from1.4millionunitsin2001toapeakofjustover1.7million units in 2005. From 2005 to 2007, single-family housingstartsdeclinedbyabout30percenttojustover1 million. The South, which accounted for about half of overall U.S. housing starts throughout the period, grew in importance at the expense of the Midwest; it also accounted for the largest absolute decline in housing starts, going from a peak of over 830,000 in 2005 to around 540,000 in 2007.
The buildings industry — including new construction and renovation — accounts for over 9 percent of GDP
Figure5 ValueofNewBuildingConstruction
Construction of new residential and commercial building contributedover6percentofGDP,accountingforover$775 billion of a $12.5 trillion economy in 2005. While the relative contributions of residential and commercial construction were about even during most of the last two decades, residential construction has been a strong engine of economic growth, nearly doubling its share of GDPfrom2000to2005.
0
100
200
300
400
500
600
700
800
900
200520001995199019851980
All Buildings Residential Commercial Buildings%GDP
$2005Billio
n
%GDP
0
1
2
3
4
5
6
7
100
150
200
250
300
350
400
450
2010200520001995199019851980
All Buildings Residential Commercial Buildings%GDP
$2005Billio
n
%GDP
0.0
0.5
1.0
1.5
2.0
2.5
3.0
3.5
4.0
0
100
200
300
400
500
600
700
800
900
200820072006200520042003200220012000
Northeast Midwest South West
NewSingle-FamilyHomeStarts(Thousands)

8 U.S. Department of Energy
Overall growth in the U.S. housing market, despite the recent down-turn, has driven an increase in electricity consumption. Electricity is the largest energy source for buildings, and that predominance has
grown. Natural gas is the second largest energy source and petroleum (predominantly heating oil) a distant third. Buildings demand for electricity was the principal force behind the 58 percent growth in net electricity generation from 1985 to 2006.
Over 70 percent of U.S. electricity is generated by burning coal, petroleum, or natural gas; another 20 percent is generated by nuclear power stations; and less than 9 percent comes from renewable sources, with 7 percent of that from hydroelectric dams. Conversions from one fuel form to another entail losses, as does the transportation and distribution of electricity over power lines. These losses are roughly twice the size of actual purchases, making electricity the largest buildings energy source in “primary” terms (including conversion and transportation losses) at about 72 percent in 2005.
The burning of coal and natural gas to supply buildings with electricity, coupled with direct burning of natural gas, makes buildings responsible for the largest share of U.S. carbon dioxide emissions. With the increase in buildings electricity consumption, that proportion has risen from about one-third of the total in 1980 to almost 40 percent in 2005.
Energy Mix and Impacts on Carbon Dioxide Emissions
Energy Efficiency Trends in Residential and Commercial Buildings 9
Buildings account for 72 percent of U.S. electricity use and 36 percent of natural gas use
Figure8 GrowthinBuildingsEnergyUseRelativetoOtherSectors
Buildings account for 40 percent of all energy use in the United States. This sector consumes more energy than either industrial or transportation, surpassing industrial as the number one consuming sector in 1998. Both residential and commercial building energy use are growing, and represent an ever-increasing share of U.S. energy consumption. While residential energy consumption exceeds commercial, the latter has been increasingmorerapidly,risingfromjust14percentoftotal U.S. energy consumption in 1980 to 18 percent by 2005, a 70 percent increase.
Figure9 PredominanceofElectricityasBuildingsEnergySource
The growth in buildings energy consumption comes predominantly from electricity. Electricity’s share of primary energy use in buildings increased from 56 percent in 1980 to 72 percent in 2005. The most versatile fuel form, electricity also is the most expensive per equivalent Btu. Electricity usage accounted for 65 percent of building energy costs in 2005. However, electricity prices declined in real terms during this period and, as a result, expenditures for electricity did not rise as quickly as overall usage. Still, electricity expenditures rose with increased demand from $144 billion in 1980 to $238 billion in 2005 as measured in constant 2005 dollars.
Use of natural gas, the second largest energy source in the buildings sector, was essentially flat from 1980 to 2005 and decreased as a percentage of total use from 28percentin1980tojust20percentby2005.Still,expenditures rose significantly due to an increase of more than 60 percent in the price of natural gas, which was driven largely by increased utility demand for gas to be used for electricity production.
Petroleum (mostly used as home heating fuel) declined in both absolute and relative terms from 1980 to 2005, fallingfromjustover3quadstoabout2.3quads.Totalexpenditures also fell significantly for petroleum due to decreased usage, even though prices increased by 10 percent over this period.
Note: According to the EIA, primary energy refers to “All energy consumed by end users, excluding electricity but including the energy consumed at electric utilities to generate electricity.” On the other hand, site energy is the energy consumed at a home or building, also called “delivered energy.”
Residential Commercial Buildings Total
TransportationIndustrial
5
10
15
20
25
30
35
40
45
200520001995199019851980
Quads
0
5
10
15
20
25
30
2005200019901980
PrimaryEnergy(Quads)
$2005Billio
n
0
50
100
150
200
250
NaturalGas Petroleum Electricity
Electricity Expenditures
NaturalGasExpenditures
Petroleum Expenditures

10 U.S. Department of Energy
Figure10 GrowthinElectricitySalesinBuildingsRelativetoIndustry
From 1985 to 2006, retail sales of electricity to residential and commercial buildings increased by 1,180 billion kWh, an increase of nearly 80 percent. Over the same period, industrial sector demand for electricity increased by 165 billion kWh, or 20 percent. Stated differently, of the total increase in retail electricity sales reported by the EIA from 1985 to 2006, 87 percent was attributable to buildings sector demand. This large increase in turn drove the need for more power plants, and for more coal, uranium, and natural gas to generate electricity. Coal-fired plants accounted for 39 percent of the increase, natural gas-fired plants for 31 percent, and nuclear plants for 28 percent. (In the case of nuclear power, much of the increase in net generation was due to increased plant capacity factor, which rose from 58 percent in 1985 to 90 percent in 2006.)
Figure11 ImportsofFuelsNeededforElectricityGeneration
Natural gas, which has accounted for a growing share of new power generation capacity, is an increasingly imported commodity. Imports grew from 5 percent of U.S. total use in 1985 to nearly 20 percent in 2005. The United States imports the most natural gas from Canada: 85 percent of total imports in 2006.
A large portion of uranium for nuclear fission is imported. Owners and operators of U.S. civilian nuclear power reactors purchased a total of 67 million pounds of uranium oxide equivalent from U.S. and foreign suppliers during 2006. Approximately 16 percent of all uranium purchased was U.S.-origin; foreign-origin uranium accounted for 56 million pounds (84 percent) of the deliveries. In 2006, the three most important nations from which the U.S. imported uranium were Australia (30 percent), Russia (27 percent), and Canada (24 percent). Although less important, other sources of uranium include Namibia, Uzbekistan, Kazakhstan, and South Africa.
0
500
1,000
1,500
2,000
2,500
3,000
20052003200119991997199519931991198919871985
Buildings Industry
Sales(BillionkW
h)
NaturalGasImported
0
10
20
30
40
50
60
70
80
90
100
200520001995199019851980
Coal Imported Uranium Imported
%Imported

Energy Efficiency Trends in Residential and Commercial Buildings 11
U.S. buildings currently contribute 9 percent of the world’s carbon dioxide emissions
Figure12 ContributorstoElectricityCO2Emissions
The growth in buildings energy consumption has resulted in carbon dioxide emissions rising from about a third of total U.S. emissions in 1980 to almost 40 percent by 2005. This is a function of the increase in buildings electricity use, 70 percent of which is dependent on fossil fuels. Despite recent efforts to use cleaner coal technologies,themajorityofcarbondioxideemissionsare still attributable to coal. Both geothermal and municipal solid waste represented negligible amounts of carbon dioxide emissions: 0.4 and 11 million metric tons in 2005, respectively.
Figure13 CO2EmissionsofU.S.BuildingsRelativetoJapan,France,andtheUnitedKingdom
From a global perspective, U.S. buildings represented about 9 percent of worldwide carbon dioxide emissions in 2005 (2,318 million metric tons of carbon dioxide). In fact,U.S.buildingswouldrankjustbehindtheUnitedStates itself (5,957) and China (5,322) as the largest source of carbon dioxide emissions. Carbon dioxide emissions from U.S. buildings exceed the combined emissions of Japan, France, and the United Kingdom.
OilCoal
0
500
1,000
1,500
2,000
2,500
20052004200320022001200019991998199719961995199419931992199119901989
GeothermalMunicipal Solid Waste
Natural Gas
CO
2Emissions(MillionMetricTo
ns)
0
500
1,000
1,500
2,000
2,500
200520001995199019851980
United Kingdom
FranceJapan U.S. Buildings
CO
2Emissions(MillionMetricTo
ns)

12 U.S. Department of Energy
Profile of Residential Energy Use
12 U.S. Department of Energy
Residential buildings include single-family detached and attached homes, apartments, and mobile homes. In recent decades, growth in household wealth and other factors have spurred demand for
larger homes and more energy services, increasing energy consumption per household. Also, increased saturation of appliances and equipment, including computer and entertainment systems, has resulted in more demand for energy, particularly electricity.
To some degree, the growth in housing unit size and demand for energy services has been countered by improvements in energy intensity. Some energy end uses have become much more efficient in the past three decades, such as refrigeration and clothes washing. Efficiency gains also have been made in heating, ventilation, and air conditioning equipment, as well as in windows and insulation. As a result, from 1985 to 2004, the energy intensity of the residential sector decreased by 9 percent as measured by energy use per household. Nevertheless, the growth in the number of households and size of houses increased total energy use.
Tighter state building energy codes have been a factor in the rise of residential energy efficiency. In addition, more new homes are being constructed to meet the targets of energy efficiency programs, and 46 percent of new home buyers cite energy efficiency as a primary consideration in their purchasing decisions.4 Many programs exist to addressefficiencyinhomes:BuildingAmerica,ENERGYSTAR,Masco’sEnvironments for Living™, and the newly-launched Leadership in Energy and Environmental Design (LEED) for homes.
Using today’s best practices, builders have demonstrated that it is possible to design and construct new houses that are 30 to 40 percent5 lower in energy intensity than a typical code house, at little or no additional cost. Still, such high-performance homes hold a very small market share.
4 NationalAssociationofRealtors.“SellingGreen”PocketCard. http://www.realtor.org/research.nsf/0/a652a2a016fe9575852573f00059ed9f?OpenDocument
5 Results of the DOE Building America R&D program, as documented in “Best Practices” guides

Energy Efficiency Trends in Residential and Commercial Buildings 13
Profile of Residential Energy Use
Energy Efficiency Trends in Residential and Commercial Buildings 13
Figure15 Top5Builders’PercentageofNewHomeClosings*
Thetopfiveresidentialbuildersrepresentjust20percentof the market; they have held the top positions since 2004. This market fragmentation makes it difficult to address efficiency as most builders have a limited reach.
Residential construction and renovation are highly fragmented markets
Figure14 IndustryConsolidation:Top400Builders’PercentageofNewHomeClosings
The residential construction industry consists of nearly 100,000 builders who each year construct approximately 2 million new homes and retrofit nearly 27 million. The residential building market is slowly consolidating as larger firms acquire smaller ones. New home closings bythe400largestbuilders(“Giants”)were21percentof the market in 1995, rising to 36 percent in 2005. Put a different way, in 1995 the top 400 builders closed 275,000 homes but in 2005, the top 10 alone closed over 280,000. The period of growth in new housing construction and increasing consolidation has resulted in substantial growth for the largest companies. This trend indicates the importance of educating the largest builders on energy-efficient strategies and techniques because of their market impact.
Giant400Share of U.S. Total
0
5
10
15
20
25
30
35
40
20052004200320022001200019991998199719961995
Top 10 Builders Share of U.S. Total
NewHomeClosings(%
)
79%
20%
4.7%
3.5%
3.0%
5.0%
3.9%
*Chart does not add up to 100% due to rounding.
Note: Top 10 data not available before 2003.
LennarHomes
CentexCorporation
PulteHomes D.R.
Horton
KB Home
Other
Top 5Builders

14 U.S. Department of Energy
Total residential energy use — which has grown along with the number and size of houses and “plug loads” — has been partially offset by reduced energy intensity per home
Figure16 AverageSizeofNewHomesandAverageNumberofPeopleperHome
Since 1980, housing units in the United States have grown larger, while the number of occupants per home has decreased. Fewer people have been taking up more space, due to such factors as higher incomes, smaller families, and deferred marriage.
Figure17 MarketSaturationforResidentialEquipmentandAppliances
As home size grows, so does residential energy consumption, with new end uses driving much of the growth. Air conditioners, dishwashers, computers, televisions, and small appliances are increasingly prevalent in American homes. Microwave ovens were found in 8 percent of homes in 1978; by 1997, 83 percent of households had them. Over that same period, households with air conditioning increased from 56 percent to 78 percent. Personal computers, nonexistent 25 years ago, are now almost standard in U.S. homes.
500
1,000
1,500
2,000
2,500
3,000
200620021998199419901980
Single-Family Average Multi-Family Average Average Household Size
AverageHomeSize(Square
Fee
t)
AverageHouseholdSize
2.45
2.50
2.55
2.60
2.65
2.70
2.75
2.80
20
30
40
50
60
70
80
90
2004200220001998199619941992199019881986198419821980
With AC With Computer With Dishwasher
PercentofHouseholds
Energy Efficiency Trends in Residential and Commercial Buildings 15
Figure19 EnergyUseIntensityandFactorsintheResidentialSector6
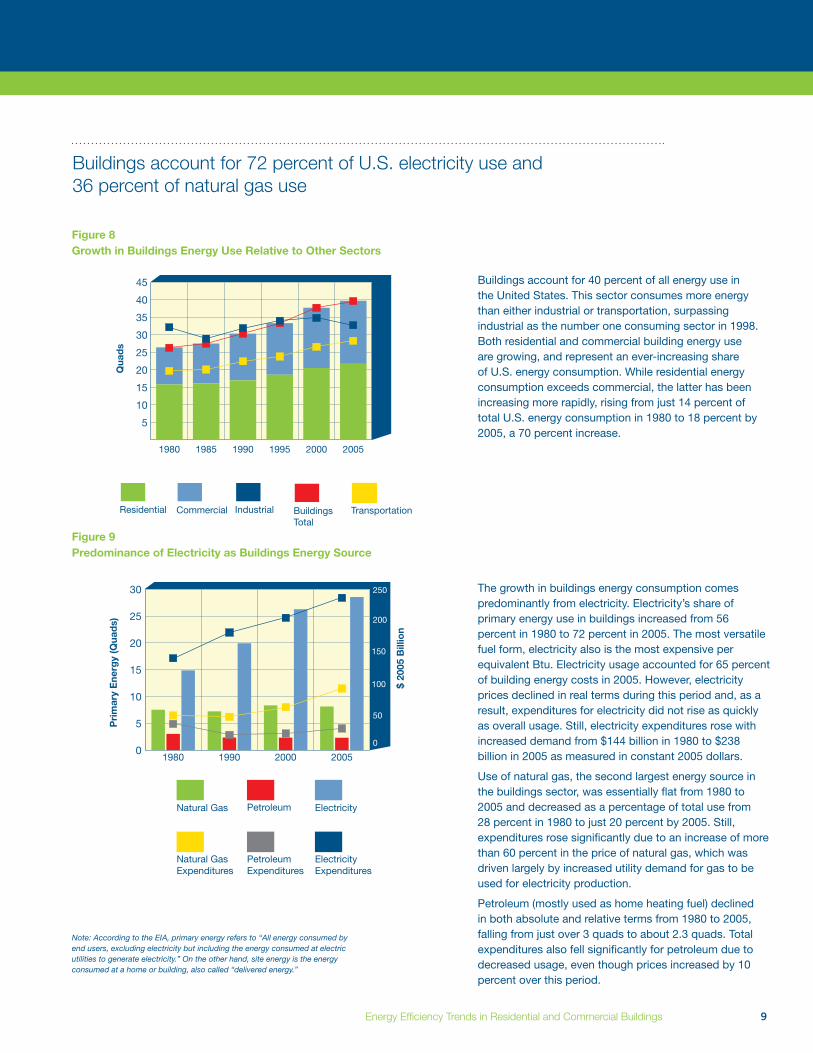
Figure 19 is an index for total energy consumption, number of households, house size, a combined structural component that captures many of the “other explanatory factors,” and energy intensity over the period from 1985 to 2004. The number of households increased over this period from 86.8 million to 110.7 million (27.5 percent), while energy consumption increased from 14.7 quads to 19.7 quads. Residential energy consumption, measured as total energy (i.e., including electricity losses), increased overall by about 34 percent. Consumption declined in 1990, 1997, 1998, and 2001, years of mild winter weather. The overall effect of non-efficiency-related changes has been to increase energy use by about 15.5 percent. The residential energy intensity index, based on energy use per square foot, has generally trended downward since 1985, with the greatest declines observed in the early part of the 1990s.
Figure18 ResidentialPrimaryEnergyEnd-UseSplits,2005
Most of the energy used in a home goes towards conditioning the space, which is often more affected by the size of the house than the number of occupants. Heating, cooling, and lighting are still the largest single energy end-uses in a home, despite increased energy efficiency of this equipment.
* The pie chart includes 1 quad of energy (4.7%) that is a statistical adjustment by the Energy Information Administration to reconcile two divergent data sources.
6 The methodology and data for the energy intensity indicators were developed by a laboratory-university team comprising the Pacific Northwest National Laboratory, Stanford University’s Energy Modeling Forum, Argonne National Laboratory, Oak Ridge National Laboratory, and Lawrence Berkeley National Laboratory under contract to the U.S. Department of Energy.
TotalResidentialPrimary energy use is 21.8 quads
30.7%Space Heating
12.3%Space Cooling
12.2%WaterHeating
11%Lighting
7.5%Refrigeration
7.4%Electronics
4.8%Wet Clean
4.5%
4.7%*
Cooking
1.1%Computers
3.8%Other
0.5
0.6
0.7
0.8
0.9
1.0
1.1
1.2
1.3
1.4
2003200119991997199519931991198919871985
TotalEnergyIndex(1985=1.0)
Energy Use
Total Households
Housing Size
Structure (incl. weather)
Intensity (per SF)

16 U.S. Department of Energy
State building energy codes are increasing energy efficiency
Figure20showsprojectedsavingsfromimprovementsin the leading national residential energy efficiency code from 1975 to 2005. The advent of U.S. residential energy codes was ASHRAE Standard 90-75 in 1975. In 1983, code official organizations issued the first edition of the Model Energy Code (MEC), renamed the International Energy Conservation Code (IECC) in 1998. Most states have incorporated some version of the IECC into their residential building energy code.
This figure includes only the energy end-uses addressed by the IECC for residential buildings: heating, cooling, and domestic water heating. It does not factor in code adoption, building design (e.g., increasing average house size), or other factors outside the scope of these codes, notably mandatory Federal equipment efficiency improvement standards (for air conditioners, refrigerators, etc.). The 2006 IECC allows approximately 14 percent less energy use for code-regulated end-uses than the original code in 1975. The U.S. Department of Energy (DOE) is focused on achieving an additional 30 percent improvement between the 2006 IECC and the 2012 IECC.
Figure20 ResidentialEnergyCodeStringency(MeasuredonaCode-to-CodeBasis)
50
60
70
80
90
100
110
120
2005200019951990198519801975
EnergyUseIndex(1975use=100)
Standard 90-75
MEC 1983/86
MEC 1992/93
10% Savings2% Savings
1% Savings
MEC 1995
IECC 1998 IECC
2004/06

Energy Efficiency Trends in Residential and Commercial Buildings 17
Figure21 ResidentialEnergyCodesin1992andasofAugust2008
In 1992, only four states and two U.S. territories had a residential energy code that met the requirements laid out in the Energy Policy Act of 1992, which called for a code that met or exceeded the provisions of the 1992 Model Energy Code (MEC 92). While other states had adopted codes, they were older than MEC 92.
By August 2008, all but twelve states and one U.S. territory had a statewide code. Among the states without a statewide code, or those with older codes, there was some adoption of codes by individual counties or localjurisdictions.Insomeofthesestates,asignificantfraction of construction was covered by codes, such as in Arizona with codes for Phoenix and Tucson. Thirty-two states and one territory (shown in yellow, light green, and dark green) met the standards DOE had set in the determination process set out in the Energy Policy Act of 1992.7 States and territories marked in red adopted a code older than the IECC 1998, which does not meet the standards set by DOE in the determination process.
7 DOE is required by the Energy Policy Act of 1992 to determine whether new versions of the MEC (or its successor IECC) (for low-rise residential buildings) save energy. This process is formally known as a DOE determination. Under the residential portion of the determination process, states are required to consider the adoption of a new residential code whenever DOE issues a positive determination (meaning the new version saves energy).
1992 MEC equivalent or better
Figure 21
American Samoa
Guam
N. Mariana Islands
Puerto Rico
U.S. Virgin Islands IECC 2006 equivalent
or betterIECC 2003 or equivalent
IECC 2001-1998 or equivalent
Older or lessstringent thanIECC 1998
No Statewide Code
*Adoption by county/jurisdiction
1992
2008
Territories
American Samoa
Guam
N. Mariana Islands
Puerto Rico
U.S. Virgin Islands
Territories
Note: New Jersey adopted the 2006 IECC with amendments such that code stringency is similar to 2003 IECC. Additionally, New York has adopted the 2004 supplement to the 2003 IECC.

18 U.S. Department of Energy
Energy efficiency in homes has become more prevalent in the past several years
Figure22 ENERGYSTAR®HomesConstructed
Goingbeyondenergycodes,increasingnumbersofnew homes are being constructed to meet the targets of energy efficiency programs. One such program, ENERGYSTAR® Homes, achieved an average national market presence of 12 percent in 2006, labeling nearly 200,000newhomes.Todate,nearly840,000ENERGYSTAR-qualified homes constructed save consumers an estimated $200 million annually in utility bills.8
Figure23 MarketSharesofSelectedENERGYSTARProducts
ENERGYSTARappliancesarebecomingmoreprevalentin U.S. homes, although market penetration fluctuates with criteria revisions. By design, the performance criterianeededtoreachENERGYSTARlevelsarealwaysincreasing.AlthoughmarketpenetrationofENERGYSTARappliancesistypicallyunder40percent,ENERGYSTAR brand recognition has grown to 70 percent. Over 40,000productmodelscarrytheENERGYSTARlabel.8
8 EPA.ENERGYSTAR™Overviewof2007Achievements,http://www.epa.gov/appdstar/pdf/2007overview.pdf
Annual Homes Built Cumulative Homes Built
0
100,000
200,000
300,000
400,000
500,000
600,000
700,000
800,000
900,000
2007*2006200520042003200220012000
Num
berofHomesBuilt
0
10
20
30
40
50
60
200620052004200320022001*2000199919981997
Refrigerators Clothes Washers
Lights Room Air Conditioners
MarketShare(%
)
* Reflects transition to more stringent specification and slowdown in U.S. housing starts.
* On January 1, 2001, ENERGY STAR changed its refrigerator criteria to achieve 10 percent greater efficiency than the 2001 Federal standard.

Energy Efficiency Trends in Residential and Commercial Buildings 19
Profile of Commercial Energy Use
The commercial sector is considerably more heterogeneous than residential buildings, encompassing hospitals, schools, offices, houses of worship, lodging, and the retail sector with its big box
stores, enclosed malls, strip malls, grocery stores and fast food and sit-down restaurants. Each of these commercial sub-sectors is unique in its market structure, energy use, and energy intensity, and in the set of decisionmakersinvolvedindesignandconstructionprojects.9 The two largest energy-using sectors are offices and retail.
In 2003, there were 4.86 million commercial buildings in the United States, with an average size of 14,700 square feet.10 The U.S. adds about 1.6 billion square feet per year — nearly 110,000 buildings annually at the mean size, or roughly half a million buildings every five years.11 The sheer magnitude of annual growth of the commercial sector provides a larger context in which to understand some of the important, but still relatively small, achievements in “green” buildings.
One widely known measure of buildings energy performance is the ENERGYSTARlabel,introducedbytheEnvironmentalProtectionAgency(EPA) for commercial buildings in 1999. Buildings achieving a score of 75orhigher(ona1–100scale)areeligiblefortheENERGYSTARlabel,indicating that they are among the top 25 percent in the country for energy performance. EPA reports that commercial buildings that have earned the ENERGYSTARlabeluseonaverage35percentlessenergythansimilarbuildings.12
Another widely known green indication in the marketplace is the Leadership in Energy and Environmental Design (LEED) rating system, developedbytheU.S.GreenBuildingsCouncil.LEEDisnotjustaboutenergy efficiency. It promotes a whole-building approach to sustainability by recognizing performance in five key areas of human and environmental health: sustainable site development, water savings, energy efficiency, materials selection, and indoor environmental quality. Ratings range from the lowest, LEED certified, to the highest, LEED Platinum. It is important to note, however, that a LEED “certified” building need not be energy efficient; it may simply be compliant with the American Society of Heating, Refrigerating and Air-Conditioning Engineers (ASHRAE) standard.
The relatively recent and small penetration of LEED certifications, and evenofENERGYSTAR-certifiedbuildings,may—incombinationwithother factors — help explain why commercial building energy intensities have trended upward over time.
9 For example, see J. Reed and K. Johnson, 2004, “Who Plays and Who Decides,” Innovologie LLC, a report for the U.S. Department of Energy.
10 EIA’s Commercial Buildings Energy Consumption Survey (CBECS) for 2003 available at: http://www.eia.doe.gov/emeu/cbecs/cbecs2003/detailed_tables_2003/pdf2003/alltables.pdf
11 EIA, Annual Energy Outlook 2008, Table A5, “new additions” through the year 2010.12 Energy Star web site, http://www.energystar.gov/index.cfm?c=business.bus_bldgs

20 U.S. Department of Energy20 U.S. Department of Energy
Commercial buildings encompass many different building types
Figure24 CommercialBuildingTypes:Floorspace,Number,andPrimaryEnergyConsumption
Commercial sectors can be characterized by number of buildings, total floorspace, and energy use. In terms of percentage of energy use, the six largest sectors are office and mercantile, at a little less than 20 percent each, followed by education (11 percent), health care (8 percent), and lodging and warehouse (each at 7 percent). Average floorspace for offices, warehouse, and public assembly is near the middle of the commercial buildings spectrum. Health care is by far the largest building type, followed by lodging, education, and other.
Figure25 Top15OfficeOwners,2006(Globally)
Figure 25 shows the top 15 office owners based on self-reported data according to “National Real Estate Investor.” Data reflect global office portfolios as of December 31, 2006 (completed development and new construction); U.S.-specific activity was not listed separately. Brookfield Properties was the number one developer listed, with nearly 80 million square feet of office space, followed by Tishman Speyer. Large owners potentially represent very strategic resources for the adoption of energy-efficient designs and technologies.
0
2
4
6
8
10
12
14
16
18
20
Vaca
nt
Oth
er
Pub
lic O
rder
and
Saf
ety
Food
Ser
vice
Food
Sal
es
Hea
lth C
are
Rel
igio
us W
orsh
ip
Pub
lic A
ssem
bly
Ser
vice
*
Lod
ging
War
ehou
se a
ndS
tora
ge
Ed
ucat
ion
Ret
ail a
nd M
all
Offi
ce
Total Floorspace Total Buildings Primary Energy Consumption
TotalCommercialFloorspace(%
)
*“Service” is non-retail and non-food sales and includes gas stations, kennels, beauty parlors, car washes, dry cleaners, and tanning salons.
0 10 20 30 40 50 60 70 80
Brookfield Properties
Tishman Speyer
LaSalle Investment Management
Hines
TIAA-CREF
Boston Properties
HRPT Properties Trust
Wells Real Estate Funds
CB Richard Ellis Investors LLC
Mack-Cali Realty
RREEF
Vornado Realty Trust
INGClarion
Brandywine Realty Trust
Hillwood
SquareFootage(Millions)

Energy Efficiency Trends in Residential and Commercial Buildings 21
The retail sector is fragmented; the top 10 retailers own approximately 8 percent of the total retail stores by number. Figure 26 shows the top 10 U.S. retailers by business volume, based on data reported by the online resource “Chain Store Age.” In aggregate, retailers earned $1.576 trillion in revenues in 2006. The number one retailer, Wal-Mart, had revenues of $345 billion (22 percent of the total) in 6,779 stores. Wal-Mart added over 700 stores from 2005 to 2006. The number two retailer, Home Depot, had revenues of $90.8 billion in 2,147 stores, and added 105 stores in 2006.
Figure27 CommercialBuildingOwnershipandOccupancy,2003(Non-MallBuildings)
While most residential buildings are owner-occupied (single-family, non-rented), the commercial market is more diverse. The private sector owns 77 percent of commercialfloorspace,themajorityofwhichissplitevenly between owner- and non-owner occupied; governments own the remaining 23 percent. Efficiency efforts in commercial buildings must target the concerns of decision-makers, who may or may not be the building’s occupants.
Figure28 NumberandFloorspaceofCommercialBuildings
Since 1980, growth in the number of buildings has outpaced growth in floorspace, indicating a trend toward somewhat smaller commercial buildings. Most commercial buildings are small: 53 percent are less than 5,000 square feet. However, 35 percent of total commercial floorspace is found in buildings over 100,000 square feet (which represent only 2.2 percent of commercial buildings by number). While few in number, large commercial buildings can have a significant impact on energy efficiency.
Figure26 Top10Retailers,Rankedby2006TotalRevenue
2006 NumberofStoresRetailer/ Revenues CorporateHeadquarters (Billions) 2005 2006
Wal-Mart Stores, Inc. $345.0 6,037 6,779 Bentonville, AR
The Home Depot $90.8 2,042 2,147 Atlanta,GA
The Kroger Co. $66.1 3,726 3,659 Cincinnati, OH
Target Corp. $59.5 1,397 1,488 Minneapolis, MN
Costco $59.0 433 458 Issaquah, WA
Sears Holdings $53.0 3,843 3,791 Hoffman Estates, IL
Walgreen Co. $47.4 4,985 5,461 Deerfield, IL
Lowe’s Cos. $46.9 1,234 1,385 Mooreville, NC
CVS Caremark Corp. $43.8 5,471 6,202 Woonsocket, RI
Safeway $40.2 1,775 1,761 Pleasanton, CA
Floorspace Buildings
0
10
20
30
40
50
60
70
80
2005200019901980
Floorspace(BillionsofSquare
Fee
t)
Buildings(Millions)
0.5
1.0
1.5
2.0
2.5
3.0
3.5
4.0
4.5
5.0
TotalFloorspace:64.8BillionSquare Feet
36%PrivateOwner-Occupied
37%PrivateNon-Owner-Occupied
15%Local Govt.
5%State Govt.
3%Federal Govt.
3%PrivateUnoccupied
22 U.S. Department of Energy
Overall commercial energy use has grown, and only recently has some improvement in energy intensity been noted
Figure29 CommercialPrimaryEnergyEnd-UseSplits,2005
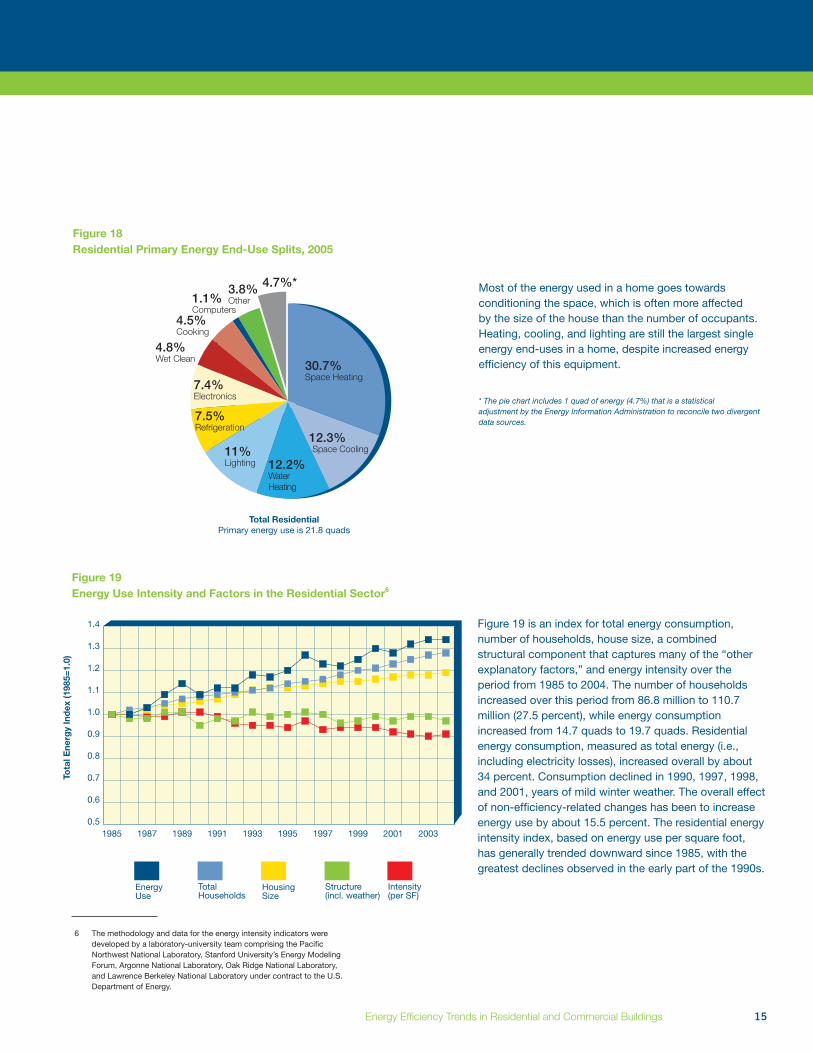
How energy is used in a commercial building has a large effect on energy efficiency strategies. The most important energy end-use across the stock of commercial buildings is lighting, accounting for fully one-quarter of total primary energy use. Heating and cooling are next in importance, each at about one-seventh of the total. Equal in magnitude — although not well defined by the Energy Information Administration — is a catch-all category of “other uses” such as service station equipment, ATM machines, medical equipment, and telecommunications equipment. Water heating, ventilation, and non-PC office equipment are each around 6 percent of the total, followed by refrigeration, computer use, and cooking.
* The pie chart includes 1 quad of energy (5.5%) that is a statistical adjustment by the Energy Information Administration to reconcile two divergent data sources.
Note: Two caveats apply to this aggregate presentation. First, these percentages are statistical estimates, not physical measurements derived from actual end-use metering in buildings. Second, the importance of individual end-uses varies by building type. For instance, cooking is dominant in restaurants, water heating in hospitals, and refrigeration in grocery stores.
Figure30 CommercialEnergyUseIntensityandFactors13
Figure 30 depicts index numbers for energy use based on total energy consumption, increases in floorspace, weather effects, and energy intensity from 1985 to 2004. Estimated total floorspace in commercial buildings grew slightly more than 35 percent over the period, with particularly rapid growth in the latter part of the 1990s.
Total primary energy consumption (i.e., including elec-tricity losses) has increased every year since 1985, with the single exception of 2003. By 2004, total commercial energy consumption was nearly 50 percent higher than in 1985.
Commercial building sector energy intensity increased by 12 percent over the period. However, the trend shows a leveling off and slight decline since 2002.
Commercial buildings are sensitive to weather, although not to the same degree as residential buildings. The chart shows the estimated weather factor (as an index), based on heating and cooling degree-days by census region. The years 1990 and 1992 stand out: calendar year 1990 was characterized by a very warm winter weather and 1992 by an especially cool summer. The decreases in intensity observed in 1991 and since 2001 are primarily the result of weakness in the economy as a whole, resulting in increased vacancy rates of commercial office and retail space and falling utilization of occupied space.13 The methodology and data for the energy intensity indicators were
developed by a laboratory-university team comprising the Pacific Northwest National Laboratory, Stanford University’s Energy Modeling Forum, Argonne National Laboratory, Oak Ridge National Laboratory, and Lawrence Berkeley National Laboratory under contract to the U.S. Department of Energy.
0.5
0.6
0.7
0.8
0.9
1.0
1.1
1.2
1.3
1.4
1.5
1.6
20052003200119991997199519931991198919871985
Energy Consumption
Floorspace Intensity Index (weatheradjusted)
Weather Factor
EnergyUseIndex
25.5%Lighting
14.2%Space Heating
13.1%Space Cooling6.8%
Water Heating
6%Ventilation
13.2%Other
3.2%Computers
2%Cooking
4.1%Refrigeration
6.3%
5.5%*
Electronics

Energy Efficiency Trends in Residential and Commercial Buildings 23
Commercial energy codes are increasing energy efficiency
Figure31 CommercialEnergyCodeStringency(measuredonacode-to-codebasis)
Energy use in commercial buildings is affected by the adoption of commercial energy codes, which originated in 1975 with the development of the American Society of Heating, Refrigerating and Air-Conditioning Engineers Standard90-75(“90”forASHRAEProjectCommittee90 and “75” for 1975, the year of publication). All energy codes and standards are historically linked14 to this original standard. Over the years, ASHRAE has added the Illuminating Engineering Society of North America (IESNA) as a co-sponsor to its standard, and also conducted the development of its standard under American National Standards Institute (ANSI) processes, adding these organizations to the title as well. In a parallel development, the requirements from ASHRAE standards have also been codified for adoption by states. This codification was first carried out in 1977 by the National Council of States on Building Codes and Standards (NCSBCS) in its Model Code for Energy Conservation (MCEC) (1977), then by the Council of American Building Officials (CABO) in its Model Energy Codes (MEC) (1983 to 1995), and currently by the International Code Council (ICC) in its International Energy Conservation Code (IECC) (1998 to present).
Since the passage of the Energy Policy Act of 1992, DOE has been responsible for tracking progress in ASHRAE Standard 90.1 and alerting states to the need for them to adopt new commercial energy codes that meet or exceed the provisions of any version of Standard 90.1 that DOE determines to save energy. Figure 31 shows the relative progress15 since the advent of U.S. commercial energy codes with ASHRAE Standard 90-75 in 1975 through ANSI/ASHRAE/IESNA Standard 90.1-2004. Through DOE’s latest determination for this standard, new commercial codes allow 25 percent less energy for code-regulated end-uses than the original commercial energy codes.16 DOE is focused on achieving an additional 30 percent improvement between Standard 90.1-2004 and Standard 90.1-2010.
14 Thenameoftheprojectcommitteehaschangedfrom90to90Ato90.1,butthelinkageremainsthesame.15 Not shown on this graph is ASHRAE Standard 90.1-2007, released in December 2007. Analysis of the savings for this standard is
ongoing, but preliminary indications are that there will be positive savings on the order of 3 percent to 7 percent.16 DOE is required by the Energy Policy Act of 1992 to determine whether new versions of ASHRAE Standard 90.1 (for commercial and
high-rise multi-family residential buildings) save energy. This process is formally known as a DOE determination.
50
60
70
80
90
100
110
120
2004200019951990198519801975
EnergyUseIndex(1975use=100)
Standard 90-75
Standard 90A-1980
Standard 90.1-1989
14% Savings 4% Savings
11% Savings
Standard 90.1-1999
Standard 90.1-2004

24 U.S. Department of Energy
Figure32 CommercialEnergyCodesin1992andasofAugust2008
In 1992, only five states and one U.S. territory had a commercial code that met the Energy Policy Act of 1992 requirements, which called for a code that met or exceeded the provisions of the ANSI/ASHRAE/IESNA Standard 90.1-1989. In 1992, there were other states with statewide codes, but the codes adopted in those states were older than Standard 90.1-1989.
By August 2008, all but ten states and one U.S. territory had statewide energy codes. Of the states without statewide codes (shown on the map in white), nine had county or local adoption of energy codes. In at least two of these states, a significant fraction of construction is covered by codes: Arizona and Hawaii. Not all of the codes adopted in 2008 met the standards DOE has set in the determination process set out in the Energy Policy Act of 1992.17 Thirty-seven states and one U.S. territory (shown in yellow, light green, and dark green) meet DOE’s latest published determination. Twenty-seven of these states (shown in dark green) will meet DOE’s upcoming publication of a determination for ASHRAE Standard 90.1-2004. States and territories marked in red have retained or adopted Standard 90.1-1989, which no longer meets the standards set by DOE in the determination process. States and territories marked in grey have codes older than Standard 90.1-1989.
This map also shows the nominal equivalence of versions of ASHRAE Standard 90.1 and the MEC or IECC. Some version of ASHRAE Standard 90.1 is used as a reference standard in each version of the MEC or IECC, and that reference standard was used to develop the equivalence shown in the map key.
17 DOE is required by the Energy Policy Act of 1992 to determine whether new versions of ASHRAE Standard 90.1 (for commercial and high-rise multi-family residential buildings) save energy. This process is formally known as a DOE determination.
ASHRAE 90.1-89 equivalent or better
ASHRAE 90.1-2004/2006 IECC, equivalent or better
ASHRAE 90.1-2001/2003 IECC or equivalent
ASHRAE 90.1-1999/2001 IECC or equivalent
ASHRAE 90.1-1989/2000 IECC or equivalent
Older or less stringent than ASHRAE 90.1-1989/2000 IECC
No Statewide Code
*Adoption by county/ jurisdiction
1992
2008
American Samoa
Guam
N. Mariana Islands
Puerto Rico
U.S. Virgin Islands
Territories
American Samoa
Guam
N. Mariana Islands
Puerto Rico
U.S. Virgin Islands
Territories

Energy Efficiency Trends in Residential and Commercial Buildings 25
Commercial building labeling and certification programs are small but growing
Figure33 CumulativeENERGYSTARLabeledCommercialBuildings
In addition to mandatory codes, voluntary programs such asENERGYSTARreducecommercialbuildingenergyconsumption, although such programs do not have large market penetration. According to the EPA, commercial buildingsthathaveearnedtheENERGYSTARlabeluseon average 35 percent less energy than typical similar buildings. Currently, commercial buildings that can earn the label include offices, bank branches, financial centers, retailers, courthouses, hospitals, hotels, K–12 schools, medical offices, supermarkets, dormitories, andwarehouses.ENERGYSTARbuildingsarestatistically compared to similar buildings from a national survey conducted by the DOE’s Energy Information Administration. From 2004 to 2007, the cumulative numberofENERGYSTAR-labeledbuildingsdoubledfrom2,000 to 4,000, representing over 740 million square feet, or roughly 1 percent of the total commercial sector.
Figure34 U.S.GreenBuildingsCouncilLEED-CertifiedNewConstruction
Through 2006, 550 buildings had gone through the Leadership in Energy and Environmental Design (LEED) ratingprocess,developedbytheU.S.GreenBuildingsCouncil. In 2006, nearly 250 buildings were rated, three timesthe2004figure.LEEDdiffersfromENERGYSTARin its focus on green materials in addition to energy efficiency measures.
0
500
1,000
1,500
2,000
2,500
3,000
3,500
4,000
4,500
200720062005200420032002
Num
berofBuildings,Cum
ulative
Certified PlatinumGoldSilver
50
100
150
200
250
300
2006200520042003200220012000
Num
berofBuildings,Cum
ulative

26 U.S. Department of Energy
Figure35 GrowthinElectronicBallasts
Within commercial buildings, lighting makes up a significant portion of energy consumption; therefore, energy-efficient lighting technologies have been targeted by efficiency programs. An example of an advanced, energy-saving technology that has achieved strong market acceptance is the electronic ballast. Traditionally, fluorescent lights (the dominant lighting type in commercial buildings) used magnetic ballasts,18 which operate lamps at the same frequency as the power line. With R&D support from the Department of Energy, higher frequency electronic ballasts were developed in the late 1970s and began to enter the market in 1985. Electronic ballasts can realize as much as a 30 percent increase in lighting energy efficiency relative to magnetic ballasts,19 and also enable dimming, remote control, and other energy-saving features. While sales of electronic ballasts were initially miniscule, by 2001 they had surpassed magnetic, and by 2005 constituted nearly three-quarters of the market. Electronic ballasts have saved an estimated $15 billion in commercial buildings energy use since 2005.20
18 Ballasts help to start the flow of current through the lamp and then control it.19 National Research Council. 2001. Energy Research at DOE: Was it Worth It? Energy Efficiency and
Fossil Energy Research 1978 to 2000. National Academy Press, Washington, D.C.20 LBNL. http://eetd.lbl.gov/l2m2/lighting.html
0
10
20
30
40
50
60
70
80
20052004200320022001200019981996199419921990198819861985
UnitsShipped(%
)

Energy Efficiency Trends in Residential and Commercial Buildings 27
Impacts of Policy and Regulation
By law, the Department of Energy must set energy efficiency standards for equipment and appliances at the maximum level of energy efficiency that is technically feasible and economically
justified.DOEstrivestoestablishstandardsthatmaximizeconsumerbenefits and minimize negative impacts on manufacturers and other stakeholders.
In 2006, the Department of Energy released a schedule for setting new appliance efficiency standards, outlining how DOE will address the appliance standards rulemaking backlog and meet the statutory requirements established in the Energy Policy and Conservation Act (EPCA) as modified by the Energy Policy Act (EPAct) 2005. With the recent passage of the Energy Independence and Security Act of 2007, Congress has increased the number of rulemakings DOE must issue beyond the obligations set forth in EPAct 2005, bringing the level of appliance standards activity to unprecedented levels. The schedule for issuing new standards is shown in Figure 36.
State energy offices can also have a large impact on energy efficiency through standards, incentives, and efficiency programs. Utilities, working alone or with state energy offices, may also offer incentives for efficiency improvements. Utility-sponsored efficiency programs are often targeted at achieving peak load reductions.

28 U.S. Department of Energy
Figure36 ScheduleforIssuingNewEnergyEfficiencyStandards
ApplianceStandardsDevelopedand IssuedbyDOE(1987through2007)
• ResidentialRefrigerators(twostandards)
• ResidentialRoomAirConditioners
• ResidentialCentralAC&HP
• ResidentialWaterHeaters
• ResidentialFurnacesandBoilers
• ResidentialSmallFurnaces,<45kBtu/hr, (two standards)
• MobileHomeFurnaces
• ResidentialDishwashers
• ResidentialClothesWashers(twostandards)
• ResidentialClothesDryers
• ResidentialElectricRangesandOvens
• CommercialFluorescentLampBallasts
• CommercialWarmAirFurnaces*
• CommercialWater-CooledAC/Water- Source HP*
• CommercialWaterHeaters*
• CommercialDistributionTransformers,Medium Voltage Dry and Liquid-Immersed
StandardsThatMustBeIssuedbyDOEBetweenJanuary2008andJuly2011
• ResidentialWaterHeaters
• ResidentialDirectHeatingEquipment
• ResidentialPoolHeaters
• CommercialSmallElectricMotors(<1HP)
• IncandescentReflectorLamps
• FluorescentLamps
• CommercialFluorescentLampBallasts
• ResidentialGasandElectricRangesandOvens and Microwave Ovens
• ResidentialClothesDryers
• ResidentialRoomAirConditioners
• PackagedTerminalAirConditionersand Heat Pumps
• ResidentialCentralAirConditionersand Heat Pumps
• CommercialClothesWashers**
• CommercialBeverageVendingMachines**
• CommercialRefrigerationProducts**
• ResidentialRefrigerators†
• BatteryChargersandExternalPower Supplies †
• ResidentialClothesWashers†
ProductsforWhichEISA2007RequiresDOEtoDevelopStandards
• FurnaceFans
• IncandescentGeneralServiceLamps
• MetalHalideLampFixtures
• Dishwashers
• ResidentialRefrigerators
Congress put into place a schedule for Appliance Standards Rulemakings in 1987 (12 standards in 19 years) * DOE Adopted ASHRAE 90.1 as revised in Oct. 1999. ** Energy Policy and Conservation Act of 2005† EISA 2007List does not include products with standards prescribed by EPACT 2005 or EISA 2007, if DOE does not have to develop subsequent standards. A determination for HID lamps is scheduled for June 2010. A determination for non-class A external power supplies is scheduled for December 2009.
• ResidentialClothesWashers
• CommercialWalk-InFreezersandCoolers
• BatteryChargers
• ExternalPowerSupplies(ClassA)

Energy Efficiency Trends in Residential and Commercial Buildings 29
Figure37 CaliforniaElectricityConsumption
State energy policies promote building efficiency through appliance standards, regulations, tax incentives, education, and renewable energy portfolios. The State of California, through the California Energy Commission and later with the addition of the California Public Utilities Commission, has prioritized energy efficiency, demand side resources, renewable energy, and finally clean conventional energy sources. As a result of energy efficiency programs, appliance standards, and building codes, California electricity use remained level while U.S. consumption rose.
21 http://www.eia.doe.gov/cneaf/electricity/dsm99/dsm_sum99.html22 ACEEE http://aceee.org/pubs/u052.pdf?CFID=445973&CFTOKEN=5732015523 http://www.eia.doe.gov/cneaf/pubs_html/feat_dsm/24 http://www.nrel.gov/applying_technologies/docs/scepa_project_timeline.xls
Figure38 ElectricUtilityDemand-SideManagementPrograms
Utilities play a role in energy efficiency through incentives, energy efficiency programs, and demand-side management programs. Utilities began demand-side management programs (DSM) to reduce the need for additional power-generating capacity.21 In 1993, spending reached its peak, dropping off after as a result of industry restructuring.22 Funding of DSM programs declined beginning in the mid-1990s23 when deregulation made it difficult for utilities to capture the benefits of their DSM investments. More recently, states have enacted a broad range of measures to provide incentives for utility investments in energy efficiency under both regulated and deregulated business models. DSM programs remain effective in states with regulated utilities. Other policies24 include public benefit funds for energyefficiencyprojects,energyefficiencyresourcestandards, and non-traditional rate structures that enable utilities to reduce demand on their systems without eroding revenues.
0.0
0.5
1.0
1.5
2.0
2.5
3.0
3.5
20052004200320022001200019991998199719961995199419931992199119901989
$2005Billio
n
0
2,000
4,000
6,000
8,000
10,000
12,000
14,000
2005200219991996199319901987198419811978197519721969196619631960
United States California
PerCapitaElectricitySalesinKilowattHour
s

30 U.S. Department of Energy
Conclusion
The U.S. economy and environment are linked to the buildings we construct and the energy they use. Americans spend what amounts toalargepercentageofGDPbuilding,repairing,andpoweringthe
U.S. buildings stock. As the population and economy grow, so does our use of energy, which comes predominantly from fossil sources.
Increases in energy consumption are mitigated by:
• Mandatorycodesandstandards,whichincludeFederalequipmentstandards, state building energy codes and equipment standards, and local building energy codes.
• Voluntaryprograms,suchasENERGYSTARappliances,homes,andbuildings, as well as new “green” building programs and designations such as LEED and MASCO Environments for Living.
• PoliciesandincentivessuchasFederalandstatetaxcredits;utilityrebates and pricing structures; and government-backed research to develop energy-efficient technologies.

Energy Efficiency Trends in Residential and Commercial Buildings 31
Figure Sources
Figure 1: Growth in Housing Units Source: U.S. Census Bureau, http://www.census.gov/hhes/www/housing/hvs/hvs.html
Figure 2: Cyclicality in Housing Starts Source: U.S. Census Bureau, http://www.census.gov/const/starts_cust.xls; http://www.census.gov/const/www/newresconstindex_excel.html; and Federal Reserve, http://www.federalreserve.gov/releases/H15/data/Annual/H15_MORTG_NA.txt
Figure 3: Growth in Commercial Floorspace Source: BED, Table 2.2.1, U.S. Department of Commerce, Bureau of Economic Analysis
Figure 4: Value of Commercial Building Construction Source: U.S. Census Bureau, http://www.census.gov/const/C30/geodef.pdf
Figure 5: Value of New Building Construction Source: BED, Table 4.5.2
Figure 6: Value of Building Improvements and Repairs Source: BED, Table 4.5.3
Figure 7: Trends in Housing Starts by Region Source: U.S. Census Bureau, http://www.census.gov/const/quarterly_starts_completions_cust.xls
Figure 8: Growth in Buildings Energy Use Relative to Other Sectors Source: EIA Annual Energy Review, http://www.eia.doe.gov/emeu/aer/txt/stb0201a.xls
Figure 9: Predominance of Electricity as Buildings Energy Source Source: BED, Tables 1.1.1 and 4.1.3
Figure 10: Growth in Electricity Sales in Buildings Relative to Industry Source: EIA Annual Energy Review, Table 8.9
Figure 11: Imports of Fuels Needed for Electricity Generation Source: EIA Annual Energy Review, Table 7.1, 6.1, and 9.3
Figure 12: Contributors to Electricity CO2 Emissions Source: EIA Annual Energy Review, Table 12.7b
Figure 13: CO2 Emissions of U.S. Buildings Relative to Japan, France, and the United Kingdom Source: EIA, http://www.eia.doe.gov/oiaf/1605/ggrpt/excel/historical_co2.xls; and http://www.eia.doe.gov/pub/international/iealf/tableh1co2.xls
Figure 14: Industry Consolidation: Top 400 Builders’ Percentage of New Home Closings Source: Professional Builder: http://www.housingzone.com/giants/article/CA6320258.html Note: The data on top 10 builders’ share of new housing starts are not available prior to 2003.
Figure 15: Top 5 Builders’ Percentage of New Home Closings Source: BED, Table 5.1.1
Figure 16: Average Size of New Homes and Average Number of People per Home Source: BED, Table 2.1.6, and U.S. Census Bureau, http://www.census.gov/population/socdemo/hh-fam/hh6.xls
Figure 17: Market Saturation for Residential Equipment and Appliances Source: U.S. Census Bureau, http://www.census.gov/hhes/www/housing/ahs/nationaldata.html
Figure 18: Residential Primary Energy End-Use Splits, 2005 Source: BED, Table 1.2.3
Figure 19: Energy Use Intensity and Factors in the Residential Sector Source: http://www1.eere.energy.gov/ba/pba/intensityindicators/total_residential.html Note: The methodology and data for the energy intensity indicators were developed by a laboratory-university team comprised of the Pacific Northwest National Laboratory, Stanford University’s Energy Modeling Forum, Argonne National Laboratory, Oak Ridge National Laboratory, and Lawrence Berkeley National Laboratory under contract to the U.S. Department of Energy.
Figure 20: Residential Energy Code Stringency (Measured on a Code-to-Code Basis) Source: Pacific Northwest National Laboratory estimates for DOE’s Building Energy Codes Program
Figure 21: Residential Energy Codes in 1992 and as of August 2008 Source: http://www.energycodes.gov/implement/state_codes/index.stm, accessed August 25, 2008
Figure 22: ENERGY STAR® Homes Constructed Source: EPA, http://www.epa.gov/appdstar/pdf/2007overview.pdf
Figure 23: Market Shares of Selected ENERGY STAR Products Source: BED, Table 5.10.13
Figure 24: Commercial Building Types: Floorspace, Number, and Primary Energy Consumption Source: BED, Table 2.2.2 Note: “Service” is non-retail and non-food sales and includes gas stations, kennels, beauty parlors, car washes, dry cleaners, and tanning salons.
Figure 25: Top 15 Office Owners, 2006 (Globally) Source: National Real Estate Investor, http://nreionline.com/research/top_office_developers_2007/
Figure 26: Top 10 Retailers, Ranked by 2006 Total Revenue Source: Chain Store Age, http://www.chainstoreage.com/industrydata/top100retailers.aspx?menuid=469
Figure 27: Commercial Building Ownership and Occupancy, 2003 (Non-Mall Buildings) Source: BED, Table 2.2.3 Note: This total is for non-mall buildings, which is why the floorspace total is less than the CBECS control total of 71.658 in Table A1.
Figure 28: Number and Floorspace of Commercial Buildings Source: BED, Table 2.2.1
Figure 29: Commercial Primary Energy End-Use Splits, 2005 Source: BED, Table 1.3.3
Figure 30: Commercial Energy Use Intensity and Factors Source: PNNL, http://www1.eere.energy. gov/ba/pba/intensityindicators/total_commercial.html
Figure 31: Commercial Energy Code Stringency (measured on a code- to-code basis) Source: Pacific Northwest National Laboratory estimates for DOE’s Building Energy Codes Program
Figure 32: Commercial Energy Codes in 1992 and as of August 2008 Source: http://www.energycodes.gov/implement/state_codes/index.stm, accessed August 25, 2008
Figure 33: Cumulative ENERGY STAR Labeled Commercial Buildings Source: EPA, ENERGY STAR Achievements Reports for 2004 through 2007
Figure 34: U.S. Green Buildings Council LEED-Certified New Construction Source: C. Turner, M. Frankel. 2008. Energy Performance of LEED for New Construction Buildings. New Buildings Institute final report to U.S. GBC
Figure 35: Growth in Electronic Ballasts Source: Department of Commerce
Figure 36: Schedule for Issuing New Energy Efficiency Standards Source: ASHRAE 90.1-1999 (as adopted by DOE); Energy Policy and Conservation Act of 2005; and Energy Independence and Security Act of 2007
Figure 37: California Electricity Consumption Source: California Energy Commission Integrated Energy Policy Report, http://www.energy.ca.gov/2007publications/CEC-100-2007-008/CEC-100-2007-008-CMF-ES.PDF
Figure 38: Electric Utility Demand-Side Management Programs Source: EIA Annual Energy Review, http://www.eia.doe.gov/emeu/aer/txt/ptb0813.html

32 U.S. Department of Energy