Embed Size (px)
Citation preview

Energy Efficiency in Europe The levers to deliver the potential.

ContentExecutive summary ..........................................................................................................6
1. Set appropriate indicators and targets ......................................................................8
2. Promote product standards and labels ....................................................................9
3. Unleashtheenergyefficiencypotentialofbuildings ........................................ 9
4. Mobilise retail consumers ..........................................................................................10
5. Send the right price signals ........................................................................................11
6. Facilitatefinancingofenergyefficiencymeasures ..............................................12
Introduction..............................................................................................................14
Energy efficiency in Europe: A fuel waiting to take off..........................................................................16
1. A key element of the EU’s energy strategy ...............................................17
EnergyisattheheartoftheEuropeaneconomy ......................................................17
Ambitious targets embedded in a complex regulatory environment ..................19
2. Progress falls short of ambitions ....................................................................21
2020 goals likely to be missed .........................................................................................21
TranspositionofEEDbehindschedule .........................................................................21
SignificantvariationsamongMemberStates ..............................................................22
More challenges ahead ......................................................................................................23
3. Capturing more of energy efficiency’s potential ...................................24
Proposals to capture the untapped potential of energy efficiency ............................................................28
1. Set appropriate indicators and targets ......................................................29
1.1. Use simple targets to assess and communicate progress ......................30
Set national targets in PEC (Primary Energy Consumption) at EU level ....30
Use decomposition analysis to assess real energy savings .....................30
1.2. Monitor progress with key indicators and prioritise energyefficiencymeasure ..................................................................................31
Impacts vary widely depending on the type ofenergyefficiencymeasures ..........................................................................31
Prioritiseenergyefficiencymeasuresbypilotingtowards an overarching target: avoided CO2 emissions ...........................................34

2. Promote product standards and labels .......................................................35
2.1.Highpotentialofeco-designandenergylabelling ......................................36
2.2.Overcomingthebarrierstowideruseofenergylabels ............................37
3. Unleash the energy efficiency potential of buildings ..................................................................................................................40
3.1. BuildingsareEurope’sworstenergy-guzzlers .............................................41
3.2. Mixedsuccessfromregulatoryactiontodate .............................................42
3.3. Energystandardsforbuildings:EnergyPerformance Certificates(EPC) ...................................................................................................43
3.4. ObtaintherightassessmentofpotentialEEprojectsavings ..................46
3.5. Newapproachestofinancingenergyefficiencyinbuildings ...................47
4. Mobilise retail consumers ..................................................................................50
4.1. Measureconsumptionandquantifyrealisticsavings ................................51
4.2. Informconsumersthroughdirectorindirectfeedback ...........................54
4.3. Convinceend-userstobecomepro-active ...................................................58
5. Send the right price signals ...............................................................................60
5.1. ETS:currentreformplansmightnotbeenough ........................................61
Review the quota allocation system ................................................................61
IntegratediffuseemissionsintotheEUETS .................................................62
5.2. Introduce a carbon tax .......................................................................................62
5.3. Whitecertificatesasaspecificmarketinstrument forenergyefficiency .............................................................................................63
6. Facilitate financing of energy efficiency measures .............................66
6.1. Rampuppublicfunding .....................................................................................67
ManyEuropeanfundingschemesexist,butitwillnotbeenough ........67
NationalandlocalfundsasacomplementtoEuropeanfunds .............69
Publicfinanceasastimulustoprivatefinance ............................................70
6.2. Promoteinnovativefinancingmechanisms ..................................................71
Boosting ESCOs and EPCs .................................................................................71
GreenBondsneedabetterpolicyframework ............................................72
6.3. EaseaccesstoenergyefficiencyfundingforSMEs ....................................73
Bibliography ......................................................................................................................75
Contact list .........................................................................................................................79

GlossaryAbbreviation Description
5E EfficacitéEnergétiqueetEmpreinteEnvironnementaledesEntreprises
BAFA GermanFederalOfficeforEconomicAffairsandExportControl(BundesamtfürWirtschaftundAusfuhrkontrolle)
BAT Building Automation System
BPIE BuildingsPerformanceInstituteEurope
CBA CostBenefitAnalysis
CDC Caissedesdépôtsetconsignations
CEB CouncilofEuropeDevelopmentBank
CEN EuropeanCommitteeforStandardization
CENELEC EuropeanCommitteeforElectrotechnicalStandardization
CF Cohesion Fund
CHP Combined Heat and Power
CO2 Carbon dioxide
COP21 21stsessionoftheConferenceOftheParties
CPS Carbon Price Support
CUMAC Cumuléetactualisé(Cumulatedandupdated)
DSO DistributionSystemOperators
EACI ExecutiveAgencyforCompetitivenessandInnovation
EAFRD EuropeanAgriculturalFundforRuralDevelopment
EBRD EuropeanBankforReconstructionandDevelopment
EC European Commission
EDD EuropeanEco-DesignDirective
EDF ÉlectricitédeFrance
EE EnergyEfficiency
EEA European Environment Agency
EEC EnergyEfficiencyCertificate
EED EnergyEfficiencyDirective
EEEF EuropeanEnergyEfficiencyFund
EEFIG EnergyEfficiencyFinancialInstitutionsGroup
EEG EnergyEfficiencyGroup
EIB European Investment Bank
ELD EnergyLabellingDirective
ELENA European Local Energy Assistance
EMFF European Maritime and Fisheries Fund
EnMS Energy Management System
EPBD EnergyPerformanceofBuildingsDirective
EPC EnergyPerformanceContract
EPC EnergyPerformanceCertificate
ERA European Research Area
ERDF EuropeanRegionalDevelopmentFund
ESCO Energy Service Company

Abbreviation Description
ESF European Social Fund
ESIF European Structural & Investment Fund
ETS Emissions Trading System
ETSI European Telecommunications Standards Institute
EU European Union
EUA European Emission Allowance
FEC Final Energy Consumption
GDP GrossDomesticProduct
GHG Greenhouse Gas
GIB Green Investment Bank
GWP100 Global Warming Potential over 100 years
H2020 Horizon2020Programme
ICT InformationandCommunicationsTechnology
IEA International Energy Agency
IEEN IndustrialEnergyEfficiencyNetwork
IFC International Finance Corporation
ISO InternationalOrganizationforStandardization
JESSICA JointEuropeanSupportforSustainableInvestmentinCityAreas
JRC Joint Research Centre
KfW KreditanstaltfürWiederaufbau(GermanDevelopmentBank)
MEPS MinimumEnergyPerformanceStandard
MLEI Mobilising Local Energy Investment
MS Member States
MURE Mesuresd’UtilisationRationnelledel’Energie(Measuresforrationaluseofenergy)
NEEAP NationalEnergyEfficiencyActionPlan
nZEB NearlyZero-EnergyBuilding
OECD OrganisationforEconomicCo-operationandDevelopment
PACE Property-AssessedCleanEnergy
PDA ProjectDevelopmentAssistance
PEC Primary Energy Consumption
PF4EE PrivateFinancingforEnergyEfficiency
REN Renewable Energy
SEFF Sustainable Energy Financing Facility
SET plan Strategic Energy Technology Plan
SME SmallandMedium-sizedEnterprise
UK United Kingdom
US United States
WtW Well-to-Wheels
YAECI Yearly Appliance Energy Costs Indication
YEI Youth Employment Initiative
Abbreviation Description
5E EfficacitéEnergétiqueetEmpreinteEnvironnementaledesEntreprises
BAFA GermanFederalOfficeforEconomicAffairsandExportControl(BundesamtfürWirtschaftundAusfuhrkontrolle)
BAT Building Automation System
BPIE BuildingsPerformanceInstituteEurope
CBA CostBenefitAnalysis
CDC Caissedesdépôtsetconsignations
CEB CouncilofEuropeDevelopmentBank
CEN EuropeanCommitteeforStandardization
CENELEC EuropeanCommitteeforElectrotechnicalStandardization
CF Cohesion Fund
CHP Combined Heat and Power
CO2 Carbon dioxide
COP21 21stsessionoftheConferenceOftheParties
CPS Carbon Price Support
CUMAC Cumuléetactualisé(Cumulatedandupdated)
DSO DistributionSystemOperators
EACI ExecutiveAgencyforCompetitivenessandInnovation
EAFRD EuropeanAgriculturalFundforRuralDevelopment
EBRD EuropeanBankforReconstructionandDevelopment
EC European Commission
EDD EuropeanEco-DesignDirective
EDF ÉlectricitédeFrance
EE EnergyEfficiency
EEA European Environment Agency
EEC EnergyEfficiencyCertificate
EED EnergyEfficiencyDirective
EEEF EuropeanEnergyEfficiencyFund
EEFIG EnergyEfficiencyFinancialInstitutionsGroup
EEG EnergyEfficiencyGroup
EIB European Investment Bank
ELD EnergyLabellingDirective
ELENA European Local Energy Assistance
EMFF European Maritime and Fisheries Fund
EnMS Energy Management System
EPBD EnergyPerformanceofBuildingsDirective
EPC EnergyPerformanceContract
EPC EnergyPerformanceCertificate
ERA European Research Area
ERDF EuropeanRegionalDevelopmentFund
ESCO Energy Service Company

Energy Efficiency in Europe | The levers to deliver the potential.
06
Executive summary

Energy Efficiency in Europe | The levers to deliver the potential.
07
InDecember2015,theCOP21meetingand the Paris Agreement stressed more thaneverhowcrucialitisforthefutureofmankindtoholdtheincreaseintheglobal average temperature to well below 2°Cabovepre-industriallevels(andeventopursueeffortstolimitthetemperatureincreaseto1.5°Cabovepre-industriallevels). According to the International EnergyAgency(IEA),energyefficiencyiscentraltoanytwo-degreeenergyscenario. The IEA considers that, by 2035, investments in energy efficiency need to represent nearly half of all the global energy investments required to stay under the two degree limit1. Accordingly,energyefficiencyisoneofthekeyelementsoftheEU’senergypolicy.Thisisreflectedinexistinglegislation and in targets to be reached by 2020 and 2030.
While there is a broad consensus at the international level that there is considerable untapped economic and technical energyefficiencypotential,themeasuresimplemented with a view to an improvement inenergyefficiencyhavenotmadeitpossiblesofartostayontracktoreachthetargets set by the European Union. This is dueinparticulartovariousexistingbarriers,suchasthediffusenatureofenergysavingpotential,thepresenceofmanydifferentmarketactorswithpartiallyconflictinginterests,volatileenergypricesandtheverylongpaybackperiodofenergyefficiencyinvestments,whichmakeenergyefficiencymeasuresunattractiveforinvestors.
The present study aims to identify the main levers for public authorities, private companies and households, which could help to better unleash the untapped technical and economic potential of energy efficiency in Europe.
Despite high potential and ambitions, progress falls below expectations
Energy is a key element of the European Union’s economy. The EU consumes 11% ofglobalenergy(i.e.1,606Mtoein2014)2. 53%ofthisenergyisimportedatthecostof
more than EUR 400 billion per year5(~3%ofEUGDPin2015),makingtheEUthebiggestenergy importer worldwide5.
Numerous reports and studies have shown that the untapped economic potential behind energy efficiency remains considerable.TheIEA,forexamples,hasbeentreatingenergyefficiencyasthe’firstfuel’since20133 and reckons that two thirds of the economically profitable investments to improve energy efficiency will remain untapped in the period to 20354.Mostoftheseareinthebuilding sector.
Hence, it is not surprising that energy efficiency is one of the cornerstones of EU Energy Policy5,andcloselylinkedto its three main pillars: security (security ofsupply,importindependence,safeproduction),sustainability(reducinggreenhouse gas (GHG) emissions) and competitiveness(affordableenergyforend-users).In2015,thenewEnergyUnionStrategyconfirmedtheenergyefficiencytargetsofanimprovementinenergyefficiencyby20%by20206 and by 27% by2030.Inthiscontext,theEuropeanCommissioncalledforafundamentalrethinkofenergyefficiencyandadvocatedtreatingitasanownenergysource,representingthevalueofenergysaved.However,despitethehighambitionsandnumerousactionstaken,progresshas not matched expectations: the implementationoftheEnergyEfficiencyDirective(adoptedin2012)7 is behind scheduleandthe2020targetofa20% saving is likely to be missed at the European level (primary energy savings are projectedtoreachonly17.6%by20208). Thisfailuretomeetthetargetisparticularlystriking,sinceone third of the savings achieved so far can be attributed to the economic crisis9.
Clearly there is no silver bullet and the solutionwilllieinacomplexsetofmanydifferentmeasures.
1 CarbonBrief (2014): IEA: The marginal cost of two degrees, http://www.carbonbrief.org/iea-the-marginal-cost-of-two-degrees
2 Eurostat © European Union, 1995-2004, http://ec.europa.eu/eurostat/web/products-datasets/-/nrg_100a
3 IEA(2013),EnergyEfficiencyMarketReport2013–MarketTrendsandMedium-TermProspects, page 3, available at: https://www.iea.org/publications/freepublications/publication/EEMR2013_free.pdf
4 IEA (2012), WEO 2012, available at: https://www.iea.org/publications/freepublications/publication/English.pdf. Note on the IEA methodology: This estimate is based on the IEA New Policies Scenario outlined in the WorldEnergyOutlook2012.Investmentsareclassifiedas“economicallyviable”ifthepaybackperiodfortheup-frontinvestmentis equal to or less than the amount of time an investor might be reasonably willing to wait to recover the cost, using the value of undiscounted fuel savings as a metric. The paybackperiodsusedwereinsomecaseslonger than current averages, but they were always shorter than the technical lifetime of individual assets.
5 European Commission (2015) Energy UnionPackage[COM(2015)80final],available at: http://eur-lex.europa.eu/resource.html?uri=cellar:1bd46c90-bdd4-11e4-bbe1-01aa75ed71a1.0001.03/DOC_1&format=PDF
6 The2020targetislessthan1086Mtoeoffinalenergyconsumptionorlessthan1483Mtoeofprimaryenergyconsumption.
7 Directive 2012/27/EU of 25 October 2012onenergyefficiency,amendingDirectives 2009/125/EC and 2010/30/EUandrepealingDirectives2004/8/EC and 2006/32/EC, available at: http://eur-lex.europa.eu/legal-content/EN/TXT/?uri=celex%3A32012L0027
8 EuropeanCommission(2015),Reportfrom the Commission to the European ParliamentandtheCouncil[COM(2015)574final],availableat:http://eur-lex.europa.eu/legal-content/EN/TXT/?uri=COM:2015:574:FIN
9 EuropeanCommission(2015),Reportfrom the Commission to the European ParliamentandtheCouncil[COM(2015)574final],page3,availableat:http://eur-lex.europa.eu/legal-content/EN/TXT/PDF/?uri=CELEX:52015DC0574&rid=1

08
Energy Efficiency in Europe | The levers to deliver the potential.
Wehavegroupedthekeyfindingsofthisstudy into six main lines of action that need to be tackled to better unleash the untapped potential behind energy efficiency:1. Set appropriate indicators and targets;2. Promote product standards and labels;3.Unleashtheenergyefficiencypotentialof
buildings;4. Mobilise retail consumers;5. Send the right price signals;6.Facilitatefinancingofenergyefficiency
measures.
1. Set appropriate indicators and targets
Using the right indicators and setting the right targets is key to monitoring progress and communicating on achievements.Sofar,undertheEnergyEfficiencyDirective,MemberStates can choose whether to set their national target based on either primary energyconsumption(PEC),finalenergyconsumption(FEC),primaryorfinalenergysavings,orenergyintensity.However,thereareseveralconcernswiththesetargets:FECcoversonly66%oftheEU-28’sgrossinlandconsumption10,asitdoes not take into account energy losses fromenergyproduction,transportanddistribution. Energy intensity (measured asunitsofenergyperunitofGDP)isinfluencedbymanynon-energyrelatedfactors,suchasstandardsofliving,differentweatherconditions,thestructureoftheeconomy,etc.
At EU and national level, the main binding target for energy demand policies should be expressed in Primary Energy Consumption (PEC), since a target expressed in PEC covers both the reduction ofenergyconsumptionandthemovetoamoreefficientandlesscarbon-emittingenergy mix. Targets in PEC should be definedMemberStatebyMemberState,takingintoaccounttheireconomicgrowth,theirspecificenergymixandthestructureoftheireconomy.
Inparallel,eachMemberStatecanuseadditionalindicators,suchasFECorenergyintensity,dependingonitsspecificnationalsituation,tomonitoritsprogressandanalysethesuccessofpolicymeasuresrelatedtoenergyefficiency.
Atthesametime,itisimportanttoensurethat targets are consistent with other objectiveslinkedtoenergyandclimatepolicies,suchasthoserelatedtorenewableenergy and greenhouse gas emissions.
It is also important to prioritise those energyefficiencymeasuresthathavethemostsignificantimpactsonallaspectsofEuropean energy strategy: reducing GHG emissions,increasingsecurityofsupplyand maintaining competitiveness. Avoided GHG emissions should be promoted as an indicator in order to assess the wider impactsofenergyefficiencypoliciesonoverall energy and climate strategy and to prioritise energy efficiency measures based on their overall impacts. Avoided GHG emissions: • encompass the broader picture (energy efficiency,renewables,mitigationofclimatechange);
• canberelatedtolong-termglobaltargets(e.g. the COP 21 target);
• are already widely in use (GWP100); and • arewellknowntodecision-makersand
stakeholders.
Moreover, an adequate decomposition analysis method should be defined at EU level and used in all Member States to enable the actual progress of energy efficiency to be tracked independently of structural and activity changes (such as theimpactsofaneconomiccrisis).
10 Eurostat © European Union, 1995-2004, http://ec.europa.eu/eurostat/web/products-datasets/-/nrg_100a

09
Energy Efficiency in Europe | The levers to deliver the potential.
2. Promote product standards and labels
Energy standards and labels enable better communicationandtransparencyforcustomersandinvestors,andenhancecompetitionandinnovationforcompanies.The Ecodesign and Energy Labelling Directives11 implemented key measures to promoteenergystandardsandlabelsforenergy-usingproductsinEurope,withmuchsuccess(175Mtoeofsavingsperyearby2020,or11.6%oftheEU-28’sPECin2014).Further progress is still possible through several actions:• The list of product categories targeted
by these directives could be further extended (potential additional savings estimatedat6.2Mtoeby2020foraselectionofproductgroups(andat8.9Mtoe by 2030));12
• Labels and ecodesign requirements need to be updated regularly,takinginto account technological progress and ensuringthatthelevelofambitionisadequate;
• The legislative process should be optimised and shortened,particularlyin relation to review studies designed to update requirements in line with technological developments;
• Lastbutnotleast,stronger market surveillance is neededtoenforceecodesign and labelling regulation.
Additionally,thereisaneedtoensurethatconsumersareinformedaboutboththeabsoluteandrelativeperformanceoftheirproductsandthatthemeaningoflabelsisfullyunderstood.Hence,continuousefforts
areneededtodeveloprelevant,up-todateandeasilyunderstandableenergylabels,possibly integrating the full life cycle cost of energy-using products.
3. Unleash the energy efficiency potential of the construction sector
Buildings account for 39% of the EU’s total final energy consumption (2014), two thirds of which is in the residential sector. This is where the greatest potential forenergysavingslies:75%oftheEU’sbuildingstockisstillenergyinefficientandthe rate of building renovation remains very low at around 0.4% to 1.2% per year13, while a rate of around 3% per year would be needed14.
European legislation on building sector energyefficiencyisembeddedindifferentDirectives,mainlyintheEnergyPerformanceofBuildingsDirective(EPBD)15 andtheEnergyEfficiencyDirective(EED).According to a recent study16,48%oftheenergysavingstargetedundertheEED’s17
energy obligation schemes (Article 7) are likely to be achieved in the building sector.
However, the implementation of the Directives is lagging behind: a recent study by BPIE showed that only fivecountrieswerefullycompliantwithEuropeanrequirements:theCzechRepublic,Finland,Romania,SpainandtheUK18. In practice, most Member States had not set a consistent path for the renovation of their national building stocks, but were following a rather short-sighted
11 Directive 2009/125/EC of 21 October 2009establishingaframeworkforthesetting of ecodesign requirements for energy-related products, available at: http://eur-lex.europa.eu/legal-content/en/ALL/?uri=CELEX:32009L0125, and Directive2010/30/EUof19May2010onthe indication by labelling and standard product information of the consumption of energy and other resources by energy-related products, available at: http://eur-lex.europa.eu/legal-content/EN/ALL/?uri=CELEX%3A32010L0030
12 Deloitte (2014), Preparatory Study to establishtheEcodesignWorkingPlan2015-2017, draft report available at: http://www.ecodesign-wp3.eu/
13 European Commission (2016), An EU StrategyonHeatingandCooling(COM(2016)15final),availableat:http://eur-lex.europa.eu/legal-content/EN/TXT/PDF/?uri=CELEX:52016DC0051&rid=1
14 BPIE (2014), Investing in the European buildings infrastructure – An opportunity fortheEU’snewinvestmentpackagehttp://bpie.eu/wp-content/uploads/2015/11/Investing_in_Europe_s_buildings_infrastructure_BPIE_Discussion_Paper.pdf
15Directive2010/31/EUof19May2010ontheenergy performance of buildings, available at: http://eur-lex.europa.eu/legal-content/EN/TXT/?uri=CELEX%3A32010L0031
16Ricardo-AEA(2015),Studyevaluatingthe national policy measures and methodologies to implement Article 7 of theEnergyEfficiencyDirective,availableat:http://rekk.hu/downloads/projects/Final%20Report%20on%20Article%207%20EED.pdf, page vi
17Article7refersto’Energyefficiencyobligation schemes’ and requires, inter alia,thateachMS’shallsetupanenergyefficiencyobligationschemethatshallensure that distributors and/or retail energy sales companies should achieve a cumulative end-use energy savings target by 31 December 2020, at least equivalent to achieving new savings each year of 1.5% of theannualenergysalestofinalcustomers’.
18Itscoresthestrategiesagainstthefivecomponent sections of Article 4 on a scale of0-5where0=Missing,1=Unsatisfactory,2=Inadequate, 3=Adequate, 4=Good, 5=Excellent. A strategy is considered as being compliant with the minimum requirements of Article 4 if it achieves a rating of 70% and each of the individual sections scores at least 3.

Energy Efficiency in Europe | The levers to deliver the potential.
10
strategy. Various measures have proven successfulinencouragingtheimprovementofenergyefficiencyinbuildingsandtheseshould be promoted more widely in the EU.
Oneexample,alreadypromotedintheEPBD,areEnergyPerformanceCertificates(EPCs),anapplicationofenergylabelsforbuildings.EPCshavebeenshowntohaveapositiveeffectonenergyefficiencyimprovements and to contribute to higher sale or rental prices (up to 6%)19.However,EPCshavenotyetachievedtheirfullpotential,duetopoorimplementation,lackofenforcementandthevarietyofexistingmethods.Comparablebuildingsindifferentcountries,orevenregionswithinacountry,canobtaindifferentclassifications.Thisweakensthereliabilityofthecertificates.Public authorities should therefore strive for better homogenisation of EPCs and promote them more extensively. The calculation and verification methodology for EPCs should be harmonised throughout the EU.
Atprojectlevel,abetteranticipationofbenefitsresultingfromenergyefficiencymeasuresisnecessarytojustifytheirimplementation on solid grounds: ex ante assessmentofenergysavingsshouldbebasedonrealexpostevaluationsofsimilarprojectsandbetailoredtoeachspecificmeasure.Theanalysisshouldalsotakeintoaccountpotentialco-benefits(impactonindividualcomfort,onthemarketvalueofbuildings,etc.).Thesecanbemoresignificantthanpureenergysavings in certain cases. France’s pilot energy renovation passport is one example ofsuchspecificanalysis.Thispassportisanin-depthenergyauditofadwelling,with at least three detailed scenarios fortherenovationwork.Itincludesadetailedanalysis,acostestimation,andanassessmentofexpectedsavingsandpotential subsidies.
One key barrier to energy efficiency in the building sector is the landlord-tenant problem20. Solutions to this problem can befoundinspecificandinnovativefinancingmechanisms that enable the tenant not topayupfrontfortheinvestmentinan
energyefficiencymeasure,buttoamortisethe investment on a regular basis and in line with the energy savings generated. Examplesareon-billoron-taxfinancingschemes,suchasProperty-AssessedCleanEnergy (PACE) programmes in the US. More than47,000residentialPACEassessmentsworth almost $960 million have been implementedsofaracrossCalifornia21. Such mechanisms need to be promoted by public authorities and put in place by private companies.
4. Mobilise retail consumers
Raisingtheawarenessoftheend-users,and gathering and communicating the relevantdata,willplayanimportantroleinreachingtheEUenergyefficiencytargets.End-usersneedtobemobilisedtoadapttheir everyday habits and become more awareoftheirenergyconsumption,andofthe potential savings they could generate. Several interrelated actions are required:
Measure precisely what end-users consume and quantify what they could realistically save.Rollingoutsmartmeters,forelectricityand/orgas,canworkasanenablerforsuchmeasurementactions.In2012,mostMemberStatesperformedacost-benefitanalysistodecidewhethertheyshould introduce smart meters or not22. The averagecostofasmartmeteringsystemis estimated at between EUR 200 and EUR 250percustomer,asopposedtoaveragebenefitspermeteringpoint(includingthecost reduction permitted by average energy savingsofaround3%23andotherbenefits,
19Deloitte/a.k.a.BioIntelligenceService(2013),Energyperformancecertificatesinbuildings and their impact on transaction prices and rents in selected EU countries, https://ec.europa.eu/energy/sites/ener/files/documents/20130619-energy_performance_certificates_in_buildings.pdf
20The“landlord-tenantproblem”isatypicalcase of split incentives, i.e. a situation where economic actors participating in an exchange do not share the same objectives.Inthecaseofenergyefficiency,split incentives occur between tenants and landlords. While tenants want to minimise their energy bill, landlords want to minimise their investment costs. Since the landlord will not get any return from investment in amoreefficientenergysystem,andthetenant is not certain to cover the cost of an investment through cost savings on the energybill,theenergyefficiencypotentialoften remains unrealised.
21BerkelayLAB(2016),ResidentialPropertyAssessed Clean Energy in California, https://emp.lbl.gov/sites/all/files/lbnl-1003964.pdf
22EuropeanCommission(2014),Cost-benefitanalyses & state of play of smart metering deploymentintheEU-27,[COM(2014)356final,SWD(2014)188final],http://eur-lex.europa.eu/legal-content/EN/TXT/PDF/?uri=CELEX:52014SC0189&rid=1
23EuropeanCommission(2014),Cost-benefitanalyses & state of play of smart metering deployment in the EU-27, available at http://eur-lex.europa.eu/legal-content/EN/TXT/PDF/?uri=CELEX:52014SC0189&from=EN

Energy Efficiency in Europe | The levers to deliver the potential.
11
suchaslowermeteringcosts)ofEUR160forgasandEUR309forelectricity.Asaconsequence,16MemberStates24 started awide-scaleroll-outprogramme(80%ormore)forelectricity,whilesevencountries25 optedforaselectiveroll-outoralimitedroll-out(i.e.lessthan80%).Onlyafewcountries(Austria,France,Ireland,Italy,Netherlandsand UK)26havesofarchosentorolloutgassmart metering.
Inform consumers through direct or indirect feedback. Potential gains have to bepresentedinaclear,transparentandeasily understandable way. Achievable targetsshouldbeforecastedandprogressmonitored. Several companies are developing home automation systems (domotics)toprovideend-userswithrelevant,transparentandincentivisingfeedback.Manynewcompaniesareemergingonthismarket(Nest,foundedin2010andacquiredbyGoogleforEUR3.2billionin2014),Evohome(UnitedStates),Tado(Germany),Hive,Heatmiser,HeatGenius and Connect (United Kingdom) or Istabai(Latvia),claimthattheycanhelptheirclientscuttheirbillsbyupto15%-50%.Gamificationtechniques,suchascustomer-feedbackprogrammescomparingtheenergyperformanceofneighbours,canbeusedtomakethisfeedbackmoreattractive.
Convince end-users to become proactive. While more and more large companies are conducting energy audits and implementing EnergyManagementSystems(EnMS),specificmeasuresareneededtoencourageSMEs,andalsohouseholds.Arecentstudyfoundatendencyforcountriestopay more attention to energy audits than specificinstrumentsdedicatedtoEnMS27. AnexampleofamechanismtoincentiviseEnergy Management Systems can be foundinGermany,whereenergyintensiveindustries(>1GWh)withacertifiedEnergyManagementSystemareexemptfromthe renewable energy surcharge (EEG surcharge).
These measures provide opportunities to develop new business models (smart metering,smarthomeappliances,consumer-friendlybills,etc.),whichcanbe
taken up either by incumbent operators (powerutilities,energyproviders)orbyinnovative,oftenIT-focused,newcompanies.
5. Send the right price signals
Higher carbon prices would contribute towardsmakingenergyefficiencymeasureseconomically more attractive. A structural reformoftheEUemissionstradingsystem(EUETS)isbeingundertaken,butwillmostprobablynotbesufficienttosolveallthecurrentdifficultiesofthesystem(surplusofallowances,sensitivitytoshocks,etc.).Further action is needed to set carbon price signals at a level that really induces actors to investinenergyefficiency,i.e.:• Make sure that the long-term reform
of the ETS currently under discussion is ambitious enough and does not lead to any over-allocation of CO2 allowances;thisimplies,interalia,thatthecalculationoffutureallocationofEUallowances should take into account all the energy and climate policy measures implemented at EU and national levels (especiallythoseinfavouroflow-carbonenergiesandenergyefficiency,sincetheyhaveasignificantimpactonfutureGHGemissions);
• As long as the CO2 price set by the EU ETSisnothighenough,complement the ETS by implementing carbon taxes,similartotheUK’scarbonfloorprice,whichhasincreasedthecostofcarbonforUKpowerplantsto£23/CO2eq.,ascomparedtoEUR5/tCO2eq. through the EU ETS alone.
24Austria,Denmark,Estonia,Finland,France,Greece,Ireland,Italy,Luxembourg,Malta,Netherlands,Poland,Romania,Spain,Sweden and the United Kingdom
25Belgium,CzechRepublic,Germany,Latvia,Lithuania,Portugal,Slovakia
26http://ses.jrc.ec.europa.eu/smart-metering-deployment-european-union
27 European Commission (2016), A Study on EnergyEfficiencyinEnterprises:EnergyAuditsandEnergyManagementSystems,available at: https://ec.europa.eu/energy/sites/ener/files/documents/EED-Art8-Implementation-Study_Task12_Report_FINAL-approved.pdf

Energy Efficiency in Europe |The levers to deliver the potential.
12
Revenuesfromcarbontaxescouldbeused,forinstance,toreduceothertaxesorbechannelledintoenergy-efficientinvestments.• Integrate diffuse emissions into these
price-setting mechanisms as much as possible(55%ofoverallGHGemissionsare not covered by the EU ETS); this can be done either by integrating more sectorsintotheETS(buildings,roadtransport,etc.)asiscurrentlybeingdoneinCalifornia’sETS,orbyimplementingambitiouscarbontaxestargetingdiffuseemissions.
While the EU ETS and carbon taxes aim to reduceGHGemissions,othermarket-basedmechanisms,suchaswhite certificates,targetenergysavingsdirectly.However,these schemes still have a long way to go beforereachingfullefficiencyandcredibility.Quantification standards need to be implemented to avoid unrealistic energy saving calculations and a harmonisation of existing schemes is necessary to create a larger and more efficient market.
6. Facilitate financing of energy efficiency measures
FacilitatingaccesstoenergyefficiencyfinancingneedstobecomeakeypriorityattheEUandMemberStatelevel,andasetofkeyactionsneedstobetakentogetontracktomeettheEU’slong-termtargets.Since various barriers are limiting the attractiveness to traditional private investors of financing energy efficiency measures(suchaslongpaybackperiods,
uncertainenergyprices,lackofrelevantandunderstandableinformationforinvestors,etc.),anefficientfinancingframeworkneedsto be developed to ensure an optimal interplay between public and private actors.
The European Commission estimates that EUR 100 billion need to be invested annually to achieve Europe’s 2020 energy efficiency targets28.Yet,thetotalannualinvestment by public banks is currently estimatedatonlyEUR15-20billion29. Rampingupfundsandfacilitatingtheaccesstoenergyefficiencyfinancingneedsto become a key priority at the EU and at Member State level.
Publicfundsalonecannotfinanceallthenecessaryenergyefficiencymeasures.Thepublicsectorneedstoactasacatalyst,boostingprivatefinancingtoclosetheinvestment gap. • Tailor-made solutions provided by
closer public-private collaboration need to be developed to drive broader investmentsinenergyefficiency;
• SMEs deserve particular attention. SMEsrepresent99%ofallcompaniesintheEU,butonly64%ofallSMEsaretakingactiontosaveenergy,comparedto82%oflargecompanies30.Therefore,specificsupportneedstobeofferedtoSMEs,amongothers,throughintelligentprojectpoolingstructuresandbundlingmechanisms.
Innovative financing mechanisms need to be put in place and promoted in order to overcome existing market failures and to unlock the significant energy efficiency potential, in particular in the building sector. Such innovative mechanismsincludeenergyperformancecontractingschemes(EPCs)offeredbyEnergyServiceCompanies(ESCO),greenbonds,etc.Thelatterconstitutepromisinginvestmentproductsforcompanies:greenbondissuanceincreased16-foldbetween2012and2015fromUSD2.6billiontoUSD41.8 billion worldwide.
28 European Commission, Financing energy efficiency,availableat:https://ec.europa.eu/energy/en/topics/energy-efficiency/financing-energy-efficiency
29DIW(2013),FinancingofEnergyEfficiency:InfluencesonEuropeanPublicBanks’Actions and Ways Forward, page 1, available at: http://www.diw.de/documents/publikationen/73/diw_01.c.422405.de/hudson_financing.pdf
30 European Commission, Eurobarometer survey:SMEsareimportantforasmoothtransition to a greener economy, http://europa.eu/rapid/press-release_MEMO-12-218_en.htm

Energy Efficiency in Europe | The levers to deliver the potential.
13

14
Energy Efficiency in Europe | The levers to deliver the potential.
Introduction

15
Energy Efficiency in Europe | The levers to deliver the potential.
The COP21 meeting and the Paris Agreement, agreed upon in December 2015, highlighted more than ever how crucial it is for the future of mankind to hold the increase in the global average temperature to well below 2°C above pre-industrial levels (and even to pursue efforts to limit the temperature increase to 1.5°C above pre-industrial levels). According to the International Energy Agency (IEA), energy efficiency is central to any energy scenario that matches this two degree limit. In fact, by 2035, investments in energy efficiency need to represent nearly half of all global energy investment in order to stay within this figure31. Accordingly, energy efficiency is a key element of EU’s energy policy.
Many studies have stressed that the economic and technical potential behind energy efficiency is considerable, demonstrating that many readily available measures could yield significant savings, both in terms of energy consumption and in terms of costs.
Despite this emphasis on energy efficiency, both from international experts and policy-makers, there is a consensus that the measures targeting an increase in energy efficiency implemented so far have not enabled the EU to reach its targets. Different reasons for having fallen short of expectations have been put forward: energy savings potential is diffuse, with many different players involved; investment
in energy efficiency is not particularly attractive from a purely financial perspective, because of long payback periods and uncertain returns on investments; the economic crisis and the dwindling energy prices are not favourable contexts for energy savings, etc.
This study aims to identify the main levers for public authorities, private companies and households, which could better unleash energy efficiency’s technical and economic potential. Obviously, there is no silver bullet and the solution lies in a complex set of many different measures.
After an introductory section designed to present the context and key elements of European Union energy and energy efficiency policies, we group our key findings into six groups of proposals:1. Set appropriate indicators
and targets;2. Promote product standards
and labelling;3. Unleash the energy efficiency
potential of buildings;4. Mobilise retail consumers;5. Send the right price signals; 6. Facilitate financing of energy
efficiency measures.
This study is based on Deloitte’s in-house expertise, bibliographical analyses and consultation of several key European companies and industry associations. The views are Deloitte’s own.
31 CarbonBrief (2014): IEA: The marginal cost of two degrees, http://www.carbonbrief.org/iea-the-marginal-cost-of-two-degrees

Energy Efficiency in Europe | The levers to deliver the potential.
16
EnergyefficiencyinEurope:Afuelwaiting
totakeoff

Energy Efficiency in Europe | The levers to deliver the potential.
17
The EU meets 53% of its total primary energy needs from imports. This costs more than EUR 400 billion per
year (2013)37,oraround3%ofEUGDP.Thismakes the EU the world’s biggest energy importer.
Energy is at the heart of the European economy The EU consumes 11% of global energy32 and is the third largest energy consumer afterChina(23%ofglobalenergy consumption) and the United States (17%)33.Fossilfuelsrepresent72%ofEU’senergyconsumption,nuclear14%and
renewables 13%. Transportisthelargestsourceoffinalenergydemand(32%),followedbythe residential sector (28%) and by industry(26%).94%oftransportenergyconsumptionisbasedonoilproducts,ofwhich 90% are imported.
Figure 2: EU-28 Final Energy Consumption, by sector in 2014 (Mtoe, %)36
Figure 1: EU-28 Gross Inland Consumption34
by energy source in 201435 (Mtoe, %)
32 Eurostat © European Union, 1995-2004, http://ec.europa.eu/eurostat/web/products-datasets/-/nrg_100a
33 Enerdata, Total energy consumption, https://yearbook.enerdata.net/energy-consumption-data.html
34 Gross inland energy consumption is equal to primary energy consumption plus the consumption of fossil fuels for non-energy purposes.
35 Calculations based on Eurostat data, Eurostat © European Union, 1995-2004, http://ec.europa.eu/eurostat/web/products-datasets/-/nrg_100a
36 Eurostat © European Union, 1995-2004, http://ec.europa.eu/eurostat/web/products-datasets/-/nrg_100a
37 European Commission (2015), Energy Union Package[COM(2015)80final],availableat:http://eur-lex.europa.eu/legal-content/EN/TXT/?uri=COM%3A2015%3A80%3AFIN
Solid Fuels
Nuclear
Oil
RES
Gaz
Other
Industry
Residential
Transport
Services
26917%
15314% 377
26%
34932%
29628%
14 - 1%
55334%
34421%
22614%
20113%
1.Akeyelementof the EU’s energy strategy

Energy Efficiency in Europe | The levers to deliver the potential.
18
On average, EU household and industrial consumers currently pay more for their electricity than consumers in most major world economies. The exceptions are Japan (due to reactor shutdowns in theaftermathofthenuclearaccidentsinFukushima),andAustralianhouseholds.
IneveryEUMemberState,theelectricityprice to industrial consumers is higher than intheUS,IndiaorCanada.Thisrelativepricedifferenceascomparedtoothereconomies can have a strong impact on the competitivenessofEuropeancompanies,inparticularforenergy-intensiveindustries.
Acknowledging that energy is at the heart oftheEuropeaneconomy, the EU has been defining ambitious energy strategies and targets for years. These strategies aim at achieving energy sustainability (inter aliareducinggreenhousegasemissions),
competitivenessandaffordability,andsecurityofsupply.Energy efficiency is a major component of these strategies and has a key role in reducing greenhouse gas emissions, increasing the EU’s competitiveness and security of supply.
38 Calculations based on Eurostat data, Eurostat © European Union, 1995-2004, http://ec.europa.eu/eurostat/web/products-datasets/-/nrg_100a
39 European Commission (2014), Presentation « EnergyUnionandClimateChangePolicy »,https://ec.europa.eu/priorities/sites/beta-political/files/energy-union-1-year_en.pdf
Figure 3: Net imports of solid fuels, petroleum products and gas in EU-28 (Mtoe).38
600
500
400
300
200
100
0
Figure 4: Current prices for electricity in EU-28 and other major economies for household and industrial consumers (EUR/MWh)39 , reference year 2012.
112 123
Solid fuels Total petroleum products
Gas
558520
278231
2010 2014
300
250
200
150
100
50
0
300
250
200
150
100
50
0
highest
highestEU 28
EU 28average
average
lowestlowest
Current prices for electricity - Household Consumers
Austra
liaJapan
Japan
Norway
Norway
Turk
ey
Turk
eyChin
aUSBra
zil
CanadaIn
dia
China
Indonesia
India
Russia
Indonesia US
Canada
Current prices for electricity - Industrial Consumers

Energy Efficiency in Europe | The levers to deliver the potential.
19
Ambitious targets embedded in a complex regulatory environment Irrespectiveofotherconsiderations,such as carbon emission reduction requirementsorimportdependence,thereisaclearcaseonefficiencygroundsalonefortheEUtouselessenergy.Aspartofaninitialsetoftargets,the EU set in 2007 an energy efficiency target of 20% by 202040. Fouryearslater,theEuropeanCouncilacknowledgedthattheEUwasofftracktoreachthistargetandasaresult,theEnergyEfficiencyDirective(EED)wasadoptedin2012tohelpclosethegap,amendingandrepealingolderDirectives41.
TheEEDisgroundedinthreemajorcross-sectoral targets:• The Union’s 2020 20% headline target. ThemainobjectiveoftheDirectiveis“toensuretheachievementoftheUnion’s 2020 20% headline target on energyefficiencyandtopavethewayforfurtherenergyefficiencyimprovementsbeyond that date”42. It provides a legal basisforthetargetfor2020oflimitingprimary energy consumption (PEC) to not morethan1,483Mtoeor1,086Mtoeoffinalenergyconsumption(FEC)43. This equates to a 20% saving compared to projections made in 2007, prior to the financial crisis.
• Indicative national efficiency targets. TheDirectiverequiresMemberStatesto set their own individual indicative nationalenergyefficiencytargets44. ThesearesubjecttoanevaluationbytheCommission,assessingwhethertheywillbesufficienttoreachtheoverallEUtarget45.
• Binding national targets for end-use savings.TheDirective46 requires Member Statestohaveanenergyefficiencyobligation scheme; this scheme should allow them to reach a general binding targetfrom1January2014to31December2020.Thisisnewsavingseachyearof1.5%ofannualenergysalestofinalcustomers47.
In addition to the EED, several Directives and other regulatory texts or financial instruments were put in place to contribute to reaching the overall
energy efficiency targets.Someoftheregulatorytexts,suchastheEED48 and theEnergyPerformanceofBuildingsDirective(EPBD)49,willundergoareviewinthesecondhalfof2016.Thecomplexregulatory environment is illustrated in the Figure 5 next page.
In 2014, the EU agreed on a new energy efficiency target of 27%, or greater, by 2030 (i.e. 27% energy savings compared withthebusiness-as-usualscenario50)51. The intention is to integrate the 2030 target intheEEDaspartofthereviewforeseenforthesecondhalfof2016.
On 25 February 2015 the EC adopted a “FrameworkStrategyforaResilientEnergyUnionwithaForward-LookingClimateChange Policy” (also known as the Energy Union Package or the Energy Union FrameworkStrategy),withanoverarchinggoalofpavingthewayforthetransitiontoalow-carbon,secureandcompetitiveeconomy. That transition is to be grounded in the three main pillars of EU energy policy: security (securityofsupply,importindependence,safeproduction),sustainability (reducing greenhouse gas (GHG) emissions) and competitiveness (keepingenergypricesreasonableforend-users).Withinthisframeworkstrategy,theCommissiondefinedfivedimensions52,ofwhichoneis“Energyefficiencycontributingtomoderationofdemand”53.
Inthiscontext,theECcalledforafundamentalrethinkofenergyefficiencyand advocated treating it as an own energy source,representingthevalueofenergysaved.ThisapproachisnewintheEuropeanenergystrategy,butinlinewiththevisionoftheInternationalEnergyAgency(IEA)which-untilafewyears’ago-describedenergyefficiencyasa“hiddenfuel”,butchangedthenotionto“firstfuel”initsEnergyEfficiencyMarketReport201354.
In the aftermath of COP21, the EC did not change its strategy,statingthatmeasures already taken or initiated were consideredtobesufficienttodeliveronthecommitments55.
40 Council of the European Union 7224/1/07, REV1.,availableat:http://register.consilium.europa.eu/doc/srv?l=EN&f=ST%207224%202007%20REV%201
41 Directive 2012/27/EU of the European Parliament and of the Council of 25 October 2012onenergyefficiency,amendingDirectives 2009/125/EC and 2010/30/EUandrepealingDirectives2004/8/EC and 2006/32/EC, available at: http://eur-lex.europa.eu/LexUriServ/LexUriServ.do?uri=OJ:L:2012:315:0001:0056:EN:PDF
42 European Commission (2012), EED (2012/27/EU), Article 1.1
43 European Commission (2012), EED (2012/27/EU), Article 3.1(a)
44 European Commission (2012), EED (2012/27/EU), Article 3.1
45 European Commission (2012), EED (2012/27/EU), Article 24.7
46 European Commission (2012), EED (2012/27/EU), Article 7.1
47 Averaged over the most recent three-year period prior to 1 January 2013. For this calculation, the sales of energy used in transport may be partially or fully excluded.
48 The review will focus on Articles 1, 3, 6, 7, 9-11, 20 and 24, in view of the introduction ofanewenergyefficiencytargetfor2030: https://ec.europa.eu/energy/en/consultations/consultation-review-directive-201227eu-energy-efficiency
49 Directive 2010/31/EU of the European Parliament and of the Council of 19 May2010ontheenergyperformanceof buildings, available at: http://eur-lex.europa.eu/legal-content/EN/TXT/PDF/?uri=CELEX:32010L0031&rid=1
50 This target will be reviewed by 2020, having in mind a target of 30% instead.
51 The European Commission had initially proposed30%initsEnergyEfficiencyCommunication; available at: http://eur-lex.europa.eu/legal-content/EN/TXT/?uri=COM:2014:0520:FIN.
52 The four others are: energy security, solidarity and trust; a fully integrated Europeanenergymarket;decarbonisingthe economy; research, innovation and competitiveness.
53 European Commission (2015), Energy Union Package[COM(2015)80final],availableat:http://eur-lex.europa.eu/legal-content/EN/TXT/?uri=COM%3A2015%3A80%3AFIN
54IEA(2013),EnergyEfficiencyMarketReport2013–MarketTrendsandMedium-TermProspects, page 3, available at: https://www.iea.org/publications/freepublications/publication/EEMR2013_free.pdf
55SpeechbyMiguelAriasCañeteonEU’sclimate and energy policies after COP21 - http://europa.eu/rapid/press-release_SPEECH-16-264_en.htm

Energy Efficiency in Europe | The levers to deliver the potential.
20
TheenergyEfficiencyDirective(EED)(20/12/27/EU)
EcodesignofEnergy-relatedProductsDirective(2009/125/EU)
The Tyre Labelling Regulation (1222/2009)
Horizon2020 PrivateFinancingforEnergyEfficiencyinstrument(PF4EE)
EuropeanEnergyEfficiencyFund(EEEF)
ProjectdevelopmentAssistance(PDA)
European Structural & Investment Funds (ESIF)
EnergyEfficiencyFinancialinstitutions Group (EEFIG)
TheEnergyLabellingDirective(2020/30/EU) Construction Products Regulation
(305/2011)
The Energy Star Regulation (106/2008) DirectiveonthePromotion
ofCleanandEnergyEfficientRoadTransportVehicles(2009/33/EC)
TheEnergyPerformanceofBuildingsDirective(2010/31/EU)
Emissions Trading System (2003/87/EC)
The Combined Heat and Power Directive(2004/08/EC)
EffortSharingDecision(406/2009/EC)
Strategic Energy Technology Plan (SET Plan)
IndustrialEmissionsDirective(2010/75/EU)
2030frameworkforclimateand energy policies
ActionPlanforEnergyEfficiency(2007-12)
Roadmapformovingtoalow-carbon economy in 2050
Rules and obligations to help the EU reach its 2020 energy
efficiencytarget
Minimumenergyefficiencystandardsforavariety
ofproducts
Definestyrelabelstandardsto amongst others help
consumers choose a product thatmorefuelefficient
Providessupportforenergy-relatedresearch,including
energy-efficiency,lowcarbontechnologies and Smart Cities
& Communities
ProvidessupporttoprojectsfortheimplementationofnationalEnergyEfficiencyActionPlans
or other national energy efficiencyprograms
Offersfundingforenergyefficiencyandsmallscalerenewableenergyprojects
Bridge the gap between sustainable energy plans and realinvestmentbymobilizing
investment in sustainable energy projects
EUR27billionisring-fencedtosupporttheshifttowardalow-carboneconomy
Provides support to overcome challenges to obtaining long-termfinancingfor
energyefficiency.
Minimum energy labelling standardsforavariety
ofproductsSetsenergyefficiency
requirements in construction works
Voluntary energy labelling schemeforofficeequipment Stimulatesdemandforlower
carbon technologies alternative fuelsandcleanandenergy-efficient
vehicles
Mandatoryenergyefficiencycertificatesaccompanyingthesaleandrentalofbuildings.Allenewbuildingstobenearlyzero-energy
bytheendof2020
Provides an incentive to the industries covered to increase energyefficiencybysettinga price on GHG emissions
Requirements on setting comprehensive assessment
on the national potential ofcongenerationandditrict
heating and cooling
Supportsenergyefficiencymeasuresthroughtheadoptionof
mandatory targets forGHGreductioninthenon-ETSsector.
Supports technologies with the greatest impact on the EU’s transformationtoalow-carbon
energy system.
Enables Member States to setlimitvaluesforGHS
emissionsfrominstallationsthatareexcludesfrom
the ETS
Setsatargetofatleast27%forrenewableenergyand
energy savings by 2030
Aims to achieve a 20% reduction in energy
consumption by 2020
Establishes energy efficiencyascentral
to EU energy policies
Overarching policies
Financial Instruments
ProductsProcesses Emissions
The way forward
Figure 5: Legal and Financial Energy Efficiency Framework in the EU

Energy Efficiency in Europe | The levers to deliver the potential.
21
2020 goals likely to be missedIn2014,calculationspublishedbytheEuropeanCommissionshowedthat,based on the indicative energy efficiency targets fixed in Member States’ National Energy Efficiency Action Plans (NEEAP)56, the sum of those targets would lead to only 17.6% primary energy savings in 2020 when compared to projections57, below the target of 20%.Sofar,theEEDhasthereforenotfullydeliveredwhatitwascreatedfor.
On18November2015,theECpublishedthefirstStateoftheEnergyUnion58,anassessmentoftheprogressmadesincetheinceptionoftheEnergyUnionFrameworkStrategy in February 2015. A key conclusion was that “Member States should accelerate theireffortsinordertoachievetheirnationalenergyefficiencytargetsfor2020or to go beyond them.”59 This assessment analysedtheprogressintheEUfromseveral perspectives60 and the diagnosis is particularly clear when it comes to energy efficiency:• the2020targetislikelytobemissedif
ambitions remain at the current level;
• Member States need to take additional measuresandfullyimplementEUlegislation;
• the greatest potential lies in the building sector;61
• financingenergyefficiencymeasuresremains an important barrier;
• informationfailuresneedtobeovercome.
Transposition of EED behind scheduleEU Member States were required to transpose the EED’s provisions into their national laws by 5 June 201462, but nearly all of them failed to do so on time.Inthesecondhalfof2014,theEClaunchedinfringementprocedures63 against 27 EU Member States (all except Malta)fornon-transpositionoftheDirective.Until2015,theCommissionhadissued 22 reasoned opinions to Member States where transposition was still not completelyachievedandhadreferredtwo Member States to Court (Hungary in March 201564 and Greece in June 2015).InOctober2015,theECrequestedelevenMemberStates(Belgium,Bulgaria,Cyprus,theCzechRepublic,Spain,Finland,
56UndertheEnergyEfficiencyDirective(EED),each EU country must draw up a National EnergyEfficiencyActionPlan(NEEAP)everythree years. This plan sets out estimated energy consumption, planned energy efficiencymeasuresandtheimprovementseach country expects to achieve. In addition, EU countries must report the progress achieved towards their national energy efficiencytargetsonanannualbasis.
57EuropeanCommission(2015),Reportfrom the Commission to the European ParliamentandtheCouncil[COM(2015)574final],page3,availableat:http://eur-lex.europa.eu/legal-content/EN/TXT/PDF/?uri=CELEX:52015DC0574&rid=1
58 European Commission (2015), State of Energy Union, http://eur-lex.europa.eu/legal-content/EN/TXT/PDF/?uri=CELEX:52015DC0572&from=EN
59EuropeanCommission(2015),Reportfrom the Commission to the European ParliamentandtheCouncil[COM(2015)574final],page13,availableat:http://eur-lex.europa.eu/legal-content/EN/TXT/PDF/?uri=CELEX:52015DC0574&rid=1
60 Decarbonisation of the economy; energy efficiency;afully-integratedinternalenergymarket;energysecurity,solidarityandtrust;research, innovation and competitiveness.
61 At that time, a dedicated EU-wide strategy for heating and cooling was missing; since then, in February 2016, the Commission proposed an EU heating and cooling strategy, available at: http://eur-lex.europa.eu/legal-content/en/TXT/?uri=CELEX%3A52016DC0051
62 European Commission (2012), EED (2012/27/EU),Article28(1)
63Infringementprocedurestakeseveralstepsto encourage countries to comply with a legislation before ultimately leading to the EuropeanCourtofJusticeandpossiblefines:a letter of formal notice, a reasoned opinion, andfinallythereferraltotheEuropeanCourtof Justice.
2. Progressfallsshortofambitions

Energy Efficiency in Europe | The levers to deliver the potential.
22
Hungary,Lithuania,Luxembourg,PolandandPortugal)toensurefulltranspositionoftheEED.
Significant variations among Member States Progress towards the EE targets varies stronglyfromoneMemberStatetoanother. A number of countries, including some of the largest economies in the EU, need to reduce their primary energy consumption at a higher rate in 2014-2020 than in the period 2005-2013 in order to reach their national indicative targets and to contribute to the achievement of the overall objective for 2020: Belgium,Estonia,France,Germany,
theNetherlands,PolandandSweden.65 The other Member States reduced their primary energy consumption between 2005 and 2013 at a higher rate than neededtomeettheir2020targets.But,as we have shown in a recent report66,this achievement is partly due to the economic crisis. This has reduced the demand and consumption levels against which the targets are measured: it has made achievements look better than they otherwise would in countries such as ItalyandSpain.Overall,theCommissionestimated that the economic crisis and its significant impact on growth have accounted for one third of the progress towards the 2020 target67.
Figure 6: Primary energy consumption (2013-2014) and 2020 national targets, relative to 2005 levels (EEA)68
30%
20%
10%
0%
-10%
-20%
_30%
-40%
EU
Mal
ta
Uni
ted
King
dom
Gre
ece
Luth
ania
Fran
ce
Belg
ium
Ital
y
Ger
man
y
Net
herl
ands
Cypr
us
Spai
n
Swed
en
Bulg
aria
Port
ugal
Slov
akia
Den
mar
k
Luxe
mbo
urg
Czec
h Re
publ
ic
Irel
and
Hun
gary
Aust
ria
Slov
enia
Finl
and
Pola
nd
Rom
ania
Latv
ia
Esto
nia
Croa
tia
Change in primary energy consumption, 2005-2013
Change in primary energy consumption, 2005-2014
Change in primary energy consumption, 2005-2020 target

Energy Efficiency in Europe | The levers to deliver the potential.
23
France,forinstance,stillneedstocut its primary energy consumption significantlytomeetits2020target.Thegreatestpotentialliesinbuildings,whichrepresentmorethan40%offinalenergyconsumptionandwhosefinalenergyconsumption has been relatively stable sincethemid-2000s,atalittlelessthan70Mtoe.However,renovationofexistingbuildings,whichisoneofthemainmeasuresneeded,hasbeenmuchslowerthanexpected.ItisdifficulttoseehowFrancecanmeetitscommitment,otherthan by taking additional policy measures forbuildingsordrivingnewmomentumin the CHP (combined heat and power) industry,whichwillstilltaketimetoreachitsfullpotential69.
The trend in Germany’s primary energy consumption has been downwards over thelast20years.Toreachits2020(-20%)and2050(-50%)primaryandfinalenergyconsumption targets70,however,Germanymustfurtherimproveitsefficiencymeasures.Thefourthenergytransitionmonitoringreportfoundthatwhilereductionofelectricityconsumptionandheating-relatedfinalenergyconsumptionwereontrack,allotherenergyefficiencyindicators (such as primary energy consumption,finalenergyproductivity,finalenergyconsumptioninthetransportsector)weredeviatingfromtheoptimalpath71.Futuresuccesswillthereforestronglyhingeontheeffectivenessofitsenergyefficiencypolicies,especiallyinthebuildingssector,whichaccountsforaround35%offinalenergyconsumption.
More challenges ahead Political targets regarding climate change mitigation are getting more ambitious in the years ahead: by 2050, the EU needs to cut GHG emissions by 80-95% below 1990 levels (and by 40% by 2030)72. In parallel,atgloballevel,theParisAgreementnegotiatedattheCOP21setalong-termgoalofkeepingtheincreaseinglobalaverage temperature to well below 2°C abovepre-industriallevels(withtheaimoflimiting the increase to 1.5°C).
EnergyefficiencyisconsideredtobeoneofthekeymeansofreachingtheGHGtargetalong with renewable energies and the decarbonisationeffortsofnon-renewables.Therefore,theambitionbehindtheclimatepolicies is likely to be translated into highlyambitiousenergyefficiencytargetsby 2050. This implies that the pressure for further improvements for energy efficiency is likely to increase after 2020. Currently,the2030targetissetat27%,butmightbeincreasedto30%afterareviewin202073.
One key challenge for the years to come will be to find a way to incentivise more energy efficiency investments at times of low energy prices and feeble economic growth without having a negative impact on households or on EU competitiveness on the global market.
64InMarch2015theEuropeanCommissionreferred Hungary to the European Court of Justice.ItwantedBudapestfinedEUR15,444daily for not transposing the Directive by the June 2014 deadline. However, the reasoned opinion to Hungary, issued on 22/10/2015 replaced the Commission decision to refer Hungary to the Court of Justice, giving it two months to transpose the Directive into national law.
65 IEuropean Commission (2015), Assessment oftheprogressmadebyMemberStatestowardsthenationalenergyefficiencytargets for 2020 and towards the implementationoftheEnergyEfficiencyDirective 2012/27/EU as required byArticle24(3)ofEnergyEfficiencyDirective 2012/27/EU, available at: http://eur-lex.europa.eu/legal-content/EN/TXT/?uri=CELEX%3A52015DC0574
66IDeloitte(2015),EnergyMarketReforminEurope, available at: http://www2.deloitte.com/ru/en/pages/energy-and-resources/articles/energy-market-reform-europe.html
67IEuropeanCommission(2014),COM(2014)520final,page4,availableat:http://eur-lex.europa.eu/legal-content/EN/TXT/PDF/?uri=CELEX:52015DC0574&rid=1
68IEEA(2015),TrendsandprojectionsinEurope2015-TrackingprogresstowardsEurope’sclimate and energy targets, EEA report, No 4/2015.
69Deloitte(2015),EnergyMarketReforminEurope, available at: http://www2.deloitte.com/ru/en/pages/energy-and-resources/articles/energy-market-reform-europe.html
70Ascomparedto2008.
71MinistryforEconomicAffairsandEnergy:VierterMonitoring-BerichtzurEnergiewende(2015),http://www.bmwi.de/BMWi/Redaktion/PDF/V/vierter-monitoring-bericht-energie-der-zukunft,property=pdf,bereich=bmwi2012,sprache=de,rwb=true.pdf
72 European Commission, 2030 Climate and energyframework,availableat:http://ec.europa.eu/clima/policies/strategies/2030/index_en.htmandCouncilofMinistersdecision at: http://www.consilium.europa.eu/uedocs/cms_data/docs/pressdata/en/ec/145397.pdf
73 European Commission, 2030 Climate and energyframework,availableat:http://ec.europa.eu/clima/policies/strategies/2030/index_en.htm

Energy Efficiency in Europe | The levers to deliver the potential.
24
Anumberofassessmentshighlightthedisappointing progress towards Europe’s energyefficiencygoals,butmany studies and reports estimate at the same time that there is substantial potential for economically profitable investments
in energy efficiency measures. The International Energy Agency (IEA) estimated thattwo-thirdsoftheeconomicallyprofitableinvestmentstoimproveenergyefficiencywillremainuntappedintheperiod to 203574.
74 IEA (2012), WEO 2012, available at: https://www.iea.org/publications/freepublications/publication/English.pdf. Note on the IEA methodology: This estimate is based on the IEA New Policies Scenario outlined in the WorldEnergyOutlook2012.Investmentsareclassifiedas“economicallyviable”ifthepaybackperiodfortheup-frontinvestmentis equal to or less than the amount of time an investor might be reasonably willing to wait to recover the cost, using the value of undiscounted fuel savings as a metric. The paybackperiodsusedwereinsomecaseslonger than current averages, but they were always shorter than the technical lifetime of individual assets.
75IEA(2012),WorldEnergyOutlook2012,https://www.iea.org/publications/freepublications/publication/English.pdf
3. Capturing more ofenergyefficiency’spotential
Figure 7: Long-term energy efficiency economic potential by sector75
Realised energy efficiency potential Unrealised energy efficiency potential
120%
100%
80%
60%
40%
20%
0%Industry Transport Power
generationBuildings

Energy Efficiency in Europe | The levers to deliver the potential.
25
Thepotentialforenergysavingsissignificantinallsectors,butit has been widely acknowledged that the lion’s share of the untapped economic potential is embedded in buildings. According to a recent study76, 48% of the energy savings targeted under Article 7 of the EED77 will be achieved in the building sector.
Numerous recent studies have demonstratedthatenergyefficiencymeasurescanbeveryprofitableatdifferentprojectandimplementationlevelsandleadtohighbenefit/costratios78:
• Asanexample,ithasbeenshownthatinvestments in building automation systems(BAS),i.e.controllingabuilding’sheating,ventilation,airconditioning,lighting,etc.,canproduceninetimesthevalue in savings relative to the investment required79.Whenusedproperly,BASoptimisethefunctioningofbuildingsthrougheffectivecontrolandleadtosignificantreductionsinenergywaste.
•Anotherrecentstudyfoundthataprogramme to make British buildings moreenergyefficientwouldgenerate£8.7billionofnetbenefits.80
The EU is unlikely to attain the 2020 energyefficiencytargets,eventhoughthe economic crisis helped lower energy consumption in Europe. The current low priceofrawmaterials,includingenergysources,isreducingthepressuretosaveenergy.Thus,iftheEUwantstomeetits2030-2050targets,itneedstotakestructuralandlong-termaction.Conceptualtheoreticalframeworksdescribing barriers that lock in the economic potential behind energy efficiencyhavebeendevelopedthroughoutnumerous studies81 82 83 84.However,itbecomes more challenging to evaluate theirrelativeimportancefromthepointofviewofthedifferentsectorsandmarketactors. The main barriers that need to be overcome to unleash the potential for energy efficiency are:
• Financing:Evenifmanyenergyefficiencymeasures are economically viable over thelongterm,theyoftencomewithlongpayback periods and high uncertainty rates(becauseofenergypriceinstability,in particular). This issue is linked to differenttypesofbarriers,suchas:
-Price signals that are not adequate forpromotingenergyefficiency;
- Difficulties in getting access to available capital;
• Imperfect information on energy efficiency,interaliatohelppotentialinvestorsorend-userstoinvestinthemostrelevantenergyefficiencymeasures;
• Specificincentiveproblemsinthebuildingsector,wherethelargestuntappedpotentiallies,suchasthe “landlord-tenant” problem (while tenantswanttominimisetheirenergybill,their landlords’ interest lies in minimising theupfrontinvestmentcosts);
•Suboptimalend-userbehaviour,partly due to a lack of awareness and knowledgeontheimpactsoftheirenergy consumption and on ways in which they could reduce it;
• Inappropriate indicators and targets at European and national level that hinder effortstoselectthemostcost-effectivemeasures.
It is not the purpose of this study to provide an in-depth analysis of all the potential barriers for the different market participants and sectors, but to highlight six main lines of actions which can impact consumers’ behaviours and capture the potential behind energy efficiency. These are summarised below and will be developed in more detail in the subsequent sections.
76Ricardo-AEA(2015),Studyevaluatingthenational policy measures and methodologies to implement Article 7 of the Energy EfficiencyDirective,availableat:http://rekk.hu/downloads/projects/Final%20Report%20on%20Article%207%20EED.pdf, page vi
77Article7refersto’Energyefficiencyobligationschemes’ and requires, inter alia, that eachMSshallsetupanenergyefficiencyobligation scheme that shall ensure that distributors and/or retail energy sales companies should achieve a cumulative end-use energy savings target by 31 December 2020, at least equivalent to achieving new savings each year of 1.5% of the annual energysalestofinalcustomers.
78 Obviously enough, these examples provide onlytrends;theenergyefficiencypotentialofanymeasuredifferssignificantlybysectorand application, and requires individual analysis.
79 Weide (2013), Building Automation: the scope for energy and CO2 savings in the EU, available at: http://www.leonardo-energy.org/sites/leonardo-energy/files/documents-and-links/scope_for_energy_and_co2_savings_in_eu_through_ba_2nd_ed_2014-06-13.pdf
80FrontierEconomics(2015)Energyefficiency– An infrastructure priority, available at http://www.frontier-economics.com/documents/2015/09/energy-efficiency-infrastructure-priority.pdf
81 See e.g. Sorrell et al (2011), Cagno et al (2012), ACEEE (2013), etc.
82 United Nations Industrial Development Organization,“Barrierstoindustrialenergyefficiency:Aliteraturereview”2011
83Firm-levelPerspectiveofEnergyEfficiencyBarriers and Drivers in UK Industry – Indications from an Online Survey 2014 by Pranab Baruah, Nicholas Eyre, Jonathan Norman,PaulGriffin,GeoffreyHammond
84Barrierstoenergyefficiency:Acomparisonacross the German commercial and services sector, Joachim Schleich 2009

Energy Efficiency in Europe | The levers to deliver the potential.
26
Barriers Lines of action
Inappropriate indicators and targets
Imperfect information on energy efficiency
Largest untapped potential in the building sector
End-users still having low energy efficiency behaviours
Price signals not adequate to promote energy efficiency
Difficulties in financing the required energy efficiency investments
1. Set appropriate indicators and targets
-Usesimpletargetstoassessandcommunicateprogress
-Monitorprogresswithselectedindicatorsandprioritise energyefficiencymeasures
2. Promote product standards and labels
-Overcomebarrierstowideruseofenergylabels
3. Unleash the energy efficiency potential of buildings
-Energystandardsforbuildings:EnergyPerformanceCertificates
-Obtaintherightassessmentofpotentialenergyefficiencyprojectsavings
-Newapproachestofinancingenergyefficiency
4. Mobilise retail consumers
-Measureconsumptionandquantifyrealisticsavings
-Informconsumersthroughdirectandindirectfeedback
-Convinceend-userstobecomepro-active
5. Send the right price signals
-GobeyondtheEmissionTradingScheme’scurrentreformplans
-Introduceacarbontax
-Whitecertificatesasaspecificmarketinstrumentforenergyefficiency
6. Facilitate financing of energy efficiency measures
-Rampuppublicfunding
-Promoteinnovativefinancingmechanisms
-Easeaccesstoenergyefficiencyfundingforsmallandmedium enterprises

Energy Efficiency in Europe | The levers to deliver the potential.
27

Proposals to capture the untapped potential ofenergyefficiency
Energy Efficiency in Europe | The levers to deliver the potential.
28

Energy Efficiency in Europe | The levers to deliver the potential.
29
1. Set appropriate indicators and targets

Energy Efficiency in Europe | The levers to deliver the potential.
30
1.1. Use simple targets to assess and communicate progress
Set national targets in PEC (Primary Energy Consumption) at EU level
Various indicators can be used to analyse energyconsumptionandsavings,butsettingtargetsandquantifyingMemberStates’ progress should be based on a minimumsetofrelevantindicators.Thiswill ensure comparability and proper monitoring at EU level and make it easy tocommunicateonprogressinaclear,transparent and homogenous way. As oftoday,Member States can set an indicative national energy efficiency target based on either primary energy consumption (PEC)85, or final energy consumption (FEC)86, primary or final energy savings, or energy intensity87. Some countries concentrate on the decrease in their PEC (e.g. by increasing theefficiencyoftheirgenerationsectoror decreasing network losses) while other MemberStatesfocusonreductionsinthefinalenergysector.France,forinstance,focusesonfinalenergyconsumption,withabottom-upapproachpersector.Polandfocusesonenergyintensity,togetherwithprimaryandfinalenergyconsumption.
Final energy consumption covers only 66% of the EU-28’s gross inland consumption88,asitdoesnottakeintoaccountenergylossesfromenergyproduction,transportanddistribution.ThereforesettingthemaintargetsintermsofFECoverlookspotentialenergyefficiencygainsintheenergysector.ProponentsofFEC targets argue that this indicator acts on the demand side and that it is more closely relatedtoaction.However,aslongasbindingFECtargetsarenotdefinedonasectorlevel,thereisnorealmomentumforspecificdemandsideenergyefficiencyactions.
A country’s energy intensity (i.e. the ratio ofitsgrossinlandenergyconsumptiontoitsgrossdomesticproduct(GDP))isoftenusedtoapproximateitsenergyefficiency.Yet,thisshortcutisproblematic,sinceitcanbedrivenbyvariationsindifferentnon-energy-relatedfactorsandthuslead
toincorrectresults.Suchfactorsincludeexchangerates,thesizeofthecountryandthestructureoftheeconomy.Forinstance,acountrywithahighdegreeofindustrialactivity,suchasGermany,mayhaveahigher energy intensity than a country moredependentonservices,suchastheUK,withoutthelatterautomaticallybeingmoreenergy-efficient.
For these reasons, at a national level, the focus should be on binding targets expressed in Primary Energy Consumption (PEC), rather than in Final Energy Consumption (FEC) or energy intensity,sinceatargetexpressedinPECcoversboththereductionofenergyconsumption and the move to a more efficientandlesscarbon-emittingenergymix.TargetsinPECshouldbedefinedMemberStatebyMemberState,takingintoaccounttheireconomicgrowth,theirspecificenergymixandthestructureoftheir economy.Each Member State can use additional indicators,suchasFECorenergyintensity,dependingonitsspecificnationalsituation,to monitor its progress and analyse the successofpolicymeasuresrelatedtoenergyefficiency.Interalia,monitoringandanalysing the FEC provide important insights into individual developments at national level,allowabetterunderstandingofthesectorial origins behind energy savings and canhelpcreateamomentumforspecificdemand-sideenergyefficiencyactions.Atthesametime,itisimportanttoensurethat these targets are consistent with other objectivesrelatedtoenergyandclimatepolicies,suchasthoserelatedtorenewableenergy and greenhouse gas emissions.
Use decomposition analysis to assess real energy savings
Energyefficiencymeasuresarefarfrombeingtheonlyfactorsexplainingtrendsin Member States’ energy consumption: economicactivity(e.g.theimpactsoftheeconomiccrisis),demographyandlifestyles,climateandotherfactorsplaysignificantrolesaswell.Itisimportanttoseparatepureenergyefficiencyimpactsfromtheseotherfactors.
85 According to Eurostat, "Primary EnergyConsumption"is“GrossInlandConsumption excluding all non-energy use of energy carriers (e.g. natural gas used not for combustion but for producing chemicals). This quantity is relevant for measuring the true energy consumption and for comparing it to the Europe 2020 targets.”
86AccordingtoEurostat,“Finalenergyconsumption is the total energy consumed by end users, such as households, industry and agriculture. It is the energy which reachesthefinalconsumer’sdoorandexcludes that which is used by the energy sectoritself.”
87 European Commission (2012), EED (2012/27/EU), Article 3.1, available at: http://eur-lex.europa.eu/legal-content/EN/TXT/PDF/?uri=CELEX:32012L0027&rid=1
88 Eurostat © European Union, 1995-2004, http://ec.europa.eu/eurostat/web/products-datasets/-/nrg_100a

Energy Efficiency in Europe | The levers to deliver the potential.
31
A decomposition analysis method should be defined at EU level and used in all the Member States to make it possible to track the actual progress of energy efficiency, independently of economic activity and structural changes (e.g. a shift from industry to services).
Differentmethodologiesexisttodecomposeenergyconsumptionintoitsfactorsandcouldbeusedforthispurpose89. The graphbelowshowsanexampleofsucha decomposition analysis into the main driversoffinalenergyconsumptionintheEU between 2007 and 2013. It was carried outbytheODYSSEEproject90. This graph providesinformationonFECratherthanonPEC,sinceitisnotstraightforwardtoestablish a clear relationship between PEC and the analysed parameters (economic activity,demography,lifestyles,energysavings,climate,etc.)
1.2. Monitor progress with key indicators and prioritise energy efficiency measures
Impacts vary widely depending on the type of energy efficiency measures
Energyefficiencymeasuresdonotnecessarily have the same impacts on thedifferentpillarsofEUenergypolicy.
Reducingenergydemandhasverydifferentimpacts depending on the primary source ofenergy:Forinstance,reducingtheconsumptionofenergyfromhydropowerdoesnotreduceGHGemissions,doesnot improve energy security and does not necessarily increase competitiveness. Similarly,theimpactonenergyefficiencyfromtheconsumptionreductionofpowerfromcoalorgasisnotthesame.Coal-firedpowerplantsuseenergylessefficientlythanmostgas-firedplants(theefficiencyofup-to-datecoal-firedpowerplantscanbeashighas46%,butisashighas60%forgas-firedplants).Coal-firedplantsalsoemitaround twice as much CO2forthesameproductionofelectricity.
With major budget constraints in most European Member States, it is therefore important to prioritise those energy efficiency measures that have the most significant impacts on all aspects of the European energy strategy: reducing GHG emissions, increasing security of supply and maintaining competitiveness.
Examplesofinterlinkagesatthemicroeconomic level between energy efficiency,GHGemissionsandrenewablesare presented below in two examples in Box1(forprivatetransport)andBox2(forheating).
89 E.g. ODYSSEE decomposition analysis, Paasche,Laspeyres,LMDI,LMDII,etc.
90TheobjectiveoftheODYSSEE-MUREprojectis to monitor energy consumption and efficiencytrends,andtoevaluateenergyefficiencypolicymeasuresbysectorforthe EU countries and Norway. The detailed methodology behind this analysis can be foundontheprojectwebsite:http://www.indicators.odyssee-mure.eu/php/odyssee-decomposition/documents/interpretation-of-the-energy-consumption-variation-glossary.pdf
91CalculationbasedonODYSSEE-MUREdata,http://www.indicators.odyssee-mure.eu/decomposition.html
1180
1160
1140
1120
1100
1080
1060
1040
1168 -44
1513 -0,4 -80
2311 1105
FinalConsumption
2007
Activity Demography Lifestyles Structure Energy Savings
Climate Other FinalConsumption
2013
Figure 8: Variation of final energy consumption in the EU, between 2007 and 2013, in Mtoe91

Energy Efficiency in Europe | The levers to deliver the potential.
32
Renewables Non-renewables/Fossil GHG emisions kg CO2-eq
Thisboxpresentsacomparisonofdifferenttechnologyoptions,i.e.acombinationofpowertrainsandenergycarriers(liquidfossilfuels,biofuelsorelectricity–thelatter being based on the average European electricity mix)92.Thedifferentimpactsarequantifiedoverthewholelifecycleoftheenergycarrier(e.g.forfossilfuels:fromthe wellhead to combustion in the car).
Thesamereasoningisvalidforothersectors.Inthefollowingboxwepresentthesametypeofcalculationforheatingsystems.
Avehiclewithadieselpowertrainshowsarelativelygoodenergyperformance–only15%morelifecycleenergyconsumptionascomparedtoanelectricvehicle–butarelativelypoorperformancewithregardstoGHGemissionscomparedtoelectricorbiofuel-poweredvehicles.ThebestGHGemissionsperformanceisachievedforelectricvehicles–eveniftheyarechargedwiththeaverageEuropeanelectricitymix,morethan75%ofwhichconsistsoffossilfuels.BiofuelsofferanintermediaryperformanceforGHGemissions,buthavethehighestcumulativeenergy demand.
92ThisanalysisismostlybasedontheJRC-EUCAR-CONCAWEWell-to-Wheels(WTW)database(availablehere:http://iet.jrc.ec.europa.eu/about-jec/downloads)thatprovides information on cumulative energy demandandGHGemissionsfordifferenttransportation technologies
93CalculationsbasedonJRC-EUCAR-CONCAWE Well to wheel analysis (version 4a). The following pathways were chosen: Diesel - Conventional diesel DICI; Gasoline – average between Conventional gasoline PISI and Conventional gasoline DISI; Ethanol –averageamong9differentethanolfromwheat production pathways; Biodiesel –Rape(REE),mealtoanimalnutrition,glycerine to fuel 2010; Electric car - EU mix lightvehicle.(http://iet.jrc.ec.europa.eu/about-jec/downloads)
Figure 9: Cumulative energy demand and global warming potential for selected private vehicle technologies 93
Box 1: Energy and climate impacts of private transport
Electricvehicle
Ethanol
Biodiesel
Gasoline
Diesel
0
0 20 40 60 80 100 120 140 160 180 200
100 200 300
Cumulative energy demand (MJ/100 km)
Greenhouse gas emmissions (kg CO2eq./100 km)
400 500 600

Energy Efficiency in Europe | The levers to deliver the potential.
33
Theimpactsofelectricheatingdependverymuchontheelectricitymixfromwhichelectricityisproduced.InFrance,withahighproportionofnuclearandhydropowerintheelectricitymix,electricheatingemitsveryfewGHG,lessthanhalfthoseofgas;inPoland,withanelectricitymixdominatedbycoal-poweredthermalplants,electricheatingemitsaconsiderableamountofGHGperunitofheatproduced(expressedinMJ),tentimesmorethaninFranceand4.7timesmorethannaturalgas-poweredheating.
Butinbothcases,theenergyefficiencyofelectricheatingisverylowcomparedtodecentralisedfossilfuel-poweredheating.Toprovidethesamequantityofheattotheend-userrequirestwiceasmuchprimaryenergywithelectricheatingthanwithdecentralisedfossilfuel-poweredheating(i.e.burningnaturalgas,coalorfueloil).
94 Calculations based on ecoinvent v3.2 database. The following pathways were chosen: Hardwood chips - Heat production, hardwood chips from forest, at furnace 1000kW;Naturalgas-heatproduction,natural gas, at boiler condensing modulating>100kW;Coal-heatproduction, at hard coal industrial furnace 1-10MW;Heavyfueloil-heatproduction,heavyfueloil,atindustrialfurnace1MW.Note that electric heating is not included since the conversion of heat into electricity has a 100% yield and the only energy losses occur upstream (electricity production and distribution). (http://www.ecoinvent.org/)
Figure 10: Cumulative energy demand and global warming potential for selected heating systems 94
Box 2: Energy and climate impacts of heating
Electric heatingin Poland
Electric heatingin France
Biomass Heating(hardwood chips)
Natural gasheating
Coal
Fuel oil heating
0 0,5 1 1,5 2 2,5 3 3,5 4 4,5
0 50 100 150 200 250 300 350
Cumulative energy demand (MJ/MJ)
GHG emissions (g CO2eq./MJ)
Renewables Non-renewables/Fossil GHG emisions g CO2-eq

Energy Efficiency in Europe | The levers to deliver the potential.
34
Prioritise energy efficiency measures by piloting towards an overarching target: avoided CO2 emissions
Energy efficiency is not an end in itself. ThethreepillarsoftheEUenergypolicy(energysecurity,sustainabilityand competitiveness) should remain the ultimateobjectives.Energyefficiencypoliciesshouldthereforebeseenascontributors to these overarching targets.
Inapost-COP21context,itisimportanttofocusontheenergyefficiencypoliciesthatwillcontributemosttoclimatepolicy,inlinewiththelong-termgoalofkeepingtheincrease in the global average temperature towellbelow2°Cabovepre-industriallevels.Inthisrespect,avoided GHG emissions are the most appropriate indicator to play this global role,since:
• they encompass the broader picture: theyareanindicationofenergyefficiency,renewables(sinceproperlymanagedrenewableenergiesemitfewGHG95) and climate change mitigation;
• theycanberelatedtolong-termglobaltargets (e.g. the COP21 target);
• they are already widely used (GWP10096),well known and commonly used by decision-makersandstakeholders.
Avoided GHG emissions can therefore be considered as the simplest proxy to take into account several aspects of energy efficiency measures and to be able to prioritise them when needed. At this stage, this indicator is not mature enough (missing standards) to act as a binding target in the very near future. Therefore, efforts should be done to further develop the methodology and to agree on a standardised approach, paving the way for the indicator to become reliable enough.
Setting the right indicators and targets is vital in monitoring progress and communicating on achievements.Atpresent,undertheEnergyEfficiencyDirective,MemberStatescanchoosewhethertosettheirnationalenergyefficiencytargetbasedoneitherprimaryenergyconsumption(PEC),finalenergyconsumption(FEC),primaryorfinalenergysavings,orenergyintensity.
• At EU and national level, the main target for energy efficiency policies should be expressed as Primary Energy Consumption (PEC).
Furtherindicatorsshouldbeusednottosettargets,buttoanalyseandmonitorprogress:
•Withmajorbudgetconstraints,itisimportanttoprioritisetheenergyefficiencymeasuresthathavethemostsignificantimpactsonallaspectsoftheEuropeanenergystrategy:reducingGHGemissions,increasingsecurityofsupplyandmaintaining competitiveness.
• Avoided GHG emissions should be promoted as an indicator,inordertoassessthewiderimpactsofenergyefficiencypoliciesontheoverallenergyandclimatestrategy and to prioritise energy efficiency measures according to their overall impacts.
95 With a few exceptions, especially certain categories of biofuels, when you consider theirlifecycleemissionsandtakeintoaccount emissions from indirect land use change (iLUC).
96 GWP100 (Global Warming Potential over 100 years) is currently the most used metric to calculate greenhouse gas emissions. Global warming potential is a relative measure of how much heat a greenhouse gas traps in the atmosphere. It compares the amount of heat trapped by a certain mass of the gas in question to the amount of heat trapped by a similar mass of carbon dioxide. GWP100 is calculated over aspecifictimeinterval:100years.GWPis expressed as a factor of CO2 (carbon dioxide) (whose GWP is standardized to 1), in tons of equivalent CO2 (tCO2eq).

Energy Efficiency in Europe | The levers to deliver the potential.
35
2. Promote product standards and labels
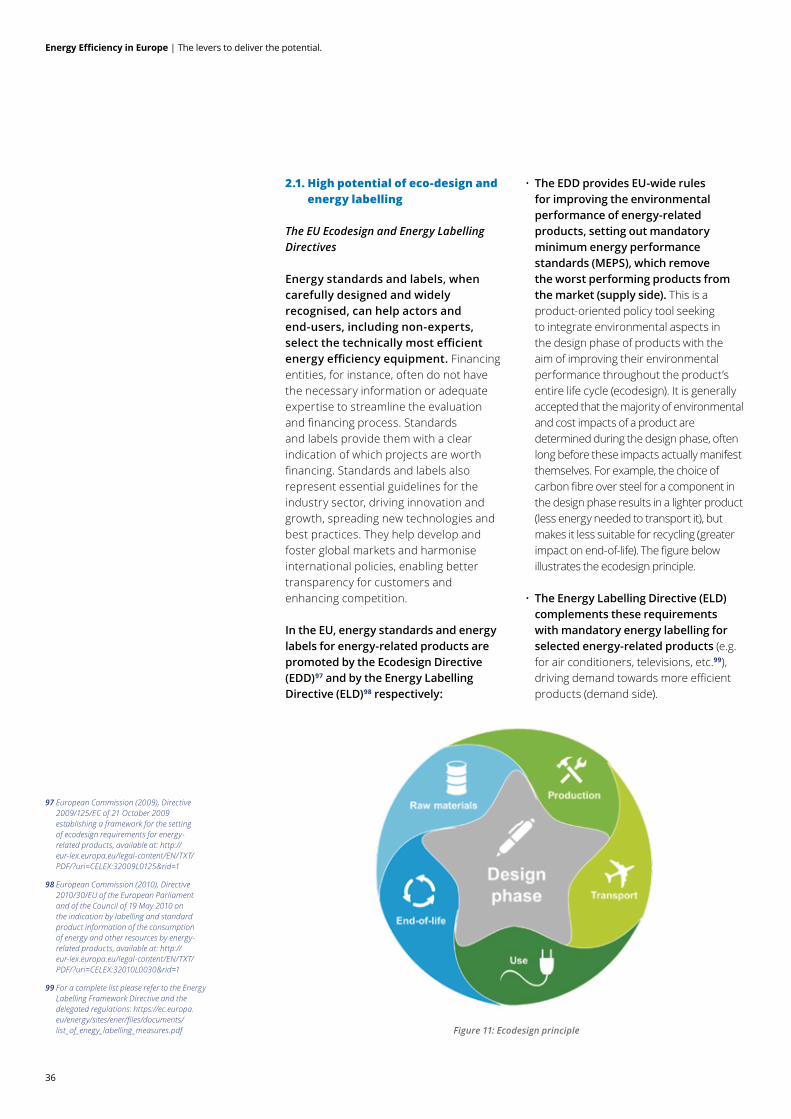
Energy Efficiency in Europe | The levers to deliver the potential.
36
2.1. High potential of eco-design and energy labelling
The EU Ecodesign and Energy Labelling Directives
Energy standards and labels, when carefully designed and widely recognised, can help actors and end-users, including non-experts, select the technically most efficient energy efficiency equipment. Financing entities,forinstance,oftendonothavethenecessaryinformationoradequateexpertise to streamline the evaluation andfinancingprocess.Standardsand labels provide them with a clear indicationofwhichprojectsareworthfinancing.Standardsandlabelsalsorepresentessentialguidelinesfortheindustrysector,drivinginnovationandgrowth,spreadingnewtechnologiesandbest practices. They help develop and fosterglobalmarketsandharmoniseinternationalpolicies,enablingbettertransparencyforcustomersandenhancing competition.
In the EU, energy standards and energy labels for energy-related products are promoted by the Ecodesign Directive (EDD)97 and by the Energy Labelling Directive (ELD)98 respectively:
• The EDD provides EU-wide rules for improving the environmental performance of energy-related products, setting out mandatory minimum energy performance standards (MEPS), which remove the worst performing products from the market (supply side). This is a product-orientedpolicytoolseekingto integrate environmental aspects in thedesignphaseofproductswiththeaimofimprovingtheirenvironmentalperformancethroughouttheproduct’sentirelifecycle(ecodesign).Itisgenerally acceptedthatthemajorityofenvironmentalandcostimpactsofaproductaredeterminedduringthedesignphase,oftenlongbeforetheseimpactsactuallymanifestthemselves.Forexample,thechoiceofcarbonfibreoversteelforacomponentinthe design phase results in a lighter product (lessenergyneededtotransportit),butmakesitlesssuitableforrecycling(greaterimpactonend-of-life).Thefigurebelowillustrates the ecodesign principle.
• The Energy Labelling Directive (ELD) complements these requirements with mandatory energy labelling for selected energy-related products (e.g. forairconditioners,televisions,etc.99),drivingdemandtowardsmoreefficientproducts (demand side).
97 European Commission (2009), Directive 2009/125/EC of 21 October 2009 establishingaframeworkforthesettingof ecodesign requirements for energy-related products, available at: http://eur-lex.europa.eu/legal-content/EN/TXT/PDF/?uri=CELEX:32009L0125&rid=1
98 European Commission (2010), Directive 2010/30/EU of the European Parliament andoftheCouncilof19May2010onthe indication by labelling and standard product information of the consumption of energy and other resources by energy-related products, available at: http://eur-lex.europa.eu/legal-content/EN/TXT/PDF/?uri=CELEX:32010L0030&rid=1
99 For a complete list please refer to the Energy LabellingFrameworkDirectiveandthedelegated regulations: https://ec.europa.eu/energy/sites/ener/files/documents/list_of_enegy_labelling_measures.pdf Figure 11: Ecodesign principle

Energy Efficiency in Europe | The levers to deliver the potential.
37
These two Directives are estimated to already have an overall positive impact on driving energy savings (175 Mtoe per year by 2020100, or 11.6% of EU28’s PEC in 2014). This is equivalent to 19% savingscomparedtobusiness-as-usualenergyuseforthoseproducts.Bysettingincreasingly stringent standards and thus reducingtheenergyconsumptionofthemainappliances,thesepolicymeasureswilldeliveralmosthalfofthe20%energyefficiencytargetby2020.
However,therearestillsomesignificantopportunitiesforadditionalenergysavings: the Commission regularly calls fortheestablishmentofaWorkingPlantoincludeadditionalproductsinthelistofproduct groups which are considered as prioritiesfortheadoptionofimplementingmeasures101 underthesetwoDirectives.In2015,Deloitte102 carried out the preparatory study to establish the third EcodesignWorkingPlan(2015-2017)103. This study proposed to include a selection ofnewpriorityproductgroupsinthelist.Our analysis showed that there is still approximately more than 6.2 Mtoe (264 PJ) that can be saved through ecodesign measures by 2020 (and 8.9 Mtoe by 2030) for a selection of product groups.
Possible ways forward for the Ecodesign and Energy labelling directives
Despite their positive impacts, these two Directives still have a variety of challenges to resolve as has been shown in a recent impact assessment104. These include:
• Thetrendforappliancestogetlarger:ithasbeenshown,forexample,thattheaverageviewablesurfaceareaofatelevisionwentfroma19”diagonalin1990to32”in2010;itisprojectedtoriseto an average 51” in 2030105.
• Longrulemakingprocesses,leadingtooutdated technical and preparatory work. Thelegalprocessfromthepreparatorystudytothepublicationoftheproductregulation takes on average more thanfouryears;thiscorrespondstoor
exceedsthelife-cycleofseveralproductgroups (especially in ICT). Among other factors,itcanleadtoatoolowlevelofambitionforanumberofproductregulations,ascomparedtowhatistechnicallyandeconomicallyfeasible106.
• Non-compliancedueto’weakenforcement’:arecentstudyestimatedthataround10%ofpotentialenergysavingsfromEcodesignandEnergyLabellingarelostasaconsequenceofpoorenforcement.107
Policy makers should regularly update ecodesign requirements, taking into account the technological process and ensuring that the level of ambition is adequate. The legislative process should be optimised and shortened, in particular when it comes to review studies, needed to update requirements in line with technological development. Furthermore, stronger market surveillance is needed to enforce ecodesign and labelling regulation.
2.2. Overcoming the barriers to wider use of energy labels
Simpler and more intuitive labels
There is a need to ensure that consumers are informed about both the absolute and relative performance of their product and that they understand the meaning of the labels.Currently,ahugevarietyofdifferentenergylabelscalesexist(fromAtoG,A+++toD,etc.),makingitalmostimpossibleforcustomerstofindtheirway.Furthermore,energylabelshavelosttheirinformativevalue,asenergyefficiencyhassignificantlyimprovedsincelabelswereintroducedin1995.Mostoftheproducts on the market today are to be foundinthetopenergyefficiencyclasses,makingthelabellessinformative.Forthisreason,on15July2015,theCommissionproposed a return to a single A to G label scale108.
100 European Commission, Energy efficientproducts,http://ec.europa.eu/energy/en/topics/energy-efficiency/energy-efficient-products;http://eur-lex.europa.eu/legal-content/EN/TXT/?uri=COM%3A2015%3A345%3AFIN,page 2
101 European Commission (2009), Directive 2009/125/EC of 21 October 2009 establishingaframeworkforthesettingofecodesign requirements for energy-related products, Article 16(1), available at: http://eur-lex.europa.eu/legal-content/EN/TXT/PDF/?uri=CELEX:32009L0125&rid=1
102TogetherwiththeOeko-InstitutandERATechnology.
103ThefinalreportsoftheEcodesignWorkingPlan study are currently in the process of beingapprovedforpublicationandfinaldraft documents are available on the projectwebsite:http://www.ecodesign-wp3.eu/
104 European Commission (2015), Impactassessment[SWD(2015)139final],availableat:http://eur-lex.europa.eu/legal-content/EN/TXT/PDF/?uri=CELEX:52015SC0139&rid=1
105VHK(2014),EcoDesignImpactAccounting,Part 1, https://ec.europa.eu/energy/sites/ener/files/documents/2014_06_ecodesign_impact_accounting_part1.pdf
106 European Commission (2015), Impact assessment[SWD(2015)139final],Annex 10, available at: http://eur-lex.europa.eu/legal-content/EN/TXT/PDF/?uri=CELEX:52015SC0139&rid=1
107 Ecofys (2013), Evaluation of the Energy LabellingDirectiveandspecificaspectsoftheEcodesignDirective:Backgroundreport I: Literature review, http://www.energylabelevaluation.eu/tmce/Final_technical_report-Evaluation_ELD_ED_June_2014.pdf
108EuropeanCommission,Energyefficientproducts, http://ec.europa.eu/energy/en/topics/energy-efficiency/energy-efficient-products

Energy Efficiency in Europe | The levers to deliver the potential.
38
While returning to a single scale can be seen as a first step in the right direction, continuous efforts still need to be made to develop relevant, up-to date and easy-to understand energy labels.
The YAECI109projectisagoodexampleofhow consumers can be helped to better understandenergylabelling,byintegratingdataonoverallcosts,inadditionto
energy alone. With the participation of Deloitte110, this project provides customers with information on the yearly energy cost of energy-labelled products at the time of their purchase. Thefollowingfigureshowsanexampleofsuchalabelforawashingmachine,indicating annual operational energy and water consumption and expenses.
109 Yearly Appliance Energy Costs Indication. Informationontheprojectisavailablehere: https://ec.europa.eu/energy/intelligent/projects/en/projects/yaeci
110 Under the name BIO Intelligence Service.
111SEVEn7,ApplianceEnergyCostIndicationhttp://www.appliance-energy-costs.eu/download-library/appliance-energy-cost-indication
Information on costs,to complement the usual
data on energy
Figure 12: Appliance energy cost indication for washing machines from the YAECI project111

Energy Efficiency in Europe | The levers to deliver the potential.
39
Additional regulatory steps
Measures should be taken to make public procurement of energy efficient products, services and buildings mandatory for public bodies at regional
and local levels. Energy labels can be usefulinimplementingpublicprocurementprogrammes,rebatesortaxincentives,since category labels make it relatively easy forinspectorstoverifycompliance.
Energy performance standards and labels enable better communication and transparency for customers and investors, provide guidance for green public procurement, and enhance competition and drive innovation for companies.
The Ecodesign and Energy Labelling Directives implemented key measures to promote energy standards and labels for energy-related products in Europe, with much success (175 Mtoe per year by 2020). Further progress is still possible by:
• Extending further the list of product categories targeted by these directives (estimatedpotentialadditionalsavingsof6.2Mtoeby2020(and8.9Mtoeby2030)foraselectionofproductgroups);
• Regularly updating labels and ecodesign requirements, taking technological progress into account and ensuring that the level of ambition is adequate;
• Optimising and shortening the legislative process, in particular in relation to review studies designed to update requirements in line with technological developments;
• Last but not least, strengthening market surveillance to enforce ecodesign and labelling regulation.
Additionally, there is a need to ensure that consumers are informed about both the absolute and relative performance of their products and that the meaning of labels is fully understood.
• Hence, continuous efforts are needed to develop relevant, up-to-date and easily understandable energy labels,possiblyintegrating the full life cycle cost of energy-related products.

Energy Efficiency in Europe | The levers to deliver the potential.
40
3. Unleash the energy efficiencypotential ofbuildings

Energy Efficiency in Europe | The levers to deliver the potential.
41
3.1. Buildings are Europe’s worst energy-guzzlers
Buildings accounted for 39% of the EU’s total final energy consumption in 2014, of which two thirds in the residential sector. Buildings generated around one quarter of GHG emissions not covered by the EU Emission Trading Scheme (ETS) 112. Spaceheatingmakesup67%oftotal
householdconsumption,wayaheadofwaterheating,appliances,lighting,and cooking and cooling. High energy consumptionforspaceheatingispartlyduetothefactthat75% of the EU’s building stock is still energy inefficient (compared to current regulations on energyperformanceofbuildings)andtherateofbuildingrenovationremainsverylow at around 0.4% to 1.2% per year113.
112 The EU Emissions Trading System (EU ETS) is a pan-European greenhouse gas emission allowances trading scheme. It coversGHGemissionsin31countries(28EU countries and the three EEA-EFTA states (Iceland, Liechtenstein and Norway), from large emitters: more than 11,000 power stations and industrial plants, as well as airlines.
113 European Commission (2016), An EU Strategy for Heating and Cooling [SWD(2016)24],availableat:http://eur-lex.europa.eu/legal-content/EN/ALL/?uri=COM%3A2016%3A51%3AFIN
114 Data provided by Enerdata/ODYSSEE MUREproject,http://www.odyssee-mure.eu/publications/efficiency-by-sector/household/household-eu.pdf
115CalculationbasedonODYSSEEMUREdata,EnergyPerformanceCertificates,http://www.odyssee-mure.eu/news/workshops/london/19-Energy-Performance-Certificates.pdf
Figure 13: Household energy consumption in the EU 114
70%
60%
50%
40%
30%
20%
10%
0%
71%
12% 9%5%
2% 0%
67%
13% 11%6%
2% 1%Space heating Water heating Electrical appliances Cooking Lighting Cooling
270 280 290 300 310 320 330 340 350
Final Consumption 2005
Climate
Moredwellings
Moreappliancesperdwelling
Larger homes
Energy savings
Other
Final Consumption 2013
2000 2012
Measures have been introduced in recent years – on building renovation, thermal insulation, thermal regulations for new buildings, more energy-efficient appliances, etc. – but the energy savings generated as a result have done only little more than compensate for an overall increase in demand due to changes in lifestyle. Final energy consumptioninhouseholdsfellby3%
between 2005 and 2013 (whereas the EU’s total primary energy consumption decreasedby8%overthesameperiod),but would have been 14% higher without any measures. Energy savings were only abletocompensatefortheincreaseinthenumberofdwellings(demographiceffect)andthefactthathouseholdsaretendingtouse more appliances in the home and live in larger homes.
Figure 14: Variation of households’ consumption in the EU between 2005 and 2013 (in Mtoe) 115
306
1
22
3
15
-41
-8
297

Energy Efficiency in Europe | The levers to deliver the potential.
42
116 The review will focus on Articles 1, 3, 6, 7, 9-11, 20 and 24, in view of the 2030 energyefficiencytarget.https://ec.europa.eu/energy/en/consultations/consultation-review-directive-201227eu-energy-efficiency
117 European Commission (2010), Directive 2010/31/EU of the European Parliament and of the Council of 19 May2010ontheenergyperformanceof buildings, available at: http://eur-lex.europa.eu/legal-content/EN/TXT/PDF/?uri=CELEX:32010L0031&rid=1
118ThePoliciesPartners(2013),RenovationRoadmapsforBuildings,http://www.eurima.org/uploads/ModuleXtender/Publications/96/Renovation_Roadmaps_for_Buildings_PP_FINAL_Report_20_02_2013.pdf
119 It scores the strategies against the fivecomponentsectionsofArticle4onascaleof0-5where0=Missing,1= Unsatisfactory, 2=Inadequate, 3=Adequate, 4= Good, 5= Excellent. A strategy is considered as being compliant with the minimum requirements of Article 4 if it achieves a rating of 70% and each of the individual sections scores at least 3.
120 BPIE (2015) - Do building renovation strategies live up to the name?, available at: http://bpie.eu/wp-content/uploads/2015/11/Do-building-renovation-strategies-live-up-to-the-name.pdf. It canbenotedthatonly18strategieswerestudied by the BPIE since the others were not available in English when the study was drafted.
3.2. Mixed success from regulatory action to date
The ambitions
European legislation covering the energy efficiency of the building sector is embedded primarily in two different Directives,theEnergyEfficiencyDirective(EED)116andtheEnergyPerformanceofBuildingsDirective(EPBD)117.
The EED set a 3% annual renovation target for central government buildings,butdidnotproviderenovationtargetsfortherestofthebuildingstock.ItrequiredMemberStatestoestablishlong-termstrategiesformobilisinginvestmentintherenovationofnationalbuildingsstocks in 2014. These building renovation roadmaps are published and submitted totheCommissionaspartoftheNationalEnergyEfficiencyActionPlans(NEEAPs)118. Article4specifiesfiverequirementsthatrenovation strategies need to cover: 1) An overviewofthenationalbuildingstock;2)Identificationofcost-effectiveapproachesto renovation; 3) Policies and measures to stimulatecost-effectivedeeprenovationofbuildings;4)Aforward-lookingperspectiveto guide investment decisions; and 5) Evidence-basedestimatesofexpected
energysavingsandwiderbenefits.
The EPBD is the key legislative instrument to unlock the savings potential in the EU building sector. It is being reviewed in 2016. It requires Member States to implement a number ofmeasures,includingtheintroductionofEnergyPerformanceCertificates(EPC)andinspectionsofheating,ventilationandairconditioningsystems.Furthermore,allnewpublicbuildingsneedtobenearlyzero-energy by 2018; this applies to other new buildingsbytheendof2020.
Mixed results
InNovember2015,theBuildingsPerformanceInstituteEurope(BPIE)providedafirstassessmentofMemberStates’ renovation strategies.
One of the main conclusions of the study was that only five countries were complying fully with the requirements: Czech Republic, Finland, Romania, Spain and the UK119.Inpractice,mostMemberStateshadnotsetaconsistentpathfortherenovationoftheirnationalbuildingstocks,butwerefollowingarathershort-sightedstrategy.
Figure 15: Compliance with the five requirements of the Article 4 of the EED 120
80%
70%
60%
50%
40%
30%
20%
10%
0%
Czech
Republic
Cyprus
Finland
Denmark
Romania
Germany
Spain
PolandUK
Sweden
Ireland
Austria
Belgium
Italy
France
Malta
Netherla
nds
Bulgaria
Overall level of compliance with Article 4 Minimum level of compliance with Article 4

Energy Efficiency in Europe | The levers to deliver the potential.
43
121The“landowner-tenantproblem”isa typical case of split incentives, i.e. a situation where economic actors participating in an exchange do not share thesameobjectives.Inthecaseofenergyefficiency,splitincentivesoccurbetweentenants and landlords. While tenants want to minimise their energy bill, landlords want to minimise their investment costs. Since the landlord will not get any return frominvestmentinamoreefficientenergysystem, and the tenant is not certain to cover the cost of an investment through cost savings on the energy bill, the energyefficiencypotentialoftenremainsunrealised.
122 The EPBD requires that EPCs be calculated toaspecificmethodology,describedinAnnex I of the Directive.
123 Available at: http://eur-lex.europa.eu/legal-content/EN/TXT/?uri=CELEX%3A32002L0091
The countries with the best performance in this study were those with the most rapid turnover of the dwellings stock,ahighrateofupdatingofthermalregulations,andprogrammesforincentivisingtheretrofittingofexistingdwellings to balance out the increased numberandaveragesizeofdwellings.Significantenergysavingscanberealisedeither through simple measures (insulating theroofandwalls,andinstallingdoubleortripleglazing)ormajorrenovationworks(buildingenvelope,moreefficientboilers,and automated and controlled systems).
Barriers to achieving more
Untilnow,thepotentialinthebuildingsectorhasbeengreatlyunderexploitedforseveral reasons:• The buildings market is large and highly disaggregated.Decisionsonenergyefficiencyaretakenbymultipleplayerswithdiverginginterests(“landowner-tenant problem”121)andenergyefficiencyprojectsareoftensmall,andspreadamongmanydifferentactors.
• Thefinancialstructuresofenergyefficiencyfundsareoftentoocomplexandbureaucratic,inparticularforhouseholdsorSMEs;theycannotaffordto invest enough time or money to get significantreturns.
• Thehighvolatilityofenergypricesandthe very long return on investment makeenergyefficiencymeasuresveryunattractiveforinvestors.Furthermore,thecurrentcontextoflowenergycosts does not incentivise investing in technologieswithhighramp-upcosts,since the reduction in overall operational costs is unlikely to repay the initial investment.
3.3. Energy standards for buildings: Energy Performance Certificates (EPC)
Energy Performance Certificates (EPCs) are a specific application of energy labels to the case of buildings. They indicate theenergyperformanceofabuildingor building unit and potential energy savings.122EPCusuallyprovideinformationabout the building’s energy use as well as typicalenergycosts,andofferinasecondpart recommendations about how to reduceenergyuse.Theirmainobjectiveistoprovideinformationtobuildingowners,tenants or property actors when a building or building unit is rented or sold and in this waytodrivedemandforenergyefficiencyin the building sector.
EPCs have existed in European legislation sincethefirstEnergyPerformanceofBuildingsDirective,orEPBD(2002/91/EC)123.TherecastEPBD(2010/31/EU) implemented several additional requirements to improve the overall scheme.Theseincludedqualitycontrols,apenaltysystemorthepromotionoftheEPC in the retail market.
Thefollowingfigure(nextpage)showsanexampleofanEnergyPerformanceCertificateintheUK.

Energy Efficiency in Europe | The levers to deliver the potential.
44
124Gov.UK,EnergyPerformanceCertificate(EPC),https://www.gov.uk/government/uploads/system/uploads/attachment_data/file/49997/1790388.pdf
Figure 16: First page of an EPC in the UK 124
Information on potential costs savings
Information on recommended energy efficiency measures

Energy Efficiency in Europe | The levers to deliver the potential.
45
125 Bio Intelligence Service (2013), Energy performancecertificatesinbuildingsand their impact on transaction prices and rents in selected EU countries, (Bio Intelligence Service is now part of Deloitte); https://ec.europa.eu/energy/sites/ener/files/documents/20130619-energy_performance_certificates_in_buildings.pdf
126Asanexample,theGermanDINV18599series, the Dutch NEN 7120 and the Italian UNI-TS 11300 series represent national divergences from the CEN-EPBD standards.
127 Ecofys (2015), Public Consultation on the Evaluation of the EPBD, http://bpie.eu/wp-content/uploads/2015/12/Task2_final-report_Public-Consultation-on-the-Evaluation-of-the-EPBD.pdf
128ODYSSEEMUREproject,EnergyPerformanceCertificates,http://www.odyssee-mure.eu/news/workshops/london/19-Energy-Performance-Certificates.pdf
According to a study conducted by Deloittein2013ontheimpactofenergyperformancecertificatesinfiveEU
countries112,EPCs have a positive effect on energy efficiency and led in general to higher sale prices or rents.125
Figure 17: Effect of one-letter or equivalent improvement in EPC rating across European property markets (95% confidence interval)
However, there is no common calculation method for the EPC across European Member States, which has led to a situation where comparable buildings in different countries, or even regions within a country, can be classified differently.TheEPBD(Directive2010/31/EUontheenergyperformanceofbuildings)leavesMemberStatesthefreedomtodesign EPCs at national level. WhileAnnexIoftheEPBDprovidesacommongeneralframeworkforthecalculationoftheenergyperformanceofbuildings,datacollectionandreporting(nationalorregionaldatabases),the
calculationmethodsdiffersignificantlyfromoneMemberStatetoanother,asdoesthelevelofqualificationsrequiredofexperts.126However,thereisneitheratechnical,noraneconomicjustificationforusingdifferentcalculationmethods127. Thefollowingfigureprovidesexamplesfromdifferentcountriesshowingthevarietyofratings:finalandprimaryenergydemand(inkWh/m2/a)inGermany,greenhousegas emissions and achievable energy performancefordifferentcategoriesofenergyconsumption(inkWh/m2/a)inItaly,sevenscoresfromAtoGinFinland,15scoresfromA1toFinIreland,etc.
Figure 18: EPCs in four different countries 128

Energy Efficiency in Europe | The levers to deliver the potential.
46
129 European Committee for Standardisation, European Committee for Electrotechnical Standardisation and European Telecommunications Standards Institute.
130 European Commission, Standardisation Mandates,http://ec.europa.eu/growth/tools-databases/mandates/index.cfm?fuseaction=search.detail&id=465
131 BPIE (2014), Energy Performance CertificatesacrosstheEU,http://bpie.eu/uploads/lib/document/attachment/81/BPIE_Energy_Performance_Certificates_EU_mapping_-_2014.pdf
New energy performance building standards, which will be published as EN or EN-ISO standards at the earliest by the end of 2016 or beginning of 2017, should be used by all Member States to guarantee a homogenous approach. In2010,theECissuedaStandardizationMandate(M/480)toseveralstandardisationbodies (CEN129,CENELECandETSI)“fortheelaborationandadoptionofstandardsfora methodology calculating the integrated energyperformanceofbuildingsandpromotingtheenergyefficiencyofbuildings,inaccordancewiththetermssetintherecastoftheDirectiveontheenergyperformanceofbuildings(2010/31/EU)130. Sincethen,CENandtheInternationalOrganizationforStandardization(ISO)havebeen developing procedures and standards forbuildings,systemsandproductsforlow energy buildings that could meet the nearlyzero-energybuildings(nZEB)targetsspecifiedintheEPBD.
A recent study on energy performance certificates across the EU found that while most Member States have incorporated penalties for non-compliance with the EPBD in transposing it into national law, there is a considerable lack of enforcement of the penalty system. Thisdirectlyaffectsthequality,andthereforethecredibilityandsuccessoftheEPCschemes131.Indeed,forexistingbuildingsnotallMemberStatesrequirethephysicalpresenceofanaccreditedcertifieronsitetocollectallthenecessarytechnicalinformationandissuetheEPC.Instead,EPCsaresometimesissuedbasedoninformationprovidedbythe building owner. These are in general less accurate and reliable.
Toovercometheseshortcomings,thefollowingmeasurescouldbeimplemented:• Standardformatsfordatainput,
calculations and reporting should bealignedacrosstheEU,andbetransparent and publicly available. In particular,assoonasthenewENorEN-ISOenergyperformancebuildingstandardsarepublished,theyshouldbeused by all Member States to guarantee a homogenous approach.
• EPCs should always be based on onsite visitsandevaluationprocesses,carriedoutbycompetentcertifierswhohavesuccessfullycompletedmandatorytestsand training.
• Member States need to make sure that complianceismonitoredandthatnon-compliance is penalised; otherwise the scheme will lack credibility and reliability.
• Once such a common approach is established,acentrallymanageddatabasecouldbeenvisagedforenergyperformanceofbuildingstohelpmonitorthe improvements over time and to design appropriate policies. The EC should provide guidance and assistance to the Member States on introducing such policies.
• Withsuchcommonstandards,itcouldmake sense also to introduce binding targetsonenergyperformancefordifferentbuildingtypes.However,theseshouldbeagreeduponatnationallevel,sincethestartingpointsdifferfromoneMember State to another.
• As soon as the EPC scheme is reliable enough,itcouldalsomakesensetolinkfinancialincentivestothescheme.Onepossibility could be to provide cheaper loansforinvestmentsthatimprovetheenergyperformanceofbuildingswhosebetterperformancehasbeencertifiedbythe EPC.
3.4. Obtain the right assessment of potential EE project savings
Assessingthebenefitsofenergyefficiencymeasures correctly ex ante is necessary tojustifytheirimplementationonsolidgrounds.
The assessment should be specific: Encourage assessments of potential EE gains
Tobeimplementedonalargescale,building renovation needs to be based on measures tailored to each building, taking into account its intrinsic characteristics and the way it is used, and with a clear assessment of costs and benefits.Suchspecificassessmentsforeachbuildingcanbeapowerful

Energy Efficiency in Europe | The levers to deliver the potential.
47
132IEA(2015),CapturingtheMultipleBenefitsofEnergyEfficiency,http://www.iea.org/topics/energyefficiency/energyefficiencyiea/multiplebenefitsofenergyefficiency/
133A.Levinson(2015),HowMuchEnergyDoBuildingEnergyCodesReallySave?Evidence From California Houses, http://faculty.georgetown.edu/aml6/pdfs&zips/BuildingCodes.pdf
134Seesection6.2on“Promoteinnovativefinancingmechanisms”.
135 Whereas with Energy Performance Contracting,theriskofgettingsavingslower than expected is not supported by homeowners, but by the Energy Service Company (ESCO): the ESCO uses the stream of income from the reduction in energy consumption to repay the up-front costsoftheproject.FormoredetailsonEPC and ESCO, see section 6.2.
136 Utilities help households to improve household goods such as boilers and are reimbursed via the energy bill.
awareness-raisinginstrumentandcould encourage many households and companies to renovate their buildings: firstlybyquantifyingtherealenergyefficiencypotentialinbuildings;secondlybyeasingtheimplementationofthemostefficientenergyefficiencymeasures.Forinstance,aspartoftheimplementationofitsenergytransitionlawadoptedin2015,Francelaunchedapilotoftheso-called“energy renovation passport” (passeport rénovationénergétique)on10November2015.Thispassportisanin-depthenergyauditofadwelling,withatleastthreedetailedscenariosforrenovationwork,basedonthelifestyleofitsinhabitants.Itincludesadetailedanalysis,acostestimationandanassessmentofexpected savings and potential subsidies. Participation in this scheme is voluntary.
Integrate all impacts in the assessment: Put forward co-benefits
Energy efficiency in buildings can yield significant co-benefits, which come in addition to pure energy savings: building ownersandoccupantsmaybenefitfromimproveddurability,reducedmaintenance,greatercomfort,lowercosts,higherpropertyvalues,increasedhabitablespace,increasedproductivity,orimprovedhealthandsafety.Benefitsforgovernmentsoftenincludereducedsocietalhealthcosts,improvedairquality,animprovedtaxbase,higherGDPandenhancedenergysecurity.Utilitiesbenefitfromcostandoperationalbenefitsfromincreasedcustomersatisfaction,reducedemissionsandreduced system capacity constraints132.These co-benefits from energy efficiency measures can be a greater incentive than the economic benefits from the savings on energy bills alone. They should be thoroughly assessed and put forward to provide a comprehensive assessment of all the benefits of energy efficiency.
Base the assessment on ex post evaluations: assess past measures
Ex-post analyses, assessing the real impacts of measures implemented in the past, are crucial to assess which
measures are really cost-effective.Real-lifeenergyefficiencygainsareoftenlowerthanestimatedinatheoreticalex-anteevaluation,sincetheseunderestimatemanyreal-lifebarriers(e.g.sub-optimalend-userbehaviour)whichreducethepracticalgains.Asanexample,arecentanalysisfromGeorgetownUniversity(Levinson,2015)foundthat,contrarytoexpectations,“thereisnoevidencethathomesconstructedsinceCaliforniainstituted its building energy codes use less electricity today than homes built beforethecodescameintoeffect”133,thusquestioningtheeffectivenessofbuildingenergycodesinCalifornia.
3.5. New approaches to financing energy efficiency in buildings
On-bill Repayments
On-bill financing programmes are a way for utilities to incentivise customers to invest in energy efficiency measures, such as efficient lighting, efficient air conditioning or better insulation. It is essentially a loan provided by utilities to customerstofinanceenergyefficiencyimprovements in their buildings. The loan is then repaid on a monthly basis through theutilitybill.OnemajordifferenceascomparedtoEnergyPerformanceContracting (EPC)134 is that homeowners (or businesses)areliabletorepaythecharge,evenifthepromisedsavingontheirenergybills does not materialise135.
OneexampleforsuchasystemisTheGreenDealintheUK136.TheGreenDealFinanceCompanywasanovelfundingmechanism in the UK residential energy efficiencymarket,whichwaslaunchedin2013.Itenabledhouseholdstofinanceenergyefficiencyimprovementsthroughloans that were linked to their electricity bill. The loan could be passed to the next ownerortenantiftheoriginatoroftheloanmovedhousebeforetheendoftheloan’sterm.Overaperiodoftwoandahalfyears,only15,000peopleparticipatedintheGreenDeal,farfewerthanthegovernmentexpected in the beginning.

Energy Efficiency in Europe | The levers to deliver the potential.
48
Figure 19: Illustration of the PACE process 137
137 Data provided by Energy.gov, Property-Assessed Clean Energy Programs, http://energy.gov/eere/slsc/property-assessed-clean-energy-programs
138BerkelayLAB(2016),ResidentialPropertyAssessed Clean Energy in California, https://emp.lbl.gov/sites/all/files/lbnl-1003964.pdf
TheGreenDealwasheavilycriticisedbydifferentgroupsforitslacksofincentivesand overall design. Although the UK government put the so called ’golden rule’inplace–i.e.theexpectedenergysavings were always to exceed the cost ofrepaymentthehighinterestrates,hidden charges and penalty payments deterredpeoplefromparticipating.Asaconsequence the government abandoned the programme in July 2015 without any replacement strategy.
Well-designed on-bill repayment programmes have a high energy saving potential, since they can help resolve the problem of split incentives between owners and tenants, bypassing the high upfront costs for both. However, the example of the Green Deal in the UK shows that such a mechanism needs to be designed very carefully: policy makers needtomakesurethatnoadverseeffectsarise when putting such a system in place and that enough stimulus is created to drivedemandfortheuptake.
On-tax financing systems
On-tax financing systems are among the emerging financial instruments for energy efficiency measures. As in the caseofon-billrepayments,theobjectiveistosmooththeupfrontinvestmentcosts:itallowslocalorstategovernmentstofundtheupfrontcostofenergyimprovementsto commercial and residential properties. Thesearethenpaidforbythepropertyowners by increasing property taxes by a set rate over around 20 years.
Aprominentexampleofon-taxsystemsaretheProperty-AssessedCleanEnergy(PACE) programmes in the US. Property owners can choose to participate in a PACE programme and repay their improvement costsoveracertainperiodoftime,rangingnormallyfrom10to20years.Repaymentsarebasedonpropertyassessments,whichare paid as an addition to the owners’ propertytaxbills.Non-compliancewithpayment has the same consequences asthefailuretopayanyotherportionofapropertytaxbill.ThefollowingfigureillustratesthePACEprogrammes’financingmechanism.
The Property-assessed clean energy (PACE) system has been successfully implemented in the US.Asanexample,morethan47,000residentialPACEassessments worth almost $960 million havebeenimplementedsofaracrossCalifornia138. In view of its considerable potential, a similar system could also be adopted on a large scale in Europe.Various schemes such as on-bill repayments or taxes exist, allowing smoother investment costs.
They make it possible for the tenant to repay energy efficiency measures on a regular basis and to avoid high deterring upfront costs. These schemes have a high energysavingpotential,sincetheycanhelpresolvetheproblemofsplitincentivesbetweenownersandtenants,bypassingthehighfrontupcostsforbothofthem.Best practice in designing such schemes efficiently should be widely shared and similar experiences should be strongly encouraged by the public authorities.
FrameworkThe city or country creates a legal mechanism (e.g. land secured financing).
Sign-upThe property owner voluntarily signs up for financing and launches an energy efficiency project.
LendLenders provide the necessary funds to the property owner.
RepayThe property owner repays the liability through property tax bills (up to 20 years)

Energy Efficiency in Europe | The levers to deliver the potential.
49
139Deloitte/a.k.a.BioIntelligenceService(2013),Energyperformancecertificatesinbuildings and their impact on transaction prices and rents in selected EU countries, https://ec.europa.eu/energy/sites/ener/files/documents/20130619-energy_performance_certificates_in_buildings.pdf
Buildings use 39% of the EU’s total final energy (2014), two thirds of which in the residential sector and the rest in services. Of the EU’s building stock 75% is still energy inefficient and that is where the largest energy saving potential lies. Only five countries have complied fully with the requirements on energy efficiency in buildings (Article 4) contained in the Energy Efficiency Directive.
Energy Performance Certificates (EPCs) are a specific application of energy labels to the case of buildings. They have in general a positive effect on energy efficiency and result in higher sale or rental prices139 but they have not reached their full potential yet due to poor implementation and lack of enforcement. Furthermore, because of the variety of methods used, comparable buildings in different countries, or even regions within a country, can obtain different classifications.
• Public authorities should look for better homogenisation of EPC’s and promote them more extensively. The calculation methodology for EPC should be harmonised throughout the EU.
Atprojectlevel,abetteranticipationofthebenefitsofenergyefficiencymeasuresisnecessarytojustifytheirimplementationonsolidgrounds.Theex-anteassessmentofenergysavingsshouldbe:•basedonrealexpostevaluationsofsimilarprojects;•tailoredtoeachspecificbuilding;•becomprehensive,andincludepotentialco-benefits(impactonindividualcomfort,onthemarketvalueofbuildings,etc.),whicharesometimesmoresignificantthanpureenergysavings.
One key barrier in the building sector is the landlord-tenant problem (while tenantswanttominimisetheirenergybill,theownerisinterestedinminimisinginvestmentcosts).Specificandinnovativefinancingmechanismshavebeendevelopedtoenablethetenantnottopayfortheinvestmentinenergyefficiencymeasuresupfrontbutonaregularbasis,inlinewiththesavingsthattheenergyefficiencymeasuresgenerate:e.g.on-billoron-taxfinancingschemes.
• Such mechanisms need to be promoted by public authorities and put in place by private companies in order to overcome existing market failures as the landlord-tenant problem.

Energy Efficiency in Europe | The levers to deliver the potential.
50
4. Mobilise retail consumers

Energy Efficiency in Europe | The levers to deliver the potential.
51
Energyend-usersshouldbeawareofthechallengesatstake,knowwhattheycandoandbeconvincedoftheusefulnessofchangingtheirday-to-dayhabits.
140TheThirdEnergyPackageconsistsoftwoDirectivesandthreeRegulationsand entered into force on 9 September 2009; https://ec.europa.eu/energy/en/topics/markets-and-consumers/market-legislation
141EuropeanCommission(2014),Cost-benefitanalyses & state of play of smart metering deploymentintheEU-27,[COM(2014)356final,SWD(2014)188final],http://eur-lex.europa.eu/legal-content/EN/TXT/PDF/?uri=CELEX:52014SC0189&from=EN
142http://ses.jrc.ec.europa.eu/smart-metering-deployment-european-union
143EuropeanCommission(2014),Cost-benefitanalyses & state of play of smart metering deployment in the EU-27, available at http://eur-lex.europa.eu/legal-content/EN/TXT/PDF/?uri=CELEX:52014SC0189&rid=1
4.1. Measure consumption and quantify realistic savings
The role of smart meters in gathering relevant information
Rollingoutsmartmeters(forelectricityand gas) can be a way to generate more detailed data and help households take moreinformeddecisionsrelatedtotheirenergyconsumption,basedonpreciseandreal-timecostinformation.Under EU energy market legislation (Third Energy Package140),MemberStatesarerequiredtoensuretheimplementationofsmart metering (depending on the results ofalong-termcost-benefitanalysis(CBA),ifonehasbeenconducted).IftheCBAispositive,thereisaroll-outtargetof80%marketpenetrationby2020forelectricity.In2012,mostMemberStatesperformeda CBA on whether they should introduce smart meters or not141 and the EC conductedacomparativeanalysisoftheseCBAs. It concluded that cost estimates
varysignificantlyfromoneMemberStates to another (EUR 77 to EUR 766 per customer).Theaveragecostofasmartmetering system is estimated at between EUR200andEUR250percustomer,opposedtoaveragebenefitspermeteringpointofEUR160forgasandEUR309forelectricity.Thesebenefitsincludeacostreductionfromaverageenergysavingsofaround3%138andotherbenefits,suchas reductions in metering costs. The negativeCBAresultsforgasarelinkedtothechallengingbusinesscaseforgassmartmetering,sincegasnetworkscanstorelargeamountsofenergyandaremuch less dynamically responsive than electricity systems. For this reason only a fewcountries(Austria,France,Italy,Ireland,Italy,theNetherlandsandtheUnitedKingdom)142haveoptedforsmartmeteringinthegassectorsofar.Thefollowinggraphsummarisesthecostsandbenefitsforeachcountryandshowswhether the country decided to roll out smartmetersforelectricityornot.
Figure 20: Costs and Benefits of Smart Meters for electricity per Metering Point in different MS143

Energy Efficiency in Europe | The levers to deliver the potential.
52
TheGermanCBAconcludedthatafull-scaleroll-outwouldresultinanegativeoutcome,butthatsmartmeterscouldbeeconomicallyjustifiedforspecificcustomers (e.g. with a consumption higher than6,000kW/a).BasedontheGermanCBA,Deloitteperformedananalysistoofferstrategicadvicetodistributiongrid and metering station operators in Germany144. Two main scenarios were studied:thefirstdescribesthecurrentlegalframeworkscenarioandreferstothepartialroll-outscenariointheCBA,with27%ofintelligentmeasuringsystemsby2030.Thesecond,the“rolloutplus”scenario,foreseesthesequentialphase-outofconventionalmetersbyinstalling100%intelligentmetersby2032,keepingtheimplementationofintelligentmeasurement systems (including inter alia internal displays in households) at 30%. Oneofthemainconclusionsofthereport
isthat,in Germany, a global installation for internal displays in households is not recommended from the perspective of a meter operator due to high specific expenses. Furthermore, different geographical particularities need to be taken into account to find optimal individual solutions.
AsaconsequenceoftheseCBAs,16 MS145 started a wide-scale roll-out programme (80% or more) for electricity. Seven countries146 decided on a selective orlimitedroll-out(i.e.lessthan80%).Asoftoday,MShavecommittedtorolloutaround200millionsmartmetersforelectricityand45millionforgasby2020.This is accompanied by a total potential investmentofEUR45billion.TheECestimatesthatby2020,around72%ofEUconsumerswillhaveasmartmeterforelectricityand40%forgas143.
144 Dena, Introduction of smart meters in Germany,http://www.dena.de/fileadmin/user_upload/Projekte/Energiesysteme/Dokumente/140709_dena-Smart-Meter-Studie_Endbericht_final.pdf
145Austria,Denmark,Estonia,Finland,France, Greece, Ireland, Italy, Luxembourg, Malta,Netherlands,Poland,Romania,Spain, Sweden and the United Kingdom
146Belgium,CzechRepublic,Germany,Latvia,Lithuania,Portugal,Slovakia
147EuropeanCommission,JRC,SmartMeteringdeploymentintheEuropeanUnion,http://ses.jrc.ec.europa.eu/smart-metering-deployment-european-union
Figure 21: Smart meter roll-out in Europe147, as expected by 2020
Wide-scale (≥80%) roll-out by 2020
NO data available regarding nation-wide roll-out
NO wide-scale (<80%) roll-out by 2020 New EU MS
Selective roll-out by 2020

Energy Efficiency in Europe | The levers to deliver the potential.
53
Besides the technical and economic elements,rollingoutsmartmetersraisesseveral questions:
• Who should own the smart meters? Who shouldpayfortheirinstallation?Smartmetering costs should be borne by those whobenefitfromthem.
-TheDistributionSystemOperators(DSOs)andenergysupplierscansignificantlydecreasetheirmonitoringcoststhankstosmartmeters,sincedatais transmitted automatically and there is no need to send an employee to read the meters.
-Consumerscantakeadvantageofsmartmetersonlyiftheyhaveawayofdecreasing their energy consumption andiftheresultingenergysavingsexceed the installation costs.
• Who collects and handles the data? Howisthesafetyandprivacyofprivateinformationtakencareof?AreportfromtheEuropeanUnionAgencyforNetworkandInformationSecurity(ENISA)hasoutlined several security measures that would minimise the risk148.
• How is this data used to promote energy savings? Smart meters generate a huge quantityofdataonenergyconsumptionbutgatheringdataisnotanendinitself.Innovativewaystoconvinceend-userstodecrease their consumption have to be developedonthebasisofthismassivedata collection.
Noneofthesequestionshassimpleanddefinitiveanswers.Asaconsequence,differentMSplantorolloutsmartmetersindifferentways:
• InallMS,smartmetersareownedbytheDSOs,withtheexceptionoftheUKwhere the ownership is with the energy suppliers.
• In20MS,theDSOislikelytobetheresponsible party who has access to the generated data. In the other countries149 (CzechRepublic,Denmark,Estonia,PolandandUK),theresponsiblepartyisacentral hub.
• Inatleast17countries,theroll-outisduetobefinancedthroughnetworktariffs.
Only in the UK it is up to the energy suppliertofinancetheroll-out150.
To make the EU smart metering programme cost-efficient, the roll-out needs to be accompanied by specific measures: • Harmonisation (standardisation) work at EU level with respect to minimum functionalities, such as remote control, two-way communication and high interoperability; • National measures to guarantee protection of personal data;• Development and implementation of innovative ways to convince end-users to cut their consumption, on the basis of this massive data collection (see next section).These measures will be necessary to attract market entrants and to promote the emergence of innovative services such as demand response or data protection solutions.
Closing the gap: professional home energy audits and energy management systems
A home energy audit can be the first step in making a building or flat more energy efficient. Such an audit can help owners or tenantsassesstheirenergyconsumption,helpunderstandingthepotentialforenergy savings and what measures (investments or behavioural changes) willimprovetheenergyperformanceofthebuilding.Energyauditsprovidetailor-maderecommendationsbasedonindividual energy consumption and a real context.Theyareusuallyperformedbyindependent experts. Customers value this independence,sincetheexpertshavenoincentivetoprovidebiasedinformation.Energyauditorsneedtogothroughspecifictrainingandtobecertified(ISO50001)tobeabletoperformenergyaudits.These assessments usually comprise an evaluationofthethermalcharacteristicsandtheinfrastructure,aswellastheelectronicappliancesusedbythehousehold.Differentprofessionalappliancessuchasblowerdoorsorinfraredcamerasareusedtotesttheairtightnessofbuildingsandtodetectleaks.
148EuropeanUnionAgencyforNetworkandInformation Security (ENISA), available at https://www.enisa.europa.eu/publications/appropriate-security-measures-for-smart-grids
149 No information available for Bulgaria, Croatia and Hungary
150 No information available for the other countries.

Energy Efficiency in Europe | The levers to deliver the potential.
54
National and local authorities need to introduce more measures to encourage energy audits not only for SMEs, but also for households, by providing financial incentives.
Onegoodexampleofhowtoincentiviseenergy audits can be seen in the programmeofferedbytheGermanFederalOfficeforEconomicAffairsandExportControl(BAFA).TheBAFAoffersgrantsforon-siteadvisoryservicesamountingto60%oftheconsultancyfees(max.EUR800)fordetachedandsemi-detachedhousesandmax.EUR1,100fordwellingswithatleastthreeaccommodationunits.Thecostofadditionalexplanationsoftheenergyconsultancy report at the property owners’annualmeetingarefullycoveredup to EUR 500151.
Similarly,an energy management systems (EnMS)isa“setofinterrelatedor interacting elements to establish an energypolicyandenergyobjectives,andprocesses and procedures to achieve thoseobjectives”(accordingtotheISO50001 standard); it aims at enabling anorganisationtofollowasystematicapproach to achieving a continual improvementinitsenergyperformance,includingenergyefficiency,energyuseandconsumption. A recent study152 showed thatthebenefit/costratioofsuchenergymanagementsystemscanreachafactoroften.SofartheEnMSismainlyusedbyenergy-intensiveandlargeorganisations,butonlyafeworganisationsareadopting
strategiestocaptureallfinanciallyattractive measures.
To promote energy audits and energy management systems, Member States should:• develop programmes that raise
awareness among retail consumers about the potential benefits of energy audits and energy management systems;
• make sure that professional energy audits are widely available, especially by encouraging training programmes to guarantee that enough qualified persons are available to undertake such energy audits153.
4.2. Inform consumers through direct or indirect feedback
Home automation (domotics)
Smart home automation is the technologicaluseandcontrolofhomeappliances that enable automation and remote monitoring of residential homes. It includes smart devices to improve comfort and optimise energy consumption by regulating temperature and light,toensure safety(alarms,systemstolockdoors)andotherfunctions.Its development in the early 2010s was madepossiblebytheriseofelectronics in home appliances, Big Data and the Internet-of-Things (connected devices). Oneofthemostwell-knownexamplesofacompanyofferingsuchhomeautomationisNest.Foundedin2010,itwasacquired
Pre-auditdatacollection
On site audit, detailed data collection
Identificationof energy saving opportunities
Dataanalysis
Suggestionfor energy saving measures
151BAFA,FederalOfficeforEconomicAffairsand Export Control, http://www.bafa.de/bafa/en/index.html
152 Waide (2016), The scope for energy saving from energy management – draft report.
153EuropeanCommission(2013),Article8:Energy audits and energy management systems,[SWD(2013)447final],http://eur-lex.europa.eu/legal-content/EN/TXT/PDF/?uri=CELEX:52013SC0447&rid=1
Figure 22: Process of a typical energy audit

Energy Efficiency in Europe | The levers to deliver the potential.
55
byGoogleforEUR3.2billionin2014154. Many other players are competing on this market:Evohome(UnitedStates),Tado(Germany),Hive,Heatmiser,HeatGeniusandConnect(United-Kingdom),orIstabai(Latvia). Tado claims its product can cut heating bills by up to 31%155,Evohomeby 40%156,Istabaiby30%157 and Nest by 20%158.
Themarketforsmarthomeappliances,suchassmartthermostats,isdevelopingfastintheUnitedStatesandinEuropeandprovidesefficientsolutionsforhouseholds to save energy and money.
154C.C.Miller(2013),ForGoogle,aToeholdIntoGoodsforaHome,intheNewYorkTimes. Available at: http://www.nytimes.com/2014/01/14/technology/google-to-buy-nest-labs-for-3-2-billion.html?_r=0
155 Fraunhofer (2013), IBP report, Simulation study on the energy saving potential of heating control system featuring presence detection and weather forecasting, http://www.ibp.fraunhofer.de/content/dam/ibp/en/documents/ResearchNews/IM-527_englisch_web.pdf
156 Honeywell’s website: https://honeywell.com/sites/environment/Produits/Pages/evo-styledevie.aspx
157 Istabai CEO, Janis Lindermanis
158Nest(2015),WhitePaper“EnergySavingsfrom the Nest Learning Thermostat: EnergyBillAnalysisResults”,availableat: https://nest.com/downloads/press/documents/energy-savings-white-paper.pdf
159 Tado’s website: https://www.tado.com/de-en/heatingcontrol-savings
160Nest’swebsite:https://nest.com/uk/support/article/How-to-read-the-Nest-Energy-History-on-the-Web-and-Mobile-apps#!
161S.Darby(2006),Theeffectivenessoffeedbackonenergyconsumption,http://www.eci.ox.ac.uk/research/energy/downloads/smart-metering-report.pdf
162 Energy Analysis (2015), Impact of Feedbackaboutenergyconsumption;http://www.ea-energianalyse.dk/reports/1517_impact_of_feedback_about_energy_consumption.pdf
Figure 23: Heating savings and CO2 emissions avoided calculator, Tado159
Figure 24: Thermostat showing the detailed energy summary (orange bars indicate
the heating system was on), Nest160
Theseappliancesare,however,associatedwith security risks (since they can be compromised by hackers) and privacy ones (related to data handling and privacy). These risks will need to be better addressed in the coming years.
Feedback and “gamification”
Based on the concept “what gets measured,getsmanaged”(PeterDrucker),regular detailed feedback to households on their detailed energy consumption, either through energy bills, or digitally via their online accounts or applications for smartphones or tablets could help to reduce energy consumption. These feedback mechanisms should be promoted. Themoreinformationisavailable,forinstancethankstosmartmetering,theeasieritistocalculaterelevantindicatorstoprovideend-userswithrelevantfeedback.Thisfeedbackshould be transparent and easily understandable,andprovidebenchmarksthathelpend-userstounderstandtheirrelative consumption with respect to their past consumption and the consumption oftheirpeers.Directfeedbackreferstoimmediate (real time) and easily accessible consumptionfeedback(e.g.smartmeters,in-housedisplays),whileindirectfeedbackconsistsofprocesseddatathattheend-userreceivesatalaterstage(energybills,emails,etc.)161.
A study analysing 39 literature sources on feedbackonenergyconsumptioncametothe conclusion that “savings of 2-3 % can be achieved when considering a variety of studies with both direct and indirect feedback as well as different levels of information detail”162.
Whileinformationprovisioniskey,itwill not be enough to overcome inertia andbehaviouralbarriers.Theeffectofthisfeedbackcanbeenhancedthroughmechanismsthatinnovateandincentivise,suchascompetition,gamification(e.g.“areyouperformingbetterthanyourneighbour?”)andrewards(e.g.giftcardsinselected stores or online shops).

Energy Efficiency in Europe | The levers to deliver the potential.
56
Successful examples of customer feedback programmes using the concept of relative performance and enhancing energy efficiency can be seen in software-as-a-service (SaaS) companies that provide customers with better information about their energy consumption, along with individual ways to save energy(e.g.Opower,MyEnergy–bought by Nest in 2013).
Suchcompaniesofferutilitiescloud-basedsoftware,allowingthemtoinformtheircustomers about their energy use through personalisedanalysis,targetsettingandrewards. Thefollowingfiguresshowanexampleofsuchcomparativeinformationandrewardsprovided to consumers:
163 Source: OPower, https://opower.com/products/digital-engagement/
Figure 25: Comparative energy efficiency information provided to end-users163
Figure 26: Detailed consumption information and rewards for energy savings163

Energy Efficiency in Europe | The levers to deliver the potential.
57
Aesthetic smartphone, tablet and computer applications that promote gamification have been developed to incentivise people into adopting sustainable behaviours by making it fun to save energy and reduce CO2 emissions while incorporating a social component. Forinstance,inJouleBugorEcoIsland,consumersperformenergysavingactionsto win virtual rewards and to compete with
others.Inaddition,someapplicationsareconnected with smart home appliances,e.g.JouleBugoffersasetofactionswhichincludesimplethingsliketurningofflights,monitoringandtakingshortershowers,aswellasmakingenergyefficiencypurchases,suchasasmartthermostatorLEDs.164 Companies offering energy services can also develop their own games (e.g. Lockheed Martin165).
However, gathering data (for instance, through smart metering) is not enough. Energy suppliers have to calculate relevant indicators and provide transparent and understandable
feedback to end-users. Innovative ways of incentivising them into benefiting from of potential energy savings are developing and should be made even more widely available.164 Joulebug’s website: https://community.
joulebug.com/products/nest/
165LockheedMartin’swebsite:http://www.lockheedmartin.com/us/news/features/2014/gamification-energy-use.html
Figure 27: Connection with smart home appliances (Example JouleBug)

Energy Efficiency in Europe | The levers to deliver the potential.
58
4.3. Convince end-users to become pro-active
Encourage “enablers” via fiscal incentives
Enablers (such as Energy Management System (EnMS), smart meters, etc.) have a key role in improving energy efficiency. They do not create energy savings by themselvesbutenableend-userstohaveanaccurateviewofpotentialenergysavingsandhowtobenefitfromthem.They usually cost little compared to other energyefficiencymeasures,butcanbethe“firststep”towardsamorecompleteenergyefficiencystrategy.Promoting such “enablers” could raise awareness and be a good way to trigger further action.Publicsupporttoenablers,e.g.viafiscalincentives(taxreductions),canhaveadoubleeffect:
1)Encouragedbythisfiscalincentive,companies or households would start implementinganEEstrategy.Inthisfirstphase,investmentswouldbefocusedon’enablers’ that help assess the potential gains.
2) These enablers would help companies andhouseholdstodesignefficientEEmeasures that would be implemented in a second phase.
ArecentstudyfoundthatasfarasspecificinstrumentsdedicatedtoEnMSareconcerned,fewercountriestendtoaddressthisareaascomparedtofundingmechanismsforenergyaudits166. A good exampleofencouragementtoinstallan Energy Management System can be foundinGermany,whereenergyintensiveindustries(>1GWh)thathaveacertifiedEnergy Management System are exempted fromtheEEGsurcharge167.
TheSwedish“EnergyEfficiencyinEnergyIntensive Industries Programme” is another examplewhereenergy-intensiveindustriesreceiveafullrebateoftheenergytaxonelectricityiftheyintroduceanenergymanagementsystemandregularlyperformenergy audits. No new entrants have been acceptedsince2012,sincethisprogramme
will be replaced by a new programme in 2017168.
Foster demand side management
Thegoalofdemandsidemanagementis to encourage consumers to use less energyduringpeakhours,ortime-shiftenergyusetooff-peaktimes.Demandside management improves the reliability andflexibilityoftheenergysystemasitcanabsorbsomeoftheshockscomingfromthegenerationmix.Demandsidemanagementcanoffersolutionstoissuessuchasenergyefficiency,loadmanagement,orstrategicconservationand related activities.
Controlled consumption through demand side management could help improve energy efficiency, and achieve energy efficiency and environmental targets.Thetechnologiesrequiredfordemand-sideresponseanddemand-response services are developing quickly169anddemand-sidemanagementprogrammes have shown positive results overthelasttenyears.However,suchprogrammes need to be adapted to individual needs and behaviour170.
Evidence, education and professional training
Providing end-users with relevant energy related information (energy use, lifetime, etc.) is the first step to raising awareness and increasing energy efficiency through behavioural changes, especially in households. Throughspecificenergy-efficiencycampaigns,end-userscanbeinformedaboutsimplepracticesindailylifethat could save money and improve their energyandenvironmentalfootprint.Thesecampaignsshouldalsobepartofschooleducation in order to demonstrate current best practices to younger generations whoseparentsmightnotbeawareofthese best practices; this could enhance inter-generationalknowledgetransferfromtheyoungertotheoldergeneration(’reversemonitoring’).Similarly,trainingprogrammes should be developed such thatprofessionalsproposethemost
166 European Commission (2016), A Study on EnergyEfficiencyinEnterprises:EnergyAuditsandEnergyManagementSystems,available at: https://ec.europa.eu/energy/sites/ener/files/documents/EED-Art8-Implementation-Study_Task12_Report_FINAL-approved.pdf
167TheGermanEEGisthedifferencebetweenthewholesalemarketpriceforelectricityandthefixedhigherpriceforrenewableenergies.
168 IEA, Programme for Improving EnergyEfficiencyinEnergy-IntensiveIndustries (PFE), http://www.iea.org/policiesandmeasures/pams/sweden/name-22448-en.php
169 European Commission (2013), Delivering theinternalelectricitymarketandmakingthemostofpublicintervention[C(2013)7243final]http://ec.europa.eu/transparency/regdoc/rep/3/2013/EN/3-2013-7243-EN-F1-1.PDF
170 C. Bergaentzlé, C. Clastres, H. Khalfallah (2014), Demand-side management and European environmental and energy goals: An optimal complementary approach

Energy Efficiency in Europe | The levers to deliver the potential.
59
energy-efficientproductsandservicestotheir clients whenever relevant.
Many online sites already provide informationaboutbestpractices,butonlyasmallpercentageofthepopulationactivelylooksforthem.For this reason, the information needs to be channelled directly to the end-users. An efficient means of conveying such specific
and tailored information could be transmitted through a monthly “did you know-section” on the household’s energy bill, based on scientifically proven facts.Thisinformationonenergy-efficiencypotential should also be translated into monetary terms by providing calculators or showing calculations that might incentivise peopletooptforanenergy-efficiencyinvestment or behavioural changes.
End users’ awareness, data gathering and communication play an important role in reaching overall energy efficiency targets. End-users need to be mobilised to adapt their everyday habits and become more aware of their energy consumption and of the potential savings they could generate. Several inter-related categories of action have to be undertaken to
1. Measure: Measuring precisely what end-users consume and quantifying what they could realistically save is the first step in raising their awareness;
2. Inform:measuringandquantifyingpotentialsavingsisnotenough;providing proper direct or indirect feedback is a key complement: potential gains need to be presented in a way that is clear, transparent and easy to understand; achievable targets have to be proposed; progress has to be monitored, etc. Gamificationtechniques(suchascustomer-feedbackprogrammescomparingenergyperformancebetweenneighbours)canbeusedtomakethisfeedbackmore attractive;
3. Convince:Ontopofthis,convincingend-userseithertotakethefirststep(measuringenergyconsumptionandquantifyingpotentialgains)orthelast(investinginenergyefficiencymeasures)iscritical.For instance, more measures need to be implemented to encourage energy audits or Energy Management Systems (EnMS) not only for SMEs, but also for households.
These measures provide opportunities to develop new business models (smart metering,smarthomeappliances,consumer-friendlybills,etc.),whichcanbetakenupeitherbytraditionalactors(powerutilities,energyproviders)orbyinnovative,quiteoftenIT-focused,newcompanies.

5. Send the right price signals
Energy Efficiency in Europe | The levers to deliver the potential.
60

171 The European Union Emissions Trading Scheme (EU-ETS) is cap-and-trade scheme for GHG emissions in 31 European countries. Covered entities receive European emission allowances (EUAs). For each allowance they can emit 1 ton of CO2. If their CO2 emissions exceed the number of allowances they have, an entity can purchase EUAs from other entities. Conversely,ifanentityhassignificantlyreduced its carbon emissions, it can sell its leftover EUAs. After Phase I (2005-2007) andPhaseII(2008-2012),theEUETSiscurrently in its Phase III (2013-2020).
172 www.eex.com, information retrieved on 30/05/2016
173 I4CE (2015), Carbon Pricing: Perspectives for the EU emissions trading scheme by 2030, http://www.i4ce.org/wp-core/wp-content/uploads/2015/12/15-12_10-I4CE_COPEC-side-event.pdf
174 The Linear reduction Factor is the rate by which the overall emissions cap is reduced each year. It amounts to 1.74% for the period 2013-2020 and is planned to amount to 2.2% for the period 2021 to 2030.
175 European Commission, Structural reform oftheEuropeancarbonmarket,http://ec.europa.eu/clima/policies/ets/reform/index_en.htm
Anotherstraightforwardwaytoincreaseawareness among energy consumers is to actonpricesignals,eitherthroughenergyor carbon prices.
Oneofthemainbarrierstoenergyefficiencymeasuresisarelativelylowpriceofenergy.Betterinternalisationofthenegative externalities related to energy use (e.g. GHG emissions and wasted energy) would send right price signals to public and private actors and help reach the EU’s energyefficiencyandGHGemissionsgoals.ReformingtheEU-ETS,complementingit with a carbon tax and expanding white certificatesystemsarethreeeffectivewaysto do so.
5.1. ETS: current reform plans might not be enough
Review the quota allocation system
The EU emissions trading system (EU ETS) 171, whichisacornerstoneoftheEU’spolicytofightclimatechange,isnotasufficientincentive to decarbonise the economy: thepriceofallowances(representingGHGemissions)hasundergonesignificantvariations,goingaslowasEUR6pertCO2eq. in May 2016172. The low carbon price is not a strong enough signal to provoke a fuelswitchtolowerCO2emittingfuels.Forinstance,coalisstillmuchcheaperthantherelativelylesscarbon-intensivegas.CoalpricesplummetedintheaftermathoftheUSshale-gasrevolutionandduetodecreasedChinesedemand,leadingtoanincreased coal supply on the global market. SinceacarbonpriceofaroundEUR30t/CO2wouldbeneededtotriggerafuelswitchtogas,coalhasseenarenaissancein Europe in recent years.
There are several reasons why European carbonpricesarelow,suchasthedecreaseinindustrialactivityintheaftermathofthe2008economiccrisis,andanover-allocationofquotas.Thelatterispartlyduetothefactthattheimpactsofenergy
efficiency(EE)andrenewableenergy(REN) policies were not taken into account when setting annual European Emission Allowance (EUA) quotas. Evidence exists thattheEnergyEfficiencyDirective(EED)willbecontributingtoanEUAsurplusof500 MtCO2eq by 2020173.
It is therefore essential to take into account the impacts of all policies (EE, REN) when defining emission quotas. This should especially be borne in mind when setting the ETS Linear Reduction Factor174forthe4thtradingphase(2021-2028).
The EU wants to address over allocation by cuttingthenumberofallowancesonthemarket175:• Asashort-termmeasure,the
Commission postponed the auctioning of900millionallowancesuntil2019-2020(’back-loading’ofauctionsinPhase3):The auction volume was reduced by 400 millionallowancesin2014,300millionin2015and200millionin2016,andwillbeput back on the market in later years (300 million in 2019 and 600 million in 2020).
• Asalonger-termsolution,amarketstability reserve will be established as of2018withtheobjectiveofaddressingthecurrentsurplusofallowancesandimproving the system’s resilience to majorshocks.
• Additionally,theECproposedinJuly2015that,startingin2021andtill2030(i.e.forphase4oftheETS),thenumberofallowances—thetotalcaponemissions—willdecreaseeachyearby 2.2% compared to 1.74% currently; this amounts to an additional emissions reduction in the sectors covered by the ETSofsome556MtCO2eq during this phase.
This initiative is a good step in the right direction, but probably not stringent enough to get CO2 prices high enough to incentivise EE investments.
Energy Efficiency in Europe | The levers to deliver the potential.
61

Energy Efficiency in Europe | The levers to deliver the potential.
62
176 European Commission, available at https://ec.europa.eu/energy/en/topics/energy-efficiency/buildings
177 California Environmental Protection Agency(2015),OverviewofARBEmissionsTrading Program, http://www.arb.ca.gov/cc/capandtrade/guidance/cap_trade_overview.pdf
Integrate diffuse emissions into the ETS
55%ofoverallGHGemissionsarenotcovered by the EU ETS. These are mainly diffuseemissionsi.e.emissionscoming
fromscatteredsourcessuchasbuildings,transport,etc.AccordingtotheEC,buildingsareresponsiblefor36%ofCO2 emissions in the EU176.
There is a need to envisage extending the scope of the EU ETS to include diffuse emissions, at least from the private households, and possibly from other sectors such as freight transportation.
Suchinclusionhaslongbeendiscussed,but was mostly a theoretical discussion untilrecently,sincequantifyingtheGHGemissionsfromprivatehouseholdsisverychallenging. It was considered that the costofsuchquantificationwouldbetoohigh,andoutweighpotentialbenefitsofaninclusion.However,withtherollingoutofsmart meters and the potentialities behind bigdata,itshouldsoonbepossibletoassess households’ energy consumption morepreciselyandcontinuously,andtorelate the consumption to the primary energysource.WiththisinformationitwillbecomepossibletoquantifyrelatedGHG emissions and to calculate the EU allowances required by each individual energy consumer.
Another key point relates to where in thevaluechaindiffuseemissionscanbequantifiedandintegratedintheETS?At which stage is monitoring and
verificationofemissionseasiestand themostcost-efficient?
InCalifornia,forinstance,theARB(AirResource Board) Emissions Trading Programcovers85%ofCalifornia’sGHGemissions,andestablishesapricesignalneededtodrivelong-terminvestmentincleanerfuelsandmoreefficientuseofenergy.Coverageofdiffuseemissionsis achieved by actions targeting energy suppliersandnotend-usersdirectly.Itstarted in 2013 with electricity generators andlargeindustrialfacilitiesandhasincludeddistributorsoftransportation,naturalgas,andotherfuelssince2015.177
5.2. Introduce a carbon tax
Taxes levied on the carbon content of fuels (carbon taxes), could complement the ETS by:• setting a minimum carbon price if it is
too low on the ETS market; and/or• covering GHG emissions not included in
the ETS.
A carbon tax could contribute to reaching asufficientlevelofincentivetotrigger
Figure 28: EU GHG Emissions by EU ETS and non-ETS sectors
GHG emissions in non-ETS sectors
GHG emissions in ETS sectors
55%45%

Energy Efficiency in Europe | The levers to deliver the potential.
63
178Platts,EuropeanGasDailyVolume20/ Issue 215 / November 5, 2015: https://www.platts.com/IM.Platts.Content/ProductsServices/Products/eurogasdaily.pdf
179TheWorldBank,Sweden:DecouplingGDP growth from CO2 emissions is possible,http://blogs.worldbank.org/climatechange/sweden-decoupling-gdp-growth-co2-emissions-possible
180 CPL, Sweden: Decoupling GDP growth from CO2 emissions is possible http://www.carbonpricingleadership.org/news/2015/5/24/sweden-decoupling-gdp-growth-from-co2-emissions-is-possible
fuelswitchingandbehaviouralchange.Additionally,itismuchmorestablethanan emission market and can provide the industrialandfinancialsectorwithmorevisibility.
Several European countries have already enactedacarbontaxincludingDenmark,Finland,Ireland,theNetherlands,Norway,Slovenia,Sweden,SwitzerlandandtheUK.
Finlandwasthefirstcountrytoinstituteacarbontaxin1990.InFinland,energytaxesareplacedonelectricity,coal,naturalgas,fuelpeat,talloilandliquidfuels;overalldutyratesarecomposedofthreecategories:anenergycontenttax,acarbondioxidetaxandastrategicstockpilefee.Thecarbontaxcanreachsignificantlevels:forinstance,fornaturalgasitamountstoEUR8.71/MWh,almost50%ofEuropeanday-aheadpricesinNovember2015178.
JustoneyearafterFinland,Swedenintroducedacarbontaxin1991,asacomplementtotheexistingsystemofenergy taxes. The CO2 tax was increased stepwisefromEUR29pertonneofCO2in1991toEUR125in2014forhouseholds and services179. The carbon taxiscoordinatedwiththeEUETS,sothatindustrialinstallationswhicharesubjecttotheEUETSarenotsubjecttotheCO2 tax.180 The revenues from Sweden’s carbon tax in Sweden are used to finance a reduction in income tax rates; this made public acceptance easier. This useofthecarbontaxrevenuestoreduceother distorting taxes (such as taxes on labour)areagoodexampleofthe“doubledividend hypothesis” which claims that increased taxes on polluting activities can yieldtwokindsofbenefits.Thefirstbenefitisanimprovementinthequalityoftheenvironment,andthesecondoneisanimprovementineconomicefficiency,sinceenvironmental tax revenues are used to reduce other taxes such as income taxes which distort labour supply and saving decisions.
TheUKElectricityMarketReformconsultation introduced a Carbon Price Support(CPS)mechanismfrom1April
2013todriveinvestmentsinlow-carbonenergies.Thecarbonfloorpricedoubledin2015from£9.54to£18.08pertonneofCO2,increasingthecostofcarbonforUKpowerplantsto£23pertonne,whenEU’sEUA were added (comparedtoEUR6fortheEUEUAinMay2016).
InFrance,PresidentFrançoisHollandeannounced in April 2016 that he intends implementingasimilarcarbonfloorpriceforpowerproduction,targetingapriceofaroundEUR30/tCO2eq.
Italy introduced a carbon tax provision withLawn.23March112014,article15.However,thisprovisionhasnotbeenappliedduetoitscorrelationwithDirective2003/96/ECandwaslaterrepealed.FollowingarecommendationreceivedfromtheEuropeanCouncilinMay2015,Italyshall implement the relevant measures in ordertointroduceafunctionalcarbontax.A carbon tax should be designed in such a way that it is coordinated with the EU ETS and include as many emissions as possible such as diffuse emissions not currently covered by the ETS.
5.3. White certificates as a specific market instrument for energy efficiency
White certificates are another effective way of stimulating energy efficiency initiatives through price signals. Whitecertificates,or“EnergyEfficiencyCertificates”(EEC),refertoatradableinstrument issued by an authorised body provingend-useenergysavingsthroughenergyefficiencyimprovementinitiativesandprojects.Eachcertificateisuniqueandtraceable,andprovidesarightoveracertainamountofadditionalenergysavings,guaranteeingthatthesesavingshavenotbeenaccountedforsomewhereelse.Thesecertificatescanbetradedonspecificmarkets.
A white certificate thus directly links energy savings to a market value. Such schemes were introduced in Great Britainin2002,inItalyin2005andinFrance in 2006.

Energy Efficiency in Europe | The levers to deliver the potential.
64
181Atee(2015),SnapshotofEnergyEfficiencyObligations schemes in Europe: main characteristics and main questions http://atee.fr/sites/default/files/1-snapshot_of_energy_efficiency_obligations_schemes_in_europe_27-5-2015.pdf
182Thesecertificatesarequantifiedwiththeartificialunit“kwhCUMAC”Cumacstemsfrom the combination of the words cumulé and actualisé (cumulated and updated)), lifetimecumulateddiscountedfinalenergysavings.
183Atee(2015),SnapshotofEnergyEfficiencyObligations schemes in Europe: main characteristics and main questions http://atee.fr/sites/default/files/1-snapshot_of_energy_efficiency_obligations_schemes_in_europe_27-5-2015.pdf
The French system is based on tradable certificateswhichbylawaredefinedas“negotiable moveable property”182. The scheme has been in spurring actions in theresidentialandservicesectors,butthe py private actors are still reluctant toinvestinenergyefficiencymeasures,especiallyinthecontextoflowenergyprices183.Akeysuccessofthisschemehas been to encourage strongly energy providers to promote energy savings amongtheircustomers.Nonetheless,estimationsofenergysavingswereoftenverygenerous,leadingtoanexcessofwhitecertificateswhencomparedtorealenergysavings.Asaconsequence,their prices decreased and the number ofactionsundertakentogaincertificateswassignificantlyreducedinearly2016ascompared to previous years.
Italyupdateditslegislativeframeworkin2012withtheMinisterialDecree28December2012.Thescheme,similartotheFrenchsystem,setsquantitativegoalsforelectricityandgasoperatorswithmorethan50,000finalclientswithreferencetotheperiod2013–2016.Respectively,theoperatorsmustfulfiltheissuanceof16.23and13.29millioncertificatesintheaforementionedperiod.
White certificates have proved to be a potentially efficient means to push forward energy savings in several European countries and should be further developed and disseminated to reach the ambitious 2020 and 2030 energy efficiency targets.
Figure 29: EEC schemes in Europe181
France
Ireland
UnitedKingdom
Spain
Italy
Luxembourg
Denmark
AustriaSloveniaCroatia
Bulgaria
Poland
Lithuania
Latvia
Estonia
In place for more than 7 years
In place for less than 3 years
In place for more than 3 years
To be starting soon Still under discussion

Energy Efficiency in Europe | The levers to deliver the potential.
65
Higher carbon prices would contribute towards making energy efficiency measures more economically attractive. A reform of the EU ETS was recently decided but will probably not be sufficient to solve all the current difficulties of the ETS. Further action is needed to set price signals at a level that really induce actors to invest in energy efficiency:
• Make sure that the long-term reform of the ETS, currently under discussion, is ambitious enough and does not lead to over-allocation of CO2 allowances; this implies, inter alia, when calculating the future allocations of EU allowances, taking all the energy and climate policy measures implemented at EU and national levels into account (especially thosefavouringlow-carbonenergiesandenergyefficiencysincetheyhaveasignificantimpactonfutureGHGemissions);
• Implement a carbon tax, similar to UK’s carbon floor price, to complement the ETS for as long as the CO2 price set by the EU ETS is not high enough;
• Integrate diffuse emissions into these price setting mechanisms as much as possible; this can be either be done by integrating more sectors into the ETS (buildings, road transport, etc.) or by implementing ambitious carbon taxes targeting diffuse emissions.
While the EU ETS and carbon taxes target GHG emissions, other market-based mechanisms, such as white certificates, target energy savings directly;
• Quantification standards to quantify energy savings should be implemented to avoid unrealistic energy saving calculations;
• Such schemes should be harmonised throughout the EU to create a bigger and more efficient white certificate market.

6. Facilitatefinancingofenergyefficiencymeasures
Energy Efficiency in Europe | The levers to deliver the potential.
66

184 European Commission, Financing energy efficiency,availableat:https://ec.europa.eu/energy/en/topics/energy-efficiency/financing-energy-efficiency
185 European Commission (2016), Horizon 2020,WorkProgramme2016-2017,10.Secure,CleanandEfficientEnergy,available at: http://ec.europa.eu/research/participants/data/ref/h2020/wp/2016_2017/main/h2020-wp1617-energy_en.pdf
FacilitatingtheaccesstoenergyefficiencyfinancingneedstobecomeakeypriorityattheEUandMemberStatelevel,andasetofkeyactionsneedstobetakentogetontracktomeettheEU’slong-termtargets.
Sincevariousbarriers(longpaybackperiod,uncertaintyaboutenergyprices,lackofrelevantandunderstandableinformationforinvestors,etc.)areunderminingtheattractivenessfortraditionalinvestorsoffinancingenergyefficiencymeasures,anefficientfinancingframeworkneedsto be developed that ensures an optimal interplay between public and private actors.
Public funds alone cannot finance all necessary energy efficiency measures.
The public sector needs to act as a catalysts, boosting private financing to close the investment gap.
6.1. Ramp up public funding
Many European funding schemes exist, but it will not be enough
The EC estimates that the investments needed to meet the EU’s 2020 energy efficiency targets could add up to EUR 100 billion per year184, corresponding to the annual GDP of Slovakia. TheEUisfundingenergyefficiencythroughseveralEuropeanschemes(ESIF,Horizon2020,PDA,EEEF,PF4EE,etc.).Thesefivemajoronesarepresentedbelow:
Energy Efficiency in Europe | The levers to deliver the potential.
67
Initiative Description Funds
European Structural & Investment Funds (ESIF, created in 2013)
Horizon 2020 Programme
TheEuropeanstructuralandinvestmentfunds(ESIFs) are the EU’s main investment policy tool.SixmainfundsworktogethertosupporteconomicdevelopmentacrossallEUcountries,inlinewiththeobjectivesoftheEurope2020strategy:•EuropeanRegionalDevelopmentFund(ERDF)• European Social Fund (ESF)• Cohesion Fund (CF)•EuropeanAgriculturalFundforRuralDevelopment(EAFRD)
• European Maritime and Fisheries Fund (EMFF)• Youth Employment Initiative (YEI)
Horizon2020(successoroftheEC’sFP7programme)isthemajorEUResearchandInnovationprogrammefortheyears2014-2020 aiming to support and encourage research in the European Research Area(ERA).ItisthefinancialinstrumentimplementingtheInnovationUnion,aEurope2020flagshipinitiativeaimedatsecuringEurope’s global competitiveness.
EUR454billionfor2014-2020,ofwhichEUR45billion(10%)are assigned to support the shifttowardsalow-carboneconomy.In total EUR 17.6 billion have been allocated to energy efficiency (incl. EUR 13.3 billion, dedicated to energy efficiency improvements in public and residential buildings), i.e. around EUR 2.5 billion per year.
In total EUR 80 billion over 7 years (2014 to 2020). EUR 674 millionisfor’Secure,CleanandEfficientEnergy’in2016.The total budget for the Energy Efficiency calls amounts to EUR 93 million in 2016 and EUR 101 million in 2017185.
Table 2. Major EU funding schemes for energy efficiency

Energy Efficiency in Europe | The levers to deliver the potential.
68
186EuropeanEnergyEfficiencyFund,Annualreport2014,http://www.eeef.lu/tl_files/downloads/Annual_Reports/EEEF_Annual_Report_2014.pdf
Initiative Description Funds
Project Development Assistance (PDA)
European Energy Efficiency Fund (EEEF)
TheEChassetupseveralfacilitiesfundingProjectDevelopmentAssistance(PDAs)withtheaimofsupportingpublicauthoritiesin developing reliable sustainable energy projects.Thesecanbedividedintotwostructures:• European Local ENergy Assistance (ELENA). Theoverallobjectiveistohelplocalandregionalauthoritiesdevelopandkick-startlarge-scalesustainableenergyinvestments.This programme can cover up to 90% ofthetechnicalsupportcosts.Differentsub-projectsexist,managedbyeithertheEuropeanInvestmentBank(EIB),KfW(theGermandevelopmentbank),theCouncilofEuropeDevelopmentBank(CEB)ortheEuropeanBankforReconstructionandDevelopment(EBRD):-EIB-ELENA-KfW-ELENA-CEB-ELENA-EBRD-ELENA.
• MobilisingLocalEnergyInvestments–ProjectDevelopmentAssistance(MLEI-PDA).ThisisoperatedbytheExecutiveAgencyforCompetitiveness and Innovation (EACI) and helpspublicandprivateprojectpromotersdevelop sustainable energy investment projectsrangingfromEUR6milliontoEUR50 million.
ThemainobjectiveoftheEEEFistosupportthe EU’s 2020 goals. It aims to provide market-basedfinancingforpublicenergyefficiencyandrenewableenergyprojectsfortheMemberStates.Thefundprovidestailor-madedebtandequityinstrumentstolocal,regional and sometimes also national public authorities or public or private entities acting ontheirbehalf.Itactsasarisk-sharingfacilitythatworkswithfinancialinstitutionstoprovidefinancetolocalauthoritiesandenergyservicecompanies (ESCOs).
ProjectsrangingfromEUR6million to EUR 50 million. EIB-ELENAalsosupportsprojects>EUR50million.
The allocated budget is part ofH2020andamountstoEUR 8 million.ELENA is funded at EUR 20 million in 2016
EUR 265 million in total (2014-2020).In2014thefundinvested EUR 121 million186.
Table 2. Major EU funding schemes for energy efficiency

Energy Efficiency in Europe | The levers to deliver the potential.
69
187Financementprivépourl’efficacitéénergétique (PF4EE), http://www.eib.org/products/blending/pf4ee/index.htm
188ODYSSEMUREproject,EnergyEfficiencytrends and policies in the Netherlands, 2015, http://www.odyssee-mure.eu/publications/national-reports/energy-efficiency-netherlands.pdf
Initiative Description Funds
Private Finance for Energy Efficiency (PF4EE)
ThePF4EEisajointagreementbetweentheEuropean Investment Bank (EIB) and the EC aiming at addressing the limited access tosuitableandaffordableprivatefinancingforenergyefficiencyinvestments.Itshouldhelp the MS implement their National Energy EfficiencyActionPlans(NEEAPs)orotherprogrammesinlinewithEUDirectivesrelatedtoenergyefficiency.Itstwomainobjectivesare187:• To enhance energy efficiency lending
within European financial institutions;• To increase the availability of debt
financing for energy efficiency investments.
PF4EEismanagedbytheEIBandfundedbytheProgrammefortheEnvironmentandClimateAction(LIFEprogramme,DGClima).Theinstrumentprovidesthreetypesofsupport:1. Aportfolio-basedcreditriskprotection(Risk
Sharing Facility);2. Long-termfinancingfromtheEIB(EIBLoanforEnergyEfficiency);
3. Expertsupportforfinancialintermediaries(Expert Support Facility).
The programme has committed EUR 80 million for2014-17anticipating a6-foldleverageeffect (EUR 480 million).
The amounts attributed to energy efficiency under these schemes are far from being enough to meet the estimated needs: European funds explicitly targeted towards energy efficiency amount to only EUR 3 billion per year (3% of the required sum). ThemaincomponentcomesfromtheEuropean Structural & Investment Funds (ESIF),createdin2013asasuccessortoearlierfunds,withEUR17.6billionallocatedtoenergyefficiencyovertheperiod2014-2020(and,morewidelyEUR45billionassignedtosupporttheshifttowardsalow-carboneconomy).Severalfunds,dedicatedtoenergyefficiencyexist(EEEFandPF4EE),buttheirtotalamountismuchlower(EUR265millionfor2014-2020andEUR80millionfor2014-17respectively).
National and local funds as a complement to European funds
TheseEuropeanfundsneedtobecomplementedbyfurthernationalfinancingmechanisms.Well-designednationalandlocalfundscanbeakeydriverofenergyefficiencyinvestments.
TheNetherlands,forinstance,implementedarevolvingfundforenergyefficiencyinhouseholdsin2013,withEUR150millionofpublicandEUR450millionofprivatefinance188.Arevolvingfundhasthe characteristic that the expenditures ofthefundwillbereturnedtothefundintheformofinterestsandrepaymentsovertime.
Table 2. Major EU funding schemes for energy efficiency

Energy Efficiency in Europe | The levers to deliver the potential.
70
189OECD(2015)–GreenInvestmentBanks,available at https://issuu.com/oecd.publishing/docs/green-investment-banks-policy-persp/2?e=3055080/31715374
Asanotherexample,France’sDepositsandConsignmentsFund(CDC)launchedthe5Efund(Energyefficiencyandenvironmentalfootprintofcompanies)inJuly2014.Thisprogramme aims to invest EUR 600 million over5years,targetingindustrialprojects,mainlyonFrenchterritory,oftheorderofEUR2-50million.Theprojectsneedtoenvisage reducing greenhouse gases or energyconsumptionbyatleast20%,basedonproventechnologiessuchasefficientenergy generation or heat recovery.
Some local authorities have also developed their own funds,inadditiontoEuropean and national ones. An example ofsuchalocalinitiativecanbefoundinthePicardyrenovationpassinFrance.In2013,thePicardyregionadaptedaclimate-air-energyscheme,estimatingthenumberofdwellingsthatneedtoberenovatedeachyearat10,000.Today,thenumberofrenovationscompletedisaround2,000peryear,stillfarfromwhatisrequired.From2006-2010,around10,000zero-interestloansweregrantedtofamilieswhowantedtoimprovetheenergyefficiencyoftheirhomes.Overall,thismechanismtriggeredtotalexpendituresofEUR120million.
Public finance as a stimulus to private finance
Public finance will not be able to provide enough funding to cover all necessary investments. For this reason there is an urgent need to enhance private energy efficiency investments in the EU. This can be done by setting up proper incentive schemes (for instance through green investment banks, development banks, etc.) and targeted use of public funds to get the best leverage effect.
Inrecentyears,GreenInvestmentBanks(GIBs)haveevolvedsuccessfullytotackletheproblemofinsufficientprivatefinancinginlow-carboninvestment.GIBsarepublicinstitutions that use capital to leverage private investments in sustainable and ‘green’infrastructure,suchasenergyefficiency.SinceGIBscanhelpmeetdomestic emission reduction targets and send a strong signal to private investors to engageinlow-carboninvestments,theirdevelopment should be strongly supported by policy makers.
Figure 30: Green investment banks around the world 189

Energy Efficiency in Europe | The levers to deliver the potential.
71
190KfW(2013),MobilizingPrivateSectorInvestment: KfW Case Studies and Conclusions, https://www.oecd.org/env/cc/CCXG%20March%202013%20Katrin%20Enting.pdf
191 USD 17 billion, converted using an average exchangerateof1.33USD/EURfortheyear 2014 (http://www.x-rates.com/)
192IEA(2015),EnergyEfficiencyMarketReport2015,p.76,http://www.iea.org/publications/freepublications/publication/MediumTermEnergyefficiencyMarketReport2015.pdf
193TheJointResearchCentre( JRC)istheEuropean Commission’s in-house science service
194JRC(2014),ESCOMarketReport2013,http://iet.jrc.ec.europa.eu/energyefficiency/sites/energyefficiency/files/jrc_89550_the_european_esco_market_report_2013_online.pdf
InGermany,differentgovernmentalandbank programmes such as the Energy EfficiencyProgrammesfromtheGermandevelopmentbankKfWhaveturnedouttobesuccessfulinpromotingenergyefficiencyinvestmentsforhouseholdsandcompanies.In2010,theenergyefficientbuildingprogrammehaddirect programme costs of EUR 1.4 billion, but triggered total investments of EUR 21.3 billion190.In2014,morethanEUR22.6191
billion was invested in building energy efficiencythroughtheseprogrammes,ofwhichtwothirdswentintoresidentialbuildings192.
6.2. Promote innovative financing mechanisms
Sinceenergyefficiencyprojectsusuallyhave a relatively long and uncertain return oninvestment,new and innovative financing structures need to be developed to encourage investments.
Boosting ESCOs and EPCs
Energy Service Companies (ESCOs) use specific contracts where the remuneration is directly tied to the energy savings generated at their clients’.Suchschemesenableenergy-
userstoinvestinenergyefficiencymeasureswithoutpayingforthewholeinvestment. What distinguishes ESCOs fromtraditionalenergyconsultantsorequipment suppliers is their capacity tofinanceorarrangefinancingfortheoperationofenergysavingmeasures.
InitslatestESCOmarketreport(2014),theJRC193 concludes that the average European ESCOmarketisimproving,butthatmarketsarefarfromreachingtheirpotential.RelativelymaturemarketscanbefoundinAustria,theCzechRepublic,France,andGermany.MarketsinSpainandDenmarkare on the rise194.
ESCOs sometimes implement relatively innovative financing schemes, such as energy performance contracting (EPC). AnEPCmakesitpossibletofundenergyupgradesfromcostreductions.Undersuchacontract,anexternalorganisation(mostlyanESCO)implementsanenergyefficiencyprojectandusesthestreamofincomefromthereductioninenergyconsumptiontorepaytheup-frontcostsoftheproject.Theenergy-usingcompanyonlyreceivespaymentifthemeasuresimplementeddeliver the expected energy savings. The FigurebelowexplainstheconceptofEPCfinancing.
Figure 31: EPC scheme

Energy Efficiency in Europe | The levers to deliver the potential.
72
195 Climate Bonds (2016), 2015 Green Bond MarketRoundup,availableat:http://www.climatebonds.net/files/files/2015%20GB%20Market%20Roundup%2003A.pdf
196EngieissuedEUR2.5billiongreenbondsin 2014.
197 Climate Bonds Initiative, 2015 Green BondMarketRoundup,http://www.climatebonds.net/files/files/2015%20GB%20Market%20Roundup%2003A.pdf
EPCshavealongertraditionintheUS,buttheir popularity is increasing in the EU.
Despite positive developments in the last few years, EPC markets still face some severe barriers in Europe. The most important relate to regulation and the lack of support from governments as well as policy uncertainties and structural barriers. Structural barriers canbelinkedtoinsufficientinformationorthecomplexityoftheoverallconcept.JRC’ssurveyalsofoundthatthereissignificantlackoftrustinthewholeESCOindustry.
As EPCs can be an efficient way to contribute to the European energy efficiency targets in 2020, regulation should be adapted to facilitate the development of ESCOs and prospective clients should be provided with better information about different kinds of contract.
Green Bonds need a better policy framework
Green bonds are bonds which are usually issued by private companies, local or regional authorities or international
organisations for the development of projects with environmental benefits. While 46% of the proceeds from Green Bonds are used to support renewable energy, only 20% go into energy efficiency195.
Until2013,thegreenbondmarketwasdominated by multilateral development banks,suchastheWorldBankandtheInternational Finance Corporation (IFC). However, the green bond market has gained momentum in the last years with more and more corporates getting involved. Corporate green bond issues fromcompanieslikeElectricitédeFrance(EDF),Engie196,IberdrolaorToyotaFinancehave been growing very rapidly.
AccordingtotheClimateBondsInitiative,USD37billionofbondslabelledasgreenwereoutstandingin2014,morethanthreetimestheamountin2013(USD11.5billion)197.In2015,thisfigureincreasedbyanother13%,reachingalmostUSD42billionworldwide(Figure32).AlmosthalfthegreenbondsareissuedinEurope(USD18.4billionin2015),followedbytheUSwith25%(USD10.5billion).
Table 3: Top 5 largest green bonds by value, 2015192 Figure 32: Annual Green Bond Issuance (USD bn)192
Issuer Value
1. KfW $1.66bn
2. ING Bank $1.3bn
3. ElectricitéDeFrance(EDF) $1.25bn
4. Toyota Finance $1.25bn
5. TenneT Holding BV $1.12bnw
45
40
35
30
25
20
15
10
5
0
2.6
11.5
3741.8
2012 2013 2014 2015

Energy Efficiency in Europe | The levers to deliver the potential.
73
198Moody’s,https://www.moodys.com/research/Moodys-Green-bond-issuance-could-exceed-50-billion-in-2016--PR_343234
199 Pialot D., (2016), La France peut-elle devenirunleaderdelafinanceverte?, http://www.latribune.fr/entreprises-finance/industrie/energie-environnement/la-france-peut-elle-devenir-un-leader-de-la-finance-verte-568594.html
200 European Commission, What is an SME?,http://ec.europa.eu/growth/smes/business-friendly-environment/sme-definition/index_en.htm
201 European Commission, Eurobarometer survey:SMEsareimportantforasmoothtransition to a greener economy, http://europa.eu/rapid/press-release_MEMO-12-218_en.htm
202EBRD,http://seff.ebrd.com/about-seff.html
203EBRD(2015),Mouldedplasticmanufacturerbenefitsfromenergyefficiency,http://seff.ebrd.com/case-study/plastic-moulding-company.html
204EEA(2013)-Achievingenergyefficiencythrough behaviour change: what does ittake?http://www.eea.europa.eu/publications/achieving-energy-efficiency-through-behaviour
205 This programme was recently ended and a successor programme has been implemented.
AttheCOP21inDecember2015,27globalinvestors(assetowners,investment managers and individual funds)representingUSD11.2trillionofassets signed the Paris Green Bonds Statement,supportingthegreenbondmarket. According to Moody’s senior Vice President,HenryShilling,thetrendinthemarket will continue in 2016: "Green bonds issuance could exceed $50 billion by a significantmargin”198.IntheaftermathofCOP21,thedevelopmentofgreenbondsduringthefirstquarterof2016wasthreetimes quicker than over the same period in 2015.199
Despitethispositivedevelopmentinrecentyears,thegreenbondmarketstillfacesvariousbarriers,suchaslowliquidity,lackofbenchmarkindicatorsordependencyon external guarantees. Standardising the issuance process and technical aspects related to environmental performance measurement could increase reliability and trigger further private investment. This should be accompanied by better reporting processes and governance, and in particular third party verification, increasing credibility.
6.3. Ease access to energy efficiency funding for SMEs
Policy makers should also turn their attention to small and medium-sized enterprises (SMEs) enabling them to obtain easy access to energy efficiency financing, inter alia by aggregating smaller energy efficiency projects until they reach a critical size. This can be done with the help of local or regional authorities or other intermediates with a well-established network.
SMEsrepresent99%ofallcompaniesinthe EU200.However,only64%ofallSMEsare taking action to save energy compared to82%oflargecompanies201.Oneofthereasonsforthisdiscrepancyliesinthefactthataccessingenergyefficiencyfinancerequiresparticularknowledgeandexpertise.AccesstopublicfundscanbeparticularlydifficultforSMEsduetoavarietyofbarriers,suchasprojectsize
considerations,hightransactioncostsorsimply too much red tape.
Onesuccessfulexampleforamodelthatcombines access to capital with business information,technicalsupportandcapacitybuildingforSMEsistheSustainableEnergyFinancing Facility (SEFF) created by the EuropeanBankforReconstructionandDevelopment(EBRD)in2006.Since2006,theEBRDhadprovidedoverEUR3billioninsustainableenergyfinancing,involvingmorethan104financialinstitutionsandreaching75,000clientsin22countries202. TheEBRDusestheSEFFtoextendcreditlinestoregionalandlocalfinancialinstitutions,suchasbanksormicrofinanceinstitutionsinordertosupportspecificsustainableenergyprojects.Asasecondstep,thepartnersofEBRDon-lendthesefundstotheirclients,ofwhichmanyareSMEs.203
Project grouping or collective solutions bringing together several SMEs should be used to facilitate fund raising.
Onegoodexampleofacollectivesolutionis the Norwegian Industrial Energy EfficiencyNetwork(IEEN)whichwasestablishedin1999bytheMinistryofPetroleum and Energy in Norway with the objectiveofencouragingenergyefficiencymeasures204.Around900companies,ofwhicharoundtwothirdswereSMEs,joinedthe programme. The companies had access tograntsfromthegovernmenttocoverasignificantpartoftheircostsrelatedtoenergyauditsorenergyefficiencymeasures.Aweb-basedbenchmarkingtoolhelped the companies to compare their performancetotheotherparticipantsandtodetectinefficiencies.205
Aggregationofprojectscanbeachievedthroughpoolingmechanisms,ifonesinglecompanyhasseveralprojectsorthroughbundling mechanisms when comparable projectsareundertakenbyseveralcompanies.

Energy Efficiency in Europe | The levers to deliver the potential.
74
FacilitatingtheaccesstoenergyefficiencyfinancingneedstobecomeakeypriorityattheEUandMemberStatelevel,andasetofkeyactionsneedstobetakentogetontracktomeettheEU’slong-termtargets.Sincevariousbarriers(longpaybackperiod,uncertaintyaboutenergypricesandlackofrelevantandunderstandableinformationforinvestors)areunderminingtheattractivenesstotraditionalinvestorsoffinancingenergyefficiencymeasures,itshouldbepartlyuptothepublicsectortogatherspecificfundingforenergyefficiency.TheamountthatneedstobeinvestedeachyeartoachieveEurope’s2020energyefficiencytargets is EUR 100 billion206,whilecurrenttotalannualinvestmentbypublicbanksisestimatedatEUR15-20billiononly207.
• Ramping up funds and facilitating the access to energy efficiency financing needs to become a key priority at the EU and at Member State level.
Nonetheless,thesepublicfundsshouldnotaimatfinancingallenergyefficiencymeasuresbutatcreatingamomentum,stimulatingprivatefinancingtoclosetheinvestment gap.
• Tailor-cut solutions provided by closer public-private collaborations need to be developed to drive broader investments in energy efficiency.
Innovative financing mechanisms are currently being developed: energy performance contracting schemes (EPC) offered by Energy Service Companies (ESCO), green bonds, etc.
• Such innovative mechanisms need to be put in place or promoted to gain momentum throughout Europe.
• Last but not least, SMEs deserve particular attention: specific support needs to be offered, among others, through intelligent project pooling structures and bundling mechanisms.
206 European Commission, Financing energy efficiency,https://ec.europa.eu/energy/en/topics/energy-efficiency/financing-energy-efficiency
207DIW(2013),FinancingofEnergyEfficiency:InfluencesonEuropeanPublicBanks’Actions and Ways Forward, http://www.diw.de/documents/publikationen/73/diw_01.c.422405.de/hudson_financing.pdf

Energy Efficiency in Europe | How to capture its full potential?
75
Bibliography

Energy Efficiency in Europe | The levers to deliver the potential.
76
ACEEE,AmericanCouncilforanEnergyEfficientEconomy(2013),“Overcoming Market Barriers and Using Market Forces to Advance EnergyEfficiency”,http://aceee.org/research-report/e136
Atee(2015),SnapshotofEnergyEfficiencyObligationsschemesinEurope: main characteristics and main questions http://atee.fr/sites/default/files/1-snapshot_of_energy_efficiency_obligations_schemes_in_europe_27-5-2015.pdf
BAFA,FederalOfficeforEconomicAffairsandExportControl, http://www.bafa.de/bafa/en/index.html
BergaentzléC.,ClastresC.,KhalfallahH.,(2014),Demand-sidemanagement and European environmental and energy goals: An optimal complementary approach
BerkelayLAB(2016),ResidentialPropertyAssessedCleanEnergyinCalifornia,https://emp.lbl.gov/sites/all/files/lbnl-1003964.pdf
BMWi(MinistryforEconomicAffairsandEnergy):VierterMonitoring-BerichtzurEnergiewende(2015),http://www.bmwi.de/BMWi/Redaktion/PDF/V/vierter-monitoring-bericht-energie-der-zukunft,property=pdf,bereich=bmwi2012,sprache=de,rwb=true.pdf
BPIE(2014),EnergyPerformanceCertificatesacrosstheEU, http://bpie.eu/uploads/lib/document/attachment/81/BPIE_Energy_Performance_Certificates_EU_mapping_-_2014.pdf
BPIE(2014),RenovationstrategiesofselectedEUcountries,AstatusreportoncompliancewithArticle4oftheEnergyEfficiencyDirective,2014,http://bpie.eu/wp-content/uploads/2015/10/Renovation-Strategies-EU-BPIE-2014.pdf
BPIE(2014),InvestingintheEuropeanbuildingsinfrastructure– AnopportunityfortheEU’snewinvestmentpackage http://bpie.eu/wp-content/uploads/2015/11/Investing_in_Europe_s_buildings_infrastructure_BPIE_Discussion_Paper.pdf
BPIE(2015),Dobuildingrenovationstrategiesliveuptothename?,http://bpie.eu/wp-content/uploads/2015/11/Do-building-renovation-strategies-live-up-to-the-name.pdf
Cagno,E,WorrellE.,TrianniA.,PuglieseG.,(2012),Anovelapproachforbarrierstoindustrialenergyefficiency
CaliforniaEnvironmentalProtectionAgency(2015),OverviewofARBEmissionsTradingProgram,http://www.arb.ca.gov/cc/capandtrade/guidance/cap_trade_overview.pdf
CarbonBrief(2014),IEA:Themarginalcostoftwodegrees, http://www.carbonbrief.org/iea-the-marginal-cost-of-two-degrees
CarbonPricingLeadership(2015),Sweden:DecouplingGDPgrowthfromCO2emissionsispossible,http://www.carbonpricingleadership.org/news/2015/5/24/sweden-decoupling-gdp-growth-from-co2-emissions-is-possible
ClimateBondsInitiative(2016),2015GreenBondMarketRoundup,http://www.climatebonds.net/files/files/2015%20GB%20Market%20Roundup%2003A.pdf
CounciloftheEuropeanUnion7224/1/07,REV1., http://register.consilium.europa.eu/doc/srv?l=EN&f=ST%207224%202007%20REV%201
Darby,S.(2006),Theeffectivenessoffeedbackonenergyconsumption.AreviewforDEFRAoftheliteratureonmetering,billinganddirectdisplays.Ox-fordUniversity,http://www.eci.ox.ac.uk/research/energy/downloads/smart-metering-report.pdf
Deloitte(2015),EnergymarketreforminEurope, http://www2.deloitte.com/ru/en/pages/energy-and-resources/articles/energy-market-reform-europe.html
Dena(2014),IntroductionofsmartmetersinGermany, http://www.dena.de/fileadmin/user_upload/Projekte/Energiesysteme/Dokumente/140709_dena-Smart-Meter-Studie_Endbericht_final.pdf
DIW(2013),FinancingofEnergyEfficiency:InfluencesonEuropeanPublicBanks’ActionsandWaysForward,https://www.diw.de/documents/publikationen/73/diw_01.c.422405.de/hudson_financing.pdf
EBRDSEFF:AboutSEFF,http://seff.ebrd.com/about-seff.html, accessed on 23/03/2016
EBRDSEFF(2015),Mouldedplasticmanufacturerbenefitsfromenergyefficiency,http://seff.ebrd.com/case-study/plastic-moulding-company.html, accessed on 23/03/2016
Ecofys(2014),EvaluationoftheEnergyLabellingDirectiveandspecificaspectsoftheEcodesignDirective:BackgroundreportI:Literaturereview,December2013,p.9; http://www.energylabelevaluation.eu/tmce/Final_technical_report-Evaluation_ELD_ED_June_2014.pdf
Ecofys(2015),PublicConsultationontheEvaluationoftheEPBD,http://bpie.eu/wp-content/uploads/2015/12/Task2_final-report_Public-Consultation-on-the-Evaluation-of-the-EPBD.pdf
EEA(2013),Achievingenergyefficiencythroughbehaviourchange:what does it take? http://www.eea.europa.eu/publications/achieving-energy-efficiency-through-behaviour/at_download/file
EEA(2015),TrendsandprojectionsinEurope2015-TrackingprogresstowardsEurope'sclimateandenergytargets,EEAreport,No4/2015,http://www.eea.europa.eu/publications/trends-and-projections-in-europe-2015#tab-data-visualisations
EuropeanEnergyEfficiencyFund(2014),Annualreport2014, http://www.eeef.lu/tl_files/downloads/Annual_Reports/EEEF_Annual_Report_2014.pdf
EIB:PrivateFinanceforEnergyEfficiency, http://www.eib.org/products/blending/pf4ee/index.htm
Enerdata/ODYSSEEMURE(2015),EnergyEfficiencyTrendsforhouseholdsintheEU,http://www.odyssee-mure.eu/publications/efficiency-by-sector/household/household-eu.pdf
Enerdata,GlobalEnergyStatisticalYearbook2015,Totalenergyconsumption,https://yearbook.enerdata.net/energy-consumption-data.html
EnergyAnalysis(2015),ImpactofFeedbackaboutenergyconsumption,http://www.ea-energianalyse.dk/reports/1517_impact_of_feedback_about_energy_consumption.pdf
Energy.gov,Property-AssessedCleanEnergyPrograms,http://energy.gov/eere/slsc/property-assessed-clean-energy-programs
EuropeanUnionAgencyforNetworkandInformationSecurity(ENISA),https://www.enisa.europa.eu/publications/appropriate-security-measures-for-smart-grids
EuropeanCommission(2015),StateofEnergyUnion,http://eur-lex.europa.eu/legal-content/EN/TXT/PDF/?uri=CELEX:52015DC0572&from=EN
EuropeanCommission(2014),Presentation«EnergyUnionandClimateChangePolicy»,https://ec.europa.eu/priorities/sites/betapolitical/files/energy-union-1-year_en.pdf
EuropeanCommission(2016),AStudyonEnergyEfficiencyinEnterprises:EnergyAuditsandEnergyManagementSystems,https://ec.europa.eu/energy/sites/ener/files/documents/EED-Art8-Implementation-Study_Task12_Report_FINAL-approved.pdf
EuropeanCommission(2015),EnergyUnionPackage[COM(2015)80final], http://eur-lex.europa.eu/legal-content/EN/TXT/?uri=COM%3A2015%3A80%3AFIN
EuropeanCommission(2014),PreparatoryStudybyDeloittetoestablishtheEcodesignWorkingPlan2015-2017,draftreportavailable at: http://www.ecodesign-wp3.eu/

Energy Efficiency in Europe | The levers to deliver the potential.
77
EuropeanCommission(2013),Energyperformancecertificatesin buildings and their impact on transaction prices and rents in selectedEUcountries,https://ec.europa.eu/energy/sites/ener/files/documents/20130619-energy_performance_certificates_in_buildings.pdf
EuropeanCommission,SpeechbyMiguelAriasCañeteonEU’sclimateandenergypoliciesafterCOP21,2016,http://europa.eu/rapid/press-release_SPEECH-16-264_en.htm
EuropeanCommission(2015),ReportfromthecommissiontotheEuropeanParliamentandtheCouncil[COM(2015)574final],http://eur-lex.europa.eu/legal-content/EN/TXT/PDF/?uri=CELEX:52015DC0574&rid=1
EuropeanCommission,Financingenergyefficiency,https://ec.europa.eu/energy/en/topics/energy-efficiency/financing-energy-efficiency
EuropeanCommission(2010),Directive2010/31/EUoftheEuropeanParliamentandoftheCouncilof19May2010ontheenergyperformanceofbuildings,http://eur-lex.europa.eu/legal-content/EN/TXT/PDF/?uri=CELEX:32010L0031&rid=1
EuropeanCommission,ConsultationontheReviewofDirective2012/27/EUonEnergyEfficiency,https://ec.europa.eu/energy/en/consultations/consultation-review-directive-201227eu-energy-efficiency
EuropeanCommission(2012),Directive2012/27/EUoftheEuropeanParliamentandoftheCouncilof25October2012onenergyefficiency,amendingDirectives2009/125/ECand2010/30/EUandrepealingDirectives2004/8/ECand2006/32/EC,http://eur-lex.europa.eu/legal-content/EN/TXT/PDF/?uri=CELEX:32012L0027&rid=1
EuropeanCommission,2030EnergyStrategy,http://ec.europa.eu/energy/en/topics/energy-strategy/2030-energy-strategy
EuropeanCommission(2015),AssessmentoftheprogressmadebyMemberStatestowardsthenationalenergyefficiencytargetsfor2020andtowardstheimplementationoftheEnergyEfficiencyDirective2012/27/EUasrequiredbyArticle24(3)ofEnergyEfficiencyDirective2012/27/EU,[SWD(2015)245final],https://ec.europa.eu/energy/sites/ener/files/documents/1_EEprogress_report.pdf
EuropeanCommission,2030Climateandenergyframework, http://ec.europa.eu/clima/policies/strategies/2030/index_en.htm
EuropeanCommission,StructuralreformoftheEuropeancarbonmarket,http://ec.europa.eu/clima/policies/ets/reform/index_en.htm
EuropeanCommission(2016),AnEUStrategyonHeatingandCooling,[COM(2016)15final],https://ec.europa.eu/energy/sites/ener/files/documents/1_EN_ACT_part1_v14.pdf
EuropeanCommission(2016),H2020,WorkProgramme2016-2017,Secure,CleanandEfficientEnergy,http://ec.europa.eu/research/participants/data/ref/h2020/wp/2016_2017/main/h2020-wp1617-energy_en.pdf
European Commission: What is an SME? http://ec.europa.eu/growth/smes/business-friendly-environment/sme-definition/index_en.htm
European Commission: Eurobarometer survey: SMEs are important forasmoothtransitiontoagreenereconomy,http://europa.eu/rapid/press-release_MEMO-12-218_en.htm
EuropeanCommission(2014),Cost-benefitanalyses&stateofplayofsmartmeteringdeploymentintheEU-27,[COM(2014)356final,SWD(2014)188final],http://eur-lex.europa.eu/legal-content/EN/TXT/PDF/?uri=CELEX:52014SC0189&rid=1
EuropeanCommission(2013),Article8:Energyauditsandenergymanagementsystems,http://eur-lex.europa.eu/legal-content/EN/TXT/PDF/?uri=CELEX:52013SC0447&rid=1
EuropeanCommission(2013),Deliveringtheinternalelectricitymarketandmakingthemostofpublicintervention,http://ec.europa.eu/transparency/regdoc/rep/3/2013/EN/3-2013-7243-EN-F1-1.PDF
EuropeanCommission(2009),Directive2009/125/ECof21October2009establishingaframeworkforthesettingofecodesignrequirementsforenergy-relatedproducts,http://eur-lex.europa.eu/legal-content/EN/TXT/PDF/?uri=CELEX:32009L0125&rid=1
EuropeanCommission(2010),Directive2010/30/EUoftheEuropeanParliamentandoftheCouncilof19May2010ontheindicationbylabellingandstandardproductinformationoftheconsumptionofenergyandotherresourcesbyenergy-relatedproducts,http://env-ngo.eup-network.de/fileadmin/user_upload/Hintergrund/Labelling/Directive_2010_30_EU_en.pdf
EuropeanCommission:Energyefficientproducts,http://ec.europa.eu/energy/en/topics/energy-efficiency/energy-efficient-products
EuropeanCommission(2015),ImpactAssessment,[SWD(2015)139final],http://eur-lex.europa.eu/legal-content/EN/TXT/PDF/?uri=CELEX:52015SC0139&rid=1
EuropeanCommission:STANDARDISATION-Mandates, http://ec.europa.eu/growth/tools-databases/mandates/index.cfm?fuseaction=search.detail&id=465
EuropeanCommissionJRC-EUCAR-CONCAWEWelltowheelanalysis(version4a),http://iet.jrc.ec.europa.eu/about-jec/downloads
EuropeanCommissionJRC(2014),TheEuropeanESCOMarketReport2013,http://iet.jrc.ec.europa.eu/energyefficiency/sites/energyefficiency/files/jrc_89550_the_european_esco_market_report_2013_online.pdf
European Commission JRC: Smart Metering deployment in the EuropeanUnion,http://ses.jrc.ec.europa.eu/smart-metering-deployment-european-union
EuropeanEnergyEfficiencyFund(2016),Annualreport2015
Eurostat:EurostatDatabase(nrg_100a),EU28consumption, http://ec.europa.eu/eurostat/web/products-datasets/-/nrg_100a
Eurostat:EurostatDatabase(nrg_pc_204),Energystatistics-electricitypricesfordomesticandindustrialconsumers,pricecomponents,http://ec.europa.eu/eurostat/cache/metadata/EN/nrg_pc_204_esms.htm
Eurostat:EurostatDatabase(env_air_gge),GreenhouseGasEmissions,http://ec.europa.eu/eurostat/web/products-datasets/-/env_air_gge
FrontierEconomics(2015),Energyefficiency–Aninfrastructurepriority, http://www.frontier-economics.com/documents/2015/09/energy-efficiency-infrastructure-priority.pdf
F.Grossbergetal.(2015),GamifiedEnergyEfficiencyPrograms,AmericanCouncilforanEnergyEfficientEconomy, http://challengeforsustainability.org/wp-content/uploads/2015/08/gamified-energy-efficiency.pdf
Fraunhofer(2013),IBPreport,Simulationstudyontheenergysavingpotentialofheatingcontrolsystemfeaturingpresencedetectionandweatherforecasting,http://www.ibp.fraunhofer.de/content/dam/ibp/en/documents/ResearchNews/IM-527_englisch_web.pdf
GOV.UK(2012),EnergyPerformanceCertificate(EPC), https://www.gov.uk/government/uploads/system/uploads/attachment_data/file/49997/1790388.pdf
Honeywell’s website: https://honeywell.com/sites/environment/Produits/Pages/evo-styledevie.aspx

Energy Efficiency in Europe | The levers to deliver the potential.
78
HuberM.Z.andHiltyL.M.(2014),GamificationandSustainableConsumption:OvercomingtheLimitationsofPersuasiveTechnologies,http://www.ifi.uzh.ch/rerg/people/kolpondinos/2014_Huber_Hilty_Gamification_and_Sustainable_Consumption_AAM.pdf
I4CE(2015),CarbonPricing:PerspectivesfortheEUemissionstradingschemeby2030,http://www.i4ce.org/wp-core/wp-content/uploads/2015/12/15-12_10-I4CE_COPEC-side-event.pdf
IEA(2012),WorldEnergyOutlook2012,https://www.iea.org/publications/freepublications/publication/English.pdf
IEA(2015),EnergyEfficiencyMarketReport2015, https://www.iea.org/publications/freepublications/publication/MediumTermEnergyefficiencyMarketReport2015.pdf
IEA,ProgrammeforImprovingEnergyEfficiencyinEnergy-IntensiveIndustries(PFE),http://www.iea.org/policiesandmeasures/pams/sweden/name-22448-en.php
IEA(2015),CapturingtheMultipleBenefitsofEnergyEfficiency,http://www.iea.org/topics/energyefficiency/energyefficiencyiea/multiplebenefitsofenergyefficiency/
IEA(2013),EnergyEfficiencyMarketReport2013–MarketTrendsandMedium-TermProspects,https://www.iea.org/publications/freepublications/publication/EEMR2013_free.pdf
Istabai,https://istabai.com/questions
JoulebugNest,https://community.joulebug.com/products/nest/
KfW(2013),MobilizingPrivateSectorInvestment:KfWCaseStudiesandConclusions,https://www.oecd.org/env/cc/CCXG%20March%202013%20Katrin%20Enting.pdf
LevinsonA.,2015,HowMuchEnergyDoBuildingEnergyCodesReallySave?EvidencefromCaliforniaHouses, http://faculty.georgetown.edu/aml6/pdfs&zips/BuildingCodes.pdf
LockheedMartin(2014),UsingGamificationtoReduceEnergyUse, http://www.lockheedmartin.com/us/news/features/2014/gamification-energy-use.html
MillerC.C.(2013),ForGoogle,aToeholdIntoGoodsforaHome,inTheNewYorkTimes,http://www.nytimes.com/2014/01/14/technology/google-to-buy-nest-labs-for-3-2-billion.html?_r=0
Moody's,Greenbondissuancecouldexceed$50billionin2016,https://www.moodys.com/research/Moodys-Green-bond-issuance-could-exceed-50-billion-in-2016--PR_343234, accessed on 23/03/2016
Nest(2015),WhitePaper“EnergySavingsfromtheNestLearningThermostat:EnergyBillAnalysisResults”,https://nest.com/downloads/press/documents/energy-savings-white-paper.pdf
OECD(2015),GreenInvestmentBanks,https://issuu.com/oecd.publishing/docs/green-investment-banks-policy-persp/2?e=3055080/31715374
ODYSSEE-MURE,ODYSEEMUREdatabase,http://www.measures-odyssee-mure.eu/
ODYSSEE-MURE,Decompositionofprimaryenergyconsumption,http://www.indicators.odyssee-mure.eu/decomposition.html
ODYSSEE-MURE(2015),EnergyEfficiencytrendsandpoliciesintheNetherlands,http://www.odyssee-mure.eu/publications/national-reports/energy-efficiency-netherlands.pdf
ODYSSEE-MURE,EnergyPerformanceCertificates, http://www.odyssee-mure.eu/news/workshops/london/19-Energy-Performance-Certificates.pdf
OPower,https://opower.com/products/digital-engagement/
PialotD.(2016),LaFrancepeut-elledevenirunleaderdelafinanceverte?,http://www.latribune.fr/entreprises-finance/industrie/energie-environnement/la-france-peut-elle-devenir-un-leader-de-la-finance-verte-568594.html
Platts(2015),EuropeanGasDailyVolume20/Issue215/November5,2015: https://www.platts.com/IM.Platts.Content/ProductsServices/Products/eurogasdaily.pdf
PranabBaruah,NicholasEyre,JonathanNorman,PaulGriffin,GeoffreyHammond,2014,Firm-levelPerspectiveofEnergyEfficiencyBarriersandDriversinUKIndustry–IndicationsfromanOnlineSurvey 2014
Ricardo-AEA(2015),StudyevaluatingthenationalpolicymeasuresandmethodologiestoimplementArticle7oftheEnergyEfficiencyDirective,http://rekk.hu/downloads/projects/Final%20Report%20on%20Article%207%20EED.pdf
RolandBerger(2013),Homeautomation–Thenextbigmoveintheutilitiesandtelecomindustries,inthink:act,http://www.rolandberger.fr/media/pdf/Roland_Berger_taC_Home_Automation_20140205.pdf
SchleichJ.(2009),Barrierstoenergyefficiency:Acomparisonacrossthe German commercial and services sector
SEVEn7,ApplianceEnergyCostIndication,http://www.appliance-energy-costs.eu/download-library/appliance-energy-cost-indication
SorrellS.,MallettA.,Nye,S.,2011,“Barrierstoindustrialenergyefficiency:Aliteraturereview”;UNIDO”,http://www.unido.org/fileadmin/user_media/Services/Research_and_Statistics/WP102011_Ebook.pdf
Tado,https://www.tado.com/de-en/
ThePoliciesPartners(2013),RenovationRoadmapsforBuildings http://www.eurima.org/uploads/ModuleXtender/Publications/96/Renovation_Roadmaps_for_Buildings_PP_FINAL_Report_20_02_2013.pdf
TheWorldBank,Sweden:DecouplingGDPgrowthfromCO2 emissions is possible http://blogs.worldbank.org/climatechange/sweden-decoupling-gdp-growth-co2-emissions-possible
TULLI(2015),ExciseTaxationCustomerBulletin21,Energytaxation:http://www.tulli.fi/en/finnish_customs/publications/excise_tax/excise_taxation/021.pdf
UKgovernment:EnergyPerformanceCertificate(EPC), https://www.gov.uk/government/uploads/system/uploads/attachment_data/file/49997/1790388.pdf
VHK(2014),EcodesignimpactaccountingPart1–StatusNov.2013,https://ec.europa.eu/energy/sites/ener/files/documents/2014_06_ecodesign_impact_accounting_part1.pdf
Waide(2013),BuildingAutomation:thescopeforenergyandCO2 savingsintheEU,http://www.leonardo-energy.org/sites/leonardo-energy/files/documents-and-links/scope_for_energy_and_co2_savings_in_eu_through_ba_2nd_ed_2014-06-13.pdf
Waide(2016),Thescopeforenergysavingfromenergymanagement–draftreport.
Weidema,B.P.;Bauer,Ch.;Hischier,R.;Mutel,Ch.;Nemecek,T.;Reinhard,J.;Vadenbo,C.O.;Wernet,G,2013,Theecoinventdatabase:Overviewandmethodology,Dataqualityguidelinefortheecoinventdatabaseversion3,www.ecoinvent.org

Energy Efficiency in Europe | The levers to deliver the potential.
79
Global Leader Power SectorFelipe RequejoPartnerTel:+34914381 [email protected]
AustriaGerhard Marterbauer PartnerTel:[email protected]
BelgiumGuido VandervorstPartnerTel:[email protected]
DenmarkMikkel BoePartnerTel:[email protected]
FranceVéronique LaurentPartnerTel:[email protected]
Sébastien SoleilleDirectorTel:[email protected]
Anton BerwaldSenior consultantTel:[email protected]
GermanyThomas SchlaakPartnerTel:[email protected]
HungaryGabor GionPartnerTel:+36(1)[email protected]
ItalyPiergiulio BizioliPartnerTel:[email protected]
NetherlandsSiebe PostumaPartnerTel:[email protected]
PolandTomasz KonikPartnerTel:+48(32)[email protected]
RomaniaFarrukh KhanPartnerTel:+40(21)[email protected]
SpainJesus NavarroPartnerTel:+34914432061 [email protected]
UKJulian SmallPartnerTel:[email protected]
Neil CorneliusPartnerTel:[email protected]
Contact listTo discuss any of the topics raised in this report, please contact:

This publication has been written in general terms and therefore cannot be relied on to cover specific situations; application of the principles set out will depend upon the particular circumstances involved and we recommend that you obtain professional advice before acting or refraining from acting on any of the contents of this publication. Deloitte Conseil accepts no duty of care or liability for any loss occasioned to any person acting or refraining from action as a result of any material in this publication.
The present study was undertaken by Deloitte Conseil on the basis of data, studies, whether public or not public, and interviews, a list of which is contained in the bibliographic index. Such data was neither audited or verified. By essence, any information relating to future hypotheses may turn out to be inapplicable in the future. The present study is provided for the sole benefit of its intended recipients. The recipients are sole responsible for the decision they make based on their assessment of said study. The reader is responsible for evaluating whether or not the content of the study meet his own objectives, drawing his own conclusions and bearing all the consequences of the resulting decisions. Deloitte Conseil shall not be held liable for the consequences thereof. The recipient of the study is prohibited from providing a copy of all part or part of the Deliverables to a third party, or allowing any third party whatsoever to benefit from all or part of the Services, even gratuitously.
Deloitte refers to one or more of Deloitte Touche Tohmatsu Limited, a UK private company limited by guarantee, and its network of member firms, each of which is a legally separate and independent entity. Please see www.deloitte.com/about for a detailed description of the legal structure of Deloitte Touche Tohmatsu Limited and its member firms. In France, Deloitte SAS is the member firm of Deloitte Touche Tohmatsu Limited, and professional services are provided by its subsidiaries and affiliates.Deloitte provides audit, tax, consulting, and financial advisory services to public and private clients spanning multiple industries. With a globally connected network of member firms in more than 150 countries, Deloitte brings world-class capabilities and high-quality service to clients, delivering the insights they need to address their most complex business challenges. Deloitte's approximately 225,000 professionals are committed to becoming the standard of excellence.
In France, Deloitte calls on diversified expertise to meet the challenges of its clients of all sizes from all industries - major multinationals, local micro-companies and medium-sized enterprises. With the expertise of its 9 400 professionals and partners, Deloitte is a leading player in audit and risk services, consulting, financial advisory, tax & legal and accounting, based on a multidisciplinary offering and a set of action principles attuned to the requirements of our environment.
© 2016 Deloitte Conseil. A Deloitte network entity