Embed Size (px)
Citation preview
ORIGINAL ARTICLE
Energy efficiency for rapeseed biodiesel productionin different farming systems
Melese Tesfaye Firrisa & Iris van Duren &
Alexey Voinov
Received: 15 February 2012 /Accepted: 26 March 2013# Springer Science+Business Media Dordrecht 2013
Abstract Due to mounting concerns related to fossilfuel use and problems with their supply, the use ofalternative sources of energy is increasing. One of thealternative sources is biomass and the European Unionhas adopted a biofuel directive that describes targetsfor the use of biofuels in the transport sector. Themajority of biofuels produced in Europe comes fromrapeseed. In this study, we focused on analyzing theefficiency of rapeseed biodiesel production. Energyefficiency in terms of Energy Return On EnergyInvested (EROEI) was analyzed for two EU countries(Poland and The Netherlands) with different agro-ecological systems. Life Cycle Inventory (LCI)accounted for inputs, processes and outputs of energyin the biodiesel production system. Input parameterswere derived from literature as well as from farmer’sinterviews. The use of the outputs—straw, meal, andglycerin—were included in the LCI system boundary.The EROEI values ranged from 1.73 to 2.36 in Polandand from 2.18 to 2.60 in the Netherlands. The lownumber of respondents makes it risky to draw hard
conclusions about these values but the patterns ob-served show that intensifying the production processand increasing yield bears very little or no benefit interms of energy produced. Due to a higher amount oforganic manure and consequently lower amount ofartificial fertilizers used in crop growth in the Nether-lands, the rapeseed biodiesel production system in theNetherlands is more efficient than in Poland. In bothcases, the EROEI is quite low. More detailed spatialenergy efficiency assessments are required to deter-mine if and where sustainable production may bepossible.
Keywords Biofuel . Energy efficiency . EROEI .
LCA . LCI . RME
Introduction
Humans are using energy in many ways to improvetheir living standards. The world energy demand isincreasing because of growing consumption by agrowing population. The International Energy Out-look 2010 (EIA U.S. Energy Information Administra-tion 2010) foresees a growth in the global energyconsumption of 49% from 2007 to 2035. Fossil fuelsare the main energy source that drives the world econ-omy, however, for a number of reasons it is becomingincreasingly unlikely that fossil fuel supply will beable to meet this growth in demand. Reserves of fossilfuels are non-renewable and their extraction becomes
Energy EfficiencyDOI 10.1007/s12053-013-9201-2
M. T. Firrisa : I. van Duren (*) :A. VoinovFaculty of Geo-Information Science and Earth Observation(ITC), University of Twente,P.O. Box 217, Hengelosestraat 99,7500 AE Enschede, The Netherlandse-mail: [email protected]
M. T. Firrisae-mail: [email protected]
A. Voinove-mail: [email protected]

increasingly expensive and risky. Besides, they are themain source of already unsafe levels of green housegases (GHG) in the atmosphere (Cherubini andStrømman 2011) and, therefore, the main driver ofclimate change. Alternative sources of energy, solar,wind, hydro-power, are most promising in terms ofenvironmental impacts, energy security and socio-economic externalities (Bomb et al. 2007; Cherubiniet al. 2009; European Biodiesel Board 2011; McAlister and Horne 2009; Nanaki and Koroneos2009). Bioenergy is yet another important alternativesource of energy. In this case, energy is derived fromplants and can be used directly for heating, or electric-ity production, but most importantly, biomass can beconverted into liquid fuel (Davis et al. 2009; Halleuxet al. 2008) and directly used in the existing transpor-tation infrastructure, which is almost entirely run onfossil fuels (cars, buses, airplanes). This substitutabil-ity makes biofuels especially attractive and results inmuch attention and, in many cases, governmental sup-port and economic subsidies that encourage biofuelproduction (Kutas et al. 2007).
Cherubini et al. (2009) estimated that currentlybioenergy supplies 10 % of the total world primaryenergy, which in most cases is used in residential areasfor domestic purposes such as heating and cooking.The majority of biofuels worldwide is produced fromcorn, wheat, barley, sugarcane, rapeseed, oil palm,soybean, sugar beet, potato and sunflower (Ajanovic2011; Davis et al. 2009; Demirbas 2008). This createsa major concern that biofuel production is largelyderived from the same crops that are also used forfood production (Baka and Roland-Holst 2009;Kavalov 2004), which inevitably pushes food pricesup. Increased interest in biofuel production due tosubsidies and growing demand has an indirect impacton land use and biodiversity (Arvidsson et al. 2011;Crutzen et al. 2008; Mc Alister and Horne 2009;Nanaki and Koroneos 2009; Netherlands Environmen-tal Assessment Agency 2010).
Biofuels, however, are and at least in the short termare likely to remain, the main alternative to liquidfossil fuels (Murphy et al. 2011; Hammond et al.2008). The chemical compounds produced from thesecrops are: biodiesel, ethanol, methane, and methanol(Ajanovic 2011; Börjesson and Tufvesson 2011;Brecha 2008). In contrast to North and South Americawhere the focus is on ethanol, in Europe biodiesel isthe main type of biofuel produced for the transport
sector. Not surprisingly, the European Union was theworld leader in biodiesel production in 2005 (Bakaand Roland-Holst 2009). Out of the total of 10.2billion liters of biodiesel production worldwide in2007, 60 % was produced within the European Union.
Rapeseed is the main oil crop grown in Europe(Baka and Roland-Holst 2009; VROM 2010) account-ing for more than half of the biofuel production (Bu-reau et al. 2010). In 2008 in Europe, rapeseedaccounted for 79 % of all feedstock crops used forbiodiesel production (Ajanovic 2011). It is cultivatedin almost all European countries (Thamsiriroj andMurphy 2010). However the true costs and benefitsof biofuels, their efficiency in terms of net energyproduction and the magnitude of associated environ-mental and social impacts need further analysis.
To assess sustainability of biofuel production, allpotential environmental impacts over the entirelifespan (i.e., cradle-to-grave) from raw material ac-quisition through production, use and disposal need tobe considered. This can be achieved by applying aLife Cycle Assessment (LCA). The first step in thiscalculation is a Life Cycle Inventory (LCI), which isbasically “the result of compiling all environmentalflows, including resource use inputs and waste orpollution outputs” (Horne et al. 2009). Energy effi-ciency is one of the most important elements of sus-tainability analysis (Börjesson 2009). One simpleindicator of energy efficiency is the measure of EnergyReturn On Energy Investment (EROI or EROEI)(Cleveland 2008; Hall et al. 2009; Mulder and Hagens2008), which is calculated as:
EROEI ¼ Eout Ein=
where Eout is the amount of energy produced, and Ein isthe amount of energy used in production.
Energy production with EROEI of less than or evenclose to one is meaningless as in this case it wouldrequire as much or even more energy than what isproduced (The Offshore Valuation Group 2010). Hallet al. (2009) claimed that a minimum EROEI of 3should be achieved in order to support continuingeconomic activity and social function. Murphy andHall (2010) produced an overview of EROEI valuesin a comparison of different energy sources.
The EROEI index has been criticized (Wu andSardo 2010) for inappropriately favoring energy pro-duction with low input values. Indeed as energy input
Energy Efficiency

approaches zero EROEI tends to infinity. As an alter-native, it is suggested to look at net energy (NE)produced:
NE ¼ Ein � Eout
EROEI is more about efficiency of energy produc-tion and tells us how much energy is produced per unitof energy used. NE would favor energy production athigher costs as long as the net output of energy ishigher. While both indices are worth considering, weprefer EROEI because in most cases there are manyother factors in the energy production process thatmay be hard to account for in only energetic terms.Such externalities include land use conversion, im-pacts on water quality, soil loss, biodiversity impactsand other environmental effects, as well as possibleesthetic, cultural and other aspects, which are difficultto account for in terms of energy and which are alwayshigher when the operations are more energy intensive.In this case, EROEI indirectly favors the productionthat is less energy intensive even if the net energyproduces may be somewhat lower.
One other important caveat relates to energyquality, which is not directly included in theEROEI equation. For example, if we have abun-dant electric energy, but are badly in need ofliquid fuels, it may still make sense to producesuch liquid fuels even if the energetic value ofelectricity input is higher than the energy pro-duced. In this case, we need to distinguish be-tween the various types of energy that we areconsidering. Besides, EROEI analysis is “highlysensitive to assumptions about both system bound-aries and key parameter values” (Hall et al. 2009;Farrell et al. 2006). Nevertheless, the EROEI ap-proach is based on solid thermodynamic principlesand is, therefore, a good first step into understand-ing the efficiency of energy production.
Mulder and Hagens (2008) classify the level ofEROEI analysis into three orders. In the context ofrapeseed biofuel production and in line with the dif-ferent EROEI accounting methods, first-order EROEIincludes energy input from cultivation, transportationand energy for conversion of the feedstock at refinery.The direct energy output is in Rapeseed Methyl Ester(RME). Second-order EROEI calculation includes in-direct energy inputs and energy costs of by- and wasteproducts in addition to what is included in the first-
order EROEI. The third order EROEI adds up all thesocial and environmental externalities associated withthe whole production system (e.g. mitigating healthproblems or erosion or other forms of environmentaldeterioration). It then allocates energy values to themin addition to what is included in the second-orderEROEI calculation.
A key parameter in the EROEI calculation is cropyield. Crop yield and consequently the energy effi-ciency of biofuel production are affected by variousagricultural technologies that may be applied(Börjesson 2009; Johnston et al. 2009). The yieldcan be increased by applying manure, mineral fertil-izers, herbicides, pesticides or fungicides, as well asby improving agricultural practices through cultiva-tion, irrigation, etc. But since production and applica-tion of chemicals and advanced farming techniquesalways require additional energy, the energy input incrop growth also increases. It is not always obviouswhether the energy output will be a net benefit or lossif we do apply these advanced technologies. The pro-cesses relevant for a second-order EROEI calculationare presented in a causal loop diagram in Fig. 1.
In this paper, we focus on analyses of energy effi-ciency of rapeseed biofuel production for differentagro-ecological systems: Poland and the Netherlandswho are on the same latitude but have somewhatdifferent climate and soils, and a more substantialdifference in farming practices. Most LCA studiesdepend entirely on literature (Batchelor et al. 1995).In our study, we also interviewed farmers engaged inrapeseed production to validate inputs and outputs.The engagement of farmers in our study was notintended as a comprehensive survey of practitionersto cover all the range of growing conditions and prac-tices. Instead we saw it mostly as a “reality check” forthe LCA that we were performing, as a way to discussand validate the various steps of the production pro-cess with those who knew most about it.
In both countries, rapeseed is grown both as sum-mer and as winter crop and in both cases it is part of acrop rotation system. Winter rapeseed is more abun-dant due to a higher achievable crop yield compared tosummer rapeseed and because having a crop on theland during winter reduces soil erosion. Therefore, inthis paper, we compare the energy efficiency of bio-fuel production from winter rapeseed.
Our objective is to improve the quantification of theenergy production estimates for rapeseed and to
Energy Efficiency

demonstrate that higher yields (agricultural goal) donot necessarily translate into higher bioenergy poten-tial. We also aim at providing information to policyand decision makers for optimizing biofuel energyproduction efficiency.
Materials and methods
Study area description
Poland and the Netherlands are found on the samelatitude (52° N) but differ somewhat in climate withPoland having lower temperatures in winter and over-all less rainfall, especially in summer. The Internation-al Institute for Applied Systems Analysis calculated a
rapeseed crop suitability map based on various climat-ic, topographic, soil, and crop requirement parameters(Fischer et al. 2002). We used this map in Fig. 2 toshow the European rapeseed suitability with enlarge-ments of Poland and the Netherlands on which thelocations are plotted of the farmers who wereinterviewed. According to the FAO statistics Polandused on average 830,817 ha land over the period2007–2011 to grow rapeseed while in the Netherlandsonly 2,606 ha of land was used to grow this crop. InPoland, this means more than 2.5 % of the land is usedto grow rapeseed while in the Netherlands this is lessthan 1 %
Based on the suitability map, it appears that Polandhas a better potential to grow rapeseed compared tothe Netherlands. On the other hand, the farming
Fig. 1 Causal loop diagram of Energy Return on Energy Input (EROEI) for the rapeseed biodiesel production system. All processesthat require or produce energy (boxes with bold lines) are connected via positive or negative cause-effect relationships
Energy Efficiency
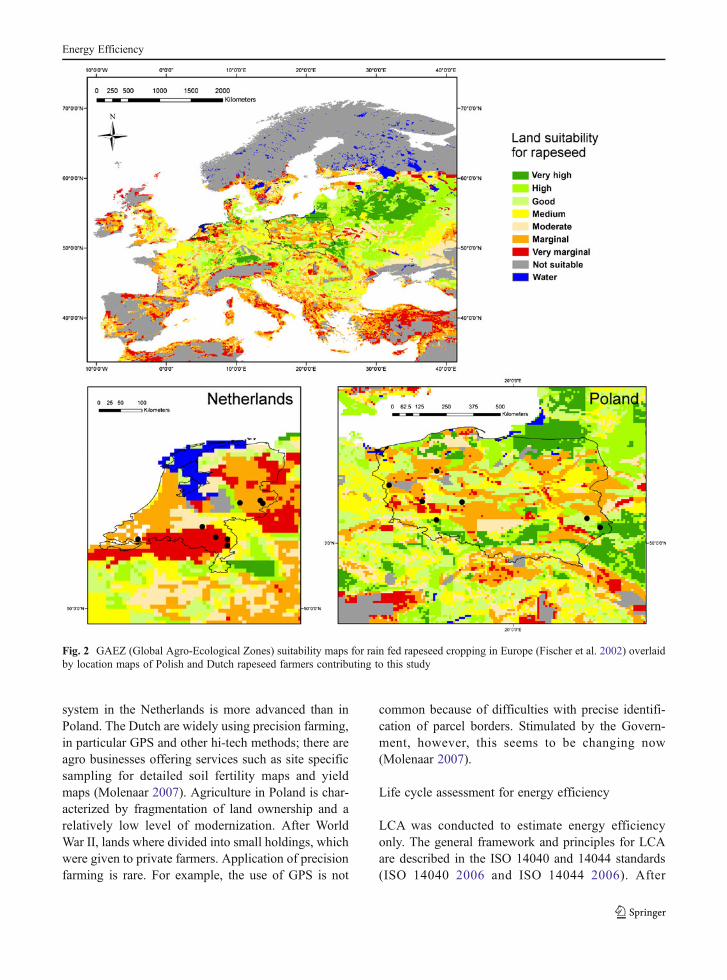
system in the Netherlands is more advanced than inPoland. The Dutch are widely using precision farming,in particular GPS and other hi-tech methods; there areagro businesses offering services such as site specificsampling for detailed soil fertility maps and yieldmaps (Molenaar 2007). Agriculture in Poland is char-acterized by fragmentation of land ownership and arelatively low level of modernization. After WorldWar II, lands where divided into small holdings, whichwere given to private farmers. Application of precisionfarming is rare. For example, the use of GPS is not
common because of difficulties with precise identifi-cation of parcel borders. Stimulated by the Govern-ment, however, this seems to be changing now(Molenaar 2007).
Life cycle assessment for energy efficiency
LCA was conducted to estimate energy efficiencyonly. The general framework and principles for LCAare described in the ISO 14040 and 14044 standards(ISO 14040 2006 and ISO 14044 2006). After
Fig. 2 GAEZ (Global Agro-Ecological Zones) suitability maps for rain fed rapeseed cropping in Europe (Fischer et al. 2002) overlaidby location maps of Polish and Dutch rapeseed farmers contributing to this study
Energy Efficiency

defining the goal and the scope, a Life Cycle Invento-ry was performed. Based on literature and interviewdata, amounts of energy were allocated to the variousprocesses and products in the biofuel productionchain. Ultimately, energy efficiency in terms ofEROEI was calculated to compare the efficiency ofenergy production from rapeseed in the two countries.
The goal of the LCA analysis was a comparativeenergy efficiency assessment for two countries withdifferent rapeseed crop production systems. The ener-gy outputs of RME and by-products were related to allenergy inputs required during crop production, trans-port and biomass conversion for energy production(EROEI) in Poland and the Netherlands.
The energy inputs and outputs at farm level wereexpressed as energy (in megajoule) per hectare (ha).The second-order EROEI calculation performed inthis study included the energy inputs to produce rape-seed and the amount of fertilizers and chemicals forcrop protection provided during rapeseed crop growthas well as the energy required for transport and theconversion of biomass to RME. Figure 3 shows allinputs, processes and outputs of the rapeseed biofuel
system. In the calculation, only the 2009 and 2010production seasons were taken into account.
Life cycle inventory
The LCI determined the baseline for the EROEI cal-culation for the entire rapeseed biofuel productionprocess. In addition to reviewing literature, weinterviewed practicing farmers to compile and refinethe list of all inputs and outputs within the boundariesof the rapeseed biofuel production system.
The next step was calculating the energy require-ments for each process for both Poland and the Neth-erlands. Ideally, here we would want to have as manyrespondents as possible distributed across differentagro-ecological regions, and covering a diverse rangeof farming practices. First, farmers were contacted bytelephone to explain the purpose of the research and toask if they were willing to spend about 15–20 min tofill in a questionnaire composed of 30 questions.When they indicated their willingness to cooperate,they received a questionnaire (translated into theirown language). The questionnaire included questionson the location of the farm, the distance to the fieldswhere rapeseed was grown and the distance to thebiofuel production plant. Furthermore, questions wereincluded on the types and quantity of fertilizers andcrop protection chemicals used.
In the Netherlands, we received a list of farmersgrowing rapeseed in 2009 and 2010 via LTO Nether-lands (the Dutch farmers’ organization). Because theresponse rate of the farmers was low we tried unsuc-cessfully to increase the sample by contacting the localfarmer cooperatives or beekeepers who advertised thattheir honey was from rapeseed. A practical solution toincrease the number of respondents was by contactingfarmers of fields where rapeseed was visually ob-served. This resulted in two more on-farm interviews.Based on the recommendation and contact addressesprovided by the Rapeseed Farmers Association, Polishfarmers were also contacted face to face, over thephone and by mail.
Unfortunately the response rate was low. We haveended up with eight farmers in each countryresponding to our survey. Farmers were reluctant todiscuss numbers that were somehow associated withthe productivity of their farms or their profits andlosses. In other cases, they were probably too busyor did not connect the research with their needs orFig. 3 System diagram for rapeseed biodiesel production
Energy Efficiency
interests. Nevertheless, they have provided importantinformation about their farming practices, were instru-mental in validating the processes in our computation-al model, and gave us valuable estimates for energyinputs and outputs in terms of fertilizers, crop protec-tion, transportation, yield, straw production, etc. (seethe systems diagram in Fig. 3).
Computational model
The EROEI calculations were performed on a per-hectare basis using the following formulas:
Energy inputs
Cultivation Energy (CE) The amount of energy in theform of diesel fuel used, called here cultivation fuel(CF in liter per hectare) for driving the tractor andoperating the machinery to cultivate the land. Thisincludes running the tractor to distribute fertilizers,chemicals or manure. There were large discrepanciesin the numbers derived from the interviews, and weended up using estimates from literature (Downs andHansen 1998; Grisso et al. 2010) for the operationsidentified in the interviews. The energy content of35.9 MJ/l for diesel was adopted from the report bythe European Commission (2005).
CE MJ ha=ð Þ ¼ 35:9 MJ=lð Þ � CF l=hað Þ
Fertilizer Production Energy (FE) The energy re-quired for the production of the three major mineralfertilizers: nitrogen, phosphorus and potassium. Thequantities of fertilizers (N, P, and K, respectively, inkilogram per hectare) used for rapeseed productionwere derived from the interviews. The energy conver-sion factors (in megajoule per kilogram) were basedon Lewis (1997) with a more recent conversion factorfor N-fertilization based on Jenssen and Kongshaug(2003).
FE MJ ha=ð Þ ¼ 40:3 MJ kg=ð Þ � N kg ha=ð Þþ 8:6 MJ kg=ð Þ � P kg ha=ð Þþ 6:4 MJ kg=ð Þ � K kg ha=ð Þ
When raw manure was used as a substitute formineral fertilizers, we assumed its energy productioncosts to be zero. Manure can be seen as waste or side
product from milk and meat production, and Dutchfarmers, for example, pay additional costs to get rid ofit. Janulis (2004) uses, however, 1993.5 MJ/ha energycosts for the production of bio-fertilizer, which is anorder of magnitude less than the cost of mineral fertil-izers, but not zero. The sensitivity of the EROEI valuefor our assumption was tested.
Crop Protection Energy (CPE): The energy requiredfor production of insecticides, herbicides and fungi-cides. The application quantities (I, H, F, respectively,in liter per hectare) were provided by the farmers. Theenergy conversion factor of 274.1 MJ/kg for all threetypes of crop protection chemicals was based on Mor-timer et al. (2003) and converted from l/ha in kg/haassuming that the density of the chemicals is equal tothat of water.
CPE MJ ha=ð Þ ¼ 274:1 MJ kg=ð Þ� I kg ha=ð Þ þ H kg ha=ð ÞþF kg ha=ð Þ½ �
Transportation Energy (TE): The energy required forround trips between the farm house and field (TF) andfrom the field to the market (TM) (in most cases thiswas the RME production plant). The average totaldistances (in kilometer) over the cultivation periodwere calculated from the interviews and doubled toaccount for the return trips. Fuel consumption rate fora tractor was assumed at 32.8 l diesel/100 km assuggested by Lewis (1997)1 and the energy contentfor diesel was 35.9 MJ/l diesel (European Commission2005).
TE MJ ha=ð Þ ¼ 2� 0:328 l km=ð Þ � 35:9 MJ l=ð Þ� TF kmð ÞþTM kmð Þ½ Þ field area hað Þð �=
Feedstock Production Energy (FPE): The total energy(MJ) required to produce the per-hectare feedstock anddeliver it to the biofuel processing plant. It is the
1 It would make sense to assume that trucks instead of tractorswould be used to deliver the yield to markets, especially overlonger distances. This may be the case but it hardly changes ourresults, because fuel consumption of heavy trucks is almost thesame as for tractors. Natural Resources Canada reports in a 2000survey that the average fuel consumption of its fleet was39.5 l/100 km (http://oee.nrcan.gc.ca/transportation/business/documents/case-studies/fuel-effic-benchm.cfm?attr=16). Evenassuming that this has improved over the past 12 years, we getresults similar to what we have for tractors.
Energy Efficiency

summation of the energy inputs above:
FPE MJ ha=ð Þ ¼ CE MJ ha=ð Þ þ FE MJ ha=ð Þþ CPE MJ ha=ð Þ þ TE MJ ha=ð Þ
The next step was calculating the energy input toconvert the feedstock into biofuel.
Conversion energy (CoE): The energy for extrac-tion, refining and RME production is dependenton the rapeseed yield and amount of biodieselproduced from it. Campbell and McCurdy (2008)described the different conversion products. Theyexpressed energy input per kilogram of biodiesel
produced. Their energy allocation factors were3.38 MJ/kg biodiesel for extraction of crude rape-seed oil from the rapeseed yield (EE), 0.34 MJ/kgbiodiesel for refining the crude oil into refinedrapeseed oil (RE) and 7.7 MJ/kg biodiesel for theconversion of refined rapeseed oil into biofuel(BPE). From their mass balance, it was derivedthat 1 kg of biodiesel requires 2.66 kg of rape-seed, which means 1 kg of rapeseed produces0.376 kg biofuel. This results in energy allocationsper kilogram of rapeseed, which can be furthermultiplied by Y, yield (in kilogram per hectare)to recalculate on a per-hectare basis:
EE MJ ha=ð Þ ¼ 3:38 MJ kg biofuel=ð Þ � 0:376 kg rapeseed kg biofuel=ð Þ � Y kg rapeseed ha=ð Þ ¼ 1:27 MJ kg=ð Þ � Y kg ha=ð ÞRE MJ ha=ð Þ ¼ 0:34 MJ kg biofuel=ð Þ � 0:376 kg rapeseed kg biofuel=ð Þ � Y kg rapeseed ha=ð Þ ¼ 0:13 MJ kg rapeseed=ð Þ
� Y kg rapeseed ha=ð ÞBPE MJ ha=ð Þ¼7:7 MJ kg biofuel=ð Þ�0:376 kg rapeseed kg biofuel=ð Þ�Y kg rapeseed ha=ð Þ¼2:89 MJ kg rapeseed=ð Þ
� Y kg rapeseed ha=ð Þ
The total amount of energy necessary for the con-version of rapeseed biomass in biofuel (RME) is:
CoE MJ ha=ð Þ ¼ EE MJ ha=ð Þ þ RE MJ ha=ð Þþ BPE MJ ha=ð Þ
Total energy invested (TEI): The summation of all theenergy required for cultivation, fertilizer production,crop protection chemicals production, transport andthe conversion energy.
TEI MJ ha=ð Þ ¼ FPE MJ ha=ð Þ þ CoE MJ ha=ð Þ
Energy outputs
All energy outputs are converted to values that areexpressed in the amount of energy produced per unitfarm area (MJ/ha). Since most output energy conver-sion factors and values found in literature were relatedto the weight of biofuel produced, we converted thosevalues to energy per kilogram rapeseed feedstock andthen multiplied it by yield (Y) in kilogram per hectare.
Energy output in the form of biodiesel or RME(ERME): This was calculated as follows: Accordingto Campbell and McCurdy (2008), 1.08 kg of
biodiesel has the same energy content as 1.00 kg offossil diesel. This means that 1.00 kg of biodiesel hasthe same energy content as 0.926 kg of fossil diesel,which gives us the energy conversion factor of 0.926×35.9=33.2 MJ/kg biofuel based on the fossil fueldiesel energy content 35.9 MJ/kg (European Commis-sion 2005) and 1 kg of rapeseed produces 0.376 kgbiofuel (Campbell and McCurdy 2008):
ERME MJ ha=ð Þ ¼ 33:2 MJ kg biofuel=ð Þ� 0:376 kg biofuel kg rapeseed=ð Þ� Y kg rapeseed ha=ð Þ
The by- and waste products considered in the cal-culation were rapeseed straw, meal (cake), andglycerin.
Energy from Straw (ES): Rapeseed is mainly grownfor its seeds but leaving straw, roots and empty podsafter harvesting the seeds on the land causes an as-sumed reduction of 32.5 kg of N/ha fertilization togrow the next crop. This energy reduction is called the“preceding crop effect” (ES) and is equivalent to2122.5 MJ/ha (Gärtner and Reinhardt 2003). This isan average value used in many LCAs and it assumes
Energy Efficiency

that the amount of straw that becomes available asfertilizer is not dependent upon yield.
ES MJ ha=ð Þ ¼ 2122:5 MJ ha=ð ÞEnergy from Meal (EM): The mass balance ofCampbell and McCurdy (2008) shows that per2.66 kg rapeseed feedstock, there is 1.6 kg rape-seed meal and 0.1 kg glycerin produced whileproducing 1 kg RME. The real energy content ofrapeseed meal is unknown and, therefore, Camp-bell and McCurdy (2008) used economic values toallocate the energy content value of 5.08 MJ/kgbiodiesel or 1.91 MJ/kg rapeseed feedstock. In thiscase, their calculations were based on substitutingrapeseed meal with another animal feedstock witha known energy value and an equal price.
EM MJ ha=ð Þ ¼ 1:91 MJ kg rapeseed=ð Þ � Y kg rapeseed ha=ð Þ
The energy production in the form of glycerin wasaccording Campbell and McCurdy (2008) 13 % of thetotal energy requirements to produce biodiesel.
EG MJ ha=ð Þ ¼ 0:13� TEI MJ ha=ð Þ
The total energy return (TER) from the rapeseedbiofuel production chain is the summation of all theindividual output processes.
TER MJ ha=ð Þ ¼ ERME MJ ha=ð Þ þ ES MJ ha=ð Þþ EM MJ ha=ð Þ þ EG MJ ha=ð Þ
Now the final step, the calculation of the energyefficiency in the form of energy return on energyinvestment (EROEI) can be made.
EROEI ¼ TER MJ ha=ð Þ TEI MJ ha=ð Þ=
The calculation of EROEI was performed for everyfarmer. In case a farmer had not filled in all questions,we assumed that this farmer used the average of theother farmers. This resulted in an average EROEIvalue as well as estimates of EROEI with minimumor maximum energy input.
Results
Survey outcomes
The interviews with farmers showed that rapeseedcultivation practices varied between farmers within acountry as well as between farmers in the differentcountries, Poland and the Netherlands.
All energy inputs were quantified per hectare rape-seed cropland. Table 1 shows the summary of thedifferent inputs in the two countries, including theminimum, average and maximum input per country.Although the figures are based on a low number offarmer’s responses, the pattern that can be observed isclear and consistent. Fertilizer (NPK) input appears tobe higher in Poland compared to the Netherlandswhile the crop yield is lower. This is in spite of the
Table 1 Inputs and outputs in rapeseed cropping based onfarmers interviews in Poland and the Netherlands. Cultivationincludes running tractors, machineries and land operations car-ried out in the field. The numbers for cultivation fuel use (in liter
per hectare) derived from the interviews appeared to be incon-sistent. Estimates from literature (Downs and Hansen 1998;Grisso et al. 2010) were used instead
Inputs and outputs Poland (n=8) Netherlands (n=8)
Minimum Average Maximum Minimum Average Maximum
Nitrogen (kg/ha) 90 183 342 55 135 200
Phosphorus (kg/ha) 12 69 102 0 29 80
Potassium (kg/ha) 16 110 160 0 73 150
Insecticide (l/ha) 0.3 1.1 2.0 0 0.2 0.8
Herbicide (l/ha) 2.0 2.3 3.0 1.5 2.1 4.0
Fungicide (l/ha) 0.8 1.4 2.0 0 0.5 1.5
Distance to field (km) 1 2 5 0.5 4 10
Distance to market (km) 10 84 300 2 61 100
Yield (Mg/ha) 2.9 3.4 4.0 3.0 4.0 5.0
Energy Efficiency
fact that Poland enjoys relatively large areas withbetter agro-ecological conditions for rapeseed produc-tion (Fig. 2). Average herbicide use in both coun-tries seems to be quite similar. But it looks likemore insecticide is applied in Poland than in Neth-erlands whereas fungicide application is lower inthe Dutch farming system. The farm to markettransport distances are longer in Poland comparedto the Netherland. But it seems Polish farmerstravel less from their farm to the field and viceversa compared to the Dutch farmers. We shouldbe careful, however, with making hard claimsbased on these figures as the number of respon-dents was too low to consider our two farmers’surveys fully representative for the entire country.Nevertheless, these numbers are sufficient to ana-lyze how on-farm practices influence the energyefficiency of the energy production process in bothcountries.
Rapeseed crop production
Polish farmers plough and sow rapeseed in August.They apply fertilizers two to four times and dependingon the appearance of weeds, pests, and fungi theyapply crop protection chemicals three to four times(0.3 to 3 l/ha) during the growing season. In rotationwith rapeseed, other crops are grown by farmers, ofwhich the most common ones are wheat, barley,maize, and legumes. The average yield of rapeseed is3.4 Mg/ha. Almost all farmers sell the yield producedto temporary storage companies, oil producing facto-ries, and biofuel producing refineries by themselves orthrough farmer cooperatives.
Dutch farmers also sow in August after plowingand fertilizing the land. Due to precision farmingtechniques they can use less fertilizers compared toPolish farmers. Dutch farmers apply organic manureduring land preparation and rapeseed sowing. Thiswas not common practice in Poland (personal commu-nication with Szymon Kuczyński 2011, and inferredfrom the survey outcome). The tractors and combineharvesters are comparable in the two countries. Agro-chemicals (0 to 4 l/ha) are used depending on theinfestation threat. Farmers commonly grow wheat,barley, and maize in rotation with rapeseed. The aver-age yield for rapeseed is 4.0 Mg/ha. Rapeseed pro-duced was sold to biodiesel factories in theNetherlands or in some cases exported to Germany.
EROEI calculation based on LCI
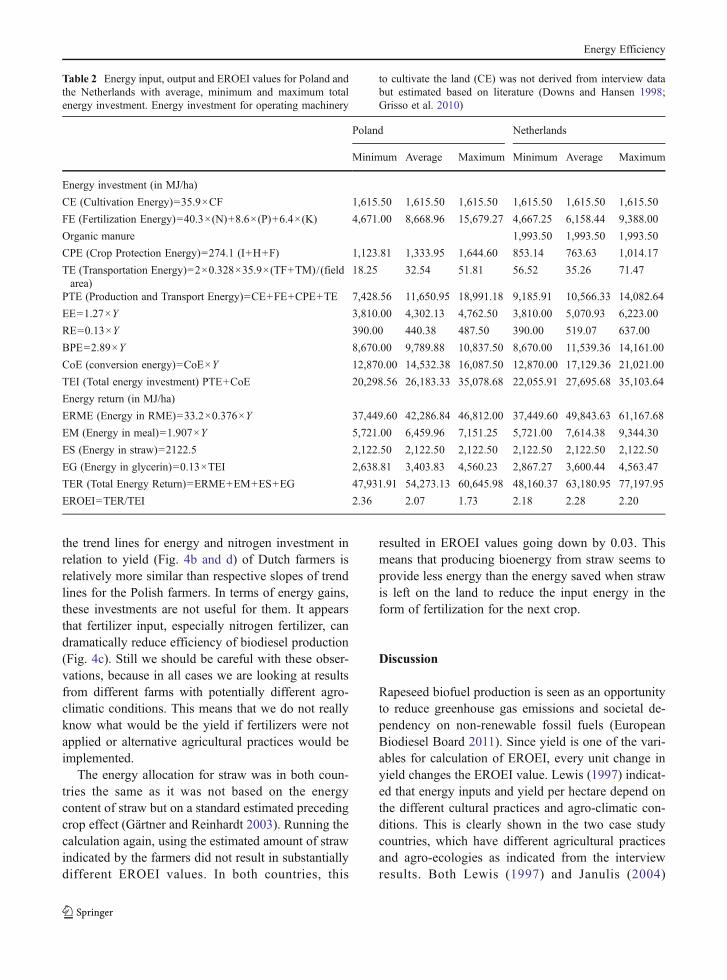
The EROEI values in Poland ranged from 1.73 to 2.36and in the Netherlands from 2.18 to 2.60 (Fig. 4a and c).To help to understand and interpret the results, thecalculations are broken into relatively small steps. Itshould be noted that the “lowest EROEI value” is dif-ferent from “the EROEI value resulting from the lowestinput”. In Table 2, first all energy inputs are presentedfollowed by the calculated and summed energy outputs.The last row shows the resulting EROEI value. In thistable, a comparison is made between the average inputs,outputs and resulting EROEI of all interviewed farmersper country and the EROEI calculations for the farmerwith the lowest energy input and the one with thehighest energy input in crop growth.
In terms of energy investment, farmers in Polandhave on the average a higher energy input compared totheir Dutch colleagues. This is mainly due to applica-tion of larger amounts of mineral fertilizers, whichcontribute 33.1 and 22.2 % of the total energy investedin Poland and Netherlands, respectively. Higher fertil-izer application does not result in a higher yield: theaverage Polish rapeseed yield was 3.4 Mg/ha, whilethe Dutch farmers produced an average 4.0 Mg/ha(Table 1). The energy required for the conversion ofrapeseed biomass to energy is the same when calcu-lated per kg rapeseed but since the yields are larger inthe Netherlands the conversion energy per hectare islarger in the Netherlands compared to Poland.
The fertilizers considered for the energy calculationsare mineral fertilizers (NPK) and bio-fertilizer (manure,as common in the Netherlands). We assumed the energyproduction costs of bio-fertilizers to be zero, since ma-nure in many cases is considered as a nuisance andfarmers actually have to pay to get rid of it. If we needto factor in the energy costs of bio-fertilizers, we canassume the number provided by Janulis (2004), inwhich case the EROEI value of the Dutch rapeseedfarmers will drop by 0.16. The difference in the typeof fertilizers applied in the two countries results indifferent energy costs for rapeseed production. Out ofthe three commercial fertilizers, nitrogen has the highestenergy production cost (40.3MJ/kg). In Poland, averagenitrogen application was 183 kg/ha, which translatesinto 7,375 MJ/ha spent on N-fertilizer. Compared tothe total energy investment of 26,183 MJ/ha this is28.1%. For the Netherlands, N-fertilizer energy require-ments are 19.1 % of the total energy investment.
Energy Efficiency

Nitrogen fertilizers are most energy demanding and takeover 85 % of energy required for production of mineralfertilizers in Poland and the Netherlands (Table 2). Notethat the EROEI values that result from the lowest, aver-age and highest energy input are different from thehighest, average and lowest EROEI values, respectively.
The distances from the farm to the refinery are some-what larger in Poland, resulting in a higher energy in-vestment for transport. The conversion processes frombiomass to energy are assumed to be the same for Polandand the Netherlands but due to higher yields in theNetherlands the per-hectare energy gain is higher there.
In both countries, a larger energy investment doesnot result in higher energy production efficiency al-though a higher crop yield is produced (Fig. 4a and b).The highest energy efficiency is generally achievedwhen crops are produced with the least energyinvested. In the Netherlands, the interviewed farmer
with the lowest energy investment produced the low-est yield resulting in a relatively low EROEI. Howev-er, it was almost the same as for the farmer with thehighest energy investment. When comparing energyreturn on energy invested it shows that in generalDutch farmers produce rapeseed more efficiently thanPolish farmers and the downward trend in Fig. 4a ismore pronounced in Poland than in the Netherlands.Obviously, in both countries, additional energy invest-ments in the form of N-fertilization do produce higheryields (Fig. 4d). However, the additional energy need-ed to grow and process this higher yield is not “worth”the investment as shown in Fig. 4c.
The comparison in Fig. 4d between Polish andDutch farmers regarding the effect of nitrogen inputon the yield shows that energy investments in nitrogenhardly improve the yields of Polish farmers while itdoes have an effect for the Dutch farmers. The slope of
Fig. 4 EROEI and yield graphs based on farmers interviews in Poland and the Netherlands (n=8 for both countries)
Energy Efficiency
the trend lines for energy and nitrogen investment inrelation to yield (Fig. 4b and d) of Dutch farmers isrelatively more similar than respective slopes of trendlines for the Polish farmers. In terms of energy gains,these investments are not useful for them. It appearsthat fertilizer input, especially nitrogen fertilizer, candramatically reduce efficiency of biodiesel production(Fig. 4c). Still we should be careful with these obser-vations, because in all cases we are looking at resultsfrom different farms with potentially different agro-climatic conditions. This means that we do not reallyknow what would be the yield if fertilizers were notapplied or alternative agricultural practices would beimplemented.
The energy allocation for straw was in both coun-tries the same as it was not based on the energycontent of straw but on a standard estimated precedingcrop effect (Gärtner and Reinhardt 2003). Running thecalculation again, using the estimated amount of strawindicated by the farmers did not result in substantiallydifferent EROEI values. In both countries, this
resulted in EROEI values going down by 0.03. Thismeans that producing bioenergy from straw seems toprovide less energy than the energy saved when strawis left on the land to reduce the input energy in theform of fertilization for the next crop.
Discussion
Rapeseed biofuel production is seen as an opportunityto reduce greenhouse gas emissions and societal de-pendency on non-renewable fossil fuels (EuropeanBiodiesel Board 2011). Since yield is one of the vari-ables for calculation of EROEI, every unit change inyield changes the EROEI value. Lewis (1997) indicat-ed that energy inputs and yield per hectare depend onthe different cultural practices and agro-climatic con-ditions. This is clearly shown in the two case studycountries, which have different agricultural practicesand agro-ecologies as indicated from the interviewresults. Both Lewis (1997) and Janulis (2004)
Table 2 Energy input, output and EROEI values for Poland andthe Netherlands with average, minimum and maximum totalenergy investment. Energy investment for operating machinery
to cultivate the land (CE) was not derived from interview databut estimated based on literature (Downs and Hansen 1998;Grisso et al. 2010)
Poland Netherlands
Minimum Average Maximum Minimum Average Maximum
Energy investment (in MJ/ha)
CE (Cultivation Energy)=35.9×CF 1,615.50 1,615.50 1,615.50 1,615.50 1,615.50 1,615.50
FE (Fertilization Energy)=40.3×(N)+8.6×(P)+6.4×(K) 4,671.00 8,668.96 15,679.27 4,667.25 6,158.44 9,388.00
Organic manure 1,993.50 1,993.50 1,993.50
CPE (Crop Protection Energy)=274.1 (I+H+F) 1,123.81 1,333.95 1,644.60 853.14 763.63 1,014.17
TE (Transportation Energy)=2×0.328×35.9×(TF+TM)/(fieldarea)
18.25 32.54 51.81 56.52 35.26 71.47
PTE (Production and Transport Energy)=CE+FE+CPE+TE 7,428.56 11,650.95 18,991.18 9,185.91 10,566.33 14,082.64
EE=1.27×Y 3,810.00 4,302.13 4,762.50 3,810.00 5,070.93 6,223.00
RE=0.13×Y 390.00 440.38 487.50 390.00 519.07 637.00
BPE=2.89×Y 8,670.00 9,789.88 10,837.50 8,670.00 11,539.36 14,161.00
CoE (conversion energy)=CoE×Y 12,870.00 14,532.38 16,087.50 12,870.00 17,129.36 21,021.00
TEI (Total energy investment) PTE+CoE 20,298.56 26,183.33 35,078.68 22,055.91 27,695.68 35,103.64
Energy return (in MJ/ha)
ERME (Energy in RME)=33.2×0.376×Y 37,449.60 42,286.84 46,812.00 37,449.60 49,843.63 61,167.68
EM (Energy in meal)=1.907×Y 5,721.00 6,459.96 7,151.25 5,721.00 7,614.38 9,344.30
ES (Energy in straw)=2122.5 2,122.50 2,122.50 2,122.50 2,122.50 2,122.50 2,122.50
EG (Energy in glycerin)=0.13×TEI 2,638.81 3,403.83 4,560.23 2,867.27 3,600.44 4,563.47
TER (Total Energy Return)=ERME+EM+ES+EG 47,931.91 54,273.13 60,645.98 48,160.37 63,180.95 77,197.95
EROEI=TER/TEI 2.36 2.07 1.73 2.18 2.28 2.20
Energy Efficiency
described that energy efficiency depends on “agro-climatic conditions” and practices and technologyused for the production of biofuel crops. Looking atthe rapeseed suitability map in Fig. 2, it seems that interms of agro-ecology, Poland would be a more effi-cient place to produce rapeseed biofuels than theNetherlands but our calculations show that currentlythe situation is the opposite. The main difference be-tween farming practices in the two countries is in theuse of high-tech precision farming techniques (use ofmanure and targeted application of fertilizers) in theNetherlands as described by Molenaar (2007). It ap-pears that this may be influencing crop yields morethan climate or ecological conditions. Growing rape-seed crops in best agro-ecological conditions, consid-ering soils, elevation, slope, and climate, will alsoboost the efficiency. However, in this case, biofuelsbecome especially dangerous by encroaching intoprime agricultural lands and directly competing anddisplacing food production. This is exactly what maybe happening if biofuels are further subsidized, andmarket preferences are distorted.
In this study, much time and effort was spent toprepare and execute the interviews with farmers.Searching for names and contact details of rapeseedfarmers, and contacting the farmers before we couldinterview them was time consuming. The law on theprotection and preservation of privacy rights of indi-viduals does not allow easy access to this type ofinformation via Governmental offices or large farmersorganizations. Therefore, we had to directly contactfarmers’ cooperatives, local farmers’ organizationsand track farmers based on personal observations ofthem growing rapeseed. This certainly could result insome bias in the farmer’s distribution over the coun-tries. In the Netherlands, we were able to contact morefarmers in the East and South of the country than inthe West and North of the country.
After identifying rapeseed farmers, it remained achallenge to contact them and convince them to par-ticipate in our research. The time slot when farmerscould be reached by telephone to explain the purposeof the research or to make an appointment for sendinga questionnaire or to plan a visit is very limited.Several farmers who said that they were willing to fillin a questionnaire eventually never responded. Thebenefits of their participation are unclear and it wasbased on their good will only. Although the number ofresponding farmers was lower than planned, they
showed sufficient differentiation in rapeseed croppingactivities. This makes us believe that the calculationson energy inputs and outputs provide useful insight onenergy efficiency of rapeseed biodiesel production.Also quite fortunately, the farmers’ responses camefrom quite variable agro-ecological conditions (seeFig. 2), covering all the predominant suitability classesin both countries, including marginal, very marginaland suitable areas in the Netherlands, as well as highlysuitable, very highly suitable and good areas inPoland.
From other studies (Bernesson et al. 2004;Börjesson et al. 2010; Lewis 1997) it was alreadyknown that mineral fertilizers, and nitrogen in partic-ular, have a relatively large impact on the energyefficiency of rapeseed biofuel production. This re-search, based on interviewing farmers validated this.The fact that it is still profitable for the farmers toapply large amounts of fertilizers in attempt to increasethe yield can mean only that the current market pricesfor fertilizers do not reflect their true energy cost.Again subsidies and failure to account for true envi-ronmental and social costs of energy blur the pictureand lead to distorted efficiencies. This is yet anotherreason why objective measures of energy efficiency,such as EROEI, are important to understand the truepicture.
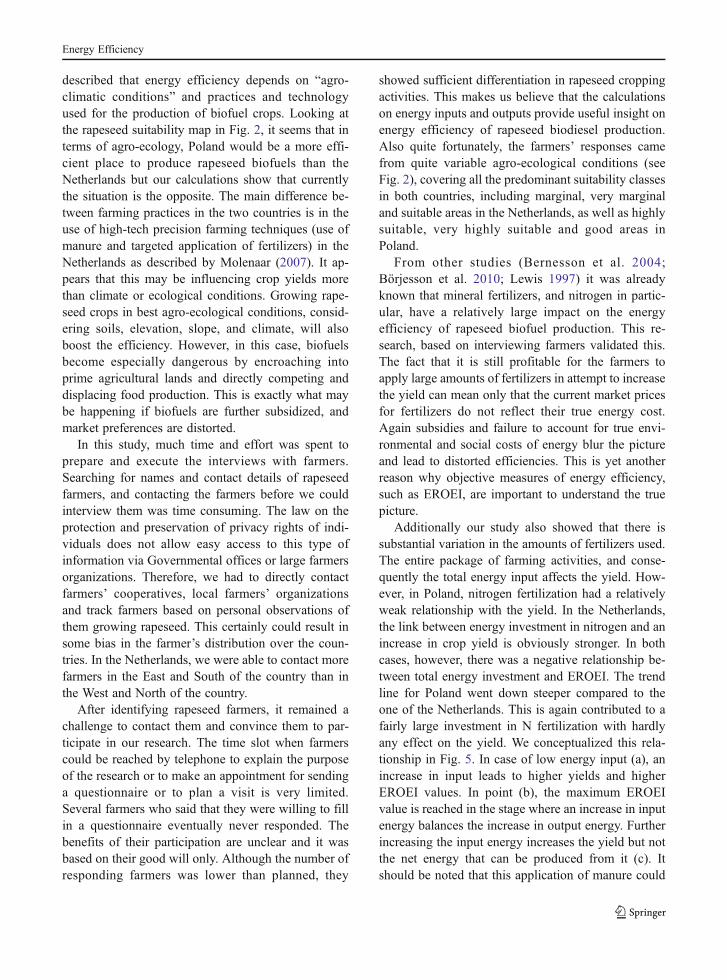
Additionally our study also showed that there issubstantial variation in the amounts of fertilizers used.The entire package of farming activities, and conse-quently the total energy input affects the yield. How-ever, in Poland, nitrogen fertilization had a relativelyweak relationship with the yield. In the Netherlands,the link between energy investment in nitrogen and anincrease in crop yield is obviously stronger. In bothcases, however, there was a negative relationship be-tween total energy investment and EROEI. The trendline for Poland went down steeper compared to theone of the Netherlands. This is again contributed to afairly large investment in N fertilization with hardlyany effect on the yield. We conceptualized this rela-tionship in Fig. 5. In case of low energy input (a), anincrease in input leads to higher yields and higherEROEI values. In point (b), the maximum EROEIvalue is reached in the stage where an increase in inputenergy balances the increase in output energy. Furtherincreasing the input energy increases the yield but notthe net energy that can be produced from it (c). Itshould be noted that this application of manure could
Energy Efficiency
be also considered as waste disposal and treatment,and therefore does not have to come as an energy cost.Manure disposal is a very hot issue in farming and inmost cases farmers have to pay additional fees andspend additional energies to get rid of the manure. Incase we do not treat manure as a side product fromanother production process and do allocate energycosts to its application, the EROEI value for Dutchfarmers goes down by 0.18.
Checking the FAO statistics database revealsthat over the last 10 years reported in the database(2000–2009) Poland and the Netherlands achievedaverage countrywide yields of 2.5 and 3.4 Mg/ha,respectively, (FAOSTAT 2011). This is substantial-ly less compared to the average yields reported bythe farmers in our study for 2010. We hypothesizethat farmers with relatively high yields were morelikely to participate, being proud of their resultsand not afraid to show them to researchers. If wetake the average FAO yield over the last 10 yearsfor both countries as a basis of our calculationsand assume the average energy input the same asreported by the farmers participating in our study,then the EROEI values would drop 0.24 in Polandand 0.12 in the Netherlands. However, if theseyields were obtained with lower energy inputsand if we take these inputs from the trend linesin Fig. 4b, then the corresponding input invest-ments would be 15 GJ/ha for Poland (for a yieldof 2.5 Mg/ha) and around 24 GJ/ha in Netherlands(for a yield of 3.4 Mg/ha). Feeding these figuresinto our computational model (explained in the“Computational model” section) results in anEROEI of 2.67 for Poland and 2.26 for the Neth-erlands, which would confirm the better potentialfor efficient rapeseed biofuel production in Poland
compared to the Netherlands as suggested by thesuitability map of the IIASA (Fischer et al. 2002).
We should remember that there are a lot of uncer-tainties in doing these kinds of substitutions and gen-eralizations. After all for each individual farm we havea unique combination of ecological (soil quality, ter-rain, etc.), climatic (temperature, wind, soil moisture,etc.) and agricultural (sowing practice, applicationschedules for fertilizers and pesticides, harvesting,storage, etc.) conditions, which also translate intounique energy performance results. We can only ob-serve a general trend that more energy investment doesnot seem to result in more net energy produced. How-ever, locally, this conclusion may not hold.
If we take into account the energy quality issue, theuse of energies of other quality (say wind and solarelectricity) as input energy may make rapeseed biofuelstill an attractive product. For instance, assuming thatall energy conversion (CoE) expenses, as well as fer-tilizer (FE) and pesticide (PTE) production can all becovered by electricity derived from renewable sources(wind, solar, etc.) and limiting our EROEI estimatesonly to the liquid phase (biodiesel), we can get sub-stantially higher values of 31.3 in Poland and 16.2 inthe Netherlands. Optimizing the use of by- and wasteproducts can also contribute to a higher efficiency ofbiofuel production. All this can potentially make bio-diesel a viable alternative to fossil fuels.
Also, alternative uses of by- and waste products asenergy sources can produce savings on the energyinput side and boost the overall efficiency of theprocess in terms of a specific energy type (liquidfuels). There are a number of stages in the processwhere energy of a different type of quality can beused, which can make biofuels still a viable substituteat least for the transition period. However, withoutthose improvements and adjustments the future ofbiodiesel looks quite bleak.
Other important aspects that may determine theattractiveness of rapeseed biofuel is variability in cropyields (Fig. 4 and FAOSTAT 2011) and fluctuations inmarket prices (FAOSTAT 2011) for farmers as thesemay cause undesired fluctuations in the feedstockavailability. This is more or less related to the currentissues of indirect effects of biofuel productions onfood crops such as rapeseed.
Life cycle analyses are relaying on literature refer-ring to quantities of inputs and outputs including by-and waste products as well as conversion factors.
Fig. 5 Conceptual diagram of energy investment related toyield and EROEI
Energy Efficiency
Some of these references are already quite old, nottaking into account recent developments in produc-tion techniques or energy use. In this research, wehave conducted farmers’ interviews to extend anddouble check the data available from literature inattempt to improve the quantification of differentenergy inputs and outputs in rapeseed production.The relatively low number of responses of farmerswas, however, a factor that had to be taken intoaccount while interpreting the absolute EROEIfigures but the patterns observed are clear.
Like other researchers involved in EROEI as-sessments, we ran into the difficulty of unclearreporting on boundary conditions or methodologiesin various reports, which made comparison withother studies tricky.
Validation of energy efficiency in refining plantswas not possible as none of the contacted refinerieswanted to cooperate in this study. It seems they feelthat outcomes of studies like this one are not beneficialfor their business.
Conclusions
Our analysis has confirmed that, currently, EROEIof biodiesel production is quite low. Improving theenergy efficiency of rapeseed biodiesel is certainlycrucial if we want it to become a viable substitutefor fossil fuels such as oil and gas, which stillhave much higher EROEIs. It has been depictedthat different inputs and processes have differentimpacts on overall energy efficiency. The studyconcluded that fertilizer input, especially nitrogenfertilizer, could dramatically reduce efficiency ofbiodiesel production. The fact that it is still prof-itable for the farmers to apply large amounts offertilizers in attempt to increase the yield can meanonly that the current market prices for fertilizersdo not reflect their true energy cost. Again subsi-dies and failure to account for true environmentaland social costs of energy blur the picture andlead to distorted efficiencies. This is yet anotherreason why objective measures of energy efficien-cy, such as EROEI, are important to understandthe true picture.
Generally, we show that investing more energy toboost rapeseed yields in most cases results in lowerEROEI values. Of course, since output of biofuels
depends on the yield of the feedstock, increasingyields without substantial additional inputs of energy,for example by using manure instead of mineral fer-tilizers, can improve the EROEI of the process.
The fact that it is still profitable for the farmers toapply large amounts of fertilizers in attempt to increasethe yield can only mean that the current market pricesfor fertilizers do not reflect their true energy cost—another reason to evaluate sustainability of biofuelswith objective measures of energy efficiency, such asEROEI.
Searching for possibilities to use renewable energysources as input in rapeseed biofuel production andoptimizing the use of by- and waste products canresult in substantial savings on the energy input sideand boost the overall efficiency of the process.
Collecting data about actual on-farm practices andresulting crop yields is a challenge. Farmers do notoften respond to on-line questionnaires as they are toobusy or they do not see any benefit for themselves.However, updating conversion factors by includinginformation on what farmers actually do on their landand to which crop yield this leads, will definitelycontribute to more realistic bioenergy production effi-ciency figures.
Acknowledgments This study was enabled by Europeanfunding in the form of an Erasmus Mundus Scholarship forthe first author. We are highly indebted to the Polish and Dutchrapeseed farmers, who participated in this research. We alsowould like to thank Antoon Kleverkamp (Colzaco) and JoepHermans (Carnola) for their valuable information on rapeseedfarming and rapeseed biofuel production. Joanna Sopyło isacknowledged for translating the questionnaire into Polish andassisting in interviewing farmers during the study. A. Voinovwas partially supported by the BE2.0 (Bioenergy for Overijssel)project. We also thank the reviewers for their valuable com-ments on the manuscript.
References
Ajanovic, A. (2011). Biofuels versus food production: doesbiofuels production increase food prices? Energy, 36(4),2070–2076. doi:10.1016/j.energy.2010.05.019.
Arvidsson, R., Persson, S., Fröling, M., & Svanström, M.(2011). Life cycle assessment of hydrotreated vegetableoil from rape, oil palm and Jatropha. Journal of CleanerProduc t i on , 19 ( 2–3) , 129–137 . do i : 10 .1016 /j.jclepro.2010.02.008.
Baka, J., & Roland-Holst, D. (2009). Food or fuel? What Euro-pean farmers can contribute to Europe’s transport energy
Energy Efficiency
requirements and the Doha Round. Energy Policy, 37(7),2505–2513. doi:10.1016/j.enpol.2008.09.050.
Batchelor, S. E., Booth, E. J., & Walker, K. C. (1995).Energy analysis of rape methyl ester (RME) produc-tion from winter oilseed rape. Industrial Crops andProducts, 4(3), 193–202. doi:10.1016/0926-6690(95)00032-8.
Bernesson, S., Nilsson, D., & Hansson, P.-A. (2004). A limitedLCA comparing large- and small-scale production of rapemethyl ester (RME) under Swedish conditions. Biomassand Bioenergy, 26 (6 ) , 545–559. doi :10 .1016/j.biombioe.2003.10.003.
Bomb, C., McCormick, K., Deurwaarder, E., & Kåberger, T.(2007). Biofuels for transport in Europe: lessons fromGermany and the UK. Energy Policy, 35(4), 2256–2267.doi:10.1016/j.enpol.2006.07.008.
Börjesson, P. (2009). Good or bad bioethanol from a greenhousegas perspective—what determines this? Applied Energy, 86(5), 589–594. doi:10.1016/j.apenergy.2008.11.025.
Börjesson, P., Tufvesson, L., & Lantz, M. (2010). Life CycleAssessment of Biofuels in Sweden. http://www.miljo.lth.se/svenska/internt/publikationer_internt/pdf-filer/Re-port%2070%20-%20LCA%20of%20Biofuels%20(1).pdf.Report Number: 70, Lund University Department of Tech-nology and Society Environmental and Energy SystemsStudies. Accessed 18 May 2011.
Börjesson, P., & Tufvesson, L. M. (2011). Agricultural crop-based biofuels—resource efficiency and environmentalperformance including direct land use changes. Journal ofCleaner Production, 19(2–3), 108–120. doi:10.1016/j.jclepro.2010.01.001.
Brecha, R. J. (2008). Emission scenarios in the face of fossil-fuel peaking. Energy Policy, 36(9), 3492–3504.doi:10.1016/j.enpol.2008.05.023.
Bureau, J. C., Disdier, A. C., Gauroy, C., & Treguer, D. (2010).A quantitative assessment of the determinants of the netenergy value of biofuels. Energy Policy, 38(5), 2282–2290.doi:10.1016/j.enpol.2009.11.089.
Campbell, A., & McCurdy, M. (2008). Primary Energy andGreenhouse Gas Emissions from Biodiesel Made fromSouthland Rapeseed.: Report No. 08–11583. CRL EnergyLtd. Lower Hutt, New Zealand.
Cherubini, F., Bird, N. D., Cowie, A., Jungmeier, G.,Schlamadinger, B., & Woess-Gallasch, S. (2009).Energy- and greenhouse gas-based LCA of biofueland bioenergy systems: key issues, ranges and recom-mendations. Resources, Conservation and Recycling,53(8), 434–447.
Cherubini, F., & Strømman, A. H. (2011). Life cycle assessmentof bioenergy systems: state of the art and future challenges.Bioresource Technology, 102(2), 437–451. doi:10.1016/j.biortech.2010.08.010.
Cleveland, C. J. (2008). Energy return on investment (EROI). InC. J. Cleveland (Ed.), Encyclopedia of the Earth. Wash-ington: National Council for Science and the Environment(NCSE).
Crutzen, P. J., Mosier, A. R., Smith, K. A., & Winiwarter, W.(2008). N2O release from agro-biofuel production negatesglobal warming reduction by replacing fossil fuels. Atmo-spheric Chemistry and Physics, 8(2), 389–395.doi:10.5194/acp-8-389-2008.
Davis, S. C., Anderson-Teixeira, K. J., & DeLucia, E. H. (2009).Life-cycle analysis and the ecology of biofuels. Trends inPlant Science, 14(3), 140–146.
Demirbas, A. (2008). Biofuels sources, biofuel policy, biofueleconomy and global biofuel projections. Energy Conver-sion and Management, 49(8), 2106–2116. doi:10.1016/j.enconman.2008.02.020.
Downs, H.W., & Hansen, R.W. (1998). Estimating Farm FuelRequirements. Colorado State University Extension. FactSheet No. 5.006, www.ext.colostate.edu. Accessed 22 Jan-uary, 2013.
EIA U.S. Energy Information Administration (2010). Interna-tional Energy Outlook 2010—Highlights. Report DOE/EIA-0484(2010) U.S. Energy Information Administration.Washington, USA.
European Biodiesel Board (2011). What is biodiesel? http://www.ebb-eu.org/biodiesel.php#whatis. Accessed 17 May2011.
European Commission (2005). PURSUANT TO ARTICLE 4(1)OF DIRECTIVE 2003/30/EC: on the promotion of the useof biofuels or other renewable fuels for transport. Brussels,Belgium.
FAOSTAT (2011). Data related to Food and Agriculture (2011).FAO. http://faostat.fao.org/. Accessed 20 May 2011.
Farrell, A. E., Plevin, R. J., Turner, B. T., Jones, A. D., O’Hare,M., & Kammen, D. M. (2006). Ethanol can contribute toenergy and environmental goals. Science, 311(5760), 506–508. doi:10.1126/science.1121416.
Fischer, G., van Velthuizen, H., Shah, M., & Nachtergaele, F.(2002). Global Agro-ecological Assessment for Agricul-ture in the 21st Century: Methodology and Results. ReportRR-02-02. International Institute for Applied SystemsAnalysis (IIASA) in collaboration with FAO. Laxenburg,Austria.
Gärtner, S. O., & Reinhardt, G. A. (2003). Life Cycle Assess-ment of biodiesel: update and new aspects. Heidelberg,Germany: Institute for Energy and Environmental Re-search (IFEU).
Grisso, R., Perumpral, J.V., Vaughan, D., Roberson, G.T., &Pitman, R. (2010). Predicting Tractor Diesel Fuel Con-sumption. Virginia Cooperative Extension, PUBLICA-TION 442–073.
Hall, C., Balogh, S., & Murphy, D. (2009). What is the mini-mum EROI that a sustainable society must have? Energies,2(1), 25–47.
Halleux, H., Lassaux, S., Renzoni, R., & Germain, A. (2008).Comparative life cycle assessment of two biofuels ethanolfrom sugar beet and rapeseed methyl ester. InternationalJournal of Life Cycle Assessment, 13(3), 184–190.doi:10.1065/Ica2008.03.382.
Hammond, G. P., Kallu, S., & McManus, M. C. (2008).Development of biofuels for the UK automotive mar-ket. Applied Energy, 85(6), 506–515. doi:10.1016/j.apenergy.2007.09.005.
Horne, R., Grant, T., & Verghese, K. (2009). Life cycle assess-ment; principles, practice and prospects. Australia:CSIRO.
ISO 14040 (2006). Environmental management—Life cycleassessment—Principles and framework. Geneva, Switzer-land: International Organization for Standardization,Switzerland.
Energy Efficiency
ISO 14044 (2006). Environmental management—Life cycleassessment—Requirements and guidelines. Geneva, Swit-zerland: International Organization for Standardization,Switzerland.
Janulis, P. (2004). Reduction of energy consumption in biodieselfuel life cycle. Renewable Energy, 29(6), 861–871.doi:10.1016/j.renene.2003.10.004.
Jenssen T.K., & Kongshaug G. (2003). Energy consumption andgreenhouse gas emissions in fertiliser production. Proceed-ings No. 509. Paper presented to The InternationalFertiliser Society at a Meeting in London, on 3rd April2003. The International Fertiliser Society, York, UnitedKingdom. ISBN 0 85310 145 0. ISSN 1466–1314.www.fertiliser-society.org.
Johnston, M., Foley, J. A., Holloway, T., Kucharik, C., &Monfreda, C. (2009). Resetting global expectations fromagricultural biofuels. [doi: 10.1088/1748-9326/4/1/014004]. Environmental Research Letters, 4(1).
Kavalov, B. (2004). Biofuel potentials in the EU. TechnicalReport Series, EUR21012.: European Commission JointResearch Center.
Kutas, K., Lindberg, C., & Steenblik, R. (2007). Biofuels: AtWhat Cost? Government Support for Ethanol and Biodie-sel in the European Union. Report for the Global SubsidiesInitiative (GSI) of the International Institute for Sustain-able Development (IISD) Geneva, Switzerland.
Lewis, C. A. (1997). Fuel and Energy Production EmissionFactors. MEET Project: Methodologies for Estimating AirPollutant Emissions from Transport. Task No 3.4.Deloverable No. 20. Didcot, UK.: AEA Technology plc.
Mc Alister, S., & Horne, R. (2009). Climate change responses:carbon offsets, biofuels and the life cycle assessment con-tribution. In T. Grant, R. Horne, & K. Verghese (Eds.), Lifecycle assessment: principles, practice and prospects. Aus-tralia: CSIRO.
Molenaar, K. (2007). Promotion plan for the Field Fact project.PPO. http://www.fieldfact.com/LinkClick.aspx?fileticket=ZTHNdEnbZqE%3D&tabid=588&mid=1307. Accessed 9December 2012.
Mortimer, N. D., Cormack, P., Elsayed, M. A., & Horne, R. E.(2003). Evaluation of the comparative energy, globalwarming and socio-economic costs and benefits of biodie-sel. Sheffield: Resources research unit, School of
Environment and Development, Sheffield Hallam Univer-sity. Final Report.
Mulder, K., & Hagens, N. J. (2008). Energy return on invest-ment: toward a consistent framework. Ambio, 37(2), 74–79.
Murphy, D. J., & Hall, C. A. S. (2010). Year in review—EROIor energy return on (energy) invested. Annals of the NewYork Academy of Sciences, 1185(1), 102–118. doi:10.1111/j.1749-6632.2009.05282.x.
Murphy, R., Woods, J., Black, M., & McManus, M. (2011).Global developments in the competition for land frombiofuels. Food Policy, 36, S52–S61. doi:10.1016/j.foodpol.2010.11.014.
Nanaki, E. A., & Koroneos, C. J. (2009). Comparative LCAof the use of biodiesel, diesel and gasoline for trans-portation. Paper presented at the 1st InternationalExergy, Life Cycle Assessment, and SustainabilityWorkshop & Symposium (ELCAS), 4–6 June, 2009,Nisyros, Greece.
Netherlands Environmental Assessment Agency (2010). Seriousindirect effects of some biofuels on global biodiversity andgreenhouse gas emissions. http://www.pbl.nl/en/news/pressreleases/2010/20100531-Serious-indirect-effects-of-some-biofuels-on-global-biodiversity-and-greenhouse-gas-emissions. Accessed 12 May 2011.
Thamsiriroj, T., & Murphy, J. D. (2010). Can rapeseed biodieselmeet the European Union sustainability criteria forbiofuels? Energy & Fuels , 24 (3) , 1720–1730.doi:10.1021/ef901432g.
The Offshore Valuation Group The Offshore Valuation (2010).A valuation of the UK’s offshore renewable energy re-source. Public Interest Research Centre. Public InterestResearch Centre, Machynlleth, Wales, UK. http://offshorevaluation.org/downloads/offshore_valuation_full.pdf. Accessed 9 December 2012.
VROM (2010). Biofuels. http://international.vrom.nl/pagina.html?id=37483. Accessed 15 October 2010.
Wu, J. Y., & Sardo, V. (2010). Sustainable versus organicagriculture. In: Sociology, Organic Farming, ClimateChange and Soil Science. [doi: 10.1007/978-90-481-3333-8_3]. Sustainable Agriculture Reviews 3, eds. E.Lichtfouse, 41–76. Dordrecht, Netherlands: SpringerScience+Business Media B.V.
Energy Efficiency