Embed Size (px)
Citation preview

Energy consumption feedback to users: lessons learnt from pilot cases in social housing and tertiary buildings
Pascale BRASSIER
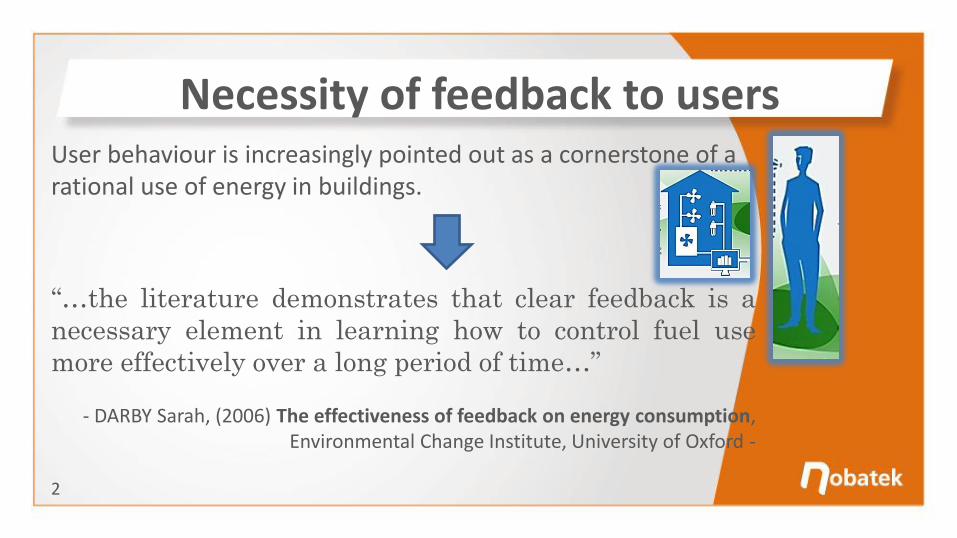
“…the literature demonstrates that clear feedback is a
necessary element in learning how to control fuel use
more effectively over a long period of time…”
- DARBY Sarah, (2006) The effectiveness of feedback on energy consumption, Environmental Change Institute, University of Oxford -
Necessity of feedback to users
2
User behaviour is increasingly pointed out as a cornerstone of a rational use of energy in buildings.
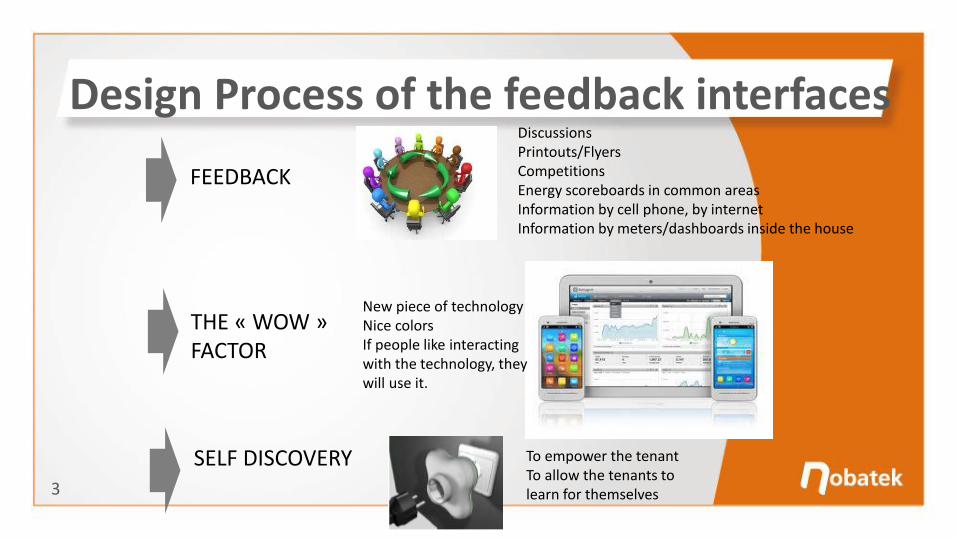
Design Process of the feedback interfaces
3
FEEDBACK
THE « WOW » FACTOR
SELF DISCOVERY To empower the tenant To allow the tenants to learn for themselves
Discussions Printouts/Flyers Competitions Energy scoreboards in common areas Information by cell phone, by internet Information by meters/dashboards inside the house
New piece of technology Nice colors If people like interacting with the technology, they will use it.
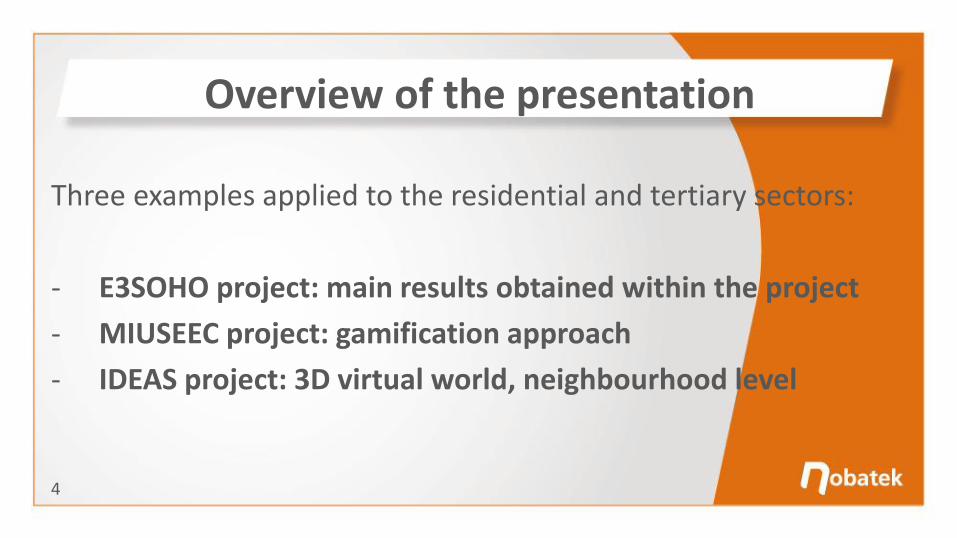
Three examples applied to the residential and tertiary sectors:
- E3SOHO project: main results obtained within the project
- MIUSEEC project: gamification approach
- IDEAS project: 3D virtual world, neighbourhood level
Overview of the presentation
4

- EU CIP-PSP projects dedicated to the energy efficiency in Social Housing, Competitiveness and Innovation framework Programme
- Emphasis on Energy Awareness tools and services for tenants and building owners/managers
- Aims: Implement and demonstrate an integrated and replicable ICT-based solution targeting a 25% reduction of energy consumption by providing tenants with feedbacks on consumption
- February 2010 – End of Octobre 2013
E3SOHO project
5 www.e3soho.eu The E3SOHO Collaborative Project (Grant Agreement No. CIP-250497) was co-funded by the European Commission under the ICT Policy Support Programme (ICT-PSP) part of the Competitiveness and Innovation framework Program (CIP).

OBJECTIVES • Apply already existing
approaches applicable to social housing companies, and determine a method for assessing the energy performance
• Development of a methodology for flexible implementation that could be adapted to local conditions and future policies
• The methodology will serve as a baseline for developing future services
Methodology
6
DES
IGN
IMP
LEM
ENTA
TIO
NM
ON
ITO
RIN
G

•Warsaw (Poland)
•Zaragoza (Spain)
•Genoa (Italy)
Pilot sites
7
Zaragoza vivienda, 2002, 16 (/total 43) dwellings
City of Warsaw, 2007, 16 (/total 48) dwellings
Comune di Genova, 1980-1990, 30 (/total 43) dwellings

Tools developed for tenants
8
Screenshot of VAS interface for tenants used in Warsaw (English version)
Screenshot of sDisplay interface for tenants used in Zaragoza (Spanish version)
Monthly targets, Advices, Smart Alerts
Comfort data • Temperature • Humidity
Historical data Energy consumption information • Electricity (global and partial) • Hot/cold water • Heating

Deployment process
9
-ICT solution has been successfully deployed in 62 dwellings
-Comprehensive training program for social housing tenants has been designed, aimed at increasing awareness on efficient and rational use of energy at domestic level, and getting them familiar with the use of the E3SoHo ICT solution
-Training program complemented with follow-up individual and collective sessions for maintaining users’ engagement and providing technical assistance
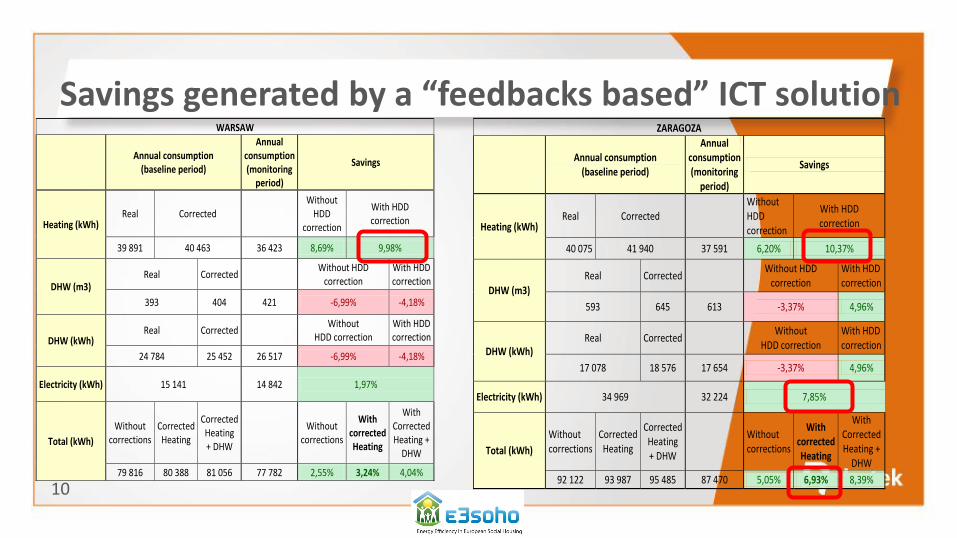
Savings generated by a “feedbacks based” ICT solution
10
WARSAW
Annual consumption (baseline period)
Annual consumption (monitoring
period)
Savings
Heating (kWh) Real Corrected
Without HDD
correction
With HDD correction
39 891 40 463 36 423 8,69% 9,98%
DHW (m3) Real Corrected
Without HDD
correction With HDD correction
393 404 421 -6,99% -4,18%
DHW (kWh) Real Corrected
Without
HDD correction With HDD correction
24 784 25 452 26 517 -6,99% -4,18%
Electricity (kWh) 15 141 14 842 1,97%
Total (kWh)
Without corrections
Corrected Heating
Corrected Heating + DHW
Without
corrections
With corrected Heating
With Corrected Heating +
DHW
79 816 80 388 81 056 77 782 2,55% 3,24% 4,04%
ZARAGOZA
Annual consumption (baseline period)
Annual consumption (monitoring
period)
Savings
Heating (kWh) Real Corrected
Without HDD correction
With HDD correction
40 075 41 940 37 591 6,20% 10,37%
DHW (m3)
Real Corrected Without HDD
correction With HDD correction
593 645 613 -3,37% 4,96%
DHW (kWh) Real Corrected
Without HDD correction
With HDD correction
17 078 18 576 17 654 -3,37% 4,96%
Electricity (kWh) 34 969 32 224 7,85%
Total (kWh)
Without corrections
Corrected Heating
Corrected Heating + DHW
Without corrections
With corrected Heating
With Corrected Heating +
DHW
92 122 93 987 95 485 87 470 5,05% 6,93% 8,39%

Savings generated by a “feedbacks based” ICT solution
11
Saving potential Savings realized by the savers only in each pilot site
Warsaw Zaragoza
Heating 25.4% 27.1%
DHW 8.4% 20.1%
Electricity 17.5% 19.3%
Rough evaluation of the potential of the implemented ICT system when used at 100% in a building

-Difficulties for ICT system evaluation: savings are on the same range as “natural evolutions” or typical saving measures, or influence of the awareness itself;
-High levels of residual consumption have been detected (consumption on stand-by) and should be addressed to train tenants on its importance and on how to avoid it.
-Important energy savings opportunities (potential) detected in the three pilots: from the large discrepancies between dwellings in consumption profiles of similar dwellings (in terms of consumption per surface, per occupant and from indoor temperature levels (pre-monitoring));
Lessons learnt
12
> Innovative metrology of usages for energy sobriety and eco-behaviours.
> Partners
> Financial support: Aquitaine regional government
> From April 2013 to April 2015
MIUSEEC project
13
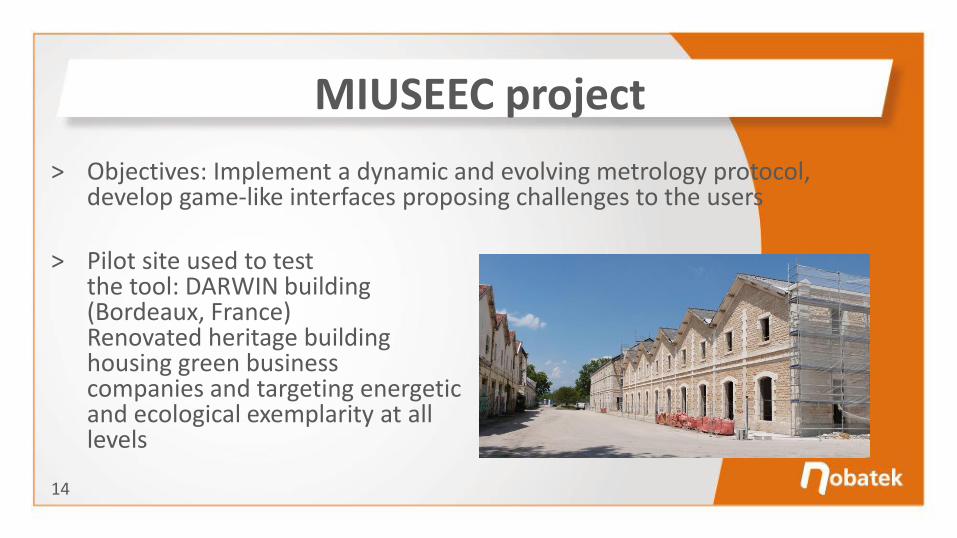
> Objectives: Implement a dynamic and evolving metrology protocol, develop game-like interfaces proposing challenges to the users
> Pilot site used to test the tool: DARWIN building (Bordeaux, France) Renovated heritage building housing green business companies and targeting energetic and ecological exemplarity at all levels
MIUSEEC project
14

An innovative approach
15
Collective awareness and commitments
GREEN LEASE
Detailed metrology of the usages and
intuitive restitution BMS AND App
DATAVISUALISATION
Playful stimulation of behavioural
changes GAMIFICATION
Decrease of the ecological footprint
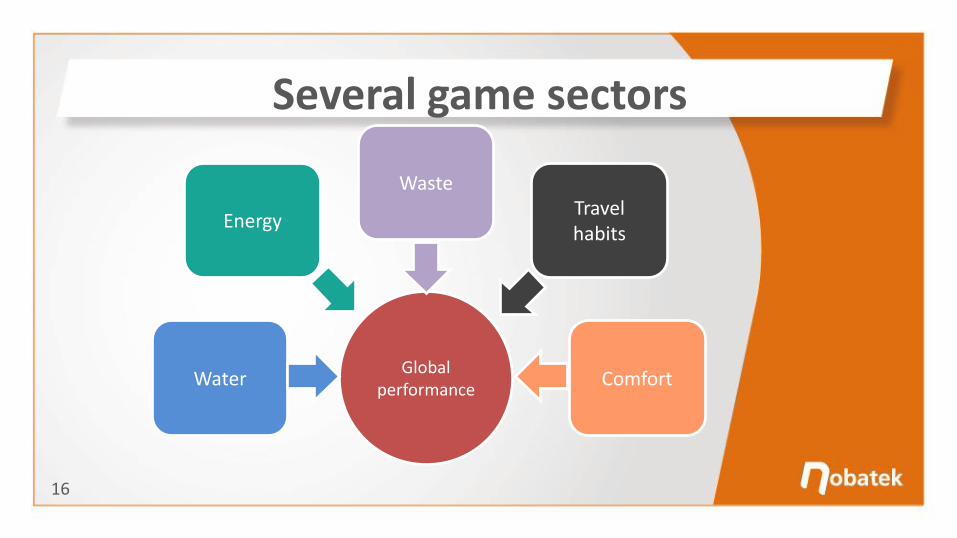
Several game sectors
16
Global performance
Energy
Waste Travel habits
Comfort Water
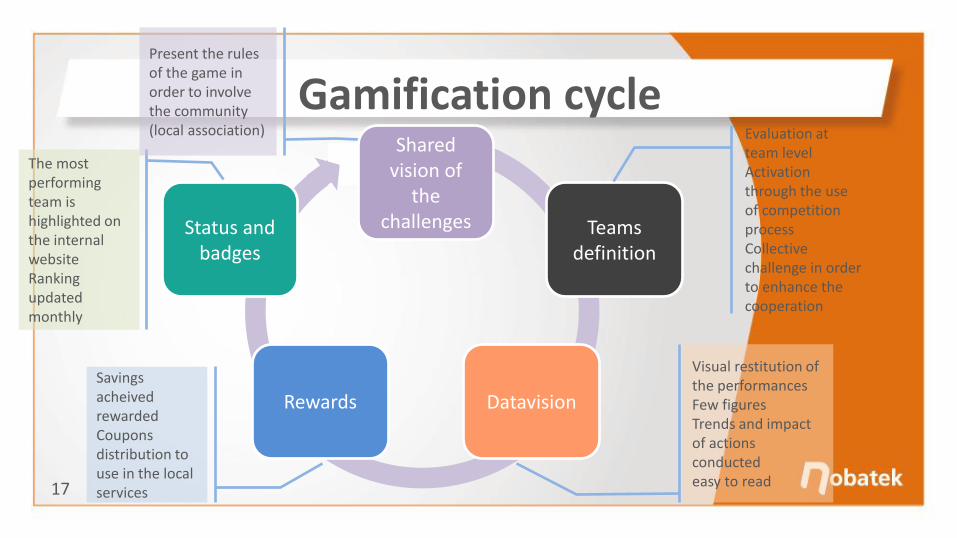
Gamification cycle
17
Status and badges
Teams definition
Datavision Rewards
The most performing team is highlighted on the internal website Ranking updated monthly
Savings acheived rewarded Coupons distribution to use in the local services
Visual restitution of the performances Few figures Trends and impact of actions conducted easy to read
Evaluation at team level Activation through the use of competition process Collective challenge in order to enhance the cooperation
Present the rules of the game in order to involve the community (local association)
Shared vision of
the challenges
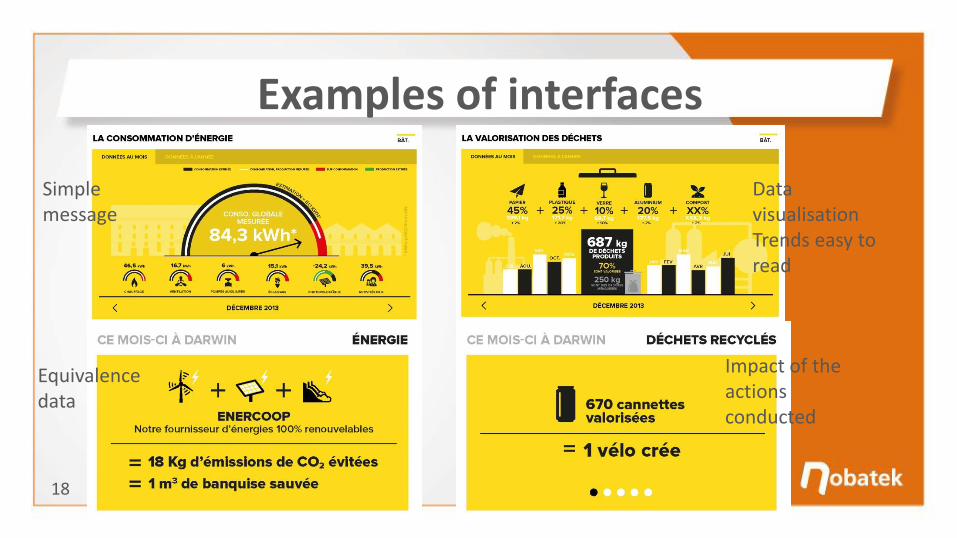
Examples of interfaces
18
Simple message
Equivalence data
Data visualisation Trends easy to read
Impact of the actions conducted

IDEAS project
19
Intelligent neighbourhooD Energy Allocation & Supervision
EU FP7 funded R&D project Nov 2012 – Oct 2015
Acknowledgements: The IDEAS Collaborative Project (Grant Agreement No. 600071) is co-funded by the European Commission, Information Society and Media Directorate-General, under the Seventh Framework Programme (FP7), Cooperation theme three, “Information and Communication Technologies”
www.ideasproject.eu
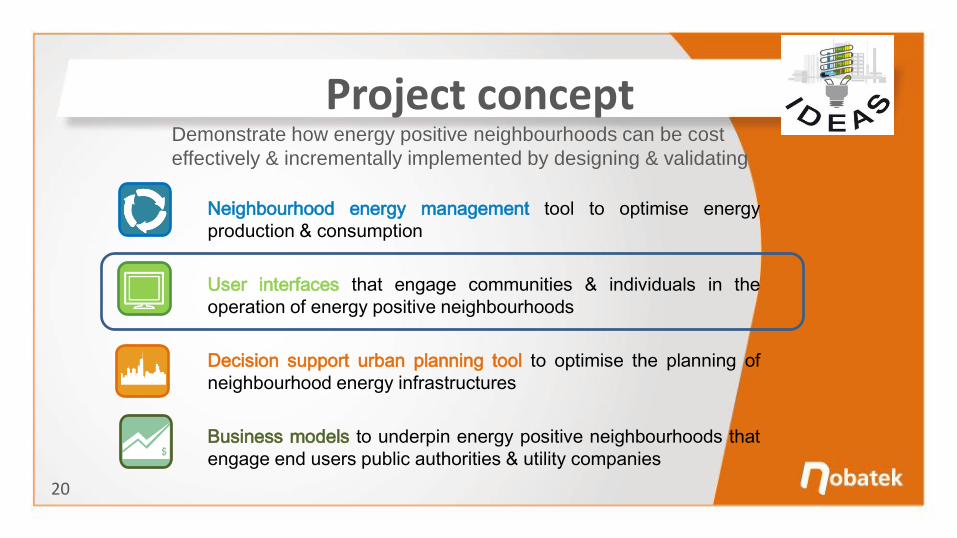
Project concept
20
Demonstrate how energy positive neighbourhoods can be cost
effectively & incrementally implemented by designing & validating
Neighbourhood energy management tool to optimise energy
production & consumption
User interfaces that engage communities & individuals in the
operation of energy positive neighbourhoods
Decision support urban planning tool to optimise the planning of
neighbourhood energy infrastructures
Business models to underpin energy positive neighbourhoods that
engage end users public authorities & utility companies
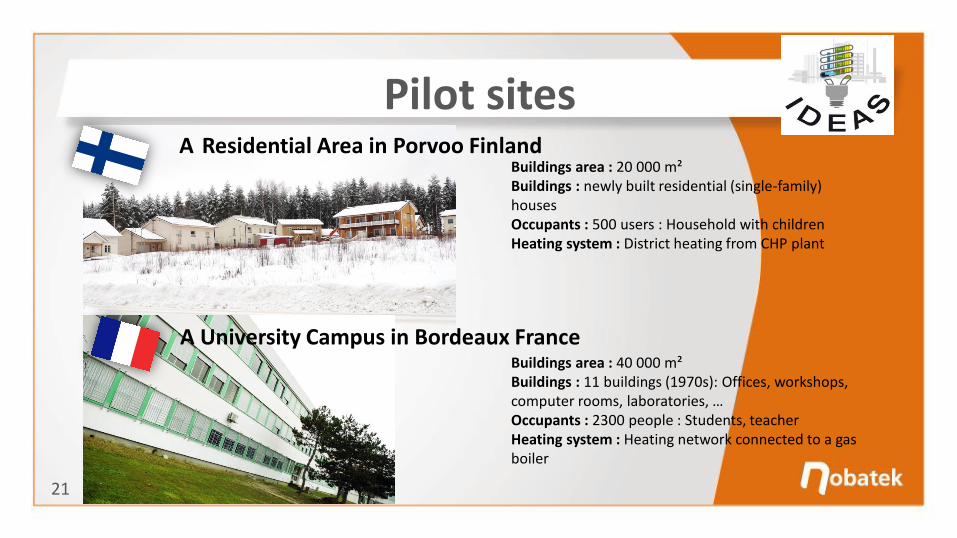
Pilot sites
21
A Residential Area in Porvoo Finland Buildings area : 20 000 m² Buildings : newly built residential (single-family) houses Occupants : 500 users : Household with children Heating system : District heating from CHP plant
A University Campus in Bordeaux France Buildings area : 40 000 m² Buildings : 11 buildings (1970s): Offices, workshops, computer rooms, laboratories, … Occupants : 2300 people : Students, teacher Heating system : Heating network connected to a gas boiler
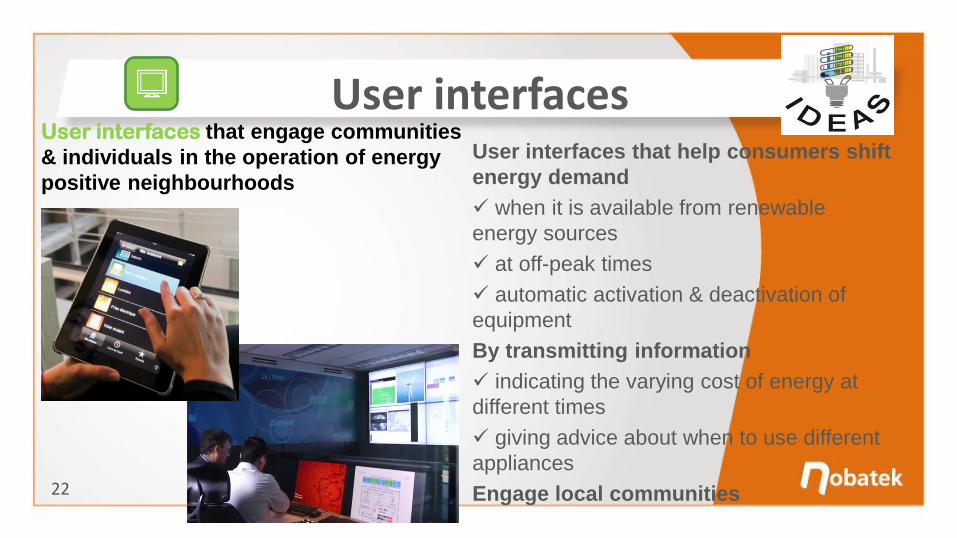
User interfaces
22
User interfaces that help consumers shift
energy demand
when it is available from renewable
energy sources
at off-peak times
automatic activation & deactivation of
equipment
By transmitting information
indicating the varying cost of energy at
different times
giving advice about when to use different
appliances
Engage local communities
User interfaces that engage communities
& individuals in the operation of energy
positive neighbourhoods

Tools developed for the IUT site
23
Educational 3D virtual space
Realistic environment in order to involve the
students
Replica of the real IUT site
Based on the OpenSim technology
Large screens installed on site
in strategic locations
Both interfaces are based on
a monitoring system
collecting the consumption
data
3D Virtual tool
24
> Inform the users about the stakes related to energy consumptions at the site scale
> Present the energy production systems which could be integrated on site
> Illustrate the operating conditions of Energy Positive Neighbourhood thanks to a balance-sheet including the real consumptions measured on site: – Real consumptions measured on site
– Simulated energy produced thanks to virtual systems based on simulation
3D Virtual tool
25
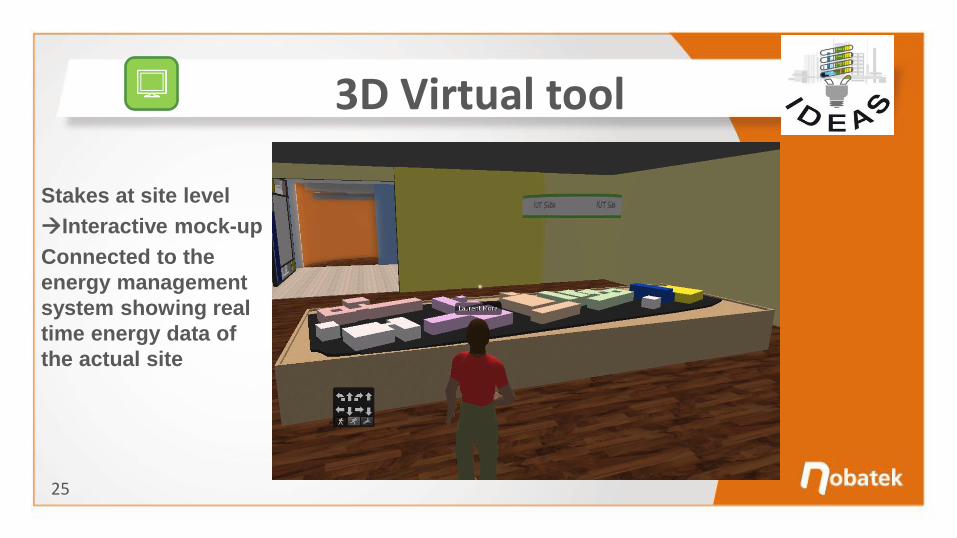
Stakes at site level
Interactive mock-up
Connected to the
energy management
system showing real
time energy data of
the actual site
3D Virtual tool
26
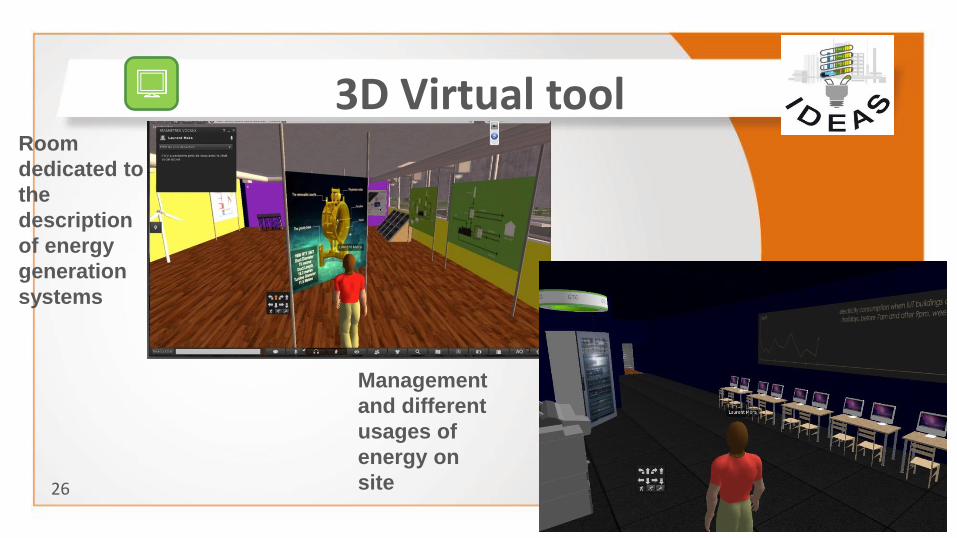
Room
dedicated to
the
description
of energy
generation
systems
Management
and different
usages of
energy on
site
3D Virtual tool
27
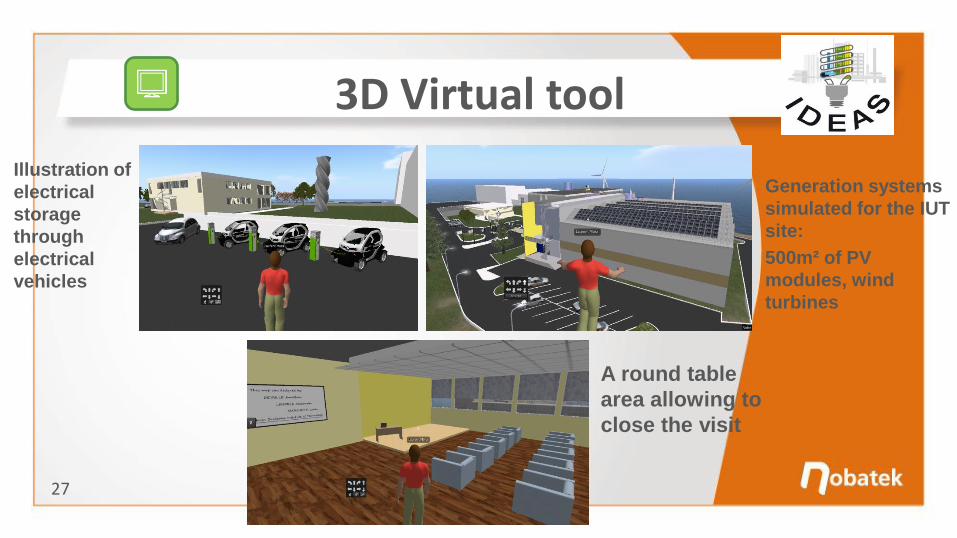
Illustration of
electrical
storage
through
electrical
vehicles
Generation systems
simulated for the IUT
site:
500m² of PV
modules, wind
turbines
A round table
area allowing to
close the visit
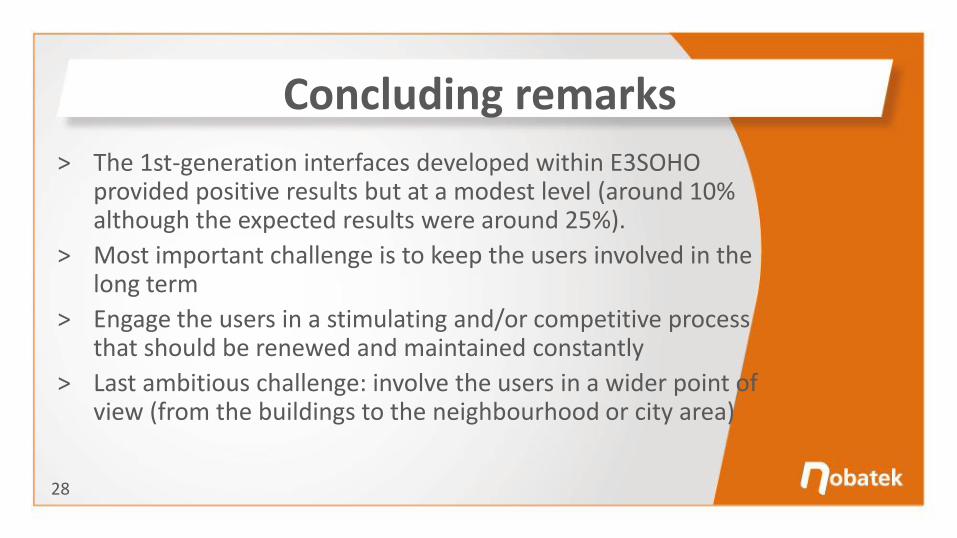
Concluding remarks
28
> The 1st-generation interfaces developed within E3SOHO provided positive results but at a modest level (around 10% although the expected results were around 25%).
> Most important challenge is to keep the users involved in the long term
> Engage the users in a stimulating and/or competitive process that should be renewed and maintained constantly
> Last ambitious challenge: involve the users in a wider point of view (from the buildings to the neighbourhood or city area)
Thank you !
Acknowledgments The E3SOHO Collaborative Project (Grant Agreement No. CIP-250497) was co-funded by the European Commission under the ICT Policy Support Programme (ICT-PSP) part of the Competitiveness and Innovation framework Program (CIP). The IDEAS Collaborative Project (Grant Agreement No. 600071) is co-funded by the European Commission, Information Society and Media Directorate-General, under the Seventh Framework Programme (FP7), Cooperation theme three, “Information and Communication Technologies” The MIUSEEC project is financed by the Conseil Régional d’Aquitaine. The authors wish to acknowledge the Conseil Régional d’Aquitaine for their support, the efforts of the partners and the contributions of all those involved in MIUSEEC.