Embed Size (px)
Citation preview
14/05/2015
1
Riccardo Gori, Giacomo Bellandi, Cecilia Caretti, Claudio Lubello
Civil and Environmental Engineering Dept. - University of Florence (Italy)
Energy consumption and
greenhousegases production in
WWTPs
Activated sludge: 100 plus 1 years - New trends and
perspectives
Palermo, Italy | 11 May 2015
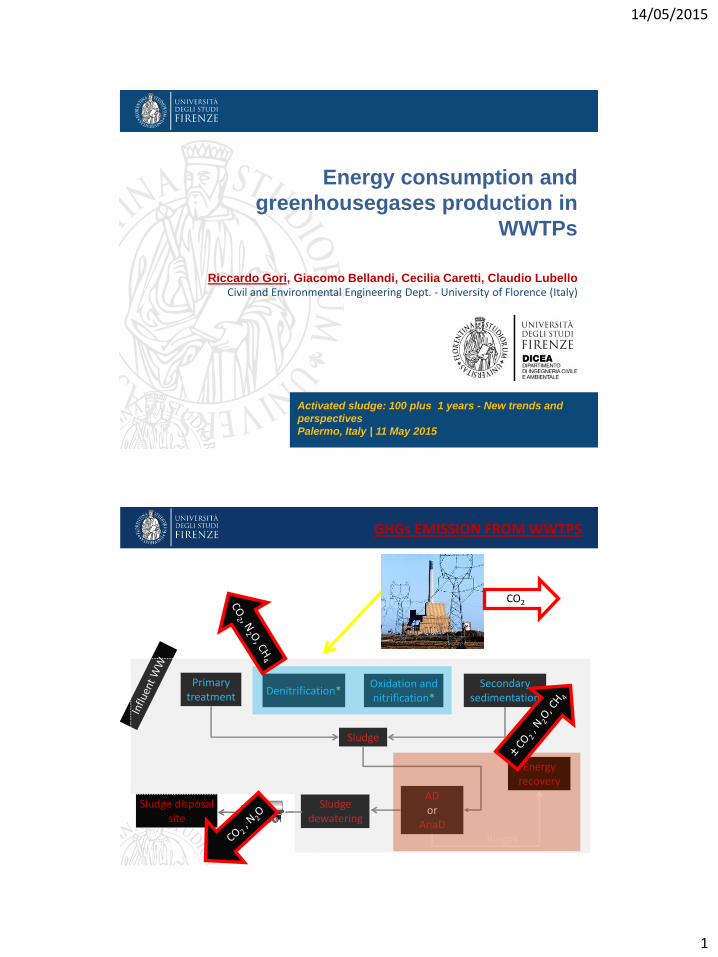
Primary treatment
Denitrification* Oxidation and nitrification*
Secondary sedimentation
Sludge dewatering
AD or
AnaD
Sludge disposal site
Excess sludge Sludge
Primary sludge
Energy recovery
Biogas
CO2
GHGs EMISSION FROM WWTPS
14/05/2015
2
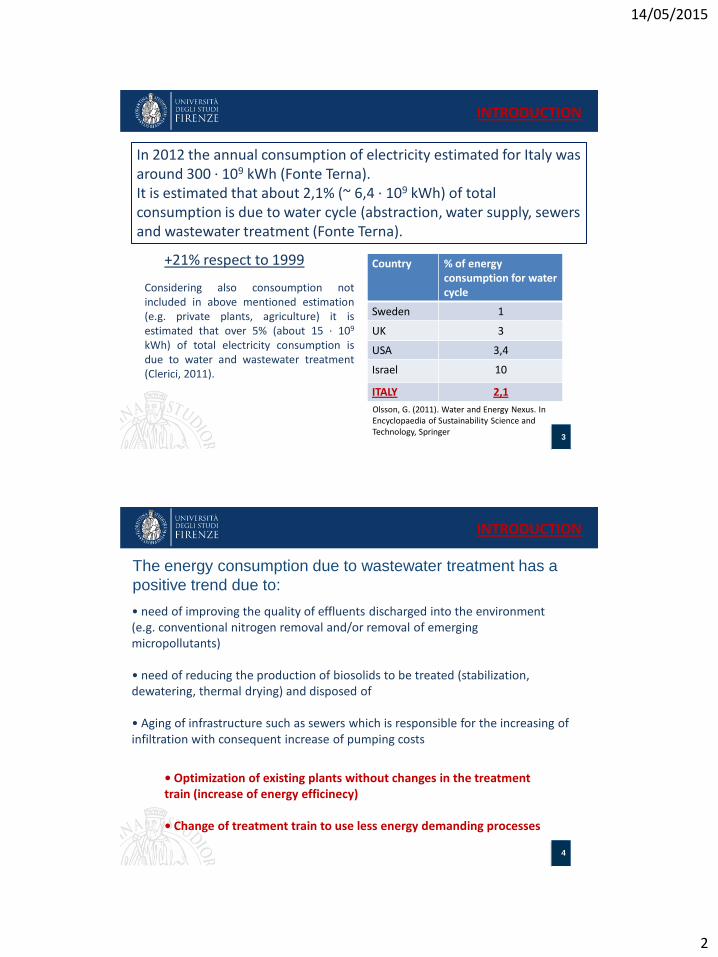
In 2012 the annual consumption of electricity estimated for Italy was around 300 ∙ 109 kWh (Fonte Terna). It is estimated that about 2,1% (~ 6,4 ∙ 109 kWh) of total consumption is due to water cycle (abstraction, water supply, sewers and wastewater treatment (Fonte Terna).
INTRODUCTION
Olsson, G. (2011). Water and Energy Nexus. In Encyclopaedia of Sustainability Science and Technology, Springer
+21% respect to 1999
Considering also consoumption not included in above mentioned estimation (e.g. private plants, agriculture) it is estimated that over 5% (about 15 ∙ 109 kWh) of total electricity consumption is due to water and wastewater treatment (Clerici, 2011).
Country % of energy consumption for water cycle
Sweden 1
UK 3
USA 3,4
Israel 10
ITALY 2,1
3
The energy consumption due to wastewater treatment has a
positive trend due to:
4
• need of improving the quality of effluents discharged into the environment (e.g. conventional nitrogen removal and/or removal of emerging micropollutants) • need of reducing the production of biosolids to be treated (stabilization, dewatering, thermal drying) and disposed of • Aging of infrastructure such as sewers which is responsible for the increasing of infiltration with consequent increase of pumping costs
• Optimization of existing plants without changes in the treatment train (increase of energy efficinecy) • Change of treatment train to use less energy demanding processes
4
INTRODUCTION

14/05/2015
3
Centralization of wastewater treatment (to be verified) Larger plants are characterized by lower specifci energy consumpotion : - On average 22 kWh/a.e. per year in the range 30.000 - 1.100.000 p.e. - On average 43 kWh/a.e. per year in the range <30.000 p.e. • installation of VFD are use of high efficiency devices • anaerobic digestion of sludge eventually coupled to pre-treatment aimed at increasing biogas production; • in case of anaerobic digetion of sludge use cogeneration for electricity and heat recovery from biogas;
Possible interventions:
5
INTRODUCTION
• In conventional activated sludge plants, energy demand is largely dominated by the aeration. Considerable savings are possible by optimising its design and operation;
• The energy consumption of aeration systems depends on the efficiency of its components, the characteristics of wastewater and operating conditions of the plant;
• It is therefore necessary to perform a series of measurements to verify the aeration system's behaviour in process conditions;
• Also estimation and reduction of both direct and indirect GHGs emitted by WWTPs is of great concern.
This research aimed at using off-gas testing method for: - monitoring and improving oxygen transfer efficiency in a large
WWTP located in Florence (Tuscany, Italy); - monitoring GHG’s emission from the oxidation tank of the plant.
ENERGETIC CONSPUMPTION OF AERATION

14/05/2015
4
Optimization of aeration system devices: - Compartimentalized aeration; - Intermittent aeration; - DO control in aerobic tanks (1-2 mg/l)
Highr DO values are responsible for : The increase in the energy required for oxygen transfer from
the gas to the liquid phase (reduction of OTE) The reduction of sludge settling velocity A negative impact on the anoxic zone aimed at nitrogen
removal (denitrificatrion)
7
WT
S
pwTSAIR
AIR
C
DOCSOTE
P
Q
P
OTEQ
P
OTRAE
20
20,
,2
2
O
O
ENERGETIC CONSPUMPTION OF AERATION
Optimization of aeration system devices: - Compartimentalized aeration; - Intermittent aeration; - DO control in aerobic tanks (1-2 mg/l)
Highr DO values are responsible for : The increase in the energy required for oxygen transfer from
the gas to the liquid phase (reduction of OTE) The reduction of sludge settling velocity A negative impact on the anoxic zone aimed at nitrogen
removal (denitrificatrion)
WEF and ASCE estimate that an effcient and strict control of DO in aerobic tanks can allow a 10-30 %
savings of total energy consumption in wastewater treatment
8
ENERGETIC CONSPUMPTION OF AERATION

14/05/2015
5
η
0.8 2.2 kgO2/kWh (S.A.E.) 0.6 1.5 kgO2/kWh (A.E.)
3.4 5 kgO2/kWh (S.A.E.) 1.5 2.8 kgO2/kWh (A.E.)
2.3 3.6 kgO2/kWh (S.A.E.) 1.2 1.9 kgO2/kWh (A.E.)
Mechanical aerators
Tubular diffusers
Fine-bubble diffusers
9
ENERGETIC CONSPUMPTION OF AERATION
Mass balance of oxygen in gas phase
Oxygen transferred to the liquid phase = oxygen removed from the gas phase
The off-gas method is a tecnique developed for monitoring the oxygen transfer efficiency of air diffused aeration systems (Redmon et al., 1983).
OFF-GAS TEST

14/05/2015
6
5. Off-gas analyzer
1. Hood for off-gas collection 2. Connection pipe between the hood and the analyzer
3. LDO probe 4. Oxymeter
OFF-GAS TEST
Off-gas analyzer
- Measurement of oxygen concentration in air (Reference) and in the off-gas
- Measurement of the off-gas flow rate collected from the hood
OFF-GAS TEST

14/05/2015
7
CALCULATED AND ESTIMATED PARAMETERS:
Transfer efficiency in process conditions (OTE, %):
Cs,20: saturation concentration @ 20°
Cs,pwT: saturation concentration @ process conditions
β = 1- (0.01 TDS)/1000 α = αSOTE/SOTE
Transfer efficiency in standard conditions in process water (αSOTE, %):
α-factor:
oxygen transfer rate (OTR, KgO2/h):
Aeration efficiency (AE, Kg02/kWh):
AE = OTR/P
OFF-GAS TEST
Pre-treatments
Secondary treatment: - pre-denitirification - oxidation-nitrification
Secondary settling
Excess sludge to treatment
Sludge recirculation
Potenzialità 600000 P.E.
Portata in ingresso 240000 m3/d
Età del fango 20-30 d
WW
fro
m F
lore
nce
Arn
o r
iver
Parameter Unit IN* OUT*
N-NH4+ mg/l 19.4 0.51
N-NO2- mg/l - n.d.
N-NO3- mg/l - 6.8
Ntot mg/l 19.9 8.4
BOD mg/l 48.3 3.6
COD mg/l 145.6 16.8
P mg/l 2.42 1.71
SST mg/l 94.6 4.9
San Colombano WWTP

14/05/2015
8
Microforated disks ABS PIK 300® Area of diffuser = 0.06 m2
Diffusers/line = 1305
AERATION SYSTEM
Diffusers density
Diffusers
Diffusers density
Diffusers
Diffusers density
Diffusers
San Colombano WWTP
IN OUT
Air flow rate management was shifted from a DO set-point control to an ammonia-DO cascade control
BEFORE: Air flow rate managed on the basis of DO set-point
AFTER: Air flow rate managed on the basis of N-NH4
+ in the effluent and DO set-point
IMPROVEMENT OF AIR FLOW RATE CONTROL

14/05/2015
9
DO set-point control
OTE ≈22-30%
ammonia-DO cascade control
OTE ≈24-35%
The new strategy for air flow rate control allowed to reduce the average DO concentration in the oxidation tank which in turn allowed to increase the oxygen transfer efficiency
Comparison of OTE between the two different strategies
IMPROVEMENT OF AIR FLOW RATE CONTROL
DO AE
WT
S
pwTSAIR
AIR
C
DOCSOTE
P
Q
P
OTEQ
P
OTRAE
20
20,
,2
2
O
O
As a consequence the aeration efficiency improved as well:
For the S. Colombano WWTP, a relative increase of 10% in terms of OTE allows to save about 500MWh/y which means 75000 euro/y
IMPROVEMENT OF AIR FLOW RATE CONTROL
203.000 kgCO2,eq/y (@ 0,406 kgCO2,eq/kWh)

14/05/2015
10
SMALL WWTP
Currently there is a rectangular single tank in which takes place both oxidation-
nitrification and denitrification through an intermittent aeration process
Pretreatment Biological step: - denitrification - nitrification/oxidation
Secondary clarifier
RAS
Excess sludge
Location Tuscany (Italy)
Type municipal
Potentiality 3500 p.e.
Influent flow 900 m3/d
MLSS 3.5 g/l
Oxidation tank characteristics
Size [m2] 20x8
Diffusers immersion [m] 3.65
Aeration system:
The air flow is intermittent in order to alternate in the tank aerobic and
anoxic conditions
Type MEMBRANE PANEL
Installation year 2010
Size [m2] 4 x 0.18
SOTE [%] 34.2
n° diffusers 24
(4 extractable frames of 6 panels each)
SMALL WWTP

14/05/2015
11
Three off-gas tests were carried out on the aeration system of this plant:
- June 2010: immediately after the installation of the membrane panels
- May 2012: after two year’s operation during which had not been carried out any
cleaning operation
- July 2012: immediately after carrying out a cleaning operation of diffusers with
peracetic acid
For each test the measurement were taken in 10 different location inside the tank.
tank coverage over 2%
Between the first and second tests
the blower of the plant was
replaced with another one
characterized by a lower power
SMALL WWTP
Test Diffusers conditions DO
(mg/l)
OTE (%)
αSOTE (%)
α
June 2010 New 4.62 9.8 18.0 0.53
May 2012 2 years’ service 0.01 9.4 9.5 0.30
July 2012 Cleaned 3.70 9.2 15.8 0.46
• The membrane panels are characterized by high performance
• The value provided by the manufacturer and used during sizing are
representative of the system
Taking all the specific site characteristics into account, the test could be
considered positive for αSOTE value higher than or equal to 15%
SMALL WWTP

14/05/2015
12
Test Conditions of the
diffusers
DO
(mg/l)
OTE (%)
αSOTE (%)
α
June 2010 New 4.62 9.8 18.0 0.53
May 2012 2 years’ service 0.01 9.4 9.5 0.30
July 2012 Cleaned 3.70 9.2 15.8 0.46
After two year’s operation there was a halving in the performance of the
diffusers
this reduction was attributed to the gradual fouling of diffusers with
operation time (favored by different operating conditions)
Following the results obtained it was decided,
together with plant service provider, to carry
out a cleaning of the diffusers
SMALL WWTP
Test Conditions of the
diffusers
DO
(mg/l)
OTE (%)
αSOTE (%)
α
June 2010 New 4.62 9.8 18.0 0.53
May 2012 2 years’ service 0.01 9.4 9.5 0.30
July 2012 Cleaned 3.70 9.2 15.8 0.46
• After the cleaning of diffusers, a net improvement in the αSOTE’s value
was observed
• The concentration of DO in the tank, with the same air flow, increased in
a significant manner reaching average value of 3.7mg/l during aerobic
phase
• The loss of system efficiency was really due to the diffusers fouling
• the cleaning operation produced a 6% recovery in terms of αSOTE
SMALL WWTP

14/05/2015
13
Comparison between the air flows obtained for the same position in
different test:
Off-gas flow rate Sampling positions
1 2 3 4 5 6 7 8 9 10
May2012 vs. June2010 0.45 0.40 0.36 0.29 0.56 0.48 0.67 0.56 0.49 0.50
July2012 vs. May2012 1.06 2.06 1.07 2.30 1.57 0.73 1.77 0.98 1.64 1.72
• Flows measured in May 2012 are lower than those measured in 2010
due to a blower replacing
the reduction is of the same magnitude for all position
• In July 2012 an off-gas flow increase was recorded in nearly all the
point monitored
These results confirm the oxygen transfer efficiency data
SMALL WWTP
* Air flow necessary to guarantee an SOTR=26kgO2/h assuming 0.55 as α-value
Test αSOTE
(%) Air flowrate*
(Nm3/h)
Energy consumption (kWh/year)
kWh
CODrem
Aeration costs (€/years)
€
CODrem
June 2010 18.0 290 42048 0.65 6307 0.10
May 2012 9.5 545 71832 1.11 10774 0.17
July 2012 15.8 330 43800 0.68 6570 0.10
• A reduction in the αSOTE value makes an increase in management costs by
approximately 4500€/y
• The maintenance operation allowed for reducing the annual energy consumption
to the initial value, approximately 10kWh for p.e.
The fact of being able to quantify the changes of efficiency of the aeration system
makes possible to quantify the effect of the aeration system efficiency on the
energy consumption of the plant:
• Assuming 0.406 kgCO2/kWh as specific emission (IEA,2012), the energy saving
due to cleaning corresponds to 11.4 tCO2/y and 3.25 KgCO2/p.e.
SMALL WWTP
14/05/2015
14
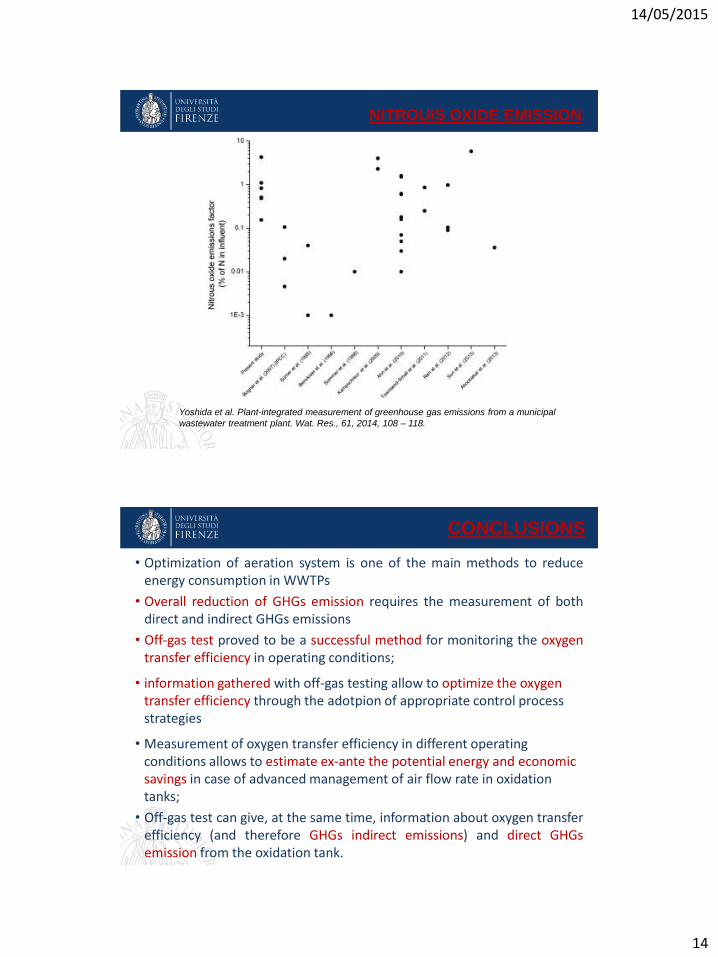
Yoshida et al. Plant-integrated measurement of greenhouse gas emissions from a municipal
wastewater treatment plant. Wat. Res., 61, 2014, 108 – 118.
NITROUIS OXIDE EMISSION
• Optimization of aeration system is one of the main methods to reduce energy consumption in WWTPs
• Overall reduction of GHGs emission requires the measurement of both direct and indirect GHGs emissions
• Off-gas test proved to be a successful method for monitoring the oxygen transfer efficiency in operating conditions;
• information gathered with off-gas testing allow to optimize the oxygen transfer efficiency through the adotpion of appropriate control process strategies
• Measurement of oxygen transfer efficiency in different operating conditions allows to estimate ex-ante the potential energy and economic savings in case of advanced management of air flow rate in oxidation tanks;
• Off-gas test can give, at the same time, information about oxygen transfer efficiency (and therefore GHGs indirect emissions) and direct GHGs emission from the oxidation tank.
CONCLUSIONS


![Bellandi-Eta Dell'Oro e Mos Maiorum in Giovenale (MDATC 27 [1991])](https://img.dokumen.tips/doc/110x75/577c7d9b1a28abe0549f68ac/bellandi-eta-delloro-e-mos-maiorum-in-giovenale-mdatc-27-1991.jpg)


