Embed Size (px)
Citation preview

Energy Conservation and Demand Management (CDM) Plan
June 2014

Executive Summary
This report presents the five-year (2014-2019) corporate energy conservation and demand management (CDM) plan for the Town of Richmond Hill as required Ontario Regulation 397/11, made under the Green Energy Act, 2009.
Background
In 2009, the Province of Ontario enacted the Green Energy Act, which requires public agencies, including municipalities, to report their energy consumption and greenhouse gas emissions annually. It further requires that the municipality develop a five-year energy conservation and demand management (CDM) plan. The first CDM Plan is due on July 1, 2014, and every fifth year thereafter. The CDM plan requires senior management approval.
The CDM Plan is composed of two parts:
1. A summary of the public agency’s annual energy consumption and greenhouse gas (GHG) emissions for its operation, and
2. A description of previous, current and proposed measures for conserving energy, reducing energy consumption and managing energy demand, including a forecast of expected results for current and proposed measures.
The primary objective of the CDM Plan is to effectively manage public sector energy consumption and explore opportunities for energy conservation.
Process
A comprehensive planning process was undertaken to prepare the CDM plan, consistent with the Ministry of Energy’s ‘CDM Plan Preparation Guide’. As part of this process, an Energy Conservation Team with representatives from various Town divisions/departments was formed to discuss energy consumption, potential energy conservation opportunities, and to create an implementation plan. Walk-through energy audits were conducted at 10 representative facilities including six primary operation types (ice rinks, indoor swimming pools, administrative offices, community centres, public libraries, and performing arts facilities).

ii
Based-on the walkthrough energy audits and discussion with the energy conservation team, a series of energy conservation opportunities (ECOs) were identified within the following six industry standard categories:
• Good Housekeeping • Input material substitution • Equipment or process modification • Onsite reuse or recovery • Training or improved operating practices • Improved purchasing techniques
Energy conservation opportunities were assessed both on the basis of technical and financial feasibility. The ECOs were then prioritized in an implementation plan, developed in collaboration with all affected Town departments.
2012 Energy Consumption Results
The 2012 energy consumption report establishes a baseline year for energy consumption. Of the 63 Town facilities, 48 facilities met the requirements for annual reporting in 20121. The report shows that:
1 The Act requires public agencies to report energy consumption of facilities that are owned, leased, heated or cooled, and/or related to water or sewage, provided the public agency pays the utility bills.
• Town energy consumption was divided equally between electricity and natural gas. • Electricity accounted for roughly 80% of cost, whereas natural gas use contributed
approximately 70% of greenhouse gas emissions.
12 facilities2 consumed roughly 80% of Town electricity and included the following operation types: ice rinks, indoor swimming pools, administrative offices, community centres, public libraries, and performing arts facilities.
2 A full list of facilities can be found in Section 3.1.
Energy Conservation and Demand Management (CDM) Workplan
Recommended energy conservation opportunities are presented in Appendix C, Implementation Plan. Although the regulation requires a five-year plan (2014-2019) as part of this report, the Town’s workplan includes additional ECOs that extend beyond the 5-year timeframe.

iii
Appendix C, Implementation Plan presents:
• Previous projects implemented in 2012 & 2013 • Ongoing projects that will be implemented throughout 2014 • Proposed energy conservation opportunities that will be implemented over the next five
years (2014-2019), and • Proposed energy conservation opportunities that will be implemented in the future
(2019+)
Each ECO shows estimated energy savings, cost savings/avoidance, and GHG emissions reduction. Additionally, each energy conservation opportunity specifies a timeline for implementation and departmental responsibility.
If all ECOs recommended as part of the five-year plan are implemented, the following reductions are estimated:
• Energy consumption reduced by 8.5% (4,100,000 ekWh/year); • Equivalent energy cost reduced by $350,000/year; • Energy use intensity reduced by 8.5% (3.5 ekWh/ft2 /year); and • Greenhouse gas (GHG) emissions reduced by 6.4% (400 tCO2-eq/year).
Implementing the full suite of ECOs identified by the energy conservation team would take longer than five years; however, the following overall reductions are estimated:
• Energy consumption reduced by 12.9% (6,196,162 ekWh/year) (additional 4.4% reduction relative to five year plan);
• Equivalent energy cost reduced by $510,000/year (additional $160,000/year relative to five year plan);
• Energy use intensity reduced by 12.9% (5.2 ekWh/ft2 /year); and • Greenhouse gas (GHG) emissions reduced by 10.5% (650 tCO2-eq/year).
The primary objective of the CDM Plan is to effectively manage municipal energy consumption, and explore opportunities for energy conservation. To this effect, the Town will achieve its corporate energy management goals through the energy planning process established in the Green Energy Act, and as set out in this report and action plan.

TABLE OF CONTENTS
EXECUTIVE SUMMARY ................................................................................................................................. I
1.0 INTRODUCTION ................................................................................................................................... 1
1.1 GREEN ENERGY ACT, 2009 AND ONTARIO REGULATION 397/11 ................................................................... 11.2 COMMITMENT TO ENERGY CONSERVATION, OUR GOALS AND OBJECTIVES ...................................................... 2
2.0 CDM PLANNING PROCESS................................................................................................................... 4
2.1 ENERGY CONSERVATION TEAM .................................................................................................................. 42.2 WALKTHROUGH ENERGY AUDIT OF FACILITIES ............................................................................................. 52.3 IDENTIFY ENERGY CONSERVATION OPPORTUNITIES AND ESTIMATE REDUCTIONS .............................................. 62.4 EVALUATE OPPORTUNITIES ....................................................................................................................... 62.5 DEVELOP IMPLEMENTATION PLAN.............................................................................................................. 7
3.0 BASELINE ENERGY CONSUMPTION..................................................................................................... 8
3.1 2012 ENERGY CONSUMPTION ................................................................................................................... 83.2 DESCRIPTION OF RENEWABLE ENERGY HARNESSED..................................................................................... 15
4.0 FINDINGS FROM ENERGY CONSERVATION AND DEMAND MANAGEMENT (CDM) PLANNING ..... 16
4.1 ENERGY CONSERVATION OPPORTUNITIES .................................................................................................. 164.2 TOTAL ESTIMATED ENERGY AND COST SAVINGS ......................................................................................... 19
5.0 IMPLEMENTATION PLAN................................................................................................................... 20
6.0 CDM PLAN APPROVAL....................................................................................................................... 21
APPENDICES................................................................................................................................................ 22

List of Figures
Figure 1: Requirements under Ontario Green Energy Act and O. Reg. 397/11 ............................. 1Figure 2: The CDM Planning Process Steps ..................................................................................... 4Figure 3: 2012 Annual Energy Cost Breakdown.............................................................................. 9Figure 4: 2012 GHG Emissions due to Energy Consumption .......................................................... 9Figure 5: Breakdown of Electricity Consumption (2012) .............................................................. 10Figure 6: Breakdown of Natural Gas Consumption (2012) ........................................................... 11Figure 7: Breakdown of Total Energy Consumption (2012) ......................................................... 12Figure 8: Breakdown of Total Energy Consumption of Major Energy Users (2012)..................... 13Figure 9: Breakdown of Total Energy Consumption by Operation Type (2012) .......................... 14
List of Tables
Table 1: 2012 Annual Energy Consumption, Cost Breakdown and GHG Emissions ....................... 8Table 2: Breakdown of Total Energy Consumption by Operation Type (2012) ............................ 14Table 3: List of Renewable Energy Systems Installed on Town Buildings .................................... 15Table 4: Energy Savings: Five Year Implementation Plan (2014-2019) ........................................ 19Table 5: Energy Savings: All Opportunities - Long Term (2019+) ................................................. 20
List of Appendices (Following Text)
Appendix A: Summary of 2012 Energy Consumption and GHG EmissionsAppendix B: Description of Renewable Energy Systems InstalledAppendix C: Implementation Plan

1
1.0 Introduction
This report presents the five-year (2014-2019) corporate energy conservation and demand management (CDM) plan for the Town of Richmond Hill.
Energy management is an approach to monitoring, controlling and conserving energy in a building or organization. The purpose of energy management is to reduce cost, reduce carbon emissions and conserve resources.
Federal and provincial regulation in this area is growing. The Province of Ontario enacted the Green Energy Act, 2009, which requires public agencies, including municipalities, to report their energy consumption & greenhouse gas emissions annually, and develop a CDM plan every five years.
1.1 Green Energy Act, 2009 and Ontario Regulation 397/11
As illustrated in Figure 1, Ontario Green Energy Act, 2009 and Ontario Regulation 397/11 require all Ontario public agencies, including municipalities, to:
1. Report energy use and greenhouse gas (GHG) emissions annually. The Regulation requires that the report be submitted to the Ministry of Energy, published on website and made available to the public in printed form at its head office, and
2. Prepare, publish on its website, make available to the public in printed form, and implement the five-year Energy Conservation and Demand Management (CDM) Plan.
Figure 1: Requirements under Ontario Green Energy Act and O. Reg. 397/11
O. Reg. 397/11 applies to Public Agencies including:
Municipalities Municipal Service Board Post-secondary educational institution Public hospital School board
Report on Annual Energy Consumption & GHG missions
• Due on July 1 every year
• Submit to Ministry • Publish on Website • Hardcopy of Report
made available to public at Main Office
Prepare a Five-year Energy Conservation & Demand Management (CDM) Plan
•Due on July 1, 2014 & every 5 years thereafter
• Senior Management Approval
• Publish on Website • Hard copy made
available to public at Main Office

2
Annual Energy Consumption & Green House Gas (GHG) Emissions Report
Public agencies are required to report annually (due July 1 every year, starting 2013) the energy consumption for each of their facilities/buildings, if:
• They are owned or leased by the public agency • The facility/building is heated or cooled and the public agency is issued the energy
invoices and is responsible for paying the energy bills • They are related to the treatment or pumping of water or sewage, whether or not the
building is heated or cooled, and the public agency is issued the invoices and is responsible for making the payments for the building or facility’s energy consumption
Additionally, public agencies are required to divide, allocate and report their energy consumption by operation, if multiple operations are conducted in the building. Typical operation types in a municipal building include: community centres, indoor swimming pools, gymnasiums, fitness centres, indoor ice rinks, etc.
Five-year Energy Conservation and Demand Management (CDM) Plan
Public agencies are required to prepare an Energy Conservation and Demand Management (CDM) Plan every five years. The first CDM Plan is due on July 1, 2014, and every fifth year thereafter.
The CDM Plan is composed of two parts:
Part 1: A summary of the public agency’s annual energy consumption and greenhouse gas (GHG) emissions for its operation, and
Part 2: A description of previous, current and proposed measures for conserving energy, reducing energy consumption and managing energy demand, including a forecast of the expected results of the current and proposed measures.
1.2 Commitment to Energy Conservation, Our Goals and Objectives
Richmond Hill is one of the fastest growing communities in Canada and is located at the centre of the Greater Toronto Area (GTA). Richmond Hill is one of the 29 municipalities in GTA, and therefore it is influenced by changes occurring throughout the GTA.
Richmond Hill’s mandate as a local government is to deliver an array of services to our community. The Town owns over 60 facilities that include administrative offices, community centers, ice rinks, fitness centers, gymnasiums, public libraries, indoor swimming pools, fire stations, sewage pumping stations, a performing arts centre, and cultural facilities.

3
The Town of Richmond Hill understands that energy is a valuable resource and efficient use of energy will lower costs and reduce greenhouse gas emissions. The Town is committed to energy conservation in the following ways:
• The Strategic Plan goal of “Wise Management of Resources” supports planning for energy efficient buildings, renewable energy, water conservation and low emission vehicles.
• The Official Plan requires that Richmond Hill update and expand the Energy Management Plan for Town facilities (Official Plan: 3.1.9.5).
• Richmond Hill’s Environment Strategy sets three goals for sustainable energy management:
o To encourage energy efficiency in community development and redevelopment (built form).
o To become a municipal leader in corporate energy efficiency and renewable energy use while demonstrating cost efficiencies.
o To foster an energy-efficient and energy-aware community.
The Environment Strategy further specifies that these goals will be achieved through a number of actions, such as reducing corporate energy use and GHG emissions through an updated energy management/conservation plan, and by increasing corporate use of renewable energy to reduce GHG emissions and energy costs.
In 2011, the Town updated its corporate GHG inventory under the Federation of Canadian Municipalities’ (FCM)’s Partners for Climate Protection (PCP) program, achieving a 33% reduction in GHG emissions (exceeded the reduction target of 20% below 2000 levels). This achievement earned Richmond Hill ‘Milestone 5’ recognition from the FCM. Richmond Hill has also adopted a policy1 requiring LEED silver (or alternative equivalent) development for all new municipal buildings with a floor area over 500 square meters. Additionally, the Town has undertaken numerous energy conservation projects, including the installation of solar thermal and PV systems, as well as wind mills on municipal buildings to offset energy consumption.
1 Source: Sustainable Design and Construction Policy.
The primary objective of the CDM Plan is to effectively manage municipal energy consumption, and explore opportunities for energy conservation. To this effect, the Town will achieve its corporate energy management goals through the energy planning process established in the Green Energy Act, and as set out in this report and action plan.

4
•
•
•
•
•
•
•
•
•
2.0 CDM Planning Process
The Town adopted the following nine-step planning process, consistent with the Ministry of Energy’s CDM Plan Preparation Guide, to prepare the plan:
Figure 2: The CDM Planning Process Steps
Step 1 Commitment to Energy Conservation
Step 2 Analysis of 2012 Baseline Data
Step 3 Form Energy Conservation Team
Step 4 Conduct Walkthrough Energy Audit of Facilities
Step 5 Identify Energy Conservation opportunities and Estimate Reductions
Step 6 Evaluate Opportunities
Step 7 Set Goals & Objectives for Energy Conservation
Step 8 Develop Implementation Plan
Step 9 Approval by Senior Management
2.1 Energy Conservation Team
An Energy Conservation Team was formed in preparing the CDM Plan. The team is comprised of the representatives from the Town departments and Power Stream Inc. (Richmond Hill’s distribution company for Electricity) to ensure partnership and collaboration among Town departments during the planning and implementation phases. Membership is as follows:
• Manager, Air Quality, Climate Change & Waste, Environment Services, EIS1
• Sustainable Energy Coordinator, Environment Services, EIS • Manager, Facility Systems, Asset Management, EIS • Manager, Facility Assets, Asset Management, EIS • Manager, Facility Operations, Recreation & Culture Service, CS2
1EIS: Environment and Infrastructure Services. 2CS: Community Services.

5
• Manager, Water & Wastewater, Public Works Operations, CS
• Manager, Theatre, Recreation & Culture Service, CS
• EMS Coordinator, Environment Services, EIS • Supervisor, Community Centres, Recreation & Culture Service, CS
• Supervisor of Facilities, Arenas, Recreation & Culture Service, CS
• Supervisor, Water & Wastewater, Public Works Operations, CS • Roving Energy Manager, Power Stream Inc.
The team met monthly to discuss energy consumption, potential energy conservation opportunities, and to create the implementation plan provided in Appendix C.
2.2 Walkthrough Energy Audit of Facilities
A group of 13 facilities consumed over 80% of Town facilities’ total energy in 2011 and included six primary operation types (ice rinks, indoor swimming pools, administrative offices, community centres, public libraries, and performing arts facilities). Walkthrough energy audits were conducted at 10 representative facilities1 to provide more insight into potential energy conservation opportunities:
1 The Town owns and operates 63 facilities. Of these, energy consumption for 48 facilities is reported annually under O. Reg. 397/11, and a sample of 10 representative facilities were audited for energy conservation opportunities.
1. Tom Graham Arena
2. Elgin Barrow Arena 3. Ed Sackfield Arena & Fitness Centre
4. Bayview Hill Community Centre & Pool
5. Wave Pool (Lois Hancey Aquatic Centre) 6. Richvale Community Centre & Pool
7. Elgin West Community Centre & Pool
8. EBC Office 9. Central Library
10. Richmond Hill Centre for the Performing Arts
The walkthrough energy audits involved: general observation of operations, process and equipment; discussion and interaction with process and equipment operators; collection of equipment specifications; and gathering information on operating hours, etc.

6
2.3 Identify Energy Conservation Opportunities and Estimate Reductions
Based on the walk-through energy audits and discussion with the energy conservation team, a series of potential energy conservation opportunities/measures (ECOs) were identified within the following six industry standard categories:
1. Good Housekeeping
2. Input material substitution 3. Equipment or process modification
4. Onsite reuse or recovery
5. Training or improved operating practices 6. Improved purchasing techniques
Some ECOs were identified for specific facilities, whereas others apply to all Town facilities of the same operation type. ECOs were further categorized as previous, current, and proposed.
• Previous Opportunities/Measures – include projects completed in 2012 and 2013. • Current Opportunities/Measures – include projects currently underway in 2014 • Proposed Short-Term Opportunities/Measures – include newly identified opportunities
planned for the next five years (2014-2019) • Proposed Long Term Opportunities/Measures – include newly identified opportunities
planned for the future (2019+) Energy savings were estimated for the identified opportunities. Some opportunities will require further investigation to estimate savings; these were omitted from projected savings.
2.4 Evaluate Opportunities
Energy conservation opportunities were assessed both on the basis of technical and financial feasibility.
The technical evaluation of ECOs considered the availability and reliability of technology, success rates, training requirements, health and safety considerations, and requirements for extra space.
The financial evaluation was conducted for opportunities found to be technically feasible. The financial evaluation of ECOs considered energy savings, cost avoidance, capital cost, incentives from energy suppliers, and payback periods. Projected cost savings for some ECOs are noted as TBD (to be determined) in the implementation plan; these require more information to assess and will be revisited at a later date.

7
2.5 Develop Implementation Plan
Following the evaluation of ECOs, the energy conservation team developed an implementation plan (Appendix C) in collaboration with affected Town departments. The following process was used to form the plan, consistent with the Ministry of Energy’s CDM Plan Preparation Guide:
• Prioritize the measures/opportunities - ECOs were prioritized for implementation based on energy and cost saving potential.
• Classification of measures/opportunities - ECOs were classified within the six standard categories as discussed in Section 2.3.
• Develop timelines for the measures/opportunities - Each ECO was assigned a specific timeline for implementation. Due to the number of opportunities available, not all could be implemented within a 5 year timeframe (the regulation requires submission of a 5-year plan as part of this report). For that reason, priority opportunities have been selected for implementation in the next five years (2014-2019), and the remaining opportunities are grouped separately for implementation in the future (2019+).
• Assign responsibilities for measures/opportunities – Implementation responsibilities were assigned to various departments.
• Link the CDM plan to other corporate activities – The CDM plan will be implemented through a range of existing corporate activities, such as asset lifecycle replacement projects.

8
3.0 Baseline Energy Consumption
3.1 2012 Energy Consumption
In 2012, 48 of total 63 Town facilities met the requirements for annual reporting. The 2012 energy consumption and GHG emissions report1 for the Town of Richmond Hill was prepared using the Ministry of Energy's annual reporting template (see Appendix A).
1 The Act requires that the 2012 energy consumption of Town facilities be reported in 2014.
The 2012 energy consumption report establishes baseline data for the first five-year plan. This section illustrates how 2012 electricity and natural gas consumption contributed to Town's total energy consumption, energy cost, and associated GHG emissions. This section further presents the breakdown of energy consumption by operation type and illustrates how various facilities contributed to Town's annual energy consumption in 2012.
Electricity and Natural Gas Consumption Comparison
Table 1: 2012 Annual Energy Consumption, Cost2 Breakdown and GHG Emissions3
2 Unit cost of energy varies over facilities. The costs presented here are the 2012 average unit energy costs (Electricity: $0.11/kWh; Natural gas: $0.30/m3 ). 3 Emission factors (based on 2011 Ontario emission factors; 2012 numbers are not available when the report was prepared): Electricity: 0.08 kg CO2-eq/kWh; Natural gas: 1.89 kg CO2-eq/m3 .
Energy Source
Energy Consumption Energy Cost GHG Emissions
Units Annual
Quantity Equivalent
kWh Percentage
of Total Annual
Cost Percentage
of Total (tCO2eq/yr) Percentage
of Total Electricity kWh 23,874,844 23,874,844 49.6% $2,626,233 79.3% 1,910 30.7% Natural gas m3 2,278,704 24,217,492 50.4% $683,611 20.7% 4,307 69.3%
Total 48,092,336 100% $3,309,844 100% 6,217 100%
As illustrated in Table 1, Town energy consumption is divided equally between electricity and natural gas. However, electricity accounts for roughly 80% of cost, whereas natural gas use contributes approximately 70% of greenhouse gas emissions (Table 1 and Figures 3 & 4).
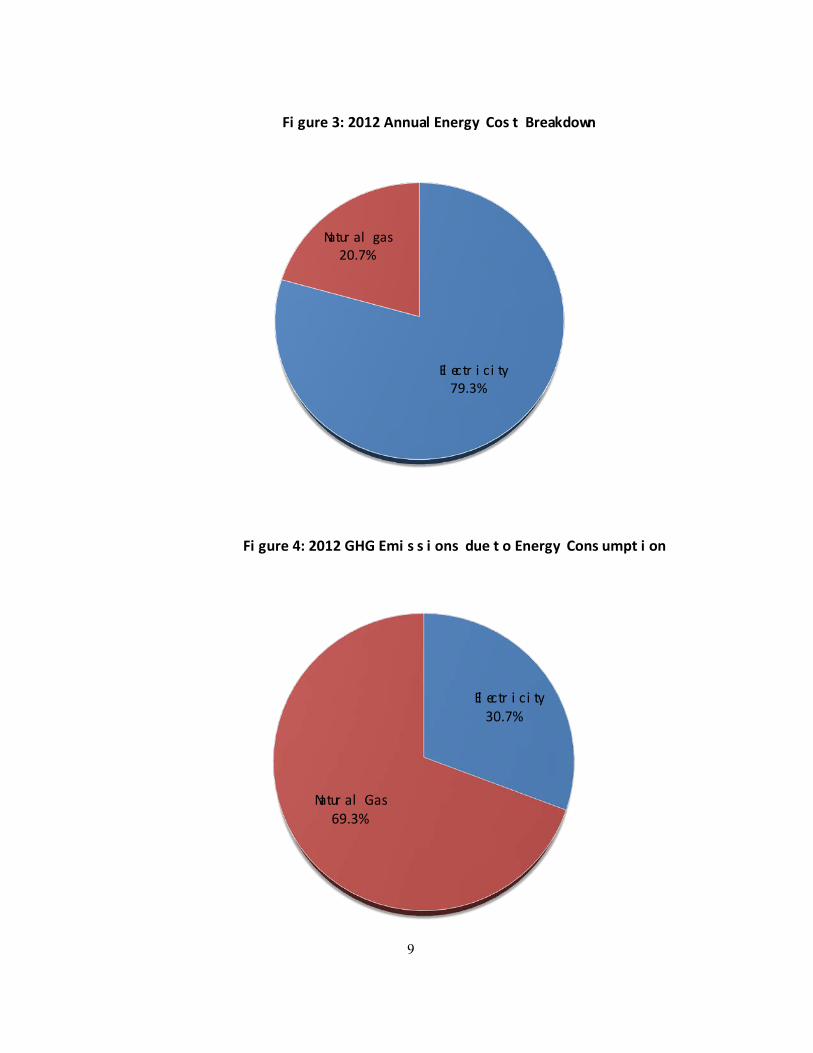
Figure 3: 2012 Annual Energy Cost Breakdown
Figure 4: 2012 GHG Emissions due to Energy Consumption
9
Electricity30.7%
Natural Gas69.3%
Electricity79.3%
Natural gas20.7%

10
Electricity Consumption
Town facilities consumed a total of 23,874,844 kWh of electricity in 2012, with a corresponding use intensity of 20.0 kWh/ft2 /year1. Figure 5 illustrates the estimated breakdown of electricity consumption between Town facilities. Figure 5 shows that 12 facilities consumed over 79% of Town electricity consumption in 2012. These include the EBC Offices, Operations Centre, Tom Graham Arena, Central Library, Elgin Barrow Arena, Bayview Hill CC & Pool, Wave Pool, Richvale Community Centre & Pool, Richmond Hill Centre for the Performing Arts, Elgin West Community Centre & Pool, Ed Sackfield Arena & Fitness Centre, and Centennial Pool. The remaining 36 facilities consumed 21% of Town electricity.
1 The total indoor space area of 48 Town facilities reported in 2014 is 1,191,125 sq. ft.
Figure 5: Breakdown of Electricity Consumption (2012)
EBC Offices13.1%
Operations Centre9.8%
Tom Graham Arena9.3%
Central Library8.5%
Elgin Barrow Arena6.1%
Bayview Hill CC &
Pool5.6%Wave Pool (Lois
Hancey Aquatic Centre)
5.6%
Richvale CC & Pool5.0%
Richmond Hill Centre for the
Performing Arts4.7%
Elgin West CC & Pool
4.6%
Ed Sackfield Arena & Fitness 3.8%
Centennial Pool3.1%
Other (36 Facilities)20.9%

11
Natural Gas Consumption
Town facilities consumed a total of 2,278,704 m3 of natural gas in 2012, with a corresponding use intensity of 1.9 m3 /ft2 /year1. Figure 6 illustrates the estimated breakdown of natural gas consumption between Town facilities. Figure 6 shows that 12 facilities consumed approximately 78% of Town natural gas consumption in 2012. These include Tom Graham Arena, Operations Centre, Bayview Hill Community Centre & Pool, Elgin Barrow Arena, Elgin West Community Centre & Pool, Wave Pool, Ed Sackfield Arena & Fitness Centre, Richmond Hill Centre for the Performing Arts, Richvale Community Centre & Pool, Centennial Pool, Central Library, and the 225 EBC Offices. The remaining 36 facilities consumed 22% of Town natural gas.
1 The total indoor space area of 48 Town facilities reported in 2014 is 1,191,125 sq. ft.
Figure 6: Breakdown of Natural Gas Consumption (2012)
Tom Graham Arena10.8%
Operations Centre9.9%
Bayview Hill CC & Pool9.5%
Elgin Barrow Arena7.4%
Elgin West CC & Pool
6.7%
Wave Pool (Lois Hancey Aquatic
Centre)6.2%
Ed Sackfield Arena & Fitness
5.9%
Richmond Hill Centre for the
Performing Arts5.6%
Richvale CC & Pool5.0%
Centennial Pool4.5%
Central Library4.1%
225 EBC2.3%
Other (36 Facilities)22.1%

12
Total Energy Consumption
Town facilities consumed a total of 48,092,336 ekWh1/year of total energy in 2012, with a corresponding use intensity of 40.4 ekWh/ft2 /year2. Figure 7 illustrates the estimated breakdown of total energy consumption between Town facilities. Figure 7 shows that 12 facilities consumed 79% of Town total energy consumption in 2012. These include Tom Graham Arena, Operations Centre, the EBC Offices, Bayview Hill Community Centre & Pool, Elgin Barrow Arena, Central Library, Wave Pool, Elgin West Community Centre & Pool, Richmond Hill Centre for the Performing Arts, Richvale Community Centre & Pool, Ed Sackfield Arena & Fitness Centre, and Centennial Pool. The remaining 36 facilities consumed 21% of Town total energy.
1 ekWh (Electricity: 1ekWh/kWh; Natural gas: 10.627 ekWh/m3 ). 2 The total indoor space area of 48 Town facilities reported in 2014 is 1,191,125 sq. ft.
Figure 7: Breakdown of Total Energy Consumption (2012)
Tom Graham Arena10.0%
Operations Centre9.8%
EBC Offices7.6%
Bayview Hill CC & Pool7.6%
Elgin Barrow Arena6.8%
Central Library6.3%
Wave Pool (Lois Hancey
Aquatic Centre)
5.9%
Elgin West CC & Pool5.7%
Richmond Hill Centre for the Performing
Arts5.2%
Richvale CC & Pool5.0%
Ed Sackfield Arena & Fitness 4.9%
Centennial Pool3.8%
Other (36 Facilities)21.5%

13
Figure 8 illustrates the electricity and natural gas consumption pattern of the top 12 energy consuming facilities in 2012. Over 85% of the total energy used by EBC offices in 2012 was electricity. Similarly, 63% of total energy consumed by Bayview Hill CC was natural gas.
Figure 8: Breakdown of Total Energy Consumption of Major Energy Users (2012)
Total Energy Consumption by Operation Type
Table 2 and Figure 9 illustrate the estimated breakdown of total energy consumption by operation type. Six operation types account for over 90% of the Town’s total energy consumption (ekWh) in 2012. These were: ice rinks, indoor swimming pools, administrative offices, community centres, public libraries, and performing arts facilities.
0
500,000
1,000,000
1,500,000
2,000,000
2,500,000
3,000,000
3,500,000
4,000,000
4,500,000
5,000,000
Equi
vale
nt E
nerg
y Co
nsum
ptio
n (e
kWh)
Electricity Natural Gas

14
Table 2: Breakdown of Total Energy Consumption by Operation Type (2012)
2012 Energy Consumption % of Total
Energy Electricity
(kWh) Natural Gas
(m3 )
Total Energy (ekWh)
Ice Rinks 5,832,923 659,381 12,840,662 26.7% Indoor Swimming Pools 4,886,026 595,204 11,211,704 23.3% Administrative Offices 5,403,561 269,173 8,264,264 17.2% Community Centres 2,275,717 250,173 4,934,498 10.3% Public Library 2,401,650 117,257 3,647,832 7.6% Performing Arts Centre 1,111,877 128,699 2,479,660 5.2% Fire Hall 582,059 101,603 1,661,873 3.5% Gym 542,173 68,745 1,272,778 2.6% Indoor Soccer 139,196 49,557 665,880 1.4% Fitness Centres 200,962 23,945 455,443 0.9% Pumping of Sewage 171,595 0 171,595 0.4% Other (Truck Wash/Bay) 80,724 7,999 165,733 0.3% Cultural Facilities 90,959 3,438 127,497 0.3% Mechanical Room (RG Ice Plant) 84,913 0 84,913 0.2% Indoor Recreational Facilities (Beach house/Club house) 57,366 0 57,366 0.1% Art Gallery 13,143 3,528 50,641 0.1%
Total: 23,874,844 2,278,704 48,092,340 100%
Figure 9: Breakdown of Total Energy Consumption by Operation Type (2012)
0
2,000,000
4,000,000
6,000,000
8,000,000
10,000,000
12,000,000
14,000,000
Equi
vale
nt k
Wh/
year

15
3.2 Description of Renewable Energy Harnessed
The Town of Richmond Hill has demonstrated its commitment to becoming a leader in sustainable energy use by installing renewable energy systems. Table 3 lists the renewable energy systems installed in Town buildings, and presents their energy generation capacity.
Table 3: List of Renewable Energy Systems Installed on Town Buildings
Building/Facility
Renewable Energy System
Installed Installation
Year Estimated Energy Generation
Capacity 225 EBC Solar Hot Water 2008 55,658 kWh/year Bayview Hill Community Centre & Pool Solar Hot Water 2010 273,055 kWh/year Bond Lake Arena Solar Hot Water 2010 80,150 kWh/year Elgin Barrow Arena Solar Hot Water 2010 38,688 kWh/year Richmond Green Sports Complex Solar PV 2009 5.805 kW
Wind Mill 2009 1.9kW (Continuous) 2.6 kW (Peak)
Elvis Stojko Arena Solar PV 2014 5 kW Shaw House Solar PV 2010 1.29 kW Elgin West Community Centre & Pool Solar Hot Water 2014 111,593 kWh/year Richmond Hill Centre for the Performing Arts
Ground Source Heat Pump
2009 Heating Capacity: 191 MBH (16 tons) Cooling Capacity: 246 MBH (20.5 tons)
Forster House Ground Source Heat Pump
2010 Heating Capacity: 82.8 MBH (6.9 tons) Cooling Capacity: 115.3 MBH (9.6 tons)
Eyer Homestead Ground Source Heat Pump
2011 Heating Capacity: 108 MBH (9 tons) Cooling Capacity: 96.3 MBH (8 tons)
Centennial Pool Solar Hot Water 2014 N/A (Design Phase)
N/A: Not available. 1 MBH: 1000 BTU/hour. 12000 BTU/hr = 1 ton of refrigeration 1000 BTU = 0.293 kWh
A description of each of the above systems is summarized in Appendix B.

16
4.0 Findings from Energy Conservation and Demand Management (CDM) Planning
This section presents a summary of the energy conservation opportunities available to Richmond Hill over the next five+ years. A detailed implementation plan is provided in Appendix C that defines specific projects, estimated energy savings, estimated economics (cost savings or avoidance, and payback period), project responsibility, and timeline for implementation.
4.1 Energy Conservation Opportunities
As previously mentioned in Section 2.3, energy conservation opportunities were identified within six industry standard categories. This Section discusses how the ECOs are grouped within the six industry standard categories and provides some examples of ECOs for each.
Good housekeeping
Maintaining good housekeeping can lead to energy savings. A number of housekeeping items have been identified for implementation in Appendix C, such as:
• Turning pool heaters down when pools are not in use and maintain appropriate water temperature when in use.
• Replenishing pools with the recommended volume of municipal water. • Turning office equipment off when not needed at night or on the weekends.
Input Material Substitution
Substituting existing material with better quality material can also lead to energy savings. For example, Reverse Osmosis (RO) Water Treatment Systems can be installed to produce RO water for ice resurfacing in arenas. Substituting municipal water with reverse osmosis (RO) water will produce a harder ice surface that lasts longer, and consequently saves energy. The Town will investigate the feasibility of this and other material substitutions.
Equipment or process modification
This involves modifying existing equipment, technologies and processes to improve efficiency and reduce energy consumption. The Implementation Plan contains a number of such ECOs, including:
• Upgrading the refrigeration plants in ice arenas to more efficient models that would include a system to recover waste heat from the refrigeration compressors to supplement natural gas use in the facility.
• Installing solar water heating systems to preheat pool water or domestic hot water.

17
• Installing aerators in washroom faucets (e.g. in Pools) to reduce hot water consumption leading to energy savings.
Onsite reuse or recovery
In some cases waste heat can be recovered and used for another purpose. This can supplement energy use and therefore provide savings. Richmond Hill will explore several of these opportunities. For example, studies will be conducted to:
• Assess the feasibility of recovering waste heat from refrigeration compressors for preheating arena ice flood water or domestic hot water, or melting ice.
• Assess the feasibility of recovering waste heat from discarded pool water to preheat pool supply water.
Training or improved operating practices
Continuous training in energy conservation or improving the existing operating practices to improve energy efficiency is an important element and opportunity in meeting the goals and objectives of this plan. Many of the ECOs found in the Implementation Plan fall into this category. Examples include:
• Maintain the cross-departmental corporate energy conservation team. The cross-departmental corporate energy conservation team formed during this planning process will be maintained throughout planning, implementation and maintenance of energy conservation projects.
• Develop Standard Operating Procedures (SOPs) for Town facilities for operation/processes. A number of opportunities in the Implementation Plan relate to updating standard operating procedures (SOPs) to promote energy conservation. SOPs would help ensure consistency in operation, which would allow staff to benchmark the energy performance of various facilities and take appropriate actions to improve performance. For example:
o Swimming pools (e.g. water temperature, makeup water use, heat recovery, water quality, etc.).
o Ice rinks (e.g. setting ice temperature, ice-resurfacing, night setback, etc.). o Space heating and cooling (e.g. set-point temperature, zoning, scheduling, etc.). o Lighting controls (e.g. light levels, scheduling, zoning, de-lamping, etc.). o Operation & control of office equipment (e.g. scheduling, etc.). o Energy Conservation Review of Capital projects. o Equipment/process procurement.

18
• Improve Energy Consumption Data Collection & Tracking System. The existing data collection system will be improved for the purpose of reporting and monitoring the energy performance of facilities and operation types. For example, the Implementation Plan recommends that:
o Dedicated energy meters will be installed for facilities that do not have such a meter.
o Energy sub-meters will be installed for operation types within a facility (in future buildings). This will help track actual energy consumption and also monitor energy performance by operation type.
o Energy meters will be installed for significant renewable energy systems on Town facilities, if they do not have one. This will help track the actual quantity of energy generated and monitor facility’s energy/fuel displaced by such systems.
o Data monitoring system (interval data) will be expanded to more Town facilities. o Field instruments will be acquired for energy audit, as required. o Log-sheets will be developed and used for daily tracking.
• Energy Conservation Training will be provided to Staff. Training programs will introduce energy conservation principles and new technologies, processes & equipment to field staff.
• Integrate Energy Efficiency and Conservation with Town’s other Activities. Design for energy efficiency and conservation could be integrated with other Town activities at the planning stage, for example:
o Facilities could be designed in clusters within the same complex (such as an ice rink and an indoor swimming pool). In some cases, rejected heat from one process (the ice rink) could be used to heat another (pool water).
o Dedicated energy sub-meters could be installed for newly constructed facilities. This would help improve reporting and monitoring of energy performance.
Improved purchasing techniques
This involves changing purchasing practices/specifications to substitute energy efficient products and services. For example:
• Sustainable procurement principles could take into account energy efficiency; for example, vendors could be requested to provide information on estimated energy savings, cost savings/avoidance and the life cycle cost with their proposals/quotations.
• Programs from Federal or provincial government or utility companies (such as OPA and Enbridge) related to energy conservation will be explored. This would help identify capital projects for cost savings opportunities.

19
4.2 Total Estimated Energy and Cost Savings
Table 4 presents the energy consumption of 48 reporting facilities in the baseline year (2012), and estimated savings over the next five years. The total energy savings potential equates to approximately 4,100,000 ekWh/year (a 8.5% reduction in energy consumption) and an estimated cost savings/avoidance of roughly $350,000/year, as well as an estimated reduction in GHG emissions of 400 tCO 1
2-eq/year (an 6.4% reduction), and a reduction in total energy use intensity (EUI) for reporting Town facilities of 8.5% relative to the baseline year. These estimates include the estimated energy savings from projects implemented in 2012 and 2013, as well as a number of ongoing and proposed Gas Tax funded projects, and an estimated energy savings from life cycle projects assuming a 3% energy savings in next five years.
1 Energy use intensity (EUI) is the measurement used to report a building's energy performance. It represents the energy consumed by a building relative to its size and is expressed in gigajoules (or ekWh) per square metre (or per square foot) per year (Natural Resources Canada).
Table 4: Energy Savings: Five Year Implementation Plan (2014-2019)
Description BASELINE
(2012) PROJECTED
(After Implementation)
Annual Estimated Savings/
Reduction %
Change
Estimated Annual Cost
Savings/ Avoidance
($/year)
Total Energy Consumption
48,092,336 ekWh/year
43,989,100 ekWh/year
4,103,236 ekWh/year
-8.5% $350,000/yr
Total Energy Use Intensity (EUI)
40.4 ekWh/ft2/yr
36.9 ekWh/ft2/yr
3.5 ekWh/ft2/yr
-8.5% NA
Total GHG Emissions due to Energy Consumption
6,217 tCO2-eq/yr
5,817 tCO2-eq/yr
400 tCO2-eq/yr
-6.4% NA
Implementing the full suite of ECOs identified by the energy conservation team would take longer than the five-year plan required as part of this report. If all of the energy conservation opportunities were implemented, the total energy savings potential equates to approximately 6,196,000 ekWh/year (a 12.9% reduction in energy consumption) and an estimated cost savings/avoidance of roughly $510,000/year (as shown in Table 5). Some opportunities, however, required further investigation to estimate savings due to lack of adequate information at the time of assessment. The actual energy savings, therefore, will be even greater and can be estimated as more information becomes available.

20
Table 5: Energy Savings: All Opportunities
Description BASELINE
(2012) PROJECTED
(After Implementation)
Annual Estimated Savings/
Reduction %
Change
Estimated Annual Cost
Savings/ Avoidance
($/year)
Total Energy Consumption
48,092,336 ekWh/yr
41,896,174 ekWh/yr
6,196,162 ekWh/yr
-12.9% $510,000/yr
Total Energy Use Intensity (EUI)
40.4 ekWh/ft2/yr
35.2 ekWh/ft2/yr
5.2 ekWh/ft2/yr
-12.9% NA
Total GHG Emissions due to Energy Consumption
6,217 tCO2-eq/yr
5,567 tCO2-eq/yr
650 tCO2-eq/yr
-10.5% NA
5.0 Implementation Plan
Recommended energy conservation opportunities are presented in Appendix C, Implementation Plan. Although the regulation requires a five-year plan (2014-2019) as part of this report, the Town’s Implementation Plan includes additional ECOs that extend beyond the 5-year timeframe.
Appendix C, Implementation Plan presents:
• Previous projects implemented in 2012 & 2013 • Ongoing projects that will be implemented throughout 2014 • Proposed short term energy conservation opportunities that will be implemented over
the next five years (2014-2019), and • Proposed long term energy conservation opportunities that will be implemented in the
future (2019+)
Each ECO shows estimated energy savings, cost savings/avoidance, and GHG emissions reduction. Additionally, each energy conservation opportunity specifies a timeline for implementation and departmental responsibility.

21
6.0 CDM Plan Approval
Town of Richmond Hill approves and endorses the CDM plan.

Appendices
Appendix A: Summary of 2012 Energy Consumption and GHG Emissions Appendix B: Description of Renewable Energy Systems Installed Appendix C: Implementation Plan
22

A-1
Appendix A: Summary of 2012 Energy Consumption and GHG Emissions1
Operation Name Operation Type Address Postal Code
Floor Area of Space where
Operation Conducted
(sq ft)
# Hrs/ Week
Flow (ML)
Energy Type & Amount Purchased
and Consumed
Estimated GHG
Emissions (tCO2-eq) Electricity
(kWh) Natural Gas (m3 )
#21 EBC Offices Administrative offices and related facilities, including
municipal council chambers
225 East Beaver Creek
Road
L4B 3P4 137,681 65 N/A 3,128,451 51,344 347.3
#26 Operations Centre
Administrative offices and related facilities, including
municipal council chambers
1200 Elgin Mills Road
East
L4C 5G1 140,332 72 N/A 2,275,110 217,829 593.7
#26 Operations Centre
Storage facilities where equipment or vehicles are
maintained, repaired or stored
1200 Elgin Mills Road
East
L4C 5G1 4,225
40 N/A 68,497 6,558 17.9
#28 Mill St House Art galleries 314 Mill Street L4C 4B5 2,700 40 N/A 13,143 3,528 7.7 #31 Amos Wright
House Cultural facilities 19 Church
Street North L4C 3E6 2,800 29 N/A 17,149 3,438 7.9
#33 Burr House Cultural facilities 528 Carrville Road
L4C 6E6 1,650 13 N/A 27,067 N/A 2.2
#34 Boynton Farm House
Community centres 1380 Elgin Mills Road
East
L4S 1M5
3,500 30 N/A 57,414 2,288 8.9
#35 Guild Hall Cultural facilities 530 Carrville Road
L4C 6E6 2,100 13 N/A 22,137 N/A 1.8
#36 Railway Station Cultural centres 1370 Elgin Mills Road
East
L4S 1M5
1,500 39 N/A 24,606 N/A 2.0
#37 Richmond Hill Centre for the
Performing Arts
Performing arts facilities 10268 Yonge Street
L4C 3B7 55,935 88 N/A 1,111,877 128,699 332.2
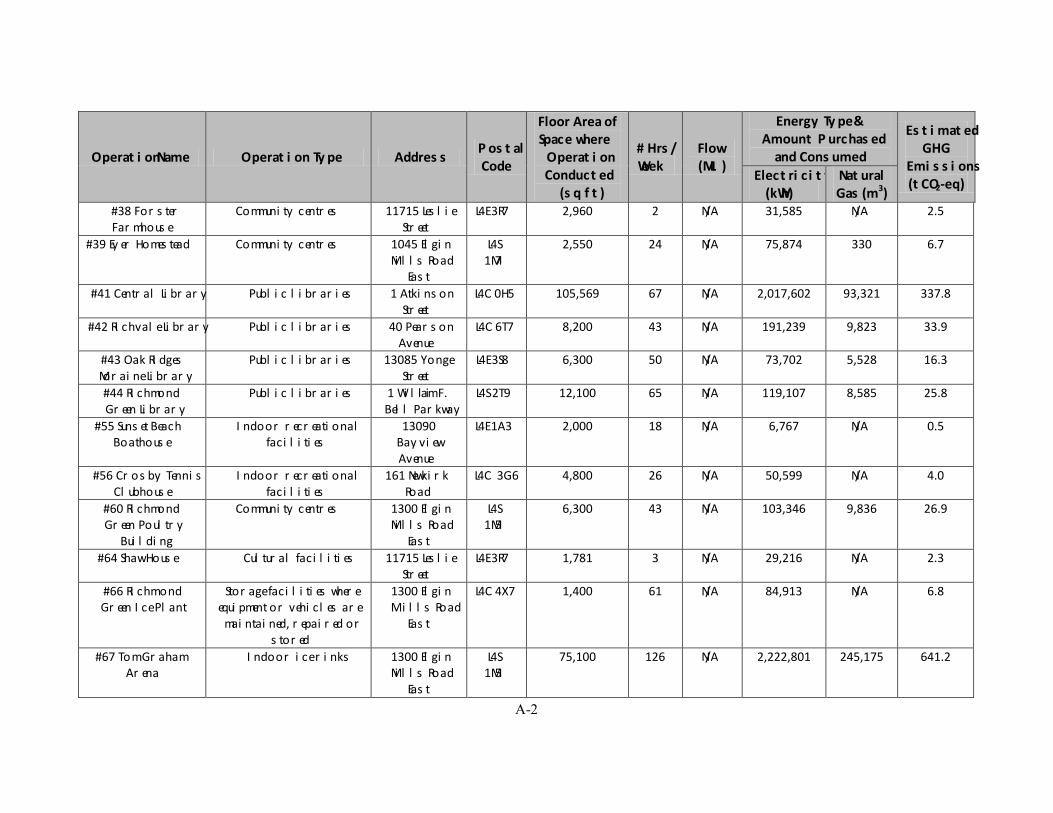
A-2
Operation Name Operation Type Address Postal Code
Floor Area of Space where
Operation Conducted
(sq ft)
# Hrs/ Week
Flow (ML)
Energy Type &Amount Purchased
and Consumed
Estimated GHG
Emissions (tCO2-eq) Electricity
(kWh)Natural Gas (m3)
#38 Forster Farmhouse
Community centres 11715 Leslie Street
L4E 3R7 2,960 2 N/A 31,585 N/A 2.5
#39 Eyer Homestead Community centres 1045 Elgin Mills Road
East
L4S 1M7
2,550 24 N/A 75,874 330 6.7
#41 Central Library Public libraries 1 Atkinson Street
L4C 0H5 105,569 67 N/A 2,017,602 93,321 337.8
#42 Richvale Library Public libraries 40 Pearson Avenue
L4C 6T7 8,200 43 N/A 191,239 9,823 33.9
#43 Oak Ridges Moraine Library
Public libraries 13085 Yonge Street
L4E 3S8 6,300 50 N/A 73,702 5,528 16.3
#44 Richmond Green Library
Public libraries 1 William F. Bell Parkway
L4S 2T9 12,100 65 N/A 119,107 8,585 25.8
#55 Sunset Beach Boathouse
Indoor recreational facilities
13090 Bayview Avenue
L4E 1A3 2,000 18 N/A 6,767 N/A 0.5
#56 Crosby Tennis Clubhouse
Indoor recreational facilities
161 Newkirk Road
L4C 3G6 4,800 26 N/A 50,599 N/A 4.0
#60 Richmond Green Poultry
Building
Community centres 1300 Elgin Mills Road
East
L4S 1M5
6,300 43 N/A 103,346 9,836 26.9
#64 Shaw House Cultural facilities 11715 Leslie Street
L4E 3R7 1,781 3 N/A 29,216 N/A 2.3
#66 Richmond Green Ice Plant
Storage facilities where equipment or vehicles are
maintained, repaired or stored
1300 Elgin Mills Road
East
L4C 4X7 1,400 61 N/A 84,913 N/A 6.8
#67 Tom Graham Arena
Indoor ice rinks 1300 Elgin Mills Road
East
L4S 1M5
75,100 126 N/A 2,222,801 245,175 641.2
Code

A-3
Operation Name Operation Type Address Postal Code
Floor Area of Space where
Operation Conducted
(sq ft)
# Hrs/ Week
Flow (ML)
Energy Type & Amount Purchased
and Consumed
Estimated GHG
Emissions (tCO2-eq) Electricity
(kWh)Natural Gas (m3)
#71 McConaghy Centre
Community centres 10100 Yonge Street
L4C 1T8 21,709 40 N/A 316,461 35,258 92.0
#71 McConaghy Centre
Gyms and indoor courts for playing tennis, basketball
or other sports
10100 Yonge Street
L4C 1T8 4,391 55 N/A 64,009 7,131 18.6
#72 Bayview Hill Community Centre
& Pool
Community centres 114 Spadina Road
L4B 2Y9 26,261 77 N/A 341,774 45,492 113.3
#72 Bayview Hill Community Centre
& Pool
Indoor swimming pools 114 Spadina Road
L4B 2Y9 19,692 74 N/A 872,345 152,737 358.5
#72 Bayview Hill Community Centre
& Pool
Gyms and indoor courts for playing tennis, basketball
or other sports
114 Spadina Road
L4B 2Y9 5,301 103 N/A 68,990 9,183 22.9
#72 Bayview Hill Community Centre
& Pool
Indoor recreational facilities
114 Spadina Road
L4B 2Y9 4,546 94 N/A 59,164 7,875 19.6
#74 Richvale CC & Pool
Community centres 160 Avenue Road
L4C 5L8 18,263 72 N/A 237,684 31,637 78.8
#74 Richvale CC & Pool
Indoor swimming pools 160 Avenue Road
L4C 5L8 15,283 100 N/A 907,614 75,697 215.7
#74 Richvale CC & Pool
Gyms and indoor courts for playing tennis, basketball
or other sports
160 Avenue Road
L4C 5L8 3,854 65 N/A 50,158 6,676 16.6
#75 Lake Wilcox CC Community centres 81 Wildwood Avenue
L4E 3B6 2,500 15 N/A 8,337 3,458 7.2
#76 Elgin Barrow Arena
Indoor ice rinks 43 Church Street South
L4C 1W1
73,650 126 N/A 1,446,848 169,352 435.8
#77 Bond Lake Arena
Indoor ice rinks 70 Old Colony Road
L4E 3G4 29,981 84 N/A 699,351 51,675 153.6

A-4
Operation Name Operation Type Address Postal Code
Floor Area of Space where
Operation Conducted
(sq ft)
# Hrs/ Week
Flow (ML)
Energy Type &Amount Purchased
and Consumed
Estimated GHG
Emissions (tCO2-eq) Electricity
(kWh)Natural Gas (m3)
#77 Bond Lake Arena
Community centres 70 Old Colony Road
L4E 3G4 5,919 84 N/A 77,033 10,254 25.5
#78 Richmond Green Sports
Building
Indoor sports arenas 1300 Elgin Mills Road
East
L4S 1M5
34,600 58 N/A 139,196 49,557 104.8
#79 Ed Sackfield Arena & Fitness
Centre
Indoor ice rinks 311 Valleymede
Road
L4B 2E1 40,650 126 N/A 824,653 122,306 297.1
#79 Ed Sackfield Arena & Fitness
Centre
Indoor recreational facilities
311 Valleymede
Road
L4B 2E1 6,950 108 N/A 90,451 12,040 30.0
#81 Elvis Stojko Arena
Indoor ice rinks 350 16th Avenue
L4C 7A9 35,600 84 N/A 639,270 70,874 185.1
#82 Conner Building Community centres 39 King Road L4E 3K2 3,980 39 N/A 43,450 5,119 13.2 #82 Conner Building Storage facilities where
equipment or vehicles are maintained, repaired or
stored
39 King Road L4E 3K2 1,120 39 N/A 12,227 1,441 3.7
#83 Elgin West Community Centre
& Pool
Community centres 11099 Bathurst
Street
L4C 0N2 22,603 73 N/A 294,162 39,155 97.5
#83 Elgin West Community Centre
& Pool
Indoor swimming pools 11099 Bathurst
Street
L4C 0N2 11,788 87 N/A 721,716 104,356 255.5
#83 Elgin West Community Centre
& Pool
Gyms and indoor courts for playing tennis, basketball
or other sports
11099 Bathurst
Street
L4C 0N2 5,709 65 N/A 74,300 9,890 24.6
#84 Rouge Woods Community Centre
Community centres 110 Shirley Drive
L4S 1Y7 16,948 40 N/A 229,630 38,753 91.6

A-5
Operation Name Operation Type Address Postal Code
Floor Area of Space where
Operation Conducted
(sq ft)
# Hrs/ Week
Flow (ML)
Energy Type &Amount Purchased
and Consumed
Estimated GHG
Emissions (tCO2-eq) Electricity
(kWh)Natural Gas (m3)
#84 Rouge Woods Community Centre
Gyms and indoor courts for playing tennis, basketball
or other sports
110 Shirley Drive
L4S 1Y7 11,752 63 N/A 159,229 26,872 63.5
#85 Langstaff Discovery Centre
Community centres 155 Red Maple Road
L4B 4P9 11,900 40 N/A 138,408 11,187 32.2
#85 Langstaff Discovery Centre
Gyms and indoor courts for playing tennis, basketball
or other sports
155 Red Maple Road
L4B 4P9 6,100 99 N/A 70,949 5,734 16.5
#86 Oak Ridges Community Centre
Community centres 12895 Bayview Avenue
L4E 3G2 38,296 69 N/A 291,338 17,407 56.2
#86 Oak Ridges Community Centre
Indoor swimming pools 12895 Bayview Avenue
L4E 3G2 5,025 51 N/A 326,724 19,176 62.4
#86 Oak Ridges Community Centre
Gyms and indoor courts for playing tennis, basketball
or other sports
12895 Bayview Avenue
L4E 3G2 7,169 34 N/A 54,538 3,259 10.5
#86 Oak Ridges Community Centre
Indoor recreational facilities
12895 Bayview Avenue
L4E 3G2 10,168 58 N/A 38,228 2,284 7.4
#91 Lois Hancey Aquatic Centre
(Wave Pool)
Indoor swimming pools 5 Hopkins Street
L4C 0C1 30,200 73 N/A 1,328,113 141,534 373.7
#92 Centennial Pool Indoor swimming pools 161 Newkirk Road
L4C 3G6 19,242 81 N/A 729,514 101,705 250.6
#92 Centennial Pool Indoor recreational facilities
161 Newkirk Road
L4C 3G6 1,008 85 N/A 13,119 1,746 4.3
#615-81 Alfred D. Strong Fire Hall
Fire stations and associated offices and facilities
191 Major Mackenzie
Road
L4C 5J1 15,300 168 N/A 181,714 37,526 85.5

A-6
Operation Name Operation Type Address Postal Code
Floor Area of Space where
Operation Conducted
(sq ft)
# Hrs/ Week
Flow (ML)
Energy Type &Amount Purchased
and Consumed
Estimated GHG
Emissions (tCO2-eq) Electricity
(kWh)Natural Gas (m3)
1 GHG Emissions are estimated based on 2011 GHG emission factors.
#615-82 Oak Ridges Fire Hall (Robert G.
Kennedy)
Fire stations and associated offices and facilities
13067 Yonge Street
L4E 1A7 6,050 168 N/A 106,801 12,947 33.0
#615-83 16th Avenue Fire Hall (Harold J. Mills)
Fire stations and associated offices and facilities
1371 16th Avenue
L4B 1H7 5,900 168 N/A 97,329 16,823 39.6
#615-84 Elgin Mills Fire Hall (Russell ‘Curley’ Lynett)
Fire stations and associated offices and facilities
1365 Elgin Mills Road
East
L4S 2V7 6,700 168 N/A 66,367 12,945 29.8
#615-85 Bayview Glen Fire Hall (Bert
Cook)
Fire stations and associated offices and facilities
150 High Tech Road
L4B 4L7 9,600 168 N/A 100,407 14,499 35.4
#615-86 Gamble Road Fire Hall
Fire stations and associated offices and facilities
101 Gamble Road
L4E 4C1 8,934 70 N/A 29,440 6,863 15.3
#651 Bayview North Pumping Station
Facilities related to the pumping of sewage
Bethesda Sideroad
L4E 1A2 1,000 3 56.64 13,850 N/A 1.1
#652 Bayview South Pumping Station
Facilities related to the pumping of sewage
Bayview Avenue
L4B 3V1 1,000 8 154.13 47,957 N/A 3.8
#653 Invar Pumping Station
Facilities related to the pumping of sewage
538 Elgin Mills Road West
L4C 4M2
1,000 18 172.89 36,514 N/A 2.9
#654 Joyce’s Point Pumping Station
Facilities related to the pumping of sewage
276 Douglas Road
L4E 3H4 1,000 6 17.20 11,488 N/A 0.9
#656 Humberland Flats Pumping
Station
Facilities related to the pumping of sewage
Humberland Drive
L4E 3T4 1,000 34 496.84 61,786 N/A 4.9

B-1
••••••
•••••
Appendix B: Description of Renewable Energy Systems Installed
1. Solar Hot Water System at 225 EBC
The system was installed in 2008 and the total energy generated in last four years is 222,631.8 equivalent kWh, which is equivalent to 55,658 ekWh/year. The system is used to produce domestic hot water for the building. The technical specification for the system is as follows:
Collector type: Glazed Number of collectors: 12 Total gross area: 31.2 m2 (2.6 m2 /collector) Estimated system energy output: 84.14 GJ/year (or, 23.37 MWh/year) Auxiliary heating system annual efficiency: 70% Displaced energy (natural gas): 55,658 ekWh/year15 (equivalent to 10.2 % of 225 EBC’s 2012 natural gas consumption).
15 A typical 4-person household consumed energy equivalent to 130 GJ in 2007 in Ontario, which is equivalent to 36,110 ekWh (Source: Statistics Canada).
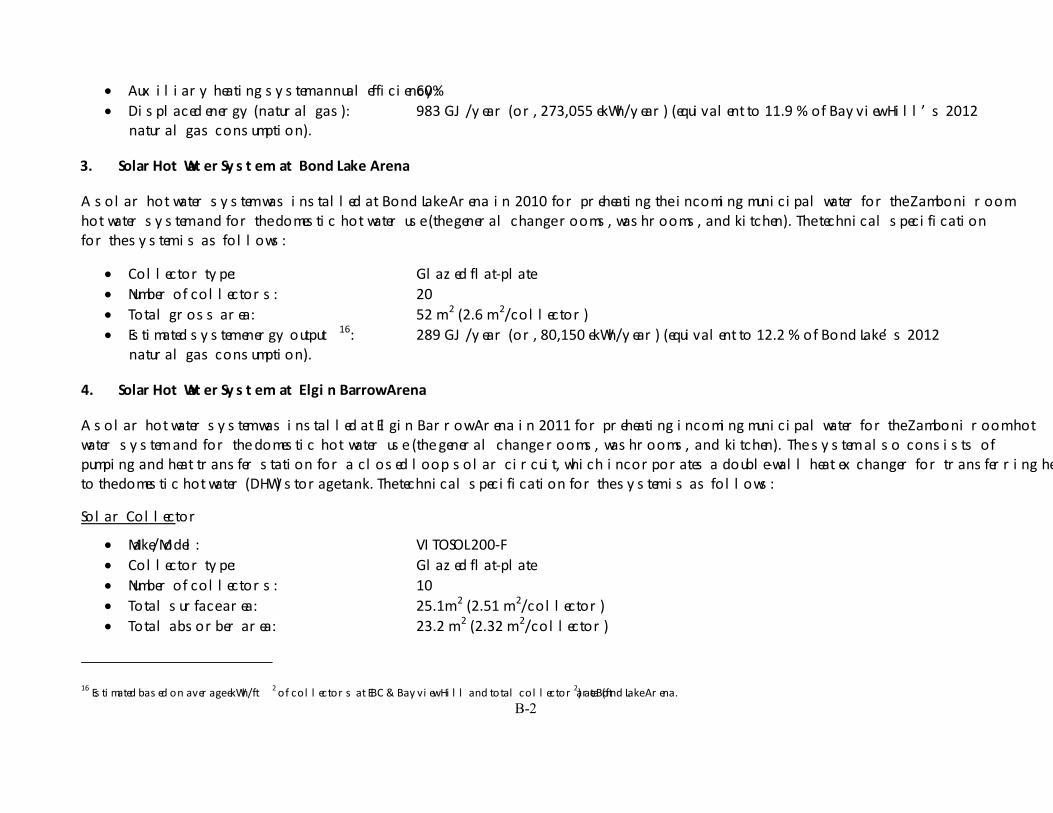
2. Solar Hot Water System at Bayview Hill Community Centre & Pool
A solar hot water system was installed at Bayview Hill Community Centre & Pool in 2010. Pool water is pumped through the filter and then through the solar collectors, where it is heated before it is returned to the pool. The technical specification for the system is as follows:
Collector type: Glazed flat-plate Number of collectors: 73 Total gross area: 210.24 m2 (2.88 m2 /collector) Total collector design flow rate: 2.43 litres/second Estimated system energy output: 590 GJ/year (or, 163,889 ekWh/year)
B-2
••
••••
•••••
Auxiliary heating system annual efficiency: 60% Displaced energy (natural gas): 983 GJ/year (or, 273,055 ekWh/year) (equivalent to 11.9 % of Bayview Hill’s 2012 natural gas consumption).
3. Solar Hot Water System at Bond Lake Arena
A solar hot water system was installed at Bond Lake Arena in 2010 for preheating the incoming municipal water for the Zamboni room hot water system and for the domestic hot water use (the general change rooms, washrooms, and kitchen). The technical specification for the system is as follows:
Collector type: Glazed flat-plate Number of collectors: 20 Total gross area: 52 m2 (2.6 m2 /collector) Estimated system energy output16: 289 GJ/year (or, 80,150 ekWh/year) (equivalent to 12.2 % of Bond Lake’s 2012 natural gas consumption).
16 Estimated based on average ekWh/ft2 of collectors at EBC & Bayview Hill and total collector area (ft2 ) at Bond Lake Arena.
4. Solar Hot Water System at Elgin Barrow Arena
A solar hot water system was installed at Elgin Barrow Arena in 2011 for preheating incoming municipal water for the Zamboni room hot water system and for the domestic hot water use (the general change rooms, washrooms, and kitchen). The system also consists of pumping and heat transfer station for a closed loop solar circuit, which incorporates a double-wall heat exchanger for transferring heat to the domestic hot water (DHW) storage tank. The technical specification for the system is as follows:
Solar Collector
Make/Model: VITOSOL 200-F Collector type: Glazed flat-plate Number of collectors: 10 Total surface area: 25.1m2 (2.51 m2 /collector) Total absorber area: 23.2 m2 (2.32 m2 /collector)

B-3
••••
•
••••••••••
•
Pumping & heat transfer station
Make/Model: Solar-Divicon-HX (DN 25) Flow meter (setting range): 1to 23 liters/min Max. number of Vitosol-F collectors: 18 Max. number of Vitosol-T tubes: 270
Estimated system energy output17: 139 GJ/year (or, 38,688 ekWh/year) (equivalent to 2.1 % of Elgin Barrow’s 2012 natural gas consumption).
17 Estimated based on average ekWh/ft2 of collectors at EBC & Bayview Hill and total collector area (ft2 ) at Elgin Barrow Arena.
5. Solar PV and Wind Mill at Richmond Green Sports Complex
Renewable energy systems installed at Richmond Green Sports Complex include a solar PV system and a wind mill. The technical specification for the systems is as follows:
Solar PV System
Make/Model: SANYO HIT Power 215N Solar Modules: Hybrid of mono-crystalline silicon surrounded by ultra-thin amorphous silicon layers Module area: 1.26 m2 /module Number of panels (in the array): 27 Module efficiency: 17.1% Cell efficiency: 19.3% Maximum system voltage: 600 V Inverter: 6 kW Rated power: 215 W/panel Solar system power rating: 5.805 kW (total from 27 panels)
Windmill System
Make/Model: Skystream 3.7

B-4
•••••••
•••••••
•••••••
Type: Downwind rotor with stall regulation control Tower: Freestanding tapered tubular steel/galvanized finish Blades: 3-Fibreglass reinforced composite Rotor diameter: 12 ft (3.72 m) Rated speed: 50-325 rpm Maximum tip speed: 216.5 ft/s (66 m/s) Rated capacity: 1.9kW continuous output and 2.6 kW peak
6. Solar PV at Elvis Stojko Arena
The technical specification for the solar PV system installed at Elvis Stojko Arena is as follows:
Make/Model: FIRST Q SLA 250P Solar Modules: Poly-crystalline solar cells (Roof mounted) PV system: Off-grid with PV Inverter Energy Meter: Inbuilt in the Inverter (Local display: Instantaneous &cumulative) Number of panels: 20 Minimum power rating: 250 W/panel Solar system power rating: 5.0 kW (total from 20 panels)
7. Solar PV at Shaw House
The technical specification for the roof mounted solar PV system at Shaw House is as follows:
Solar Modules: Mono-crystalline solar cells, Aluminum framed PV system: Grid Tied with PV Inverter Number of panels (in the array): 6 (in a row) Module efficiency: >14% System operation voltage: 240 VAC Minimum power rating: 215 W/panel Array power rating: 1.29 kW (total from 6 panels)

B-5
• • • • • •
8. Solar Hot Water System at Elgin West Community Centre & Pool
A solar hot water system is being installed at Elgin West Community Centre & Pool in 2014. Pool water is pumped through the filter and then through the solar collectors, where it is heated before it is returned to the pool. The technical specification for the system is as follows:
Make/Model: Buderus SKS 4.0 Collector type: Glazed flat-plate Number of collectors: 30 Total gross area: 72.4 m2 (25.96 ft2 /collector) Maximum flow rate: 1.07 gpm (0.7 litres/second) Estimated system energy output18: 402 GJ/year (or, 111,593 ekWh/year) (equivalent to 6.8 % of Elgin West’s 2012 natural gas consumption).
18 Estimated based on average ekWh/ft2 of collectors at EBC and Bayview Hill and total collector area (ft2 ) at Elgin West CC.
9. Ground Source Heat Pump at Richmond Hill Centre for the Performing Arts
The heritage section of the facility is heated and cooled by ground source heat pumps (HP-1 to 6) controlled by the BAS using local room sensors. Heat exchange to and from the heat pumps is from a propylene glycol loop with a pair of main circulator pumps located in the basement mechanical room. Heat supply/rejection to/from the glycol loop is through a series of vertical loop wells located in the west parking lot. A total of 1463 m of geothermal heat exchanger boreholes are installed. The boreholes are 61 m deep and installed on three rows beneath the parking lot at the rear of the theatre.
• Heating Capacity: 191 MBH19 (16 tons20) • Cooling Capacity: 246 MBH (20.5 tons)
19 1 MBH = 1000 BTU/hour. 20 12000 BTU/hour = 1 ton of Refrigeration.
Information on annual energy production was not available at the time of plan preparation.
10. Ground Source Heat Pump at Forster House

B-6
Heating and cooling is provided from 2 ground source heat pumps located in the basement. HP-101 feeds the main building. HP-102 is a split heat pump system that feeds the north meeting room. The fan section of this heat pump is located in the attic space above the meeting room. Heat exchange to and from the heat pumps is from a propylene glycol loop with a set of main circulator pumps located in the basement mechanical room. Heat supply/rejection to/from the glycol loop is through an underground horizontal loop located in the park area south of the building.
• Heating Capacity: 82.8 MBH (6.9 tons) • Cooling Capacity: 115.3 MBH (9.6 tons)
Information on annual energy production was not available at the time of plan preparation.
11. Ground Source Heat Pump at Eyer Homestead
Heating and cooling is provided from a ground source heat pump located in the basement storage room. HP-101 feeds, via a controller unit (BC-101), 9 split heat pump fan coil units (FCU-101 to 109) located in various rooms in the basement, ground & second floors.
The heat pump system is backed up from a heating water loop via a heat pump booster unit (BU-101). This heating loop is fed from a wall mount boiler (BLR-1) and feeds heating coils in the discharge ducting of the energy recovery ventilators, the basement radiant floor heating and the domestic hot water tank via an internal heating coil.
• Heating Capacity: 108 MBH (9 tons) • Cooling Capacity: 96.3 MBH (8 tons)
Information on annual energy production was not available at the time of plan preparation.
12. Solar Hot Water System at Centennial Pool
Information not available (currently under design phase).

Appendix C: Implementation Plan
Five Year (2014-2019) Plan
Previous Opportunitites/Measures (Projects implemented in 2012 & 2013)
Category Energy Conservation Opportunities/Measures Facility
Estimated Energy
Savings
(ekWh †/year)
Percent
Reduction of
Baseline (TRH
Total)
(%)
Estimated Cost
Savings/
Avoidance
($/year) Responsibility
Equipment or
process
modification
Replace Exit Signs Ed Sackfield Arena 3,056 0.01% $336 AM
Replace HVAC Refrigeration Equipment as per the result of study Ed Sackfield Arena 265,888 0.55% $29,248 AM
Install variable speed drives for pumps Central Library 39,000 0.08% $4,290 AM
Retrofit Lighting 225 EBC 105,640 0.22% $11,620 AM
Replace Richmond Hill sign to LED 225 EBC 16,980 0.04% $1,868 AM
Replace heat pumps 225 EBC TBD TBD TBD AM
Retrofit Fluorescent lighting from T12 to T8 225 EBC TBD TBD TBD AM
Replace Rooftop Units 1,2,3,4 Wave Pool 3,245 0.01% $357 AM
Lighting Engineering for Pool Area including under water lights Wave Pool TBD TBD TBD AM
Makeup Air Unit and 7 Fan Coil Units Wave Pool TBD TBD TBD AM
Implement additional Attic insulation Arts Centre TBD TBD TBD AM
Control exhaust based on CO2 concentration Elgin West CC TBD TBD TBD AM
Replace Boiler Richvale CC TBD TBD TBD AM
Replace Pool Dry-O-Tron Richvale CC TBD TBD TBD AM
Replace Boiler/DRY-O-TRON Bayview Hill CC TBD TBD TBD AM
Replace Roof Top Units 1-9 and building automation system (BAS) Bayview Hill CC TBD TBD TBD AM
Total Estimated Savings from Previous Opportunities/Measures: 433,809 0.9% $47,719
Current Opportunities/ Measures (Projects being implemented in 2014)
Equipment or
process
modification
Install infrared sensors and controllers on East Pad to improve ice temperature Tom Graham Arena 129,714 0.3% $14,269 AM
Install VFD on Brine Pumps Tom Graham Arena 139,577 0.3% $15,353 AM
Install VFD on Cooling Tower Motor Tom Graham Arena 45,545 0.1% $5,010 AM
Dehumidification of East Rink Tom Graham Arena TBD TBD TBD AM
Install solar water heating system Elgin West CC TBD TBD TBD AM
Install timer to shut off the lights in lower level parking garage Central Library 21,010 0.04% $2,311 AM
Replace Exterior Lamp Central Library TBD TBD TBD AM
Engineering for replacement of Chiller Plant Central Library TBD TBD TBD AM
Install new makeup air unit and ventilation fan 225 EBC TBD TBD TBD AM
Total Estimated Savings from Current Opportunities/Measures: 335,846 0.7% $36,943
†Equivalent kWh (Electricity: 1 ekWh = 1 kWh or 1 m
3 Natural gas: 10.627 ekWh).
TBD: To be determined (energy savings being tracked).
Baseline Energy Consumption (2012 Energy Consumption (TRH Total)): 48,092,336 ekWh.
TBD: To be determined (Projects underway, energy savings being estimated - not available at the present time).
AM: Asset Management.
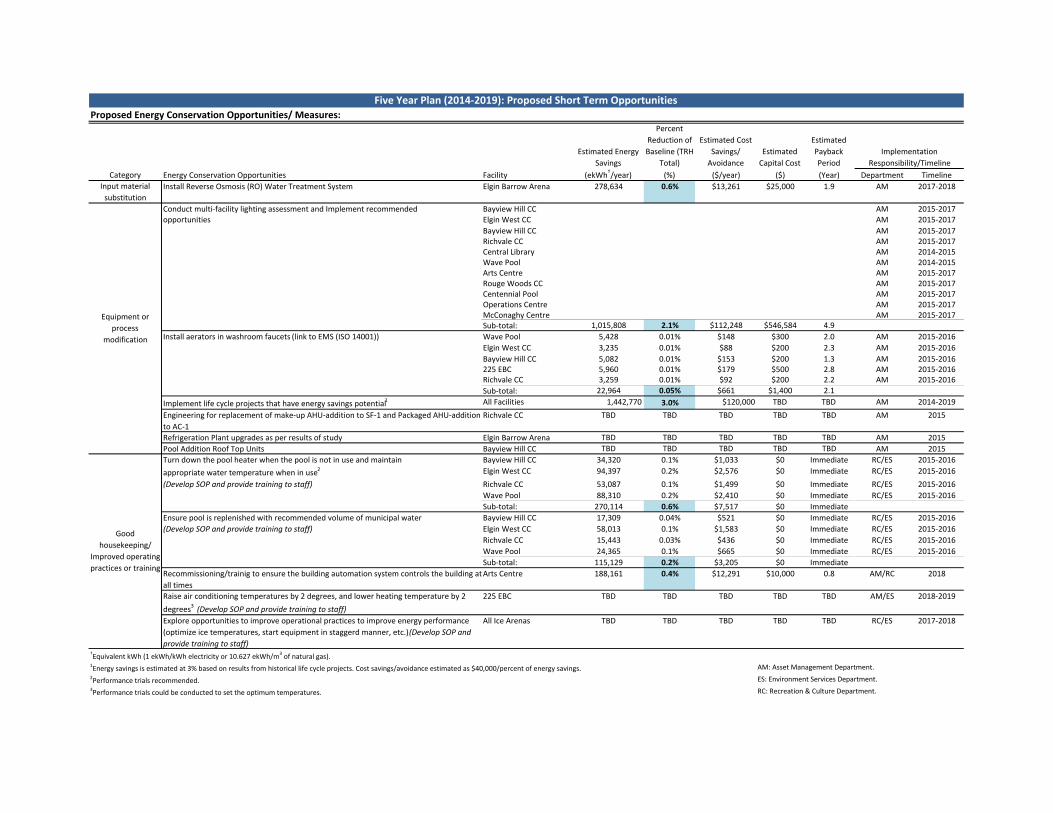
Five Year Plan (2014-2019): Proposed Short Term Opportunities
Proposed Energy Conservation Opportunities/ Measures:
Category Energy Conservation Opportunities Facility
Estimated Energy
Savings
(ekWh †/year)
Percent
Reduction of
Baseline (TRH
Total)
(%)
Estimated Cost
Savings/
Avoidance
($/year)
Estimated
Capital Cost
($)
Estimated
Payback
Period
(Year)
Implementation
Responsibility/Timeline
Department Timeline
Input material
substitution
Install Reverse Osmosis (RO) Water Treatment System Elgin Barrow Arena 278,634 0.6% $13,261 $25,000 1.9 AM 2017-2018
Equipment or
process
modification
Conduct multi-facility lighting assessment and Implement recommended
opportunities
Bayview Hill CC AM 2015-2017
Elgin West CC AM 2015-2017
Bayview Hill CC AM 2015-2017
Richvale CC AM 2015-2017
Central Library AM 2014-2015
Wave Pool AM 2014-2015
Arts Centre AM 2015-2017
Rouge Woods CC AM 2015-2017
Centennial Pool AM 2015-2017
Operations Centre AM 2015-2017
McConaghy Centre AM 2015-2017
Sub-total: 1,015,808 2.1% $112,248 $546,584 4.9
Install aerators in washroom faucets (link to EMS (ISO 14001)) Wave Pool 5,428 0.01% $148 $300 2.0 AM 2015-2016
Elgin West CC 3,235 0.01% $88 $200 2.3 AM 2015-2016
Bayview Hill CC 5,082 0.01% $153 $200 1.3 AM 2015-2016
225 EBC 5,960 0.01% $179 $500 2.8 AM 2015-2016
Richvale CC 3,259 0.01% $92 $200 2.2 AM 2015-2016
Sub-total: 22,964 0.05% $661 $1,400 2.1
Implement life cycle projects that have energy savings potential 1 All Facilities 1,442,770 3.0% $120,000 TBD TBD AM 2014-2019
Engineering for replacement of make-up AHU-addition to SF-1 and Packaged AHU-addition
to AC-1
Richvale CC TBD TBD TBD TBD TBD AM 2015
Refrigeration Plant upgrades as per results of study Elgin Barrow Arena TBD TBD TBD TBD TBD AM 2015
Pool Addition Roof Top Units Bayview Hill CC TBD TBD TBD TBD TBD AM 2015
Good
housekeeping/
Improved operating
practices or training
Turn down the pool heater when the pool is not in use and maintain
appropriate water temperature when in use 2
(Develop SOP and provide training to staff)
Bayview Hill CC 34,320 0.1% $1,033 $0 Immediate RC/ES 2015-2016
Elgin West CC 94,397 0.2% $2,576 $0 Immediate RC/ES 2015-2016
Richvale CC 53,087 0.1% $1,499 $0 Immediate RC/ES 2015-2016
Wave Pool 88,310 0.2% $2,410 $0 Immediate RC/ES 2015-2016
Sub-total: 270,114 0.6% $7,517 $0 Immediate
Ensure pool is replenished with recommended volume of municipal water
(Develop SOP and provide training to staff)
Bayview Hill CC 17,309 0.04% $521 $0 Immediate RC/ES 2015-2016
Elgin West CC 58,013 0.1% $1,583 $0 Immediate RC/ES 2015-2016
Richvale CC 15,443 0.03% $436 $0 Immediate RC/ES 2015-2016
Wave Pool 24,365 0.1% $665 $0 Immediate RC/ES 2015-2016
Sub-total: 115,129 0.2% $3,205 $0 Immediate
Recommissioning/trainig to ensure the building automation system controls the building at
all times
Arts Centre 188,161 0.4% $12,291 $10,000 0.8 AM/RC 2018
Raise air conditioning temperatures by 2 degrees, and lower heating temperature by 2
degrees 3
(Develop SOP and provide training to staff)
225 EBC TBD TBD TBD TBD TBD AM/ES 2018-2019
Explore opportunities to improve operational practices to improve energy performance
(optimize ice temperatures, start equipment in staggerd manner, etc.) (Develop SOP and
provide training to staff)
All Ice Arenas TBD TBD TBD TBD TBD RC/ES 2017-2018
†Equivalent kWh (1 ekWh/kWh electricity or 10.627 ekWh/m
3 of natural gas).
1Energy savings is estimated at 3% based on results from historical life cycle projects. Cost savings/avoidance estimated as $40,000/percent of energy savings.
2Performance trials recommended.
3Performance trials could be conducted to set the optimum temperatures.
AM: Asset Management Department.
ES: Environment Services Department.
RC: Recreation & Culture Department.
Energy Conservation Opportunities Facility (ekWh†/year) (%) ($/year) ($) (Year) Department Timeline
Proposed Energy Conservation Opportunities/ Measures:
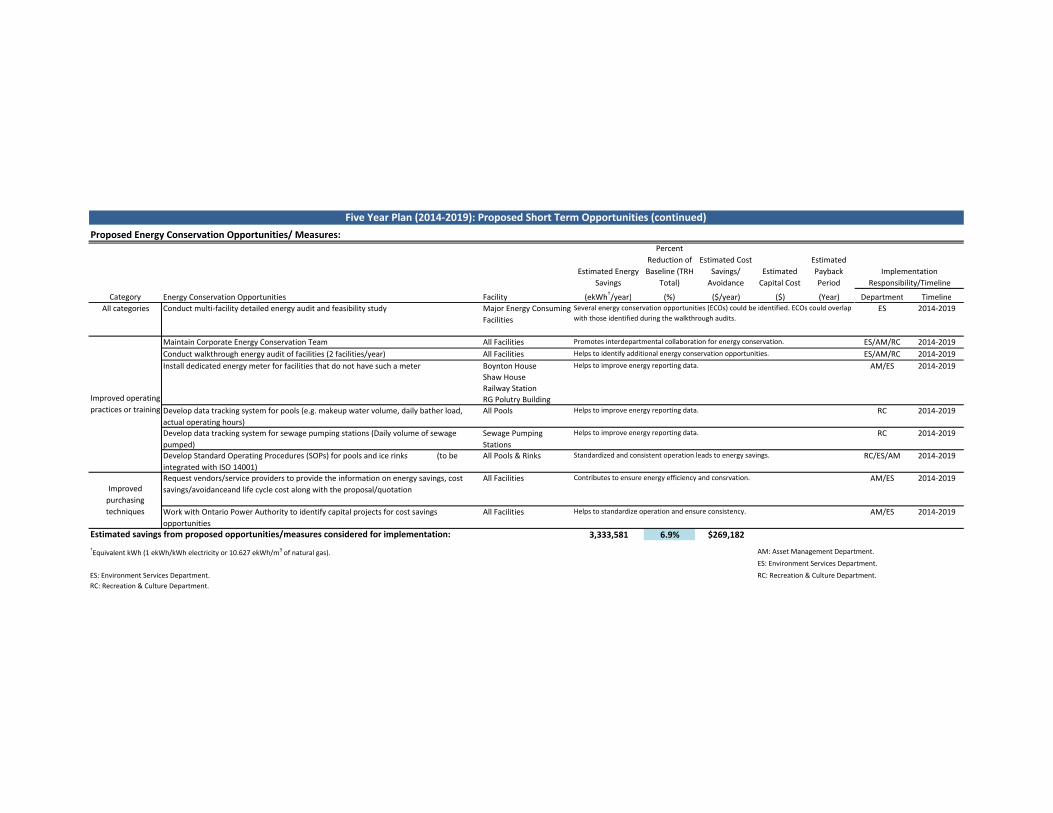
Five Year Plan (2014-2019): Proposed Short Term Opportunities (continued)
Category
Estimated Energy
Savings
Percent
Reduction of
Baseline (TRH
Total)
Estimated Cost
Savings/
Avoidance
Estimated
Capital Cost
Estimated
Payback
Period
Implementation
Responsibility/Timeline
All categories Conduct multi-facility detailed energy audit and feasibility study Major Energy Consuming
Facilities
Several energy conservation opportunities (ECOs) could be identified. ECOs could overlap
with those identified during the walkthrough audits.
ES 2014-2019
Improved operating
practices or training
Maintain Corporate Energy Conservation Team All Facilities Promotes interdepartmental collaboration for energy conservation. ES/AM/RC 2014-2019
Conduct walkthrough energy audit of facilities (2 facilities/year) All Facilities Helps to identify additional energy conservation opportunities. ES/AM/RC 2014-2019
Install dedicated energy meter for facilities that do not have such a meter Boynton House
Shaw House
Railway Station
RG Polutry Building
Helps to improve energy reporting data. AM/ES 2014-2019
Develop data tracking system for pools (e.g. makeup water volume, daily bather load,
actual operating hours)
All Pools Helps to improve energy reporting data. RC 2014-2019
Develop data tracking system for sewage pumping stations (Daily volume of sewage
pumped)
Sewage Pumping
Stations
Helps to improve energy reporting data. RC 2014-2019
Develop Standard Operating Procedures (SOPs) for pools and ice rinks (to be
integrated with ISO 14001)
All Pools & Rinks Standardized and consistent operation leads to energy savings. RC/ES/AM 2014-2019
Improved
purchasing
techniques
Request vendors/service providers to provide the information on energy savings, cost
savings/avoidanceand life cycle cost along with the proposal/quotation
All Facilities Contributes to ensure energy efficiency and consrvation. AM/ES 2014-2019
Work with Ontario Power Authority to identify capital projects for cost savings
opportunities
All Facilities Helps to standardize operation and ensure consistency. AM/ES 2014-2019
Estimated savings from proposed opportunities/measures considered for implementation: 3,333,581 6.9% $269,182
†Equivalent kWh (1 ekWh/kWh electricity or 10.627 ekWh/m
3 of natural gas).
ES: Environment Services Department.
RC: Recreation & Culture Department.
AM: Asset Management Department.
ES: Environment Services Department.
RC: Recreation & Culture Department.

-
-
Future Projects (2019+): Proposed Long Term Opportunities
Proposed Energy Conservation Opportunities/ Measures:
Category Energy Conservation Opportunities Facility
Estimated Energy
Savings
(ekWh †/year)
Percent
Reduction of
Baseline (TRH
Total)
(%)
Estimated Cost
Savings/
Avoidance
($/year)
Estimated
Capital Cost
($)
Estimated
Payback
Period
(Year)
Implementation
Responsibility/Timeline
Department Timeline
Input material
substitution
Conduct feasibility study to install Reverse Osmosis (RO) Water Treatment System Tom Graham Arena 452,346 0.9% $18,660 $25,000 1.3 ES 2015-2019
Bond Lake Arena TBD TBD TBD TBD TBD ES 2015-2019
Sub-total: 452,346 0.9% $18,660 $25,000 1.3
Equipment or
process
modification
Conduct multi-facility lighting and control assessment and implement
recommended opportunities 1
Tom Graham Arena ES 2015-2019
Elgin Barrow Arena ES 2015-2019
Ed Sackfield Arena ES 2015-2019
225 EBC ES 2015-2019
Sub-total: 410,041 0.9% 44,985 $156,980 3.5
Conduct feasibility study to install Infrared Sensors and controllers on West Pad to improve
ice temperature
Tom Graham 149,257 0.3% $16,418 $80,000 4.9 ES 2015-2019
Conduct feasibility study to install low emissivity ceiling (e-ceiling) over ice pads Tom Graham Arena 153,203 0.3% $16,852 $70,000 4.2 ES 2015-2019
Elgin Barrow Arena 97,005 0.2% $12,611 $70,000 5.6 ES 2015-2019
Ed Sackfield Arena 76,763 0.2% $9,212 $41,300 4.5 ES 2015-2019
Other Ice Arenas Further investigation required. ES 2015-2019
Sub-total: 326,971 0.7% $38,675 $181,300 4.7
Over the ice heat management All Ice Arenas Further investigation required.
Install meters to track natural gas consumption TBD TBD TBD TBD TBD AM 2015-2019+
Conduct feasibility study to install waste heat recovery system TBD TBD TBD TBD TBD ES 2015-2019
Conduct feasibility study to install pool cover when it is not in use to minimize evaporation Bayview Hill CC 176,031 0.4% $5,300 TBD TBD ES 2015-2019
Elgin West CC 125,862 0.3% $3,434 TBD TBD ES 2015-2019
Richvale CC 70,782 0.1% $1,998 TBD TBD ES 2015-2019
Wave Pool 176,621 0.4% $4,819 TBD TBD ES 2015-2019
Other Pools Further investigation required. ES 2015-2019
Sub-total: 549,296 1.1% $15,552 TBD TBD
Conduct feasibility study to improve balancing of booster pumps to optimize the system 225 EBC 22,305 0.05% $2,677 $4,000 1.5 ES 2015-2019
Central Library 18,465 0.04% $2,169 $4,000 1.8 ES 2015-2019
Sub-total: 40,770 0.1% $4,846 $8,000 1.7
Replace existing electric domestic hot water boiler with natural gas fired
instantaneous boiler through life cycle (when replaced)
Ed Sackfield Saves energy. AM 2014-2019+
Bayview Hill CC Saves energy. AM 2014-2019+
Replace ageing conventional boiler with high efficiency boiler through life cycle (when
replaced)
Central Library Efficient boiler leads to reduced energy consumption. AM 2014-2019+
Conduct feasibility study to install solar panels Pools, Arenas, CC Reduces dependency on grid energy supply. AM/ES 2015-2019+
Improved operating
practices or training
Turn off office equipment when it is not needed at night or on the weekends2
(Develop
SOP and provide training to staff)
All Facilities 164,244 0.3% $19,709 $0 Immediate IT/ES 2015-2019+
Onsite reuse or
recovery
Conduct feasibility study to recover waste heat from refrigeration compressors for
preheating flood water or domestic hot water or melting ice 3
All Ice Arenas
(except Elgin Barrow)
Energy saving potential is high. Further investigation required. ES 2015-2019
Conduct feasibility study to recover waste heat from discarded pool water to preheat pool
supply water
All Pools Saves natural gas. ES 2015-2019
Estimated energy savings from proposed long term opportunities/measures (2019+): 2,092,926 4.4% $158,846 1Potential opportunities were identified during the walkthrough energy audits (includes lighting controls).
2Preliminary energy savings estimated for 225 EBC only.
3Refrigeration plant upgrades as per result of study for Elgin Barrow Arena was initiated in 2014 (see 2015-2019 Opportunities/Measures).
Baseline (2012) Energy Consumption (TRH Total): 48,092,336 ekWh.
Energy savings/avoidance is based on 2012 energy cost.
Incentives maybe available from organizations such as utility companies to offset the capital cost (could improve the payback period).
Implementation of opportunities is subject to availability of funding and priorities.
The implementation plan maybe modified based on outcomes of feasibility study and timing of projects (yearly review of plan will confirm project status).
A typical 4-person household consumed energy equivalent to 130 GJ in 2007 in Ontario, which is equivalent to 36,110 ekWh (Source: Statistics Canada).
Energy Conservation Opportunity (ECO) Categories:
1: Good housekeeping; 2: Input material substitution; 3: Process or equipment modification; 4: Onsite reuse or recovery; 5: Improved operating practices or Training; 6: Improved purchasing techniques.
ES: Environment Services Division
AM: Asset Management Division
IT: Information Technology Division
TBD: To be determined (further investigation required).