Embed Size (px)
Citation preview
25. N. H. Schlieben et al., J. Mol. Biol. 349, 801–813(2005).
26. K. Tauber et al., Chemistry 19, 4030–4035 (2013).27. See supplementary materials on Science Online.28. A. C. Price, Y.-M. Zhang, C. O. Rock, S. W. White, Structure 12,
417–428 (2004).29. The Ph-AmDH tolerates different buffers well (i.e., ammonium
chloride, formate, borate, citrate, acetate, oxalate). However, thehomotetrameric LBv-ADHs contains two Mg2+ centers; therefore,strong chelators such as oxalate, citrate, and acetate must beavoided as buffer salts. Removal of these Mg2+ ions inactivates theenzyme (32).
30. B. R. Bommarius, M. Schürmann, A. S. Bommarius, Chem.Commun. 50, 14953–14955 (2014).
31. R. Cannio, M. Rossi, S. Bartolucci, Eur. J. Biochem. 222,345–352 (1994).
32. K. Niefind, J. Müller, B. Riebel, W. Hummel, D. Schomburg,J. Mol. Biol. 327, 317–328 (2003).
ACKNOWLEDGMENTS
The research leading to these results received funding from theEuropean Union’s Seventh Framework Programme FP7/2007-2013under grant agreement 266025 (BIONEXGEN). The project leadingto this application has received funding from the EuropeanResearch Council under the European Union’s Horizon 2020research and innovation program (grant agreement no. 638271,BioSusAmin). T.K. and N.S.S. received funding from UKBiotechnology and Biological Sciences Research Council (BBSRC;BB/K0017802/1). N.J.T. is grateful to the Royal Society for aWolfson Research Merit Award. Some aspects of the resultsreported here are the subject of a provisional patent application.Author contributions: F.G.M. and N.J.T. conceived the project and
wrote the manuscript; F.G.M. planned the experiments, expressedand purified the AmDHs, performed the biocatalytic reactions, andanalyzed the data; T.K. performed the gene cloning of all AmDHsand purified the ADHs; N.S.S. and M.B. provided intellectual andtechnical support; and M.B. and BASF provided the ADHs. Wethank R. Heath for a preliminary kinetic assay of the Ph-AmDH.
SUPPLEMENTARY MATERIALS
www.sciencemag.org/content/349/6255/1525/suppl/DC1Materials and MethodsFigs. S1 to S12Tables S1 to S20References (33–36)
30 June 2015; accepted 14 August 201510.1126/science.aac9283
BATTERIES
Alkaline quinone flow batteryKaixiang Lin,1 Qing Chen,2 Michael R. Gerhardt,2 Liuchuan Tong,1 Sang Bok Kim,1
Louise Eisenach,3 Alvaro W. Valle,3 David Hardee,1 Roy G. Gordon,1,2*Michael J. Aziz,2* Michael P. Marshak1,2*
Storage of photovoltaic and wind electricity in batteries could solve the mismatch problembetween the intermittent supply of these renewable resources and variable demand. Flowbatteries permit more economical long-duration discharge than solid-electrode batteries byusing liquid electrolytes stored outside of the battery.We report an alkaline flow battery basedon redox-active organic molecules that are composed entirely of Earth-abundant elementsand are nontoxic, nonflammable, and safe for use in residential and commercial environments.The battery operates efficiently with high power density near room temperature.These resultsdemonstrate the stability and performance of redox-active organic molecules in alkalineflow batteries, potentially enabling cost-effective stationary storage of renewable energy.
The cost of photovoltaic (PV) and wind elec-tricity has dropped so much that one of thelargest barriers to getting most of our elec-tricity from these renewable sources is theirintermittency (1–3). Batteries provide ameans
to store electrical energy; however, traditional, en-closed batteriesmaintain discharge at peak powerfor far too short a duration to adequately regulatewind or solar power output (1, 2). In contrast, flowbatteries can independently scale the power and
energy components of the system by storing theelectro-active species outside the battery containeritself (3–5). In a flow battery, the power is gen-erated in a device resembling a fuel cell, whichcontains electrodes separatedby an ion-permeablemembrane. Liquid solutions of redox-active spe-cies are pumped into the cell, where they can becharged and discharged, before being returned tostorage in an external storage tank. Scaling theamount of energy to be stored thus involves sim-ply making larger tanks (Fig. 1A). Existing flowbatteries are based on metal ions in acidic solu-tion, but challengeswith corrosivity, hydrogen evo-lution, kinetics, materials cost and abundance, andefficiency thus far have prevented large-scale com-mercialization. The use of anthraquinones in anacidic aqueous flow battery can dramatically
SCIENCE sciencemag.org 25 SEPTEMBER 2015 • VOL 349 ISSUE 6255 1529
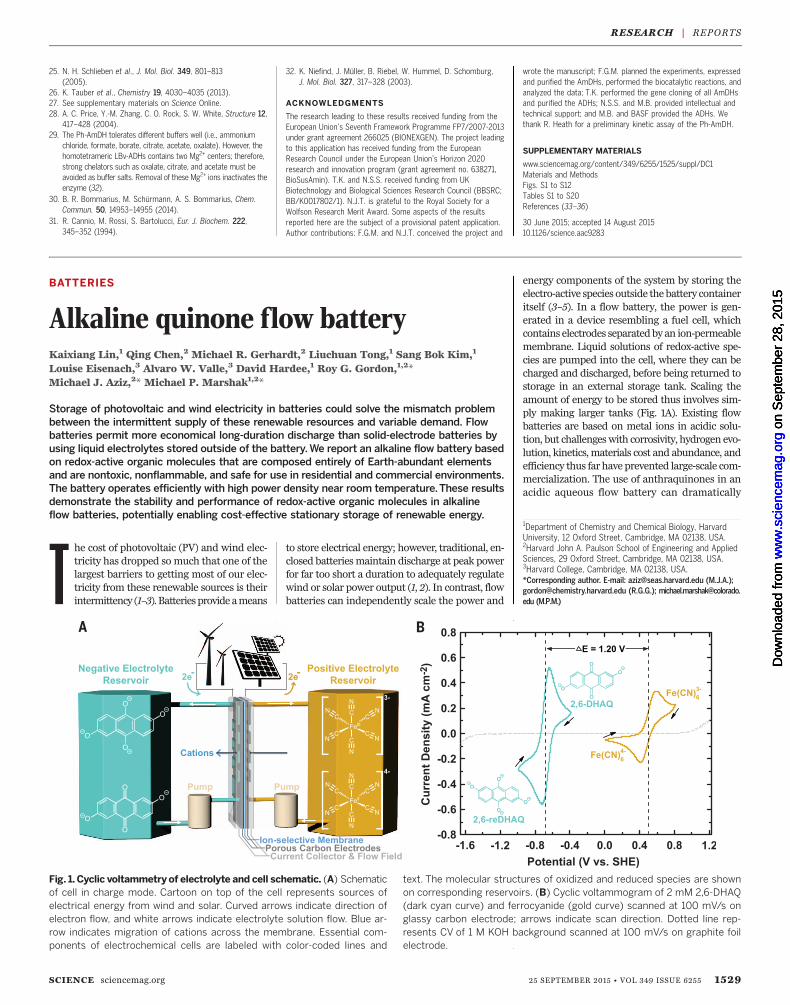
Fig. 1. Cyclic voltammetry of electrolyte and cell schematic. (A) Schematicof cell in charge mode. Cartoon on top of the cell represents sources ofelectrical energy from wind and solar. Curved arrows indicate direction ofelectron flow, and white arrows indicate electrolyte solution flow. Blue ar-row indicates migration of cations across the membrane. Essential com-ponents of electrochemical cells are labeled with color-coded lines and
text. The molecular structures of oxidized and reduced species are shownon corresponding reservoirs. (B) Cyclic voltammogram of 2 mM 2,6-DHAQ(dark cyan curve) and ferrocyanide (gold curve) scanned at 100 mV/s onglassy carbon electrode; arrows indicate scan direction. Dotted line rep-resents CV of 1 M KOH background scanned at 100 mV/s on graphite foilelectrode.
1Department of Chemistry and Chemical Biology, HarvardUniversity, 12 Oxford Street, Cambridge, MA 02138, USA.2Harvard John A. Paulson School of Engineering and AppliedSciences, 29 Oxford Street, Cambridge, MA 02138, USA.3Harvard College, Cambridge, MA 02138, USA.*Corresponding author. E-mail: [email protected] (M.J.A.);[email protected] (R.G.G.); [email protected] (M.P.M.)
RESEARCH | REPORTS
on
Sep
tem
ber
28, 2
015
ww
w.s
cien
cem
ag.o
rgD
ownl
oade
d fr
om
on
Sep
tem
ber
28, 2
015
ww
w.s
cien
cem
ag.o
rgD
ownl
oade
d fr
om
on
Sep
tem
ber
28, 2
015
ww
w.s
cien
cem
ag.o
rgD
ownl
oade
d fr
om
on
Sep
tem
ber
28, 2
015
ww
w.s
cien
cem
ag.o
rgD
ownl
oade
d fr
om
reduce battery costs (6, 7); however, the use ofbromine in the other half of the system precludesdeployment in residential communities owing totoxicity concerns.We demonstrate that quinone-based flow bat-
teries can be adapted to alkaline solutions, wherehydroxylated anthraquinones are highly solubleand bromine can be replaced with the nontoxicferricyanide ion (8, 9)—a food additive (10). Func-tionalization of 9,10-anthraquinone (AQ) withelectron-donating groups such as OH has beenshown to lower the reduction potential and ex-pand the battery voltage (6). In alkaline solution,these OH groups are deprotonated to provide sol-ubility and greater electron donation capability,which results in an increase in the open-circuitvoltage (OCV) of 47%over the previously reportedsystem. Because functionalization away from theketone group providesmolecules with the highestsolubility (11, 12), we initially targeted commerciallyavailable2,6-dihydroxyanthraquinone (2,6-DHAQ),
which we find exhibits a room-temperature sol-ubility of >0.6 M in 1 M KOH. This system canachieve power densities of >0.45W cm−2 at roomtemperature and 0.7 W cm−2 at 45°C.The use of alkaline electrolyte exploits pH as a
parameter to shift the thermodynamic potentialsof proton-dependent reactions to more negativevalues. In acid solutions, AQ undergoes a two-electron two-proton reduction at a single poten-tial, which shifts to more negative values as thepH increases (6). When the pH exceeds 12, thereduction potential of 2,6-DHAQ becomes pH-independent because the reduced species is gen-erated in its fully deprotonated form (fig. S1). Incontrast with the pH-dependent electrochemicalbehavior of quinones (negative terminal), theferro/ferricyanide redox couple (positive terminal)has a pH-independent redox potential. This con-trasting pH dependence can be exploited throughthe development of low–reduction potential qui-nones at high pH. The cyclic voltammograms
(CVs) of 2,6-DHAQ and ferro/ferricyanide predictan equilibrium cell potential of 1.2 V upon com-bination of these two half-reactions (Fig. 1B). Aquantitative analysis of the CV of 2,6-DHAQ atpH 14 (fig. S2) revealed redox behavior consistentwith two one-electron reductions at potentialsseparated by only 0.06 V, with a rapid kinetic ratesimilar to that of quinones in acid (6). This be-havior raises interesting questions about the re-lationship between quinone redox and hydrogenbonding (13).Cell testing was performed at 20°C with so-
lutions of 0.5 M 2,6-DHAQ dipotassium salt and0.4 M K4Fe(CN)6, both dissolved in 1 M KOH.These solutions were pumped through a flow cellconstructed from graphite flow plates and carbonpaper electrodes,whichwere separatedbyaNafionmembrane. A charging current of 0.1 A cm−2 wasapplied to charge the cell, and polarization curveswere measured at 10, 50, and 100% states ofquinone charge (SOC). The OCV is 1.2 V at 50%
1530 25 SEPTEMBER 2015 • VOL 349 ISSUE 6255 sciencemag.org SCIENCE
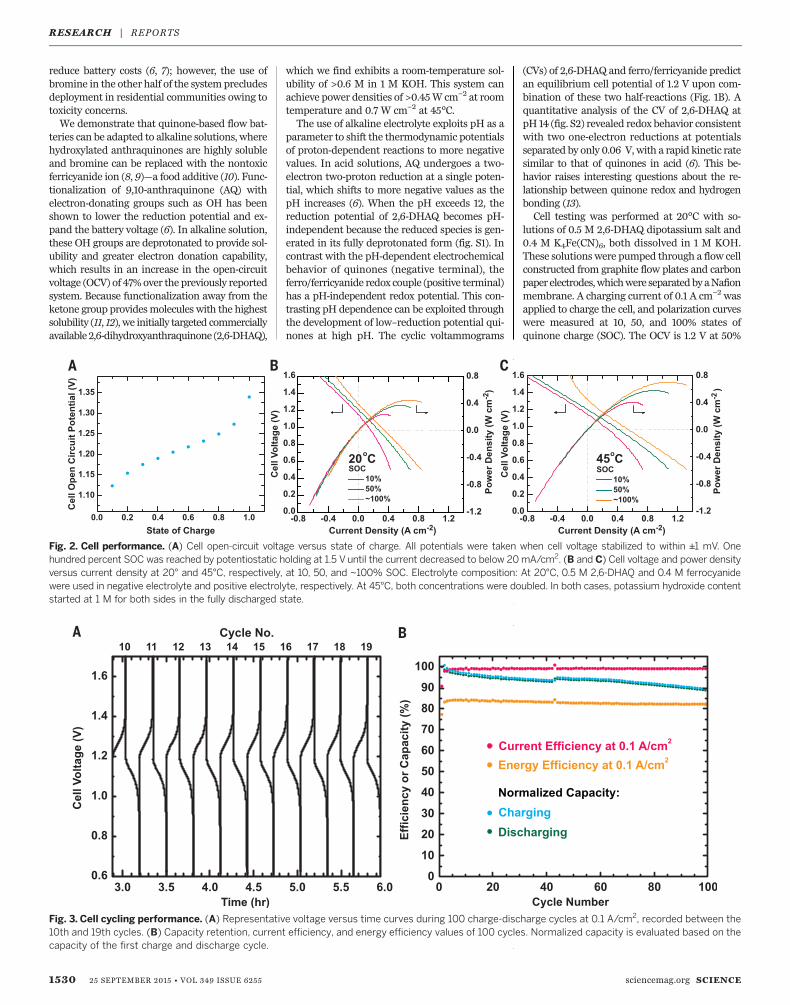
Fig. 2. Cell performance. (A) Cell open-circuit voltage versus state of charge. All potentials were taken when cell voltage stabilized to within ±1 mV. Onehundred percent SOC was reached by potentiostatic holding at 1.5 V until the current decreased to below 20mA/cm2. (B and C) Cell voltage and power densityversus current density at 20° and 45°C, respectively, at 10, 50, and ~100% SOC. Electrolyte composition: At 20°C, 0.5 M 2,6-DHAQ and 0.4 M ferrocyanidewere used in negative electrolyte and positive electrolyte, respectively. At 45°C, both concentrations were doubled. In both cases, potassium hydroxide contentstarted at 1 M for both sides in the fully discharged state.
Fig. 3. Cell cycling performance. (A) Representative voltage versus time curves during 100 charge-discharge cycles at 0.1 A/cm2, recorded between the10th and 19th cycles. (B) Capacity retention, current efficiency, and energy efficiency values of 100 cycles. Normalized capacity is evaluated based on thecapacity of the first charge and discharge cycle.
RESEARCH | REPORTS
SOC; its dependence on SOC is shown in Fig. 2A.The polarization curves (Fig. 2B) show no sign ofredox kinetic limitations and exhibit a peak gal-vanic power density exceeding 0.4 W cm−2.The cell was cycled at a constant current den-
sity of ±0.1 A cm−2 for 100 cycles (Fig. 3A). Thecurrent efficiency exceeded 99%, with a stableround-trip energy efficiency of 84%. A 0.1% lossin capacity per cycle was observed during cycling,which appears to be a continuous loss of elec-trolyte over the 100 cycles. Three possible lossmechanisms were explored: chemical decompo-sition, electrolyte crossover through the mem-brane, and leakage from the pumping system.Chemical and electrochemical stability studiesshowed that the negative electrolyte is stable.Tenmillimolar 2,6-DHAQwasheated in 5MKOHsolution at 100°C for 30 days and was charac-terized by proton nuclear magnetic resonance(NMR). Cycled negative electrolyte was also col-lected and characterized by the same method;both studies showed no degradation product atthe sensitivity level of 1% (fig. S3). Membranecrossover contamination has been a common chal-lenge in acid-based redox flow batteries, wheremost electro-active molecules are either neutralor positive and tend to migrate through proton-conductivemembranes (5). In this alkaline system,
however, all the electro-active molecules remainnegatively charged in all charge states, leading toa dramatic decrease in the degree of crossoverduring cell cycling. Cyclic voltammetry of the ferro/ferricyanide electrolyte collected at the end ofcycling showed no evidence of the presence of2,6-DHAQ. This observation places an upperlimit on crossover of 0.8% of the DHAQ, imply-ing a crossover current density of <2.5 mA cm−2
(fig. S4). Finally, hydraulic leakage was investi-gated because an apparent but unquantifiablesmall decrease in fluid levels was observed in thereservoirs. After cell cycling, the cell was washedwith deionizedwater until no coloration of eluentcould be observed. The cellwas thendisassembled;coloration was found on the gaskets, indicatingthe likely site of electrolyte leakage (fig. S5). Thissource of capacity loss—equivalent to roughlyeight drops in our system—is expected to becomenegligible as system size is scaled up.By increasing the temperature to 45°C, the
peak galvanic power density increases from 0.45to ~0.7 W cm−2 (Fig. 2C), as the cell area-specificresistance (ASR) decreases from about 0.878 to0.560 ohm cm2, estimated from the linear partsof the polarization curves in Fig. 2. Most of thisASR decrease comes from a change in the high-frequency ASR (rhf)measured by electrochemical
impedance spectroscopy (fig. S6). In both cases,the rhf contributes more than 70% of the ASRand is indeed the limiting factor to the cell cur-rent and power outputs. The rhf is dominated bythe resistance of the membrane, which is an or-der of magnitude higher than the resistance ofthe same membrane in a pH 0 acid solution (14).The sluggish kinetics of the hydrogen evolution
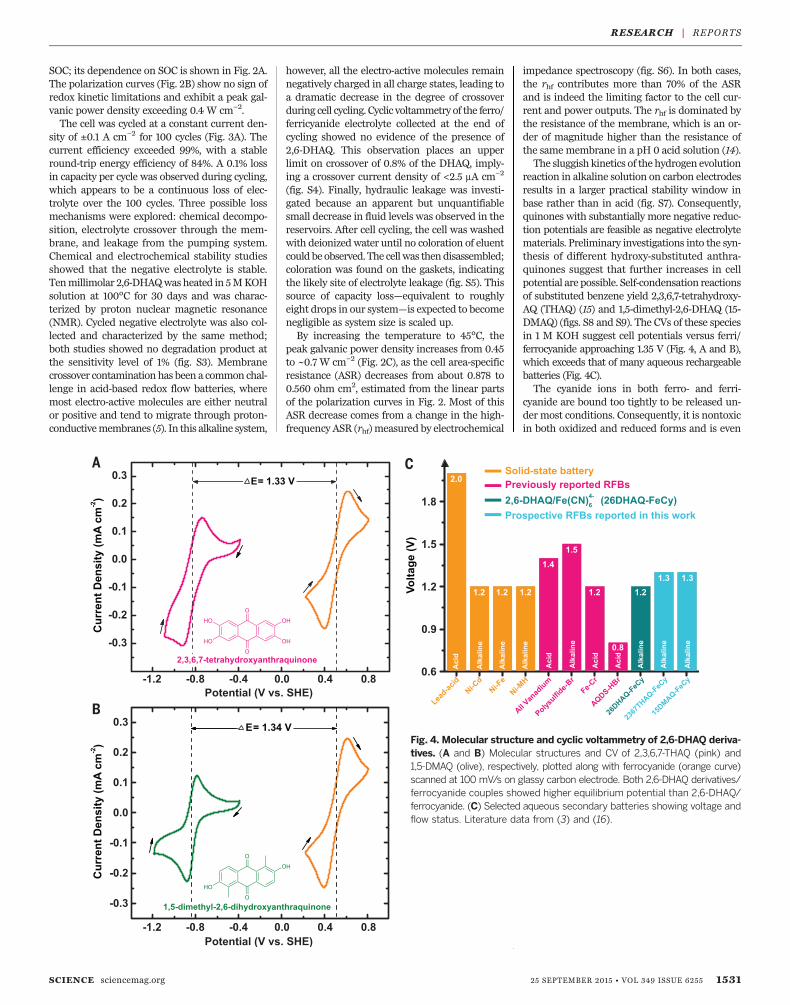
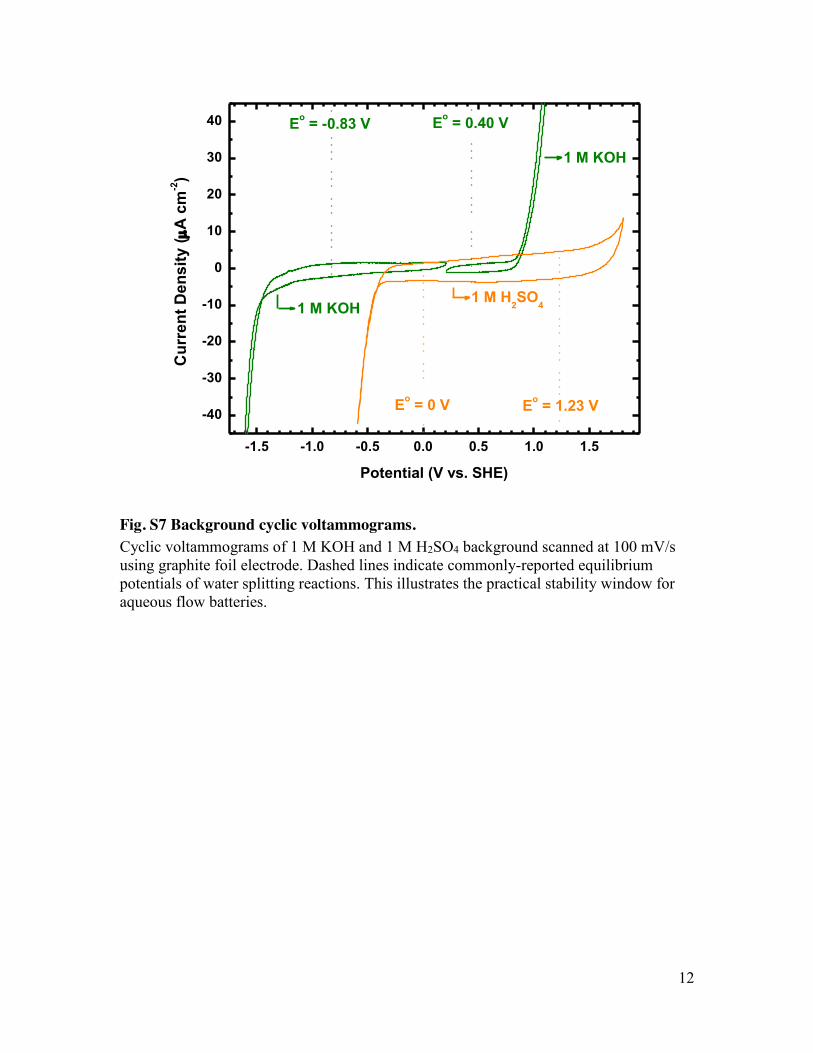
reaction in alkaline solution on carbon electrodesresults in a larger practical stability window inbase rather than in acid (fig. S7). Consequently,quinones with substantially more negative reduc-tion potentials are feasible as negative electrolytematerials. Preliminary investigations into the syn-thesis of different hydroxy-substituted anthra-quinones suggest that further increases in cellpotential are possible. Self-condensation reactionsof substituted benzene yield 2,3,6,7-tetrahydroxy-AQ (THAQ) (15) and 1,5-dimethyl-2,6-DHAQ (15-DMAQ) (figs. S8 and S9). The CVs of these speciesin 1 M KOH suggest cell potentials versus ferri/ferrocyanide approaching 1.35 V (Fig. 4, A and B),which exceeds that of many aqueous rechargeablebatteries (Fig. 4C).The cyanide ions in both ferro- and ferri-
cyanide are bound too tightly to be released un-der most conditions. Consequently, it is nontoxicin both oxidized and reduced forms and is even
SCIENCE sciencemag.org 25 SEPTEMBER 2015 • VOL 349 ISSUE 6255 1531
Fig. 4. Molecular structure and cyclic voltammetry of 2,6-DHAQ deriva-tives. (A and B) Molecular structures and CV of 2,3,6,7-THAQ (pink) and1,5-DMAQ (olive), respectively, plotted along with ferrocyanide (orange curve)scanned at 100 mV/s on glassy carbon electrode. Both 2,6-DHAQ derivatives/ferrocyanide couples showed higher equilibrium potential than 2,6-DHAQ/ferrocyanide. (C) Selected aqueous secondary batteries showing voltage andflow status. Literature data from (3) and (16).
RESEARCH | REPORTS
permitted for use as a food additive (10). The use offerrocyanide offers notable advantages over bro-mine because it is nonvolatile and noncorrosive,allowing simpler and less expensive materials ofconstruction. In addition, these tri- and tetra-anionic organometallic molecules exhibit low cross-over rates through cation-exchange membranes.The results reported herein highlight the ability
of hydroxy-substituted anthraquinone and ferro-cyanide to function as stable flow battery electro-lytes in alkaline solution. The use of organic andorganometallic coordination complexes in base,rather than aqueous metal ions in acid, resolvesserious cost, corrosion, and safety concerns ofprevious flow battery chemistries. Alkaline flowbatteries can compensate for higher membraneresistance with higher voltage, leading to perfor-mance similar to that of their acidic counter-parts. In addition, quinone-ferrocyanide alkalinechemistry avoids the membrane crossover, cor-rosivity, toxicity, and regulations associated withbromine. This reduced corrosivity can lead to asubstantially lower materials cost because manycomponents can be made of inexpensive poly-olefin or poly(vinyl chloride) plastics.
REFERENCES AND NOTES
1. B. Dunn, H. Kamath, J.-M. Tarascon, Science 334, 928–935(2011).
2. Z. Yang et al., Chem. Rev. 111, 3577–3613 (2011).3. T. Nguyen, R. F. Savinell, Electrochem. Soc. Interface 19, 54–56
(2010).4. D. Biello, Sci. Am. 311, 66–71 (November 2014).5. M. Skyllas-Kazacos, M. H. Chakrabarti, S. A. Hajimolana,
F. S. Mjalli, M. Saleem, J. Electrochem. Soc. 158, R55–R79(2011).
6. B. Huskinson et al., Nature 505, 195–198 (2014).7. R. M. Darling, K. G. Gallagher, J. A. Kowalski, S. Ha,
F. R. Brushett, Energy Env. Sci. 7, 3459–3477(2014).
8. G. G. I. Joseph, A. J. Gotcher, G. Sikha, G. J. Wilson, Highperformance flow battery (2011); www.google.com/patents/US20110244277.
9. J. R. Goldstein, Novel flow battery and usage thereof(2015); www.google.com/patents/US20150048777.
10. “Seventeenth Report of the Joint FAO/WHO ExpertCommittee on Food Additives. Report No. 539,” Wld HlthOrg. Techn. Rep. Ser. (World Health Organization,Geneva, 1974).
11. H. Pal, T. Mukherjee, J. P. Mittal, J. Chem. Soc., Faraday Trans.90, 711–716 (1994).
12. S. Er, C. Suh, M. P. Marshak, A. Aspuru-Guzik, Chem. Sci. 6,885–893 (2015).
13. M. Quan, D. Sanchez, M. F. Wasylkiw, D. K. Smith, J. Am. Chem.Soc. 129, 12847–12856 (2007).
14. Q. Chen, M. R. Gerhardt, L. Hartle, M. J. Aziz, J. Electrochem.Soc. 163, A5010–A5013 (2015).
15. T. S. Balaban, A. Eichhöfer, M. J. Krische, J.-M. Lehn, Helv.Chim. Acta 89, 333–351 (2006).
16. D. Linden, T. B. Reddy, Handbook of Batteries (McGraw-Hill,New York, 2002).
ACKNOWLEDGMENTS
This work was funded by the U.S. Department of EnergyAdvanced Research Projects Agency–Energy awardno. DE-AR0000348 and the Harvard John A. PaulsonSchool of Engineering and Applied Sciences. Methods, alongwith any additional extended data display items andsource data, are available in the supplementary materials;references unique to these sections appear only in the onlineversion of the paper. M.P.M., K.L., R.G.G., and M.J.A.formulated the project. K.L., S.B.K., and D.H. synthesized,analyzed, and purified the compounds. K.L., L.T., and S.B.K.collected and analyzed the NMR and mass spectroscopydata. K.L., A.W.V., and L.E. measured solubility. K.L., Q.C.,L.E., and M.R.G. collected and analyzed the electrochemical
data. K.L., Q.C., M.R.G., M.P.M., R.G.G., and M.J.A. wrote thepaper, and all authors contributed to revising the paper.
SUPPLEMENTARY MATERIALS
www.sciencemag.org/content/349/6255/1529/suppl/DC1Materials and Methods
Supplementary TextFig. S1 to S9References (17–22)
7 April 2015; accepted 24 August 201510.1126/science.aab3033
H-BONDING CATALYSIS
O–H hydrogen bonding promotesH-atom transfer from a C–H bondsfor C-alkylation of alcoholsJenna L. Jeffrey,* Jack A. Terrett,* David W. C. MacMillan†
The efficiency and selectivity of hydrogen atom transfer from organic molecules are oftendifficult to control in the presence of multiple potential hydrogen atom donors and acceptors.Here, we describe the mechanistic evaluation of a mode of catalytic activation thataccomplishes the highly selective photoredox a-alkylation/lactonization of alcohols withmethyl acrylate via a hydrogen atom transfer mechanism. Our studies indicate a particularrole of tetra-n-butylammonium phosphate in enhancing the selectivity for a C–H bonds inalcohols in the presence of allylic, benzylic, a-C=O, and a-ether C–H bonds.
Complexmolecules, such asmedicinal agentsand natural products, often possess multi-ple types of C–Hbonds, eachwith a differentinherent reactivity. This intrinsic reactiv-ity depends on a multifaceted interplay
of steric effects, inductive and conjugative influ-ences, as well as innate strain (1, 2). The inter-molecular catalytic functionalization of C(sp3)–Hbonds in a selective manner represents a long-standing challenge that has inspired decadesof effort within the synthetic community. Nota-ble early studies by Bergman (3), as well as recentadvances in selective intermolecular transitionmetal catalyzed C(sp3)–H activation—including,among others, Hartwig’s rhodium-catalyzedborylation of terminal methyl groups (4) andWhite’s iron-catalyzed oxidation of both sec-ondary (2°) and tertiary (3°) aliphatic C–Hbonds(5)—highlight the importance of catalyst struc-ture on site selectivity.Catalyst structure has also proven critical to the
selectivity of C(sp3)–H functionalization via hydro-gen atom transfer (HAT) catalysis. HAT—the ef-fective movement of a hydrogen atom betweentwo molecular sites—represents a ubiquitous ele-mentary reaction step in organic chemistry (6–8).The rate of hydrogen abstraction fromaC–Hbonddepends not only on the C–H bond dissociationenthalpy (BDE) but also on polar effects in thetransition state. In 1987, Roberts noted that cer-tain electrophilic radicals (such as t-butoxyl) pre-ferentially abstract hydrogen from electron-richC–H bonds, whereas nucleophilic radicals (such
as amine-boryl) selectively cleave electron-deficientC–H bonds (9). The generality of this concept wassubsequently delineated through the broad appli-cation of polarity reversal catalysis (PRC), whichtakes advantage of favorable polar effects to con-trol the regioselectivity ofHAT frommultiple C–Hgroups of similar strength (10).We questioned whether the basic principles of
PRC could be integrated into a catalytic system forthe selective activation of alcohol a-C–H bonds inthe presence of a wide range of other C–H bonds(such as a-C=O, a-ether, or allylic or benzylic C–H)(11, 12). Specifically, we postulated that the se-lective C-alkylation of alcohols could be achievedvia a photoredox-catalyzed,H-bond–assisted bondactivation strategy (Fig. 1) (13–15), in which thehydroxyalkyl C–H bond is selectively polarizedand weakened via O–H hydrogen bonding.It is well known that the strength of a C–H
bonds of alcohols decreases upon deprotonationof the alcohol O–H group. This so-called “oxyanionic substituent effect” (16, 17) leads to theacceleration of a wide range of organic reactions[such as oxyanionic [1,3] and [3,3] sigmatropicrearrangements and HAT from alkoxides (18)].More recently, it has been shown that intermo-lecular hydrogen bonding between alcohols andvarious acceptor molecules gives rise to a similarpolarization and weakening of the adjacent C–Hbond (19), the strength of which is reflected in the13C nuclear magnetic resonance (NMR) chemicalshift and the one-bond 13C–1H coupling constant(1JCH) (20, 21). In particular, it was found that a1 kJ/mol increase in the enthalpy of the H-bondresulted in a 0.2-Hz decrease in 1JCH for hexafluo-roisopropanol complexed to various amines (20).On the basis of these studies, we reasoned that theefficiency and selectivity of alcohol C–Hactivation
1532 25 SEPTEMBER 2015 • VOL 349 ISSUE 6255 sciencemag.org SCIENCE
Merck Center for Catalysis, Princeton University, Princeton,NJ 08544, USA.*These authors contributed equally to this work. †Correspondingauthor. E-mail: [email protected]
RESEARCH | REPORTS

DOI: 10.1126/science.aab3033, 1529 (2015);349 Science et al.Kaixiang Lin
Alkaline quinone flow battery
This copy is for your personal, non-commercial use only.
clicking here.colleagues, clients, or customers by , you can order high-quality copies for yourIf you wish to distribute this article to others
here.following the guidelines
can be obtained byPermission to republish or repurpose articles or portions of articles
): September 28, 2015 www.sciencemag.org (this information is current as of
The following resources related to this article are available online at
http://www.sciencemag.org/content/349/6255/1529.full.htmlversion of this article at:
including high-resolution figures, can be found in the onlineUpdated information and services,
http://www.sciencemag.org/content/suppl/2015/09/23/349.6255.1529.DC1.html can be found at: Supporting Online Material
http://www.sciencemag.org/content/349/6255/1529.full.html#relatedfound at:
can berelated to this article A list of selected additional articles on the Science Web sites
http://www.sciencemag.org/content/349/6255/1529.full.html#ref-list-1, 3 of which can be accessed free:cites 15 articlesThis article
http://www.sciencemag.org/content/349/6255/1529.full.html#related-urls1 articles hosted by HighWire Press; see:cited by This article has been
http://www.sciencemag.org/cgi/collection/chemistryChemistry
subject collections:This article appears in the following
registered trademark of AAAS. is aScience2015 by the American Association for the Advancement of Science; all rights reserved. The title
CopyrightAmerican Association for the Advancement of Science, 1200 New York Avenue NW, Washington, DC 20005. (print ISSN 0036-8075; online ISSN 1095-9203) is published weekly, except the last week in December, by theScience
on
Sep
tem
ber
28, 2
015
ww
w.s
cien
cem
ag.o
rgD
ownl
oade
d fr
om

1
Supplementary Materials for
Alkaline Quinone Flow Battery
Kaixiang Lin, Qing Chen, Michael R. Gerhardt, Liuchuan Tong, Sang Bok Kim, Louise Eisenach, Alvaro Valle, David Hardee, Roy G. Gordon*, Michael J. Aziz*, & Michael P.
Marshak*
*Correspondence to: [email protected] (M.J.A.); [email protected] (R.G.G.); [email protected] (MPM)
This PDF file includes: Materials and Methods Supplementary Text Figs. S1 to S9
2
Materials and Methods Materials
All chemicals were purchased from Sigma Aldrich and used as received unless stated otherwise. 2,6-dihydroxyanthraquinone (2,6-DHAQ) (90% purity) was purchased from AK Scientific Inc. and was recrystallized from DMF-water mixture. 2-methyl-3-hydroxybenzoic acid (98% purity) was purchased from AK Scientific Inc. and was used as received. Nafion 212 and Sigracet SGL 10AA porous carbon paper were purchased from Ion Power and both pretreated (see method below). The cell hardware and Poco pyrosealed graphite flow plates were purchased from Fuel Cell Technologies.
Chemical characterization and preparation
Proton nuclear magnetic resonance (1H NMR) spectra were recorded using Varian INOVA 500 (500 MHz) NMR spectrometers at 23 °C. Proton chemical shifts are expressed in parts per million (ppm, δ scale) and are referenced to residual protium in the NMR solvent (CDCl3, δ 7.26 ppm; (CD3)2CO, δ 2.05 ppm; (CD3)2SO, δ 2.50 ppm; CD3OD, δ 3.31 ppm). Carbon nuclear magnetic resonance (13C NMR) spectra were recorded using Varian INOVA 500 (125 MHz) NMR spectrometers at 23 °C. Carbon chemical shifts are expressed in parts per million (ppm, δ scale) and are referenced to the carbon resonances of the NMR solvent (CDCl3, δ 77.16 ppm; (CD3)2CO, 29.84 ppm; (CD3)2SO, 39.50 ppm; CD3OD, 49.00 ppm).
Mass spectrum was collected using a maXis impact UHR time-of-flight mass spectrometer system (Bruker Daltonics Inc, Billerica, MA) equipped with an electrospray ionization (ESI) source. The sample was dissolved in acetonitrile (5 uM) and analyzed in negative mode.
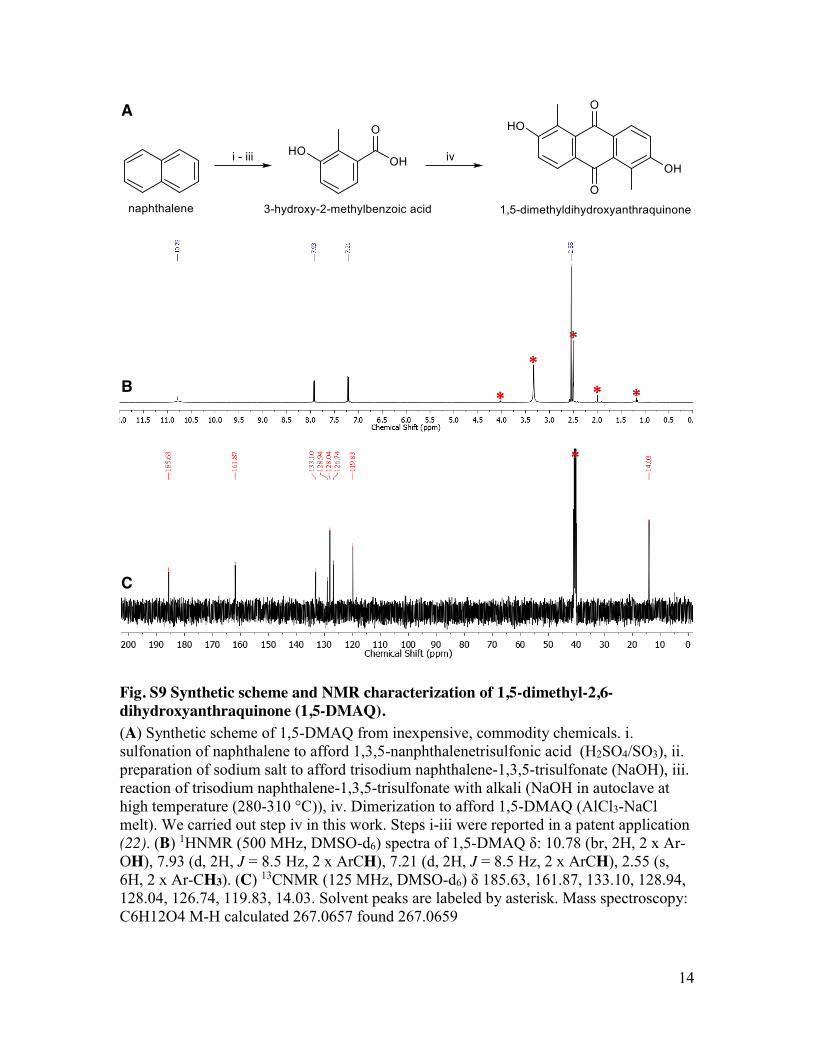
2,3,6,7-tetrahydroxyanthraquinone (2,3,6,7-THAQ) was prepared using a previously reported synthetic route (15). The overall yield was 29% (1H and 13C NMR spectra shown in Fig. S8). 1,5-dimethyl-2,6-dihydroxyanthraquinone (1,5-DMAQ) was prepared by the following method: AlCl3 (10 g) and NaCl (1 g) were mixed and heated to 200 oC to afford a molten salt. 2-methyl-3-hydroxybenzoic acid (2 g) was slowly added in four portions into the AlCl3-NaCl melt. The mixture was continuously heated at 200 oC for 1 hour. After cool down, distilled water (100 mL) was slowly added to this solution, which was then stirred at room temperature overnight. The dark yellow precipitate was collected on frit glass filter and extracted with ethyl acetate (100 mL). Distilled water (50 mL) was then added to this solution. Ethyl acetate layer was separated from aqueous layer by separatory funnel and dried on magnesium sulfate. The organic phase was concentrated (to approximately 25 mL) and cooled in an ice bath. The resulting precipitates were filtered on celite and washed with cold ethyl acetate (50 mL). This filter cake was then dissolved in acetone (50 mL) where ethyl acetate (50 mL) was added. This mixture was gently heated to remove acetone. Precipitates from this resulting solution were removed on celite. After concentrating the ethyl acetate filtrate, hexane was added to precipitate out desired product which was then collected on frit glass filter and dried under vacuum to afford pale yellow solid. The yield of this product was 12% (1H, 13C NMR spectra and mass spectroscopy results are shown in Fig. S9). Solubility measurement

3
Room temperature solubility in 1 M KOH solution was determined by measuring the absorbance at 413 nm and comparing to an absorbance-vs.-concentration calibration curve determined by preparing known concentrations of 2,6-DHAQ. UV-Vis spectrophotometry measurements were performed using an Agilent Cary 60 spectrophotometer equipped with a Quantum Northwest T2 temperature regulator. Appropriate aliquots of 2,6-DHAQ stock solution were added to 1 M KOH blank solution and their UV-Vis absorbance spectra measured. A saturated solution of 2,6-DHAQ in 1 M KOH was prepared by adding 2,6-DHAQ potassium salt into 1 M KOH solution (10 mL) until a thin layer of precipitate formed, the remaining solution was diluted by known proportions, and the absorbance of the resulting solution was compared to the calibration curve.
Electrochemical characterization
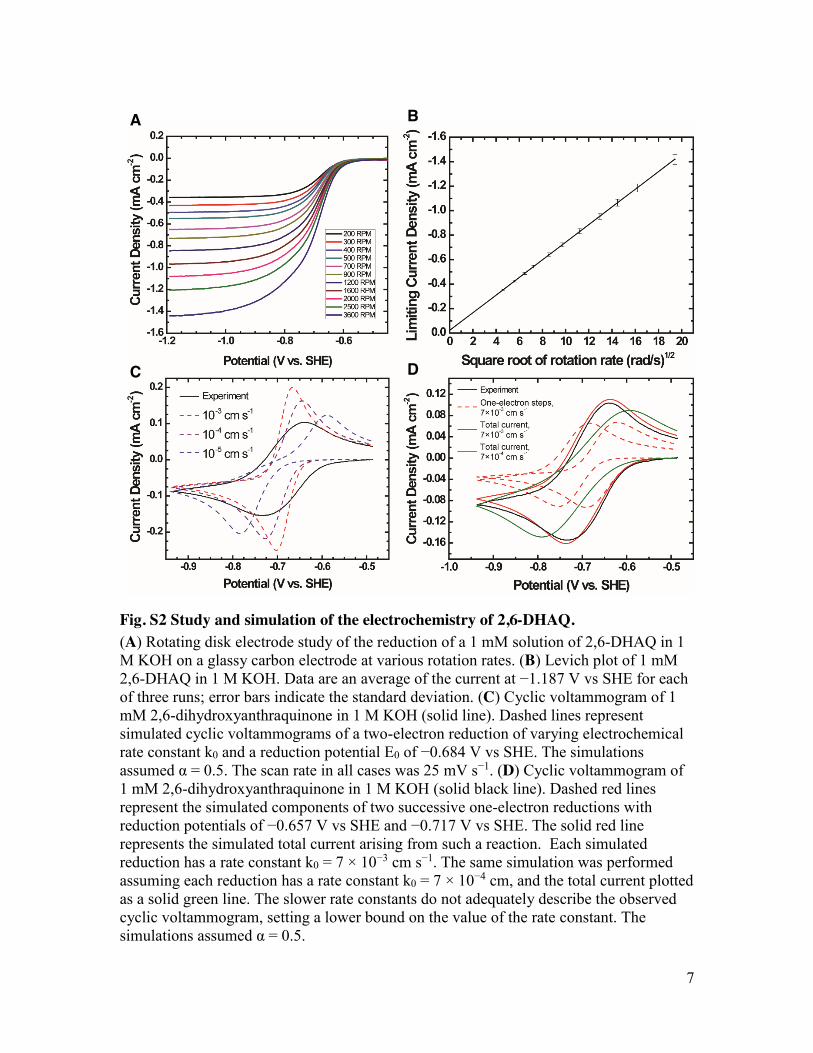
A glassy carbon electrode was used for three-electrode cyclic voltammetry tests, except in the electrochemical window tests where graphite foil was used to mimic the condition of porous carbon paper. Rotating-disk electrode (RDE) experiments of 2,6-DHAQ (1 mM) in 1 M KOH solution were performed using a BASi RDE-2 rotating-disk electrode system (Fig. S2A). All tests were carried out using a Gamry Reference 3000 potentiostat, with a Pt counter electrode and a Ag/AgCl reference electrode (equilibrated with 3M NaCl, 213 mV vs. standard hydrogen electrode). A Levich plot was constructed from the RDE data by plotting the mass-transport limited current vs. the square root of the rotation rate (Fig. S2B). The diffusion coefficient of 2,6-DHAQ was calculated for each of three runs from the slope of the line fit to the Levich equation (17). The kinematic viscosity was taken to be 1.08 × 10⁻⁶ m2 s−1 (18). The resulting value of the diffusion coefficient is 4.8(2) × 10−6 cm2 s−1. Membrane and electrode pretreatments
Pretreatment of Nafion ® 212 membrane was performed by first heating in 80 oC de-ionized water for 20 minutes and then soaking in 5% hydrogen peroxide solution for 35 minutes. These pre-treated membranes were stored in 0.1 M KOH solution at room temperature.
Sigracet ® SGL 10AA (~ 400 µm thickness) porous carbon paper was pretreated by baking in air at 400 °C for 24 hours. Full cell measurement 20 oC cycling study
The positive electrolyte was prepared by dissolving potassium ferrocyanide trihydrate (2.56 g) in 1 M KOH solution (15 mL) to afford a 0.4 M ferrocyanide and 2.6 M potassium electrolyte solution. The negative electrolyte was prepared by dissolving 2,6-DHAQ (0.48 g) in 2 M KOH solution (4 mL) resulting a 0.5 M 2,6-DHAQ and 1 M potassium electrolyte solution. 20 oC cell performance study
The positive electrolyte was prepared by dissolving potassium ferrocyanide trihydrate (2.56 g) in 1 M KOH solution (15 mL) to afford a 0.4 M ferrocyanide and 2.6 M potassium electrolyte solution. The negative electrolyte was prepared by dissolving
4
2,6-DHAQ (0.6 g) in 2 M KOH solution (5 mL) resulting a 0.5 M 2,6-DHAQ and 1 M potassium electrolyte solution. 45 oC cell performance study
The positive electrolyte was prepared by heat dissolving potassium ferrocyanide trihydrate (5.1 g) in 1 M KOH solution (15 mL) at 45 oC to afford a 0.8 M ferrocyanide and 4.2 M potassium electrolyte solution. The negative electrolyte was prepared by heat dissolving 2,6-DHAQ (1.2 g) in 3 M KOH solution (5 mL) at 45 oC resulting a 1 M 2,6-DHAQ and 3 M potassium electrolyte solution.
For all full cell studies, the electrolytes were assembled in the fully discharged state. Cell hardware from Fuel Cell Tech. (Albuquerque, NM) was used to assemble a
zero-gap flow cell configuration, similar to previous reports (19). Serpertine flow pattern pyrosealed POCO graphite flow plates were used for both sides. A 5 cm2 geometric surface area electrode comprised a stack of three sheets of Sigracet SGL 10AA porous carbon paper. A sheet of pretreated Nafion 212 membrane served as the ion-selective membrane. The rest of the space between the plates was gasketed by Teflon sheets. The electrolytes were fed into the cell through PFA tubing, at a rate of 60 mL/min controlled by Cole-Parmer Micropump gear pumps.
Before and during the tests, the electrolytes were purged with ultra-high purity argon to ensure deaeration. Galvanostatic cycling was performed at ±0.1 A/cm2, with voltage limits of 0.6 and 1.7 V, controlled by a Gamry 30K Booster potentiostat. To obtain the polarization curves, the cell was first charged to the desired SOC, and then polarized via linear sweep voltammetry at a rate of 100 mV/s. This method was found to yield polarization curves very close to point-by-point galvanostatic holds, yet to impose minimal perturbation to the SOC of the small-electrolyte-volume cell. EIS was performed at 50% SOC, open-circuit potential, and 10 mA/cm2 AC current density, with frequency ranging from 1 to 100,000 Hz.
Supplementary Text Cyclic voltammogram modeling
Computation was performed using Mathematica 10.0.1.0 according to algorithms by Oldham and Myland (20). The diffusivity of 2,6-DHAQ and both the one-electron and two-electron reduction products were assumed to be 4.8 × 10⁻⁶ cm2 s−1, based on our RDE studies. The temperature was 293 K. Time was discretized into 40 ms increments, and the current at each time was computed based on the sum of previous currents as described by Oldham (20).
To model the two-electron reduction process (Fig. S2C), the Butler-Volmer equation with the number of electrons n = 2 was used in place of Oldham equation (4:5), and the right-hand-side of equation (8:3) was multiplied by 2 to account for a two-electron reduction (17, 20). The reduction potential was assumed to be equal to the voltage equidistant from the two peaks on the measured cyclic voltammogram (−0.684 V vs SHE) and the charge transfer coefficient α was assumed to be 0.5. The electrochemical rate constant k0 was then varied from 10−3 cm s−1 to 10−5 cm s−1.
To model the two successive one-electron reductions (Fig. S2D), Oldham equations (12:13) and (12:14) were used (20). The charge transfer coefficients α1 and α2 were assumed to be equal to 0.5, and the electrochemical rate constants for the two reductions were assumed equal. The values of the single rate constant and the first and second
5
reduction potentials were permitted to vary freely. A reasonable fit to the experimental data was observed when the reduction potential of the first reduction E1 = −0.657 V vs SHE, the reduction potential of the second reduction E2 = −0.717 V vs SHE, and the two electrochemical rate constants k0,1 and k0,2 both equaled 7 × 10⁻³ cm s−1, a value very close to that observed in other anthraquinone systems (6). The simulation was repeated for k0,1 and k0,2 equal to 7 × 10⁻⁴ cm s−1 to establish a lower bound on possible k0 values.
Energy Density
The negative electrolyte of 0.5 M DHAQ, with two electrons per molecule, has a charge capacity of 27 Ah/L. The positive electrolyte of 0.4 M ferrocyanide has a charge capacity of 11 Ah/L. In the experimental cell used here, in which there is 50% more positive electrolyte than needed to balance the negative electrolyte, the energy density is 6.8 Wh/L. However, eliminating the positive electrolyte volume excess and using established methods of raising the ferrocyanide solubility to 1.4 M (21), the energy density would become 18.8 Wh/L.

6
10 11 12 13 14
-700
-680
-660
-640
-620
-600
-580
Slope = 0 mV/pH
Slope = -61 mV/pH
Pote
ntia
l (m
V vs
. SH
E)
pH
Fig. S1. Pourbaix diagram of 2,6-DHAQ. Above pH ~11.7, the equilibrium potential of 2,6-DHAQ is pH-independent, indicating that both oxidized and reduced form are fully deprotonated. The solid line is linear fit to the data between pH 10 and 12; the dashed line is not a fit, but zero slope.
7
Fig. S2 Study and simulation of the electrochemistry of 2,6-DHAQ. (A) Rotating disk electrode study of the reduction of a 1 mM solution of 2,6-DHAQ in 1 M KOH on a glassy carbon electrode at various rotation rates. (B) Levich plot of 1 mM 2,6-DHAQ in 1 M KOH. Data are an average of the current at −1.187 V vs SHE for each of three runs; error bars indicate the standard deviation. (C) Cyclic voltammogram of 1 mM 2,6-dihydroxyanthraquinone in 1 M KOH (solid line). Dashed lines represent simulated cyclic voltammograms of a two-electron reduction of varying electrochemical rate constant k0 and a reduction potential E0 of −0.684 V vs SHE. The simulations assumed α = 0.5. The scan rate in all cases was 25 mV s−1. (D) Cyclic voltammogram of 1 mM 2,6-dihydroxyanthraquinone in 1 M KOH (solid black line). Dashed red lines represent the simulated components of two successive one-electron reductions with reduction potentials of −0.657 V vs SHE and −0.717 V vs SHE. The solid red line represents the simulated total current arising from such a reaction. Each simulated reduction has a rate constant k0 = 7 × 10⁻³ cm s−1. The same simulation was performed assuming each reduction has a rate constant k0 = 7 × 10⁻⁴ cm, and the total current plotted as a solid green line. The slower rate constants do not adequately describe the observed cyclic voltammogram, setting a lower bound on the value of the rate constant. The simulations assumed α = 0.5.
A
C D
B
8
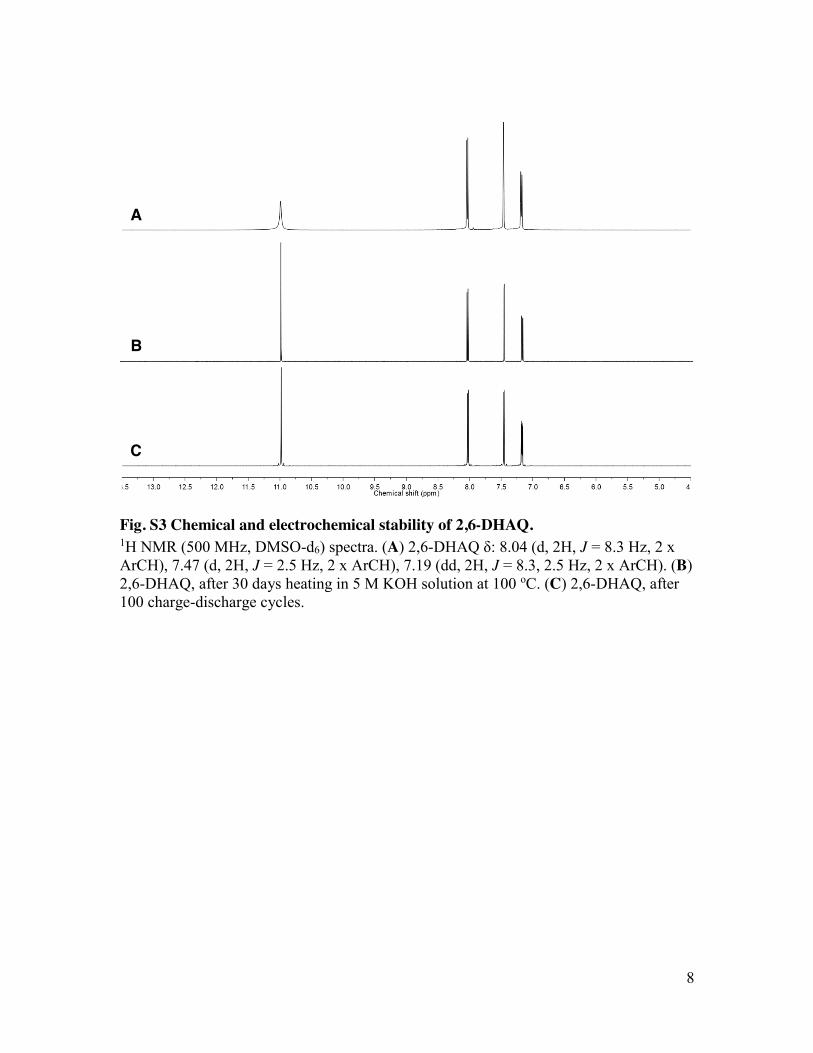
Fig. S3 Chemical and electrochemical stability of 2,6-DHAQ. 1H NMR (500 MHz, DMSO-d6) spectra. (A) 2,6-DHAQ δ: 8.04 (d, 2H, J = 8.3 Hz, 2 x ArCH), 7.47 (d, 2H, J = 2.5 Hz, 2 x ArCH), 7.19 (dd, 2H, J = 8.3, 2.5 Hz, 2 x ArCH). (B) 2,6-DHAQ, after 30 days heating in 5 M KOH solution at 100 oC. (C) 2,6-DHAQ, after 100 charge-discharge cycles.
C
A
B B
9
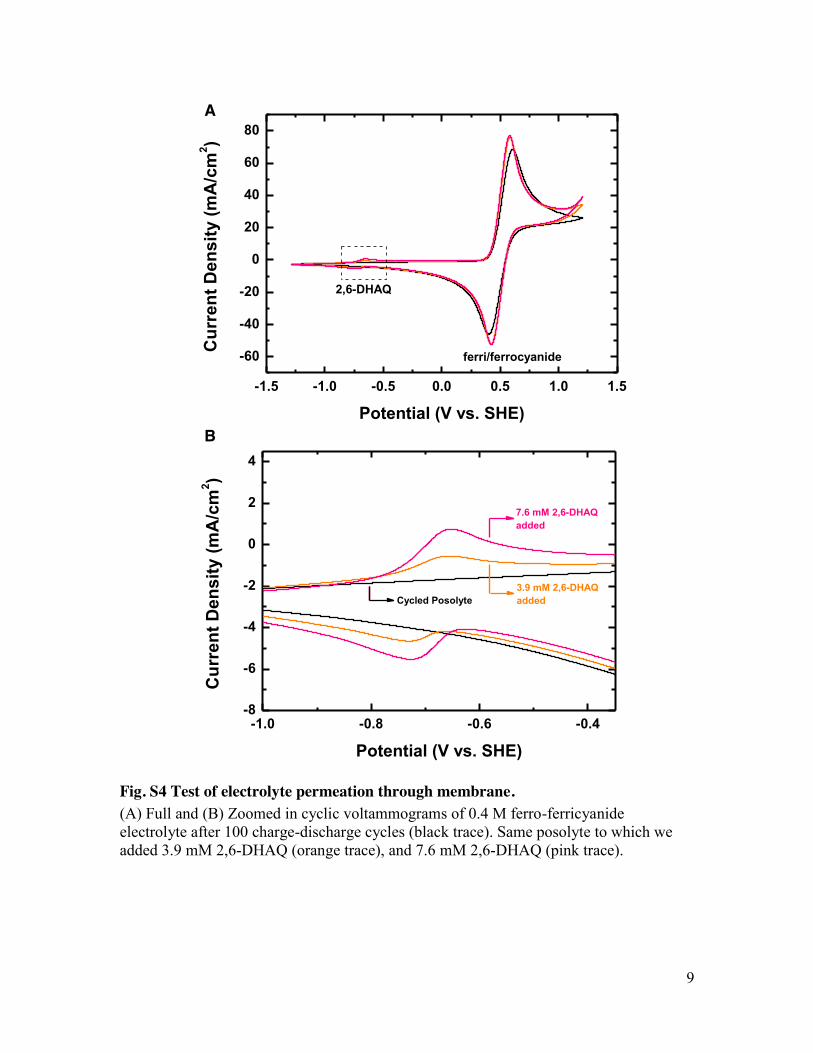
Fig. S4 Test of electrolyte permeation through membrane. (A) Full and (B) Zoomed in cyclic voltammograms of 0.4 M ferro-ferricyanide electrolyte after 100 charge-discharge cycles (black trace). Same posolyte to which we added 3.9 mM 2,6-DHAQ (orange trace), and 7.6 mM 2,6-DHAQ (pink trace).
-1.5 -1.0 -0.5 0.0 0.5 1.0 1.5
-60
-40
-20
0
20
40
60
80
Cur
rent
Den
sity
(mA
/cm
2 )
Potential (V vs. SHE)
ferri/ferrocyanide
2,6-DHAQ
-1.0 -0.8 -0.6 -0.4-8
-6
-4
-2
0
2
4
7.6 mM 2,6-DHAQ added
3.9 mM 2,6-DHAQ added
Cur
rent
Den
sity
(mA
/cm
2 )
Potential (V vs. SHE)
Cycled Posolyte
A
B B
10
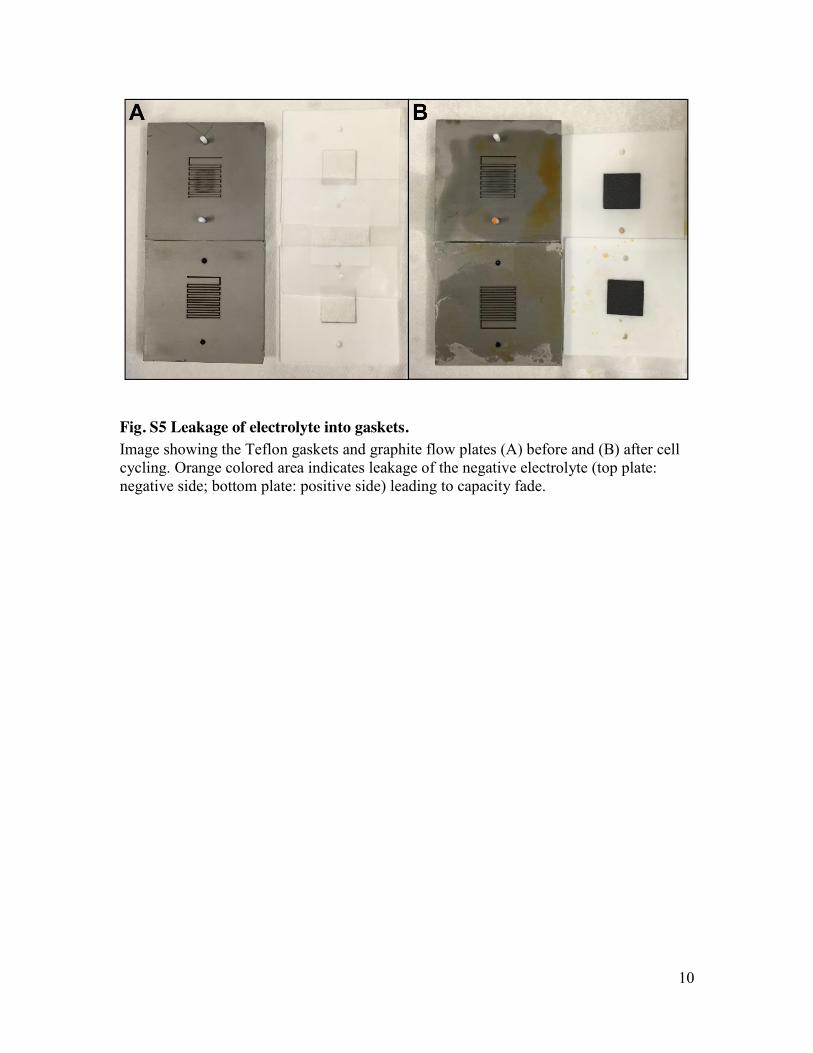
Fig. S5 Leakage of electrolyte into gaskets. Image showing the Teflon gaskets and graphite flow plates (A) before and (B) after cell cycling. Orange colored area indicates leakage of the negative electrolyte (top plate: negative side; bottom plate: positive side) leading to capacity fade.
11
0.4 0.5 0.6 0.7 0.8-0.2
-0.1
0.0
0.1
0.2
0.3
45 oC, rhf = 0.419 :�cm2
-Zim
g(: c
m2 )
Zreal(: cm2)
1 kHz
10 Hz
1 Hz1 kHz
10 Hz
1 Hz
20 oC, rhf = 0.625 :�cm2
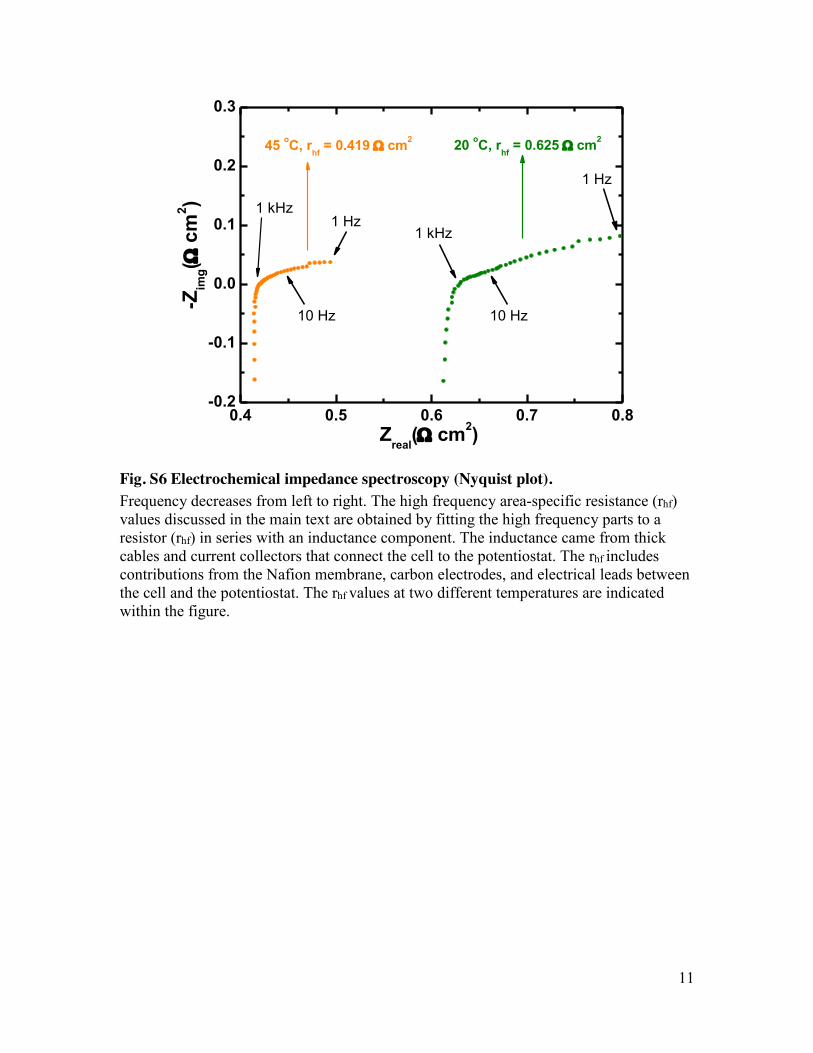
Fig. S6 Electrochemical impedance spectroscopy (Nyquist plot). Frequency decreases from left to right. The high frequency area-specific resistance (rhf) values discussed in the main text are obtained by fitting the high frequency parts to a resistor (rhf) in series with an inductance component. The inductance came from thick cables and current collectors that connect the cell to the potentiostat. The rhf includes contributions from the Nafion membrane, carbon electrodes, and electrical leads between the cell and the potentiostat. The rhf values at two different temperatures are indicated within the figure.
12
-1.5 -1.0 -0.5 0.0 0.5 1.0 1.5
-40
-30
-20
-10
0
10
20
30
40
1 M KOH
1 M H2SO4
Cur
rent
Den
sity
(PA
cm
-2)
Potential (V vs. SHE)
1 M KOH
Eo = -0.83 V Eo = 0.40 V
Eo = 0 V Eo = 1.23 V
Fig. S7 Background cyclic voltammograms. Cyclic voltammograms of 1 M KOH and 1 M H2SO4 background scanned at 100 mV/s using graphite foil electrode. Dashed lines indicate commonly-reported equilibrium potentials of water splitting reactions. This illustrates the practical stability window for aqueous flow batteries.

13
Fig. S8 Synthetic scheme and NMR characterization of 2,3,6,7-tetrahydroxyanthraquinone (2,3,6,7-THAQ). (A) Synthetic scheme of 2,3,6,7-THAQ from inexpensive, commodity chemicals. i. condensation with acetaldehyde to afford 2,3,6,7-tetramethoxydimethylanthracene (MeCHO, H2SO4), ii. oxidation to afford 2,3,6,7-tetramethoxyanthraquinone (Na2Cr2O7 in acetic acid), iii. hydrolysis of methoxy (HBr, reflux) We carried out all three steps of reaction in this work according to literature reference (15). (B) 1HNMR (500 MHz, DMSO) spectrum of 2,3,6,7-THAQ δ 10.42 (br, 4H, 4 x Ar-OH), 7.43 (s, 4H, 4 x ArCH). (C) 13CNMR (125 MHz) spectrum δ 181.50, 151.23, 127.46, 113.31, 113.28. Solvent peaks are labeled with asterisks.
C
A
B B
14
Fig. S9 Synthetic scheme and NMR characterization of 1,5-dimethyl-2,6-dihydroxyanthraquinone (1,5-DMAQ). (A) Synthetic scheme of 1,5-DMAQ from inexpensive, commodity chemicals. i. sulfonation of naphthalene to afford 1,3,5-nanphthalenetrisulfonic acid (H2SO4/SO3), ii. preparation of sodium salt to afford trisodium naphthalene-1,3,5-trisulfonate (NaOH), iii. reaction of trisodium naphthalene-1,3,5-trisulfonate with alkali (NaOH in autoclave at high temperature (280-310 °C)), iv. Dimerization to afford 1,5-DMAQ (AlCl3-NaCl melt). We carried out step iv in this work. Steps i-iii were reported in a patent application (22). (B) 1HNMR (500 MHz, DMSO-d6) spectra of 1,5-DMAQ δ: 10.78 (br, 2H, 2 x Ar-OH), 7.93 (d, 2H, J = 8.5 Hz, 2 x ArCH), 7.21 (d, 2H, J = 8.5 Hz, 2 x ArCH), 2.55 (s, 6H, 2 x Ar-CH3). (C) 13CNMR (125 MHz, DMSO-d6) δ 185.63, 161.87, 133.10, 128.94, 128.04, 126.74, 119.83, 14.03. Solvent peaks are labeled by asterisk. Mass spectroscopy: C6H12O4 M-H calculated 267.0657 found 267.0659
A A
B
C
References, Supplementary Materials
17. A. J. Bard, L. R. Faulkner, Electrochemical Methods: Fundamentals and Applications, 2nd ed. (John Wiley & Sons, New York, 2001)
18. L. B. Hitchcock, J. S. McIlhenny, Viscosity and Density of Pure Alkaline Solutions and Their Mixtures. Ind. Eng. Chem. 27, 461–466 (1935).
19. Q. H. Liu et al., High Performance Vanadium Redox Flow Batteries with Optimized Electrode Configuration and Membrane Selection. J. Electrochem. Soc. 159, A1246–A1252 (2012).
20. K. B. Oldham, J. C. Myland, Modelling cyclic voltammetry without digital simulation. Electrochimica Acta. 56, 10612–10625 (2011).
21. A. J. Esswein, J. Goeltz, D. Amadeo, High solubility iron hexacyanides (2014); www.google.com/patents/US20140051003
22. H. Behre, F. Mueller-Hauck, J. Scherer, G. Schroeder, Method for producing 3-hydroxy-2-methylbenzoic acid (2004); www.google.com/patents/WO2003080542A3