Embed Size (px)
Citation preview

Energyand Agricultureinthe Third World I.".PO. '0 the
---- - - - - --j EnergyPolicyProjecl. kh'" / of the Ford FoundationArJun Ma uoru
Incollaboration w ith
Alan Poole ........
For non-commercial use only.

For non-commercial use only.

Energy andAgriculture in theThird World
For non-commercial use only.

A Report to the Energy Policy Project of the Ford Foundation
For non-commercial use only.

Energy andAgriculture in theThird World
Arjun Makhijaniwith the collaboration of Alan Poole
Ballinger Publishing Company • Cambridge, Mass.A Subsidiary ofJ.B. Lippincott Company
For non-commercial use only.

(i) This book is printed on recycled paper.
Published in the United States of America by Ballinger Publishing Company,Cambridge, Mass.
First Printing, 1975
Copyright © 1975 by The Ford Foundation. All rights reserved. No part ofthis publication may be reproduced, stored in a retrieval system, or transmittedin any form or by means, electronic, mechanical, photocopy, recording orotherwise, without the prior written consent of the publisher.
Library of Congress Catalog Card Number: 75-4777
International Standard Book Number: 0-88410-341-2 HB0-88410-342-0 PB
Printed in the United States of America
Library of Congress Cataloging in Publication Data
Makhijani, Arjun.Energy and agriculture in the third world.
Includes bibliographical references.1. Underdeveloped areas-Agriculture. 2. Underdeveloped areas-Income.
3. Underdeveloped areas-Economic policy. I. Poole, Alan, 1946- jointauthor. II. Title.HD1417.M34 1975 338.1 '09172'4 75-4777ISBN 0-88410-341-2ISBN 0-88410-342-0 pbk.
For non-commercial use only.

Contents
List of Figures
List of Tables
Foreword-McGeorge Bundy
Preface-So David Freeman
Acknowledgments-Arjun Makhijani
Chapter OnePoverty, Agriculture, Energy
Notes to Chapter One
Chapter TwoVignettes of Third World Agriculture
IndiaThe People's Republic of ChinaPeipan, The People's Republic of ChinaTropical AfricaLatin AmericaAnalysis of Village Energy UseNotes to Chapter Two
Chapter ThreeAssessing Rural Energy Needs'
v
vii
ix
xi
xiii
xv
12
15
20283134475561
65
For non-commercial use only.

vi Contents
Domestic Energy NeedsPeak Labor and Selective MechanizationCapital RequirementsReducing Capital CostsMechanization and Employment PolicyEnergy Needs of AgricultureEconomic ModelsNotes to Chapter Three
Chapter FourFuel for Agriculture
Solar EnergyElectric Power-IntroductionCentralized and Decentralized (Diesel) Power GenerationUsing Biological Materials for an Energy SourceBiogasificationCost of a Biogas-Electricity System in MangaonReducing Capital CostsFuel for Farm MachinesNotes to Chapter Four
Chapter FiveEnergy and Development Policy
Notes to Chapter Five
Appendix AUseful Energy
Notes to Appendix A
Appendix BBiogasification
The Anaerobic Fermentation ProcessSome Aspects of the Design of Biogasification SystemsNotes to Appendix B
Bibliography
Index
6772767779828891
95
96979899
101111116124131
133
137
139
141
143
143152158
161
167
For non-commercial use only.

List of Figures
2-1 Annual Yield for Three Cereal Crops 1961-72 372-2 Energy Intensity of Farming in the Case Study Villages 602-3 Yield and Useful Energy for Three Grains: Case Study
Results 613-1 Model of a Traditional Village Economy 893-2 Model of a Developing Village Economy 904-1 Schematic Diagram of Village Biogas-Electricity Scheme
System 1034-2 Variation of Electricity Cost with Capacity Factor 1184-3 Efficiency of Four Systems for Providing Energy to a Village
or Market Town 1214-4 Borrowing and Repayment Schedule for Mangaon 128B-1 Basic Conversion Steps in the Anaerobic Methane Fermenta-
tion 144B-2 Correlation of Experimental and Theoretically Predicted
Cumulative Gas Yield (P), in Batch Digestion of ResidueSeeded Elephant Grass 146
B-3 Comparative Gas Production from Different Raw MaterialsDuring Batch Digestion 147
B-4 Relation of Time of Digestion to Temperature 148B-5 Gas Production Vs. Loading Rate 154B-6 Schematic Diagrams of the Vertical Mixing and Linear
Displacement Digestors (Heating System Not Shown) 156
vii
For non-commercial use only.

For non-commercial use only.

List of Tables
1-1 Income Distribution in Brazil by Sectors of the Population 31-2 Employment and Labor Productivity in Rice Production 82-1 Energy Use per Hectare in Rice Production in Various
Countries 172-2 Comparison of Energy Use in the Prototypical Villages 212-3 Livestock in Mangaon 2624 Energy Use in Mangoan, India (Energy in Billion (10 9 ) Btu
per Year Except Row 13) 272-5 Annual Crop Production in Mangaon 272-6 Livestock in Peipan 322-7 Summary of Farm Equipment in Peipan 332-8 Energy Use in Peipan (Energy in 109 Btu per Year Except
Row 13) 342-9 Crop Production in Peipan 352-10 Livestock Population of Kilombero 412-11 Tools in the Village of Kilombero 432-12 Energy Use in Kilombero (Energy Use in Billion (10 9 ) Btu
Except Row 13) 432-13 Annual Food Production in Kilombero 432-14 Livestock in Batagawara, Nigeria 462-15 Energy Use in Batagawara, Nigeria (Energy Use in 109 Btu
per Year Except Row 13) 462-16 Agricultural Production in Batagawara 472-17 Livestock Population in Arango 502-18 Energy Use in Arango, Mexico (Energy Use in 109 Btu per
Year Except Row 13) 522-19 Output of Major Crops in Arango 522-20 Livestock on a Parcela 53
ix
For non-commercial use only.

x List of Tables
2-212-222-232-242-254-1
4-24-3
4-44-54-64-74-84-9
4-10
4-11
4-12
4-13
4-14
4-154-16
B-1
Energy Use on a Parcela in Quebrada, BoliviaAgricultural Production on a One Hectare ParcelaComparative Analysis of Energy Use in Rice ProductionComparative Analysis of Energy Use in Wheat ProductionComparative Analysis of Energy Use in Maize ProductionCost of Centralized Electricity Supply (Coal-Fired Generating Plants in India)Cost of Electricity from Small-Scale Diesel GeneratorApproximate Economics of Installing Latrines in Mangaonfor the Recovery of FertilizersEstimated Residue Coefficients for Major CropsManure Production DataEnergy Supply from Agricultural and Animal WastesAnnual Organic Nitrogen Supply in the Case Study VillagesFertilizer Prices Paid by U.S. FarmersCapital Costs of Biogasification-Electrification System inMangaon (in 1974 Dollars)Capital Cost of Biogas-Electric System with Water Hyacinthfor Cooking FuelAnnual Costs for Three Biogas-Electricity Schemes forMangaon, IndiaVariation of Biogas and Electricity Cost with FertilizerContent of Residuum in Three Biogas-Electricity SchemesComparison of the Costs of Useful Energy for AgriculturalUse from Electricity and Biogas (Dollars per Million Btu ofUseful Energy)Comparison of Capital Costs for Centralized and Decentralized Schemes, Mangaon, India (Dollars)Food Needs of MangaonInvestment and Output in a Multiple Cropping Scheme forMangaonEffect of Chemical Treatment with NaOH on Digestibilityand Chemical Composition of Ryegrass Straw
5455575859
9899
100107108109110112
113
115
116
117
120
123125
129
151
For non-commercial use only.

Foreword
In December 1971 the Trustees of the Ford Foundation authorizedthe organization of the Energy Policy Project. In subsequent decisions the Trustees have approved supporting appropriations to a total of $4 million, which isbeing spent over a three-year period for a series of studies and reports by responsible authorities in a wide range of fields. The Project Director is S. David Freeman, and the Project has had the continuing advice of a distinguished AdvisoryBoard chaired by Gilbert White.
This analysis of "Energy and Agriculture in the Third World" is oneof the results of the Project. As Mr. Freeman explains in his Preface, neither theFoundation nor the Project presumes to judge the specific conclusions andrecommendations of the author who prepared this volume. We do commendthis report to the public as a serious and responsible analysis which has beensubjected to reviewby a number of qualified readers.
This study is rather different from others in the Project, in that itdeals primarily with the problems and prospects of the developing countries. Itsmessage is directed toward development planners and public administrators inthe developing countries, and to virtually all donor agencies-including thisFoundation-whose development assistance programs have yet to give adequateattention to the relationships between effective agricultural development andenergy use. The new realities of the world energy situation make these relationships distressingly critical for the present and future, and all of us in thisbusiness must give immediate attention to their implications for developmentprograms.
Because of the importance of this subject, and the uniqueness ofthe perspective of the author, I fully support the Project Director's decision topublish this study and give it full exposure as soon as possible. However, as manyof our independent reviewershave reminded us, the relationship between energyand agriculture in developing countries is a large and complex subject, where
xi
For non-commercial use only.

xii Foreword
data are scarce, technologies are in a state of rapid development, and social,political, and economic difficulties have a way of appearing where least expected. Neither the Foundation nor the author would claim that this study ismore than a preliminary investigation of the subject, which will raise as manyquestions as it answers. If it is successful in stimulating active thought and goodresearch on the questions it raises, it will have served the basic objective of theEnergy Policy Project. In this spirit, I commend this analysis to the attentionof those concerned with energy policy as it affects the less-developed countries.
McGeorge BundyPresident, Ford Foundation
For non-commercial use only.

Preface
The Energy Policy Project was initiated by the Ford Foundationin 1971 to explore alternative national energy policies. This book, Energy AndAgriculture In The Third World, is one of the series of studies commissionedby the Project. It represents a pioneering analysis of the vital linkage betweenfood and energy and is presented here as a carefully prepared contribution bythe authors to today's public discussion of hunger in the underdeveloped countries.
It is our hope that each of the Project's special reports will stimulate further thinking and questioning in the specific areas it addresses. At thevery most, however, each special report deals with only a piece of the energypuzzle; the Energy Policy Project's final report, A Time To Choose: America'sEnergy Future, which was published in October 1974, attempts to integratethese parts into a comprehensible whole, setting forth the energy policy optionsavailable to the United States as we see them.
This book, like the others in the series, has been reviewed by scholars and experts in the field not otherwise associated with the Project in orderto be sure that differing points of view were considered. With each book in ourseries, we offer the opportunity of having their comments published, but nonehave chosen to do so with this volume.
Energy And Agriculture In The Third World is the author's report tothe Ford Foundation's Energy Policy Project. Although neither the Foundation,its Energy Policy Project nor the Project's Advisory Board have assumed the roleof passing judgement on the report's contents or conclusions, I certainly docommend it to all those who are seriously concerned with economic development in the poor nations of the world.
S. David FreemanDirectorEnergy Policy Project
xiii
For non-commercial use only.

For non-commercial use only.

Acknowledgments
The consent and encouragement of Dave Freeman and the fundingof the Ford Foundation enabled me to have the special privilege, as a staffmember of the Energy Policy Project, to write this book. I thank them for it.
Alan Poole wrote the Appendix on biogasification and contributedextensively to the sections of biological energy sources in Chapter 4. His suggestions on many other matters were decisive; his enthusiasm for this book, insuppressible.
Francisco Otero did much of the background research for the prototypical villages of Chapter 2, particularly the Chinese, Tanzanian, Nigerian andBolivian examples. I learned much about development economics from my discussions with Raj Krishna.
Dave Sheridan taught me a great deal about writing and helped toorganize this book. Kitty Gillman edited it with skill, care and love. TaylorVance, Shirley Cox and Billie Truesdell typed most of it and helped with theproof reading. Many other friends, among them Bob Williams, John Davidson,and Irene Gordon, made useful suggestions and kept me going with their encouragement and enthusiasm. And the reviewers of the first draft of this bookmade suggestionsthat proved very helpful when I revised it.
If this book has any inspiration, it was Annie Lepetit's rendition ofMozart's Phantansie in D minor (K-397) that provided it, for I often wrote asshe played it.
Arjun MakhijaniWashington, D.C.January, 1975
xv
For non-commercial use only.

For non-commercial use only.

Energy andAgriculture in theThird World
For non-commercial use only.

For non-commercial use only.

Chapter One
Poverty, Agriculture, Energy
Wood is the poor man's oil. Throughout the underdeveloped world, men,women, and children spend a considerable portion of their time cutting trees,gathering twigs and branches, and tending fires to have the energy they need forcooking and a modicum of heat and light. Together with wood, animal dung andcrop residues, human and animal labor provide the barest of energy necessitiesfor 50 to 60 percent of the world's people who live in the villages and smalltowns of Asia, Africa, and Latin America.
The amount of energy so used is large-probably comparable to theflow of crude oil in the international market (about 30 million barrels a day).The commonly held notion that energy use in the underdeveloped countries isfar below that in the industrialized nations 1,2,3 is based only on the use of"commercial" fuels, such as oil, coal and hydropower. The energy characteristicthat is typical of poverty is not so much low per capita energy use-though thatis part of it-but the relatively small amount of useful work that is obtained fromit.
The full possibilities of the traditional fuels that poor rural peopleuse are commonly slighted or forgotten. This study does not propose exclusiveor even primary reliance on noncommercial energy sources for Third Worlddevelopment, but it does give them special attention because they have so oftenbeen neglected. When commercial fertilizer is scarce and fuel prices fearfullyhigh, as they were in early 1975 when this book was written, the production ofenergy from small-scale, decentralized, noncommercial sources takes on extraimportance.
This book seeks to explore how energy, in whatever form, may besthelp to transform agriculture, raise enough food, and provide other necessitiesfor the people of the Third World, and to assess how much energy is needed todo this. But we must emphasize at the outset that energy alone is not enough. Itis also imperative to move on many other fronts at the same time. Enough food
For non-commercial use only.

2 Energy and Agriculture in the Third World
must be available to begin with to keep farmworkers alive and able to work.Other essential parts of the mosaic are medical care; land reform; technicalassistance; loans for small farmers; birth control information and services; and asocial system which assures that all the people, not just a yrivileged few, share inthe fruits of development.
There is no question that more useful work, obtained both frommore energy and more efficient use of energy, is essential to the developmentthat must take place. In many poor countries arable land is limited. Energy helpsto increase the yield that each unit of land can put forth-by working pumps forirrigation, by plowing fields, by harvesting crops, by producing fertilizer. Inproviding the energy, the pumps, the fertilizers, the cement needed to producemore food, poor countries burdened by shortages of capital and high food, oiland fertilizer prices, must make the fullest possible use of their resources.
Energy use in both agriculture and industry enables human labor tobe more productive. Thus in the United States, about 10 percent of the workforce, or less than 10 million workers in agriculture (including those engaged inthe supply of fertilizers, tractors, and so on to farmers), supply enough food forthe 210 million people in the U.S., with enough left over for substantial exportsto other countries." In many poor countries, 70 to 80 percent of the labor forceare engaged in agriculture.
Increasing the productivity of land and labor-for which energy isessential-is, and has been, the foundation of economic growth.* How the wealthwhich flows from rising productivity of land and labor is parcelled out, bothwithin nations and globally among nations, is of utmost importance. The longexploitation of poor countries' natural resources by industrialized nations (onlyrecently reversed in the case of oil), the centuries-long exploitation of slaves inEurope and America, the great wealth of a few and the poverty of many inunderdeveloped countries today-all illustrate that wealth among nations andwithin nations can increase, yet poverty and misery remain.
Economic growth, or the increase of a nation's wealth, does notautomatically result in economic development. Such growth is an essential, butnot a sufficient, condition for the people of a nation to achieve well being. The"Brazilian economic miracle" is a good example. Brazil's Gross National Product(GNP) grew at an annual compounded growth rate of 6 percent between 1960and 1970. Despite this growth there were more poor people in Brazil in 1970than there were in 1960.
Table 1-1 shows that fully 80 percent of the Brazilian people were
*Of course, there are other sources of national wealth, a most important onebeing the ownership of valuable natural resources. As the sudden wealth of oil-exportingcountries shows, the sale of these resources can provide both ample income and capital foreconomic growth. Yet this wealth, which the high price of oil has transferred fromoil-consuming to oil-producing countries, fundamentally rests upon the ability of industrialized nations to use the oil to achieve high productivity ofland and labor.
For non-commercial use only.

Poverty, Agriculture, Energy 3
Table 1-1. Income Distribution in Brazil by Sectors ofthe Population
Income Groups
Percentage of the NationalIncome
1960 1970
Average Incomeper Capita(U.S. $)
1960 1970
Bottom 40%Next 40%Next 15%Top5%Average
Source: Note 5.
11.234.227.027.4
9.027.827.036.3
84257540
1,635300
90278720
2,940400
hardly better off in 1970 than they were in 1960. The ranks of the poor(bottom 80 percent) increased from about 50 million in 1960 to about 65million in 1970. Yet there are no indications of change in the economic policiesthat have brought wealth only to the rich, both in Brazil and in theindustrialized nations (particularly the U.S. through the repatriation of theprofits of the multinational corporations").
This experience is not peculiar to Brazil. It is rather the rule inunderdeveloped countries that the richest 5 to 15 percent are generally the onesto benefit the most from economic growth. They acquire automobiles, six-lanebridges, airplanes, and high-rise buildings on which precious cement and steel arewasted: stark monuments to the food, fertlizer and irrigation pumps that neverwere. Meanwhile the poor die from hunger and exposure.
Yet, the ones who die quickly may be the more fortunate, for theones who survive live in misery. The most devastating by-product of poverty isthe chronic malnutrition that afflicts hundreds of millions of people in the ThirdWorld. Children suffer brain damage from the lack of sufficient protein. Nightblindness and total blindness afflict millions of others. These are the realitiesembedded in abstractions such as average income or GNP.
Redistribution of income is a fundamental reform to alleviatepoverty. The redirection of capital spending to improve food production, landreform, health care, housing and provision of productive jobs for the poor areessential aspects of an income redistribution policy. In the People's Republic ofChina* such reforms have been a principal instrument in promoting the healthand welfare of its people. The per capita availability of food in 1970 was aboutthe same as it was in 1950,' and only slightly larger than the per capita foodavailability in India in 1970.8 Yet, there is ample evidence to suggest that the
*Throughout this book the People's Republic of China is referred to as China.The Republic of China is referred to as Taiwan.
For non-commercial use only.

4 Energy and Agriculture in the Third World
hunger and chronic malnutrition that afflict more than a 100 million people inIndia have been largely overcome in China. The equitable distribution of foodand the widespread availability of medical care in China are among the principalreasons for the difference."
Equitable distribution of the available food takes on even moreurgent importance in this time of food and fertilizer shortages and cruelly highprices of food, fertilizers, and oil. These high prices not only make the severebalance of payments problems intolerable for the poorest among the oil- andfood-importing countries," but in these countries, as indeed in many others, thepoor-particularly the urban poor and the landless rural poor-will bear thebrunt of the food shortages. Poor weather in the Midwestern United States in1974 resulted in a substantially lower crop production than anticipated; manyfear that the food crisis will worsen. With these omens of world food shortages,increasing food production must be the primary goal of the underdezelopednations if the future is to hold any hope for the poor. Agriculture and theactivities that support agriculture must take precedence over all others fordevelopment in the poor countries of the Third World; they must have first callon available resources, energy included.
In this effort industrialization is essential. Industrialization is notand cannot be allowed to become the province of the wealthy nations, or of thewealthy people in the underdeveloped countries. Some essential industries, suchas steel production or electric power generation, will remain capital-intensive inspite of every effort to reduce capital costs. Here it is of paramount importancethat capacity be used as fully as possible and that the output of these industriesbe used to create jobs and contribute to the rapid expansion of the productionof essentials. The primary aim of industrialization should be the same as that ofaggressive promotion of agriculture-that of increasing the production ofessential commodities, particularly food, as rapidly as possible, while ensuringthat with the capital available, the creation of productive jobs stays well aheadof the growth of the labor force.
The technologies adopted for many industries are all too oftenimported wholesale from the industrialized nations without adequateconsideration of alternatives that might be more suited to the capital-shorteconomies of poor countries. to The kinds of technology that are used and themix of industries that is established must suit each country's own natural capitaland labor resources. In poor countries, the mix of industries must be determinedby the most pressing needs of their people-that is, the production of food, cleandomestic water supply, clothing, and housing.
One of the most tragic results of the failure of past developmentefforts to provide enough productive jobs has been the enormous waste ofhuman resources. In stagnating village economies ... In the streets and slums ofthe cities to which some 20 million people find their way each year in the futilehope of an escape from the poverty of the villages.'! If the grim prospects
For non-commercial use only.

Poverty, Agriculture, Energy 5
implied by high-population and labor-force growth rates are to be averted, it isimperative that development strategy be redericted to achieve both economicgrowth and employment objectives.P In most underdeveloped countries, thejobs must be created in agriculture. Gunnar Myrdal, in his study of poverty inSouth Asia, said, "The hope, so commonly expressed, that a large proportion ofthose who will join the labor force in the decades to come will becomeproductively employed outside agriculture is illusory.t'P
In India, for example, the labor force will grow from the present 225million to about 400 million in the next 25 years. Even if industrial employmentgrows at 5 percent per year (which means an optimistic 7 to 8 percent growthrate for industry!"), only 25 to 30 million workers will be employed in industryby the turn of the century. Thus, in the next 25 years, about 100 million jobsmust be created in the rural areas, which today are 80 percent dependent onagriculture. This must be done even while existing and new jobs are made muchmore productive so that the poor can move rapidly beyond a hand-to-mouthexistence. This is an enormous task, especially since most of the cultivable landis already being used. The solution clearly points toward labor-intensivetechnologies l
5,16,17 and an intensified use of agricultural land."Labor-intensive technologies are· also essential because even the best
efforts at birth control cannot now avert the large increase in the labor force inthe next 15 to 20 years. These potential workers have already been born, andmany more will be added in this decade.
Labor-intensive technologies, as we shall use the term in this book,are those which, in sum, result in the most productive use of the entire pool ofavailable labor, with the capital that is available to a country. This has severalmajor implications for investment in agriculture. First, it means the investmentmust be directed preferentially toward those areas, such as irrigation, thatincrease both labor productivity and employment. 19 Second, wheremechanization in agriculture is essential to increase the productivity of land andlabor but where it creates a net loss of jobs, then investment in other sectors ofthe economy, including public works, should take up the slack and productivelyabsorb the displaced labor.2o,21 In some cases it may even be necessary to slowdown the rate of mechanization of some farm activities such as threshing whichcause a net loss of jobs, so that the poor may eat. 22 Third, the mix oftechnologies chosen for accomplishing a given increase in production shouldemphasize those which require a smaller amount of capital to create a givennumber of jobs. An example may serve to illustrate the principle.
Capital-intensive schemes of fertilizer production and electricityproduction for irrigation provide one job for every $20,000* of capital
*We have used the U.S. dollar as the unit of currency throughout this book.and the prevailing official exchange rates to convert various currencies to U.S. dollars. Thisuse of dollars as a common currency measure, of course, does not imply foreign exchangecosts or benefits.
For non-commercial use only.

6 Energyand Agriculture in the Third World
investment (excluding the indirect employment effects due to increasedagricultural output). Producing electricity and fertilizers in a village scale plantthat uses animal dung and crop residues* can provide one job for every $3,000 ofcapital investment. The decentralized scheme provides more jobs because of thelabor involved in collecting the dung and crop residues and operating the plant.For the most part, unskilled labor is required. In many places, this developmentscheme makes the labor that is already used in the husbanding of organic wastesmore productive because the capital investment permits the use of the wastes forproductive activities such as soil fertilization and irrigation (Chapter Four,Appendix B). Of course, this does not mean that chemical fertilizer factoriesshould not be built. They should, for chemical fertilizers are essential to theprogress of agriculture in the Third World (see discussion in Chapter Three). Itdoes mean that the physical, monetary, and human resources available in eachcountry should determine what mix of technologies is best suited to achievegiven targets of food, fuel, or fertilizer production.
The abundance of human beings and domestic animals in theunderdeveloped countries naturally raises the question: Why use fuels at all tosupply mechanical energy? There are several important and fundamental reasons.
In agriculture, the foremost reason is to provide water for irrigation.The cheapest and quickest way to provide irrigation in many, if not most, areasof the world is to tap subterranean water sources (lift irrigation). Mechanicalenergy is practically a must for such irrigation. While human and animal laborcan provide some water, as is common practice today, it cannot provide enough,even in the most densely populated agricultural regions such as the IndianGangetic plain.
The high peak demand for labor which typifies nonmechanizedagriculture23,24 ,2S,26 has two important deleterious effects. First, it is directlyresponsible for the dearth of jobs in rural areas for much of the year. Second, itprobably encourages a high birth rate among farming families.
Mechanical power is essential both for the selective mechanization ofthose agricultural operations (such as threshing, rice transplantation, orharvesting) which make the heaviest peak labor demands,** and for irrigation.The use of human labor for irrigation is relatively unproductive. A penny'sworth of electricity (at S¢/kwhe) can provide as much water as a man at a handpump all day.t Irrigation creates a very large demand for labor in the fields due
*Dung and crop residues can be converted to methane (a gaseous fuel akin tonatural gas) by the action of anaerobic bacteria. The residue is high in nitrogen, phosphorous, and potassium, and can be used as a fertilizer. See Chapter Four and Appendix B.
**We cannot dismiss human and animal labor. As we shall see in ChapterThree, employment and income distribution effects are of paramount importance in theconsiderations of mechanization.
tExcept for energy units, all units used in this book are metric. Energy ismeasured in Btu, which is the amount of energy needed to heat 1 pound (453.6 grams) ofwater by 1°F, and electricity in kilowatt hours electrical (kwhe). One kwhe = 3,413 Btu(excluding generation, transmission, and distribution losses). One barrel of oil = 42 U.S.gallons =5.8 million Btu. One ton of coal =1,000 kg of coal = 28 million Btu.
For non-commercial use only.

Poverty, Agriculture, Energy 7
to increased crop production and multiple cropping.27, 2 8 Multiple cropping(growing more than one crop each year) exploits the abundance of year-roundsolar energy that is available in most underdeveloped countries, but irrigation isgenerally required for it, particularly in monsoon areas where the rainfall isconcentrated in a few months of the year.
Mechanized irrigation can thus increase both employment andproduction substantially. But mechanized irrigation requires mechanical power,and it is here that the role of energy in agriculture, particularly in the forms ofelectricity, oil or gas, is most crucial in raising the productivity of farms andlabor, while providing the job opportunities essential to any equitabledistribution of the fruits of economic growth.
The data in Table 1-2 show that labor productivity and employmentcan be complementary when irrigation and fertilizers are available. Significantly,Japan, by far the most industrialized nation among those listed, has both thehighest input of labor and the highest farm productivity, despite the widespreaduse of small tractors there. In subsequent chapters, we shall investigate in moredetail the use of energy for irrigation and in other areas where it is important toagricultural development and, hence, to economic growth.
Just as labor is abundant in underdeveloped countries, so is capitalscarce. This shortage of capital is at the root of many of the frustrations ofdevelopment efforts. Obviously it is difficult to increase savings inunderdeveloped countries where the economy is barely at subsistence level; mostpeople find it hard to save for a better tomorrow when it requires all their effortto stay alive today.
A technology which can get more useful work out of energy with amodest capital outlay is clearly the best of bargains for poor countries. As weshall show in Chapter Four, decentralized village plants can, in the rightcircumstances, equal the fuel and fertilizer output of centralized systems at halfthe capital cost.
Another test for the effective employment of capital is thecapital-output ratio. The rate of growth of all economies, and particularly thoseof the underdeveloped countries which are short of capital, depends critically onthe annual production that can be obtained from the investment of the availablecapital. If the capital needed to increase annual production by a given amount isreduced (that is, if the incremental capital-output ratio* is lowered), the effect isthe same as if more investment capital were made available. We shall show thatagricultural development projects based on tubewell irrigation and on the use ofcrop residues and animal wastes to provide fertilizer for the fields and fuel forraising underground water can yield an annual output roughly twice the value ofthe capital required for the project-that is, a capital-output ratio of aboutone-half. (See Chapter Four for a full discussion). This is considerably less than
*In this book the term "capital-output ratio" refers to the incrementalcapital-output ratio-that is, the number of units of capital required to be added to presentcapital stock to increase annual production by one unit.
For non-commercial use only.

Sources: Notes 11, 15, 16.aIn Japan and Taiwan multiple cropping (three or four crops per year) is common, so that the annual productivity of the worker is several timeshis productivity per crop. Multiple cropping is less common in China and India.bThe percentage of irrigated area under rice cultivation is generally higher than national averages for aU crops, because rice-producing areas areirrigated in preference to other crops.cIncludes the nitrogen content of organic fertilizers, which supply about 60 percent of the nitrogen.dNitrogen application is averaged over the entire area planted with rice. In practice, chemical nitrogen is applied to only part of the area. Theaverage, therefore, indicates the extent of use rather than the typical practice in application of nitrogen per hectare.Note: Throughout this book, the rice yield (kilograms of rice per hectare) is understood to mean the yield of unmilled rice (rice paddy)unless otherwise specified.
Table 1-2. Employment and Labor Productivity in Rice Production
OJ
~CI)ca-e~Q..
)::.
~Nitrogen Fertilizer ~.Application d ~Kilograms/Hectare ~
(1970) S.Country
JapanChinaTaiwanIndia
Number of Workersper 100 Hectares(1965)
215180-200
19590
Labor ProductivityKilograms ofRiceper Workerper Crop"
2,6001,5002,0501,550
Land ProductivityKilograms ofRiceper Hectare(1969)
5,6003,0004,0001,400
Percentage ofRice-producingLand Irrigatedb
10070
10040
-150- SOc-100- 10 to 20
sCI)
~a~:t.Q..
For non-commercial use only.

Poverty, Agriculture, Energy 9
the capital-output ratio of 2.6 for agriculture in India's fifth five-year plan.29 Itis also much lower than India's average capital output ratio of 3.9 during the1960-69 period.i" Such a capital-output ratio can mean rapid economic growth,with agriculture providing the cutting edge of economic growth. This is anotherimportant reason for underdeveloped countries to focus their developmentefforts on agriculture.
Even with every effort to minimize the capital needed for economicdevelopment, procuring capital for investment from savings is a serious problemin most underdeveloped countries. India's entire development budget for almost600 million people is considerably smaller than the expenditures of U.S.consumers on electric household appliances; it is about equal to sums spent ondogs, cats and other pets in U.S. homes. Public investments in the underdeveloped countries are often in the range of $10 to $20 per capita per year.
So long as development efforts continue to bypass the poor, the taxbase will remain small and capital will remain scarce. But, there is no questionthat rural areas where the general level of living is rising can contributesignificantly to capital formation in underdeveloped countries. In Japan,agriculture's contribution to the tax revenue in the late nineteenth century wasaround 85 percent," this was the same period when Japan began to acquire thestatus of a major industrial power.
The capital contributions of farmers to agricultural development aresubstantial in several Asian countries. "In the late nineteen sixties deposits in thelocal [farm] cooperatives of Japan averaged 84 percent of the working capital[of the cooperatives] ; in Taiwan 76 percent, in Korea 50 percent. In other Asiancountries deposits amounted to only 1/10 or less of working capital.,,32
We cannot, however, expect the savings of farmers to increase muchuntil their incomes begin to rise. Since commercial banks are usually unwilling toprovide what they feel to be insecure loans to small farmers, the role ofgovernment in providing the capital necessary to initiate rural development iscrucial. Without it the vicious circle wherein poverty limits savings and limitedsavings perpetuate poverty cannot be broken.
Development programs that focus their efforts on where the peopleare-the villages and small towns-are essential if the majority of the people inthe Third World are to share both the labor and the fruits of economic growth.Such participation in economic development is also essential to the provision ofadult education, health care, and birth control. Recent research in populationgrowth rates and the practice of birth control in different nations shows that thisfeeling of participation and hope, and an equitable distribution of the fruits ofeconomic growth, are strong forces in motivating smaller families. We quote atlength from William Rich's recent report on birth control:
There is, however, striking new evidence that in an increasingnumber of poor countries (as well as in some regions within
For non-commercial use only.

10 Energy and Agriculture in the Third World
countries), birth rates have dropped sharply despite relatively lowper capita income and despite the absence or relative newness offamily planning programs. The examination of these cases in thismonograph reveals a common factor. The countries in which this hashappened are those in which the broadest spectrum of thepopulation has shared in the economic and social benefits ofsignificant national progress to a far greater degree than in most poorcountries-or in most Western countries during their comparableperiods of development. Family planning programs generally havebeen much more successful in those countries where increases inoutput of goods and social services have been distributed in such away that they improved the way of life for a substantial majority ofthe population rather than just for a small minority.
The record also shows that those countries which continue tosustain high rates of population growth despite their achievement ofrelatively high per capita income figures have wide disparities inincome and limited access to social services. Only a small groupwithin these countries has started to practice fertility control; thisgroup generally consists of the favored minority that has benefitedmost from the modern social and economic systems. The remainderof the society-those living at, or close to, the subsistence levelaccounts for the high average birth rate. 33
The People's Republic of China, which has emphasized agriculturalproduction and equitable distribution of wealth, and in addition has created aunique decentralized health care system involving paramedical personnel as wellas physicians, has experienced dramatic declines in the birth rate in recentyears.34
We have argued that agriculture should be the focus of developmentefforts in most underdeveloped countries. As with any development planning, itis vital that the efforts be coordinated. Isolated efforts, such as electrification orbirth control teams visiting villages, are insufficient for rapid progress because, inthe struggle for survival, rural people have made many and complex adjustmentsto their harsh economic environment. Changes in anyone factor are thereforenot likely to be accepted or, if they are, will be inadequate for the cause ofsustained economic progress. Experience with electricity use in Indian villagesillustrates this point. An Indian government study found that growth ofelectricity use often stops, and that its use declines, 10 years after theintroduction of electricity; at this point only about 20 percent of the populationuse electricity in agriculture, business, or industry.3S This is clearly a symptomof economic stagnation, of equipment falling into disrepair and disuse, andprobably of a lack of savingsto replace worn-out equipment.
There are many reasons why simplistic solutions at rural development will not bring about the desired results. Among them are:
For non-commercial use only.

Poverty, Agriculture, Energy 11
1. The problem of adequate nutrition so that people can workmore vigorously is of great importance if we are to look to poor unemployed orunderemployed labor as a significant contributor to economic growth." Thenutritionally unbalanced one meal a day to which so many poor people areconstrained is wholly inadequate to sustain a vigorous work day.
2. Land reform, or at least consolidation of each family's landholdings, is essential to obtaining the full benefits of irrigation." Scatteredparcels of land cause a waste of labor and make farm and irrigationmechanization aimed at removing labor bottlenecks expensive and difficult.38
, 39
3. Successful introduction of the high-yield crop varieties of the"Green Revolution" requires irrigation, fertilizers, pest control, agriculturalextension services, and high-peak labor or selective mechanization simultaneously.
4. Working for and sharing the fruits of economic growth not onlymake progress real today but impart a feeling of hope and security for tomorrowthat is essential to birth control programs'? -and population stabilization isessential to the well-being of those already born and the children of the future.
The transformation of agriculture in the Third World requires muchmore than the development of individual village economies. The villages of theThird World are usually too small to support full-time agricultural extensionworkers, a hospital, a bank, servicing facilities for agricultural machinery, and soon. Most importantly, a prosperous agriculture requires organized markets towhich farmers can bring and sell their surplus production; where they canpurchase the consumer goods and services necessary to improve their lot, and thecapital goods and services necessary to the economic health of their farms. Themarket town also serves as a focus for the diversification of the rural economyand a base for many small scale industries, such as bicycle manufacture or theproduction of leather goods.
The case for establishing market towns of a few thousand to 50,000people to serve as a geographical focal point for developing the surroundingagriculture has often been persuasively argued.41
,42 The rates of increase of thepopulation in large cities in the Third World are often 5 to 6 percent per year. 43
Horrendous projections of a Calcutta with 66 million people 25 years hence havenot jogged the planners and governments to action, even though in today'sCalcutta, with a tenth of that number, a million or more people live in thestreets and slums, and jobs are hard to come by.
The number of market towns that must be established depends onsuch factors as population density and modes of transportation in common use.The average area served by such towns varies between 115 square kilometers inTaiwan to 450 square kilometers in Yugoslavia, with the speed of transportationbeing the principal constraint on the area served.44
,45 Here the building of roads,capital to fmance the most effective means of transportation, and the fuel topower it are essential to the proper functioning of the market town.
For non-commercial use only.

12 Energy and Agriculture in the Third World
Large-scale industrialization appropriate to larger towns and cities isnecessary to support the development of agriculture. This is true in spite of thefact that an emphasis on labor-intensive technologies and an emphasis on localresources tends to make production of many goods economical at the scale of avillage or market town plant. The failure of China's Great Leap Forward is areminder that many industrial activities, such as steel production, are tooexpensive on a decentralized basis. Pumps, electric motors, and similar goodsmust be manufactured on a large scale or they will cost much more thanimported equipment. Roads and railways must be built; ports must bedeveloped; large-scale power plants must be built to serve industry. But the mainaim of an industrialization program at all levels (village, market town, and city)must be the support of a dynamic agricultural economy-one that transformstoday's halting progress, punctuated with famine, into genuine economic progress for the Third World.
Notes to Chapter One
1. World Energy Supplies 1960-1970, Statistical Papers, Series J, No. 15(New York: United Nations, 1971).
20 A. B. Cambel et al., Energy R&D and National Progress (Washington, D.C.:U.S. Government Printing Office, 1965).
3. Nathaniel Guyol, Energy in Perspective of Geography (Englewood Cliffs,N.J.: Prentice Hall, 1971).
4. Katherine Gillman, "U.S. Energy Use in Historical Perspective," Specialstaff report of the Energy Policy Project of the Ford Foundation,New York, November 1973.
5. Jose Serra, EI Milagro Brasilero: Realidad 0 MUo (Santiago de Chile:Quimantu, 1971).
6. Ronald Muller, "Poverty is the Product," Foreign Policy 13 (Winter1973-74): 71-103.
7. Owen Dawson, Communist China's Agriculture (New York: Praeger, 1970).8. India 1971-72 (New Delhi: Government of India, 1972).90 Victor Sidel and Ruth Sidel, "The Delivery of Medical Care in China,"
Scientific American 230 (April 1974): 1927.10. Gunnar Myrdal, Asian Drama (New York: Pantheon, 1968).11. Edgar Owens and Robert Shaw, Development Reconsidered (Lexington,
Mass.: D.C. Heath and Company, 1972).12. Raj Krishna, "A Model of the Unemployment Trap, with Policy Implica
tions," in Fiscal Measures for Employment Promotion in DevelopingCountries (Geneva: International Labor Office, n.d.).
13. Myrdal, Asian Drama, p. 1242.14. Raj Krishna, "Unemployment in India," Indian Journal of Agricultural
Economics 28 (January-March 1974).15. Leslie Kuo, The Technical Transformation of Communist China's Agricul
ture (New York: Praeger, 1972).
For non-commercial use only.

Poverty, Agriculture, Energy 13
16. Production Yearbook 1972, Vol. 26 (Rome: Food and AgricultureOrganization of the United Nations, 1973).
17. Planning Commission, Approach to the Fifth Plan (New Delhi: Governmentof India, 1973).
18. Myrdal, Asian Drama.19. Krishna, "Unemployment in India."20. Myrdal, Asian Drama.21. Krishna, "Unemployment in India."22. Myrdal, Asian Drama.23. Krishna, "Unemployment in India."24. John Mellor et al., Developing Rural India (Bombay: Lalvani Publishers,
1972).25. John Mellor, "Report on Technological Advance in Indian Agriculture as It
Relates to the Distribution of Income," International Bank forReconstruction and Development, December 1969.
26. Robert Shaw, "Jobs and Agricultural Development," Monograph No.3(Washington, D.C.: Overseas Development Council, 1970).
27. Krishna, "Unemployment in India."28. Planning Commission, Approach to the Fifth Plan.29. Ibid.30. Owens and Shaw, Development Reconsidered.31. Ibid.32. Krishna, "Unemployment in India," p. 93.33. William Rich, "Smaller Families Through Social and Economic Progress,"
Monograph No.7 (Washington, D.C.: Overseas Development Council, 1973), pp. 2-3.
34. Sidel and Sidel, "The Delivery of Medical Care."35. Planning Commission, Report on Evaluation of Rural Electrification in
India (New Delhi: Government of India, 1965).36. Myrdal, Asian Drama, p. 689.37. Ibid.38. Mellor et al., Developing Rural India.39. Gilbert Etienne, Studies in Indian Agriculture (Berkeley: University of
California Press, 1968).40. Rich, "Smaller Families."41. Krishna, "Unemployment in India."42. L. K. Sen et al., Planning Rural Growth Centers for Integrated Area
Development (Hyderabad, India: National Institute for CommunityDevelopment, 1971).
43. Krishna, "Unemployment in India."44. Rich, "Smaller Families."45. National Council for Applied Economic Research, Market Towns and
Spatial Development in India (New Delhi: NCAER, 1965).
For non-commercial use only.

For non-commercial use only.

Chapter Two
Vignettes of Third World Agriculture
The first essential in making development policy is to analyze how agriculture ispracticed and how energy is used in rural areas in the Third World. Detailedcountry studies must underlie the creation of development plans. A morerealistic assessment of rural resources than has been previously available is afundamental requirement to set directions for research and to lay the basis forsound policy.
The kind of region-by-region, village-by-village studies that areneeded do not yet exist. But some suggestive observations do emerge from astudy of the scattered material which is available, including anthropologicalstudies, rural surveys, and national and regional data on population, crop yields,land to man ratios, and so on.
In this chapter we first offer some general remarks about ThirdWorld energy and agriculture, drawn from the fragmentary data that exist. Wethen use a similar data base to construct six examples of rural village life inChina, India, Tanzania, Nigeria, Mexico, and Bolivia. The chief reason we presentcomposite prototype villages, rather than real places, is the lack of comprehensive local studies on the connections between energy and agriculture. But thecomposites do offer an advantage in that they provide typical views of theirregions and show how life in the village relates to national and regional policy.
We use these prototypes not only to show how people live on farmsand villages in the Third World at present but also, in succeeding chapters, todemonstrate possibilities for change. The aim is to show in concrete detail whatpotential for development may lie beneath the surface of these villages, despitethe misery in which many of the villagersnow exist.
Since the data used here are not definitive but only indicative,extrapolations should be made with caution. Conditions within a country orregion, or even among nearby villages, may vary enormously Attempting duecaution, inferences are made in order to build up a more or less complete picture
15
For non-commercial use only.

16 Energyand Agriculture in the Third World
of villages in diverse areas. Firewood use, fertilizer use, technologies and costs ofelectrification, extraction of water from subterranean sources, and so on, arededuced from regional trends and national statistics. Where basic data werelacking, energy use was inferred from data that do exist for similar circumstancesin other countries. Even from the fragmentary information available, it is clearthat the rational use of energy in agriculture is a cornerstone for development.
Before proceeding to detailed descriptions of villages and regions,some important but often little known facts about Third World agriculture needto be considered.
If the total amount of energy, including animal and human labor,which goes into farming is calculated, the results are surprising-farms inunderdeveloped countries often use more energy per hectare than farms in theindustrialized nations. It takes more energy to feed the bullocks and mules thatwork the fields of much of the Third World, than to farm with the heavilymechanized methods of U.S. agriculture. Since farms in the U.S. are generallymuch more productive per unit of land, energy use per ton of food in theunderdeveloped countries is much higher in comparison with mechanizedfarming, even when the heavy energy investments in irrigation and fertilizers aretaken into account.
The widely held notion that subsistence farming is more frugal thanmechanized farming in its use of resources-particularly energy resources-isfalse. While today's mechanized farming uses more nonrenewable energyresources than subsistence farming and wastes the energy value of crop residuesproduced in the fields, there is no intrinsic reason why these abundant cropresidues could not substitute for the oil used by farm machines (Chapter Four).
The idea that subsistence farming is harmless to the environment isanother misapprehension. The spreading Sahara desert, as well as the soil erosionand flooding in South Asia, all of which are partially due to overgrazing anddeforestation, bear witness to the heavy economic and ecological price that ispaid when ancient agricultural practices, designed to support millions of people,are used to try to sustain billions of people and domestic animals.
Data on the energy intensity* of rice production in India, China,Taiwan, and the U.S. are shown in Table 2-1. A few conclusions can be drawnfrom this table.
The installed horsepower per hectare is highest in Japan and theU.S., but the energy required for farm operations (plowing, sowing, harvesting,etc.) is smaller in the U.S. than in other countries. In Japan energy use perhectare is moderately low.
Much of the horsepower on Third World farms is in the form ofanimals. For every hectare of cultivated land in India there is one draft animal,
*Energy intensity of farming is defined here as the amount of energy,including the indirect energy inputs in the form of fertilizers, that it takes to produce oneton of food.
For non-commercial use only.

Table 2-1. Energy Use per Hectare in Rice Production in Various CountriesB, b
Total EnergyInstalled Energy for energy intensityhorsepower hp per irrigation and inputhac farm machines Energy for farm nitrogen fertilizers perha Rice million Btuand dra{I operations manufacture million yield per ton of
Country animals only million Btu per hae million Btu per ha Btu kglha Rice
India 0.7 20 6.5 26.5 1,400 19China 0.7 20 12 32 3,000 10.7Taiwan 0.5 10 22 32 4,000 8Japan 1.6 10 25 35 5,600 6.2U.S.A. 1.5 7 25 32 5,100 6.3
Sources: See Chapter One, Table 1-2, and Appendix A; notes 1, 2,3,4,5.aWe have chosen to compare a single grain (rice) since total grain production not only depends on seed variety, soil quality, etc., but also on themix of grains grown. Comparing a single grain, therefore, gives a better comparison of the energy intensity of various farming methods.bInstalled horsepower and energy use are based on national average energy use in agriculture. The numbers in this table are very approximate.cFor India and China about 20 percent of the installed horsepower is in tractors; for Taiwan 50 percent; for Japan 90 percent; for the U.S. 100percent.dWeassume that one draft animal (ox, horse, mule) is approximately equal to Y2 horsepower. This implies a draft animal of about 250 kg3 . For lackof data, it is assumed that draft animal weight is about the same in ail poor countries. Since a bullock or horse weighing 250 kg. is a rather smallanimal, this assumption may give rise to an underestimate of installed horsepower for some countries (e.g., Taiwan). It is assumed that 75 percentof the energy output of the draft animals is used on farms, the other 25 percent being used for transportation, pumping domestic water, andsimilar nonfarm activities (which are excluded from the calculations). Installed horsepower numbers include tractors, but exclude irrigation equipment, trucks, and autos on farms.Annual energy input per draft animal is assumed to be 25 million Btu. Tractor fuel input 7 million Btu/ha/yr for fully mechanized farms(U.S. data).eThe energy for irrigation varies according to the irrigation method, terrain, rainfall, water table depth, etc. For the purposes of comparison we haveused 15 million Btu of energy input (3 million Btu of useful work) per irrigated hectare per crop. Thus in India, about 40 percent of the riceproducing land is irrigated, so that the irrigation energy input per hectare of rice-producing land is taken as 0.4 X 15 X 106 Btu or 6 million Btu.The energy input for chemical nitrogen fertilizer manufacture is about 75 million Btu per metric ton of nitrogen. No energy cost is assigned to thepreparation of organic fertilizer. The energy requirements for potassium and phosphorous are small compared to those for nitrogen fertilizers.
sCQ'
~...Citc.,C)......
~:::;'C1.
~~~:::!0'c::~(il
-......,
For non-commercial use only.

18 Energyand Agriculture in the Third World
usually a bullock. Much the same is true of most subsistence agriculturaleconomies in Asia and Latin America. (In much of tropical Africa human laborpredominates.) Draft animals are relatively inefficient sources of mechanicalpower (though they are not as inefficient when the dung is used effectively).This is particularly true of the illfed, weak draft animals common in India andAfrica, since a greater share of the energy they consume goes toward themaintenance of their metabolism.
Of the five countries in Table 2-1, Japanese farms have the highestinstalled horsepower per hectare. If one adds the approximate horsepowerrequirements for irrigation* and for the manufacture of tractors and fertilizers,we find that the total installed horsepower is 2.5 to 3 hp per hectare for the U.S.and Japan, 1.5 to 2 hp for Taiwan, and 1 to 1.5 hp for China and India. Thesedifferences in total horsepower are relatively small. However, the capitalrequirements for irrigation and the manufacture of fertilizers are large.Investment in these areas is essential to dramatic increases in agriculturalproductivity, except in cases where a copious source of foreign exchange isavailable to import food and fertilizers.
To some extent the differences in installed horsepower are misleading because the various kinds of specialized equipment that are used on Japaneseand U.S. farms often have their own engines attached and each engine is used forfewer hours per year than the bullocks, mules and horses of the poor countriesThe power requirements for improving farm productivity can be decreasedsubstantially if the equipment is designed for multiple uses (Chapter Three).
Table 2-1 shows that the energy required per hectare is about thesame in all countries when the energy requirements of irrigation and fertilizersare taken into account. Since the yield of rice is higher in Japan and the U.S.,the energy requirements per ton of rice are much smaller than in India or China.Table 2-1 also shows that as the use of irrigation and fertilizers increases, theproduction per hectare rises, and the total energy requirements per ton of ricedecrease rapidly.
The data on rice indicate that the productivity of land depends onthe amount of useful energy put into the farm, both directly in the form of farmwork and indirectly through the application of irrigation water and fertilizers.Appendix A describes in some detail how the efficiences of the varioustechnologies of energy use are specified in order to derive a measure of "usefulenergy."
Outside of field work, the energy requirements of the Third World.are met largely by the use of wood. In most underdeveoped countries,particularly in Asia and Africa, the use of fuelwood exceeds the combined use ofall forms of commercial energy. Dung and crop residues are other importantenergy sources. When these energy sources are omitted, as they often are in both
*The horsepower requirements for irrigation vary a great deal. We use 1 hp perirrigated hectare for illustrative purposes. See Chapter III and Appendix A for details.
For non-commercial use only.

Vignettesof Third World Agriculture 19
national and international energy accounts (with the major exception ofIndia),serious misunderstandings of comparative energy use arise. In fact, in theunderdeveloped countries, the use of "noncommercial" fuels (wood, dung, andso on)* is much larger than the use of "commercial" fuels-about 25 million Btuper capita per year for noncommercial energy compared to 10 million Btu percapita for commercial fuels.6 ,7, 8, 9, 10 Total per capita energy use in theunderdeveloped countries is, therefore, 30 to 40 million Btu per year or aboutone fourth of what is typical in the industrialized nations and about one-tenth ofthe averageU.S. use.**
Deprivation of the benefits that energy brings is very real in theThird World. But to improve economic conditions of rural peoples requiressomething in addition to a general increase in the level of energy consumption.An immediate and less expensive way of achieving more benefits from energy inmany cases is to make more efficient use of present resources, including all thenoncommercial energy resources, which are relied upon so heavily in the ThirdWorld.
The following pages describe six areas of the Third World andprototypical composite villages, the data for which have been compiled fromnational, regional, and local sources. These six villages represent the basicvariations of agriculture in the Third World except for agriculture as practiced bynomadic peoples and the slash-and-burn agriculture still prevelant in some areas,such as some islands of Indonesia and the Philippines.
Farming conditions and practices as well as the energy sources anduses that are typical of the vast majority of farmers in the Third World, arerepresented in these case studies. The irrigated wheat farms of Arango, Mexico,which are ploughed largely with tractors and are planted with high-yieldingvarieties of wheat and corn, are essentially similar to many farms in Punjab inNorthwest India. The organic manuring practices on the rice fields of SouthernChina are common in South India and Taiwan. The manual farming unassistedby cattle, irrigation, or machines in the Tanzanian village (Kilombero) is typicalof many areas of tropical Africa A few of the facts that emerge fromcomparison of these regions and villages are:
1. Adequate power to work the fields either in the form of draftcattle or farm machines, irrigation, and the use of fertilizers (chemical andorganic) play crucial roles in determining the wealth of agricultural communities.Except for the farms which are run only with manual labor, energy use per unitof land is high, but the amounts of useful work derived from the energy varies agreat deal from one place to the next (see Appendix A). Crop yields appear to becorrelated with the useful work derived from energy use rather than total energyuse.
*In all cases, wood not used as a fuel is excluded.**Per capita consumption of commercial fuels is generally higher in Latin
America than in Asia or Africa!!
For non-commercial use only.
20 Energy and Agriculture in the Third World
2. The yields of crops vary not only from place to place but alsofrom one year to the next, particularly in unirrigated areas. Since these areprecisely the areas where economic conditions are most precarious, inadequaterainfall often brings disaster. In years of adequate rainfall;there may be surplusgrain production, but often a lack of good storage facilities prevents a buildup ofsufficient reserves to get by in the leaner years.
3. The peak labor problem is a feature of most agriculturalcommunities, affecting those most that rely solely on human and animal labor.
4. The unplanned use of wood as fuel is causing problems which inmany areas are already severe and will become so in others if better managementof wood resources is not instituted. In the Sahel region of Northern Africa itcontributes to the inexorable southward advance of the Sahara and in the IndianSubcontinent to flooding in the Gangetic and Indus plains.* 12 Yet the enormous resources of wood, land, and sunshine that are available in many underdeveloped countries in Africa, Latin America, and Southeast Asia could, ifeffectively used, help promote agricultural and economic growth.
When we speak of waste or inefficiency, we do so in the nationalcontext. Individuals without capital resources have no choice but to burn woodor dung the way they do. Thus, while the individual may use his resources asefficiently as he can, the nation may still be wasting resources by neglectingopportunities.
The primary aim of the vignettes of regions and prototypical villageswhich follow is to portray energy use in the context of agricultural practices andregional realities. This is the background for an assessment of the energy needsof agriculture, a technical and economic evaluation of some sources of energythat could fulfill those needs, and a discussion of the implications foragricultural development policy. Table 2-2 shows a summary of energy use inthe prototypical villages.
INDIA
Of India's population of 580 million, about 350 million live in small villages ofless than 2,000 people each. Most of these people are too poor to buy adequatefood, medical care, decent housing, and sanitation, and the technological toolsnecessary to improve their productivity and income. A population growth rateof about 2.2 percent per year contributes to the monumental problems ofeconomic and social development.
About 140 million hectares of India's area of 320 million hectares iscultivated land.P India therefore has a cultivated area comparable to that of the
*Extensive deforestation causes flooding because trees retard the flow of runof water into rivers and streams. Forests, therefore, not only help hold the soil together butthey cause more of the rainwater to percolate to underground reservoirs. Trees, in effect, actas natural bunds in aiding soil conservation.
For non-commercial use only.

Table 2-2. Comparison of Energy Use in the Prototypical Villagesa
Agricultural Energy Use Energy Use per
Farm Work, Irrigation, Capita in Trans-
Chemical Fertilizers portation, CropDomestic Energy in Million Btu/yr. b Processing and Total per Capita
Use per Capita Other Activities Energy UseMillion Btulyr.. Per Capita Per Hectares Million Btu/yr.b,d Million Btu/yr.
Useful Energy Useful Energy Useful Energy Useful Energy Useful EnergyPlace Energy Input Energy Input Energy Input Energy Input Energy Input
1. Mangaon, India 0.2 4 0.5 7.7 1.6 25.6 0.1 3.4 0.8 14.72. Peipan, China 1 20 1.4 8.3 6.5 41.5 0.1 3.2 2.5 31.53. Kilombero, Tanzania 1.1 22 0.06 2.3 0.1 3.8 0.02 0.7 1.2 254. Batagawara, Nigeria 0.75 15 0.16 2.4 0.4 7.3 0.03 0.9 0.9 18.55. Arango, Mexico 1.6 17 13.5 41 14.9 45.5 o.r» 3.6e 15.2 61.66. Quebrada, Bolivia 1.7 33.3 0.3 6.7 1.8 40 0.3 6.6 2.3 46.6
~his table is derived from Tables 2-4,2-8,2-12,2-15,2-18, and 2-22.bHalf the human food has been included in the columns for agricultural energy use, the other half in the columns showing energy use for miscellaneous activities.~he area of land which is cultivated (not including any multiple cropping) is used for computing energy use per hectare.dFifty percent of the human food and 25 percent of the draft animal energy is included in these columns, except for Quebrada, Bolivia, where 50percent of the human food and 50 percent of the draft animal energy is included. For Kilombero, Tanzania, and Batagawara, Nigeria, we includeonly 25 percent of the human food in the "other" columns and 75 percent for farm work, because generally farm work is unassisted by draftanimals or machines. The rest of the human food and draft animal energy is included in the columns showing agricultural energy use. This breakdown is somewhat arbitrary for we only know that most of the draft animal labor and a large portion of the human labor are used on thefarms but have no empirical data on the subject.eThis number is probably an underestimate since we have not included oil or electricity for crop processing or oil for transportation of food andfertilizers.
~:::sCb.....~c......:;!a:~::t..~
:b~
[e~
I\)-
For non-commercial use only.

22 Energy and Agriculture in the Third World
U.S. or China, although its total land area is only about 40 percent as large aseither country.
India's agricultural progress during the period 1950-1970 wassubstantial. Food (cereals and pulses) production doubled from about 51 milliontons a year in 195(}-51 to about 100 million tons in 1969-70, while populationincreased by about 50 percent. Thus, in spite of the severe drought of the midsixties, the per capita availability of food increased. The average picture is,however, misleading because the distribution of this agricultural progress amongthe various regions of India as well as the distribution of the increased incomesfrom agricultural and economic growth has not been uniform. Thus Punjab (inNorthwest India) has had spectacular growth in agricultural production andparticularly in wheat production since the introduction of the high-yieldingvarieties of wheat in the late 1960s. Foodgrain production in Punjab increasedat 15 percent per year (compounded) during the period 1966-70, and wheatproduction increased at 18 percent per year during this period.!" Seventy-twopercent of the cultivated area was irrigated in 1972, and about 40 percent of thecultivated area was sown more than once. Although all classes of farmers havebenefited from agricultural growth, "the farmers in the higher income groupshave gained relatively more than lower income groups," according to a samplesurvey in the Ludhiana district analyzed by Mohindar Mudahar.'"
The regional disparities are even greater. Only 25 percent or so ofIndia's cultivated land is irrigated, but in Bihar this figure falls to 10percent 16,17,18 though Bihar lies on an amazingly rich source of subterraneanwater in the Gangetic plain which is recharged by many snowfed and rainfedrivers. Much of the irrigated area in India cannot support two crops a yearbecause the water supply in many canal systems is insufficient. Many parts ofIndia's irrigation system are quite old and were not built to cope with theintensive use required for high-yielding seeds and multiple cropping. Partlybecause of these inadequacies, only 20 percent of India's irrigated area is sownmore than once a year. 19
The picture is similar in rural electrification: 25 percent of thevillages in India have electricity. In Haryana, in Northwest India, all villages haveelectricity; in Tamil Nadu the figure is 97 percent; in Punjab 55 percent; in UttarPradesh about 20 percent; in Bihar about 15 percent; and in Assam, in EasternIndia, about 3 percent. 20, 21 The proportion of villagers who actually use theelectricity where it is available is quite low. The rural electrification survey of1965,22 reported that electricity use in an average village ceases to grow whenonly 20 percent of the people use it.
While the lot of many rural people has improved since independencein 1947, particularly in the Northwest and in parts of the coastal plains, the lotof many of the landless and many farmers with small or marginal land holdingshas not improved. In many cases it has become worse.
The food-fertilizer-oil crisis has hit India particularly hard. It was
For non-commercial use only.

Vignettes of Third World Agriculture 23
one of the principal factors in the decline in grain production from a high of 108million tons in 1970-71 to 103 million tons in 1973-74. The trend of rising percapita food production in the 1950-1970 period was reversed in the 1970-74period. Even in Punjab, India's most productive agricultural state, yields aredeclining because of a shortage of fertilizers and pesticides and lack of enoughoil and electricity to run the irrigation pumps. At the same time the fertilizerplants of India are running far below capacity (50 to 60 percent).
India is one of the few countries where a systematic attempt hasbeen made to determine the extent of use of noncommercial fuels. Samplesurveys in villages and towns were conducted by the Energy Survey of IndiaCommittee to determine the extent of noncommercial fuel sources and uses.23
The Committee reported that about 120 million tons of wood, 50million tons of dry dung, and 30 million tons of "vegetable wastes" were burnedeach year, largely in the villages but also in the towns. Vegetable wastes fed todraft animals were not considered in the report. If the energy taken in by draftanimals is included, the per capita consumption of noncommerical energy isabout 12 million Btu per year (about half of which is burned directly as a fuel)compared to the commercial energy use of 6 million Btu per year (aboutone-fourth of which is used to generate electricity).* About 10 percent of thecommercial fuels are consumed in the villages primarily for irrigation and farmmachines. The other 90 percent is consumed in the towns and cities, most of itgoing to industry and transport.
The statistics on noncommercial fuels are compiled in a way so thatcommercial fuels appear to play a larger role in energy use than is actually thecase. If the energy content of both categories of fuel is measured on a Btu basis(or metric tons of coal equivalent), as is standard practice in almost all countriesand in the United Nations, the noncommercial fuels assume more significance.With the international method of accounting, 86 percent of India's energy use in1954-55 was in noncommercial fuels; with the "coal replacement" method usedin India, the figure is about 70 percent." For example, a metric ton of cow dungused for cooking is taken to be equivalent in energy value to the amount of coalthat would replace it, if coal were used in place of the dung. Since the efficiencyof coal burning is assumed to be higher, this practice understates the quantity of energy available in the dung. Energy in dung can be used just as efficiently as energy in coal, provided that it is burned in the right equipment. Therefore,the energy accounting procedure used in this book is based upon the energycontent of the fuel. This gives us a more accurate picture of the amount ofresources that are available and the amounts that are used.
Much of the world's poverty is concentrated in the rich alluvial plainof the Ganges River which consists of Bangladeshand the Indian States of UttarPradesh, Bihar, and West Bengal. The protypical village in Bihar that we have
*Fuel input for electricity generation is taken as 12,000 Btu per kwhedelivered, which is typical of many underdeveloped countries."
For non-commercial use only.

24 Energy and Agriculture in the Third World
chosen for study is poorer than villages in many other parts of India such asPunjab or the coastal areas of Tamil Nadu in South India. We have chosen itbecause it represents the conditions of life for a great many of the 300 millionpeople who populate the Gangetic plain, and because we feel, that this area withits rich soil and water resources has great potential for agricultural growth. Theseare also among the reasons that we have used this village as the principal examplein our illustrative calculations of energy needs and the economics of energysupply described in Chapters Three and Four.
Mangaon, India*Mangaon, a village of 1,000 people, lies a few miles north of the
Ganges River in Bihar-the heart of the Gangetic plain. Every inch of availableland is cultivated here. The forests have long since been cleared, and thelandscape is apatchwork quilt of small fields dotted with stands of fruit trees.Thirty percent of the people in Mangaon are landless, and another 40 percent ofthe families (five or six people per family) own less than one hectare scatteredamong many small holdings. The wealthiest 10 percent control almost half theland, and even these "wealthy" are usually poor; but they are the most powerfulmembers of the community, controlling most of the credit and employing thelandless who are usually indebted to them.
The average family holding is about 1.S hectares (divided into manysmaller plots), the median is about 0.8 hectares, and the land to man ratio isabout 0.3 hectares per person. In many areas of Bihar, such as the MusahriBlock, the ratio is much smaller-0.1S to 0.2 hectares per capita-and is fallingrapidly under the severe pressure of population growth.
Governmental agricultural development programs are administeredby the Block Development Officer. (A Development Block consists of 60,000 to100,000 people.) Roads and wells are often as not put on property belonging topeople with influence (often synonymous with bribing capability) rather than inplaces which would achieve the best result for the development of the area.There is a cooperative bank in the area, but the landless and many smalllandowners cannot take advantage of the low interest loans either because theirholdings are too small and scattered to profit from them or they cannot offerthe requisite collateral. They borrow from the money-lender (for buying seeds orfood, for weddings, and so on) at annual rates of interest that are often run ashigh as 36 percent per year.2S Development efforts have not been adequate toinitiate rapid agricultural growth in this area. In Mangaon, which is representative of many poor villages of the Eastern Gangetic plain, the per capitaavailability of food has declined in the last 20 years, in contrast to the averagestatistics for India.
*The primary sources for the statistics are The Musahri Plan and India1971-1972, notes 18 and 13, respectively.
For non-commercial use only.

Vignettesof Third World Agriculture 25
Geography. Northern Bihar is crisscrossed by innumerable snowfedand rainfed rivers which often cause floods during the summer monsoon season.The Gandak River, which originates in Nepal, passes near Mangaon. The rainfallaverages 100 centimeters a year, but can vary by a factor of more than two fromyear to year.26 But because of the plentiful flow from the Himalayan rivers,there is an ample supply of water beneath the fertile alluvial soil. Thesubterranean water system and the rivers that crisscross the Gangetic plain areone of India's great agricultural resources. Sandy, loamy, and light clayeysoils aremost prevalent.
Farming Conditions and Practices. Despite a bounteous supply ofsubterranean water-the water table is often as little as 3 meters below theground surface-and a snowfed river only a few miles away, only 10 percent ofMangaon's 300 hectares are irrigated. The irrigation system consists primarily ofwells powered by draft animals, and irrigation water is used primarily tosupplement rain water.
The inadequacy of irrigation and water control is a principal reasonfor the poor yield on Mangaon's farms and therefore for the poverty of itspeople. The rainfall must be just right or there will either be drought or floods.*In one decade (1951-1960) there were two flood years and one year of severedrought. Deforestation in the hill areas to the South and on the North Gangeticplains appears to have played a major role in the increasing frequency of floods onboth the Indus and Gangetic plains28
• (Droughts are generally more damagingthan floods for they can destroy a large proportion of the crop over vast areas).There have already been two droughts in the 1970s-in 1972 and again in 1974.
Drainage of water from the fields is a problem in the flat Gangeticplain. Building channels in the fields so that the extensive river system can beused for drainage increases the cost of providing adequate water control.However, canal irrigation in many areas has to be accompanied by a drainagesystem to supplement the natural drainage because canal irrigation is likely tocause an appreciable rise in the water table which is already close to the surface.Such increases in the ground water level that may damage the soil bywaterlogging have, for example, been experienced in the Nagarjunasagar projectin South India.29
The people and the 300 draft cattle provide almost all the labor forthe fields, including the energy required to provide water for the 30 irrigatedhectares. Table 2-3 shows the livestock data for Mangaon. Chemical fertilizersare not in widespread use, and neither are high-yielding varieties of wheat or rice,since irrigation is a prerequisite for their effective use.
*The Irrigation and Power Ministry of the central government has launched amajor study of water resource development in the Gangetic plain, including flood control.t?
For non-commercial use only.

26 Energyand Agriculture in the Third World
Table 2-3. Livestock in Managaon
Type
Draft cattleMilch cattleHorses, donkeys, mulesGoats and sheep
(primarily goats)Pigs
Number per Capita
0.30.10.005
0.80.008
Total
300100
5
8008
Energy. Fuel cakes made of cowdung mixed with crop residuesprovide the main source of fuel. Cooking is the main fuel use, although severaltimes each year the village potter buys several tons of cowdung with which tofire his kiln. After the surgarcane is harvested, substantial quantities of bagasse(cane residue after the juice has been extracted) are used as fuel to boil off thewater in the cane juice to make raw sugar. Some wood is also used for cooking,but its use is not as large as in other parts of India because there aren't manytrees. The ownership rights of trees are carefully defmed since they are scarce.
Most of the crop residues are fed to the animals in quantitiescarefully calculated by long experience, so that a maximum benefit can beobtained from the scarce food available for the cattle (Chapter Three). Mangaonhas no electricity. A few of the wealthier households have kerosene lamps, butthe most common light is the dim glow of the hookah in the baithak (sittingplace). Domestic water is obtained from wells and this task together withcooking and fuel collection occupies a large portion of the time of the women inMangaon.
Table 2-4 summarizes the energy use in Mangaon.
Agricultural Production. Rice is the main crop and is grown on theclayey soil in the wet season. The sandy soil is usually cultivated in the winter
_(rabi crop). Wheat, maize, and barley are the principal rabi crops. Sugarcane,gram, chillies, and potatoes are also grown. The rice yields are poor-often as lowas 650 kg.jha, and average about 900 kg.jha, The all-India average rice yield isabout 1,400 kg./ha. The yields of other crops are also usually below the averagesfor the rest of the country, which in turn are poor by the standards of the yieldsobtained in, say, Arango, Mexico, or the U.S.A. or the irrigated regions ofPunjab and Haryana in India. Table 2-5 shows the yields and crop production inMangaon.
Although there are a number of rivers in the vicinity, fishing is not amajor activity. This is in contrast to West Bengal farther down the Gangeticplain. Systematic exploitation of the excellent opportunities for fisherydevelopment could provide a desperately needed source of protein to the peopleof the Gangetic plain.30
For non-commercial use only.

Table 2-4. EnergyUse in Mangaon, India (Energy in Billion (109)
Btu per Year Except Row 13)
Efficiency Gross EnergyEnergy Source Useful Energy Percentage Input
1. Animal labor (including irrigation) 0.38 5 7.52. Woodfuel 0.05 5 13. Crop reSidUeS} . 0.05 5 14. Dung direct use as fuel 0.1 5 2
5. Subtotal: noncommercial 0.6 5 11.5
6. Coal, oil (household use) small small7. Electricity
8. Subtotal:commercial small small
9. Total: 5 + 8 0.6 5 11.5
10. Human energy 0.08 2.5 311. Chemical fertilizers 0.15 0.15
12. Total energy use: 9 + 10 + 11 0.8 5 14.7
13. Per capita energy use 0.8 14.7per year million Btu 5 million Btu
1. Throughout the energy calculations in this chapter we assume that one bullock or horseproduces a power of about Yz hp and works for about 1,000 hours per year (notes 1 and 3),yielding a net annual output of energy of about 1.2 million Btu. Input per draft animal istaken as 25 million Btu/yr. For human labor we assume a net energy output of 0.17 millionBtu per year (50 kwh) for each person over 15 years of age. Daily intake of food isassumed 8,000 Btu (l kcal =4 Btu). Gross energy in human food includes food intake byall people.2. The use of 5 percent efficiency for draft animals is discussed in Appendix A.3. We have assumed an efficiency of 5 percent for the use of noncommercial fuels (wood,dung, and crop residues) by comparing energy used for cooking in gas stoves with that usedin open cooking fires. The annual energy use in a gas stove without pilot lights is between 4and 8 million Btu in the U.S., while the cooking energy requirements for a family usingnoncommercial fuels (without efficient ovens or stoves) is 20 to 30 million Btu per year. Ifwe assign an efficiency of 20 percent to gas stoves-somewhat arbitrarily-then the efficiency of rural cooking would be about 5 percent. One of the main reasons for usingmeasures of efficiency of energy use for domestic purposes is to get some idea of thepotential energy surplus if rural energy sources are used more efficiently.4. We assume that 75 percent of the animal labor and 50 percent of the human labor is forfarm work.
Table 2-5. Annual Crop Production in Mangaon
Crop Yield kglha Area ha Production tons
Rice 850 140 120Wheat 850 30 25Maize 1,100 50 55Barley 850 30 25Sugarcane 30,000 12 360Pulses,
vegetables, etc. Variable 20 ?Fish 0.1
27
For non-commercial use only.

28 Energy and Agriculture in the Third World
THE PEOPLE'S REPUBLIC OF CHINA*
China's 800 million people and their leaders have gained the admiration of theworld for their progress in providing food, housing, and decent medical care fortheir people. This has been achieved because the Chinese have made equitableredistribution of income between city and countryside and agriculturalproduction the pillars of their economic policy. More equitable distribution offood, achieved primarily through China's revolution in land ownership in whichmost of the land is communally owned and the rest shared among rural families,has been particularly important because China's agricultural growth has beenvery uneven. In fact, the overall growth in agricultural production in the1950-1970 period barely kept up with population growth, and per capita foodavailability was actually lower in the late sixties than it was in the earlythirties. 31, 32
Two of the principal causes for China's failure to achieve a sustainedgrowth in per capita food production are related to the issues of energy andmechanization. The first, and probably more important, was that populationgrowth was encouraged in the fifties and sixties; the second was the failure ofthe industrialization policy of the Great Leap Forward.
Mao Tse-Tung was a forceful advocate of increasing China'spopulation." While part of this advocacy may have been related to ideology,one reason appears to have been that China's policy makers perceived a shortageof labor. 3S They were only partially right. In China, as elsewhere in the ThirdWorld, agricultural innovation is often limited by the availability of labor atcertain times during the crop cycle. The solution that China adopted was toencourage population growth and to try to even out the peaks in labor demandby multiple cropping, public works projects, and decentralized industries. WhileChina has had considerable success with multiple cropping and decentralizedindustries (including rural electriflcation'"}, the failure of the population policyis clear-per capita food production did not increase between 1950 and 1970.
The failure of the Great Leap Forward was also related to the peaklabor problem. By encouraging "backyard furnaces" to exploit local mineraldeposits (iron in particular), not enough labor was available in the fields atcritical periods. Development priority was changed from agriculture to heavyindustry (both centralized and decentralizedj.'? As the peasants found out inthe famine that followed, they were damned if they worked the backyardfurnaces and damned if they didn't.
It appears that these failures were related to the failure to properlyanalyze the nature of the peak labor problems. The Chinese have traditionally
*The principal reference for the economic policy discussion is Goodstadt'sChina Search for Plenty (note 33).
For non-commercial use only.

Vignettesof Third World Agriculture 29
relied heavily on human labor, even for Imgatton." This tradition, reinforced byMarxist economics, was reflected in Mao's emphasis on human labor even whilehe was in favor of farm mechanization. 39
The mistake of the Chinese planners was their failure to note thatthe peak labor problem was, in essence, an energy problem. Selectivemechanization of peak labor operations with multiple cropping by using ricetransplanting machines, harvesters, etc., would probably have been a moresatisfactory solution than encouraging the production of babies who would consume food for at least 10 years before they could provide labor for the farms.This conclusion is reinforced by our earlier analysis (Table 2-1 of this chapter)that the use of animal and human labor creates larger energy demands per unitof food production than mechanized agriculture, and demands a much moreprecious form of energy-food.
That Chinese leaders have recognized these mistakes was evident inthe mid-sixties during the Cultural Revolution and in the recent reversal ofChina's population policy.f? The main emphasis of China's economic development policy today is agricultural development, as is illustrated by the fact thecurrent heavy commitment to building chemical fertilizer plants.
Chinese farmers have traditionally husbanded organic wastes of allkinds for use as fertilizer.41 Even today over half of China's nitrogen andperhaps 80 percent of the phosphorous and potassium fertilizers come fromhuman and animal dung and vegetable sources." To use the wastes as fertilizerthe Chinese compost them and in so doing waste their fuel potential.
The use of coal and electricity for powering irrigation pumps and ofoil for tractors (usually 15 horsepower) is rising rapidly, as is the use of chemicalfertilizers. China currently exports about 30 million barrels of oil a year, and itsoil production is expected to rise rapidly. Ninety percent of China's 10quadrillion (101S) Btu of commercial energy comes from coa1.43
China has large surface and subsurface supplies of water forirrigation and the irrigated acreage has expanded rapidly.
Dawsonf" details a considerable controversy as to the "effectiveness" of the irrigation schemes. He cites a conservative estimate for 1967 of 39million irrigated hectares-or 35 percent of China's cultivated land. On this basisthe current (1974) "effectively" irrigated area would be about 50 percent, but70 percent of the cultivated area would have some irrigation water available.Thefigure of 70 percent can be compared with India's 25 percent irrigated area, forin both cases the figures do not reflect the adequacy of the irrigation system tosupply the quantities of water needed when it is needed.
China has a land area of about 950 million hectares (slightly morethan the U.S.), but of this only about 150 million hectares are arable land, ofwhich 110 million hectares are cultivated. This cultivated area is similar to thatof India or the U.S. But since the potential for expansion at least in the next
For non-commercial use only.

30 Energy and Agriculture in the Third World
decade or two is not large, China must rely on increasing crop yields and onmultiple cropping to feed its people. Currently China produces about 2 tonsof grain per cultivated hectare per year which is intermediate between India (lessthan 1 ton/ha) and the u.s. (3 to 4 ton/ha).
Fish provides an important source of protein for the Chinese people.China is one of the largest fishing communities of the world, with an annualcatch of about 10 million tons (extrapolated from Dawson?"). One-third toone-half of the catch is from fresh water and marine farms. Chinese plannershave been aware of the immense advantages in producing fish from such farms.
Energy. Wood is China's principal domestic fuel in rural areas.According to Richardson,"? there exist no reliable estimates of rural fuel woodconsumption. However, the physical evidence points to extensive use of woodand other vegetable matter as fuel as illustrated by the following quotes fromRichardson's book, Forestry in CommunistChina:
Another factor which may well contribute. to the devastatedappearance of young plantations is the very real fuel shortage inmost parts of China. The great majority of rural Chinese must relyon wood and other vegetable matter for all cooking and heatingpurposes and, in the deforested areas (where 98 percent of thepopulation is located), fuel is at a premium. In the rural communes,peasants are allowed to harvest dead trees for burning and they have,thus, a vested interest in early mortality. To tend trees for posterity,while freezing in the present from lack of firewood, demands analtruism scarcely to be expected, even in China; there is evidence, infact, that, as happens in the new territories of Hong Kong, trees arestolen for fuel almost as soon as they have been planted.48
No forest areas are maintained specifically for fuel in China andthe bulk of the requirement is satisfied by loppings of branches,dead trees, and debris from the forest floor. As of right, peasants canremove dead trees from forests and plantations and can prune deadbranches at two-year intervals. These practices have serious implications for plantation management, in that the people have a vestedinterest in early mortality of newly planted trees and, also, theydisfigure established trees by reckless pruning. Mutilated andunsightly saplings, even in the forest-rich areas of Manchuria, bearwitness to the widespread nature of these practices.f"
However, if the use of wood as a domestic fuel in other countriesis an indication, the use of wood and other vegetable matter in rural areas isprobably over one ton per capita per year, taking into account that much ofChina has a temperate climate and is quite cold in the winter. This would
For non-commercial use only.

Vignettes of Third World Agriculture 31
amount to a total of more than 500 million tons annually. As in India andelsewhere, wood use is aggravating already serious soil erosion problems,particularly in hilly areas.50,51 The Chinese have active large-scale reforestationprograms that have met with some success, but as the quotes above indicate,reforestation would be better served if a fuel wood plantation program wereundertaken.
PEIPAN, THE PEOPLE'S REPUBLIC OF CHINA*
Peipan is a village located near the Tzu River in hilly Eastern Hunan. It is avillage of about 1,000 people (200 households) which has a cultivated area of200 hectares. Peipan is part of a commune of several villages which is the basicadministrative unit for the implementation of national agricultural policy. Theland in the commune is owned collectively by its members, but a small amountis privately owned. The annual and long-term production goals for the communeare set by the central government, but in its day-to-day operations are locallycontrolled. Decisions regarding the division of labor, production, and construction schedules are made at meetings presided over by Communist Party cadres.
In spite of the idealogical campaigns, the influence of the clan inPeipan is still strong. However, the apathy to increasing production, which was afeature of Chinese village life before the revolution, has largely been overcome.One of the instruments of this change has been the grant of small private plots toeach family for raising pigs and cultivating vegetables and bamboo or fruit treesin their spare time. They barter or sell the produce at local markets.
While the existence of private plots has at times been ideologicallyunpalatable to the ultra-leftists of the Communist Party, the necessity for suchproduction incentives has long been recognized (and fiercely debated) by thegovernment as an instrument of pragmatic economic policy. Many politicalfortunes have been made and lost in this debate over material incentives.(Whether you won or lost depended not only what side you were on but also onthe current economic and political climate.)
The produce of the commune is distributed among its members andexported to the cities. Some of the coarse grains are fed to the animalsparticularly the pigs and poultry. The share of the workers is determinedaccording to their work and productivity (the "work point" system). Most ofthe rest of the produce is exported to cities and towns. These exports providethe capital with which most agricultural development has been financed. Sucheconomic self-reliance has been a major feature of Chinese agriculturaldevelopment policy.
*The main references for the agricultural data are Dawson, Kuo, and the Foodand Agriculture Organization's Production Yearbook, (notes 31, 32, and 5, respectively).
For non-commercial use only.

32 Energy and Agriculture in the Third World
Geography
The region has a mild temperate climate and receives about 100centimeters of yearly precipitation. A small portion of the production is oftenlost to spring floods; but major floods are rare due to the many flood controland water conservation projects that have been undertaken. Droughts also occurevery few years, but the irrigation system in Peipan helps reduce the losses.
Farming Conditions and Practices
About 70 percent of Peipan's 200 hectares is irrigated land. Theterrain being hilly, much of the land is terraced and is therefore fragmented intomany small plots. Traditionally, animal labor was used for irrigation. In years ofdrought, it was common for the cattle population to decline substantially fromoverwork and undernourishment. Today, most of the irrigation and drainage ismechanized, using pumps powered by electricity, oil, and coal. Irrigation fromponds and tube wells generally provides an ample supply of water for rice, whichis the main crop. Farm machinery increasingly complements the human andanimal labor in the fields. A great deal of work is devoted to maintaining theterraces, in ensuring proper drainage, and in the collection and use of manure.
Partly as a result of the National Program for AgriculturalDevelopment, the population of draft animals increased by 4.3 percent a yearfrom 1949 to 1959. While there is disagreement on the extent of the drop inlivestock population during the Great Leap Forward, growth in the populationof draft animals recovered in the mid-sixties. Wehave used data from Dawson52
and the FAO Production Yearbook'" to arrive at the estimates shown in Table2-6.
Sixty percent of the nitrogen fertilizer and about 80 percent of thephosphorous and potassium fertilizers come from organic sources, principallyanimal dung and night soil. The rest is provided by chemical fertilizers, theproduction of which is expected to increase several fold in this decade. The totalnitrogen used is 12 metric tons per year, which averages about 60 kg/hectare ofcultivated land. The use of P205 and K2 0 averages about 30 kg/hectare of
Table 2-6. Livestock in Peipan
1. Draft cattle2. Horses, donkeys, and mules3. Hogs4. Sheep and goats5. Poultry
Sources: Notes 5, 31.
Per Capita
.15
.030.50.250.6
Total
15030
500250600
For non-commercial use only.

Vignettes of Third World Agriculture 33
cultivated land. Rice, being the favored crop, gets larger than averageapplications of manure and fertilizers.
This rate of fertilizer use is quite high and is comparable to that inmany industrialized countries. That most of this fertilizer comes from organicsources reflects the remarkable and careful husbanding of organic manure thathas characterized Chinese agriculture for centuries.
EnergyWood is still the principal domestic fuel and is used for cooking and
heating, but we have no reliable data on the quantities used. We estimate anannual per capita use of 1.5 metric tons of wood and other vegetable matterusing data on domestic fuel use from other parts of the world wherenon-commercial energy sources supply most of the energy.
Though irrigation and field operations in Peipan are becomingprogressively mechanized, human and animal labor still playa large role in thevillage economy, as evidenced by the large amount of human and animalpowered equipment (Table 2-7). About 75 horsepower is available from the 150draft animals which are utilized 100 to 120 work days a year, yielding a usefulenergy output of about 250 million Btu. Draft animals are used primarily fortransportation, ploughing, and other fieldwork.
Irrigation is mechanically powered, partly by electricity and partlyby coal- and oil-driven engines. Electricity use in rural China is about 10 kwheper capita per year and is growing at about 10 percent per year. To accelerate rural electrification decentralized stations (500 kw) are used to complement thelarge-scale transmission and distribution systems.54 A summary of energy use inPeipan is shown in Table 2-8.
Agricultural ProductionRice is by far the most important crop in this region. Com, wheat,
and soybeans are also grown, but they are not as important here as they are inNorthern China. Potatoes and vegetables are staples grown almost solely for localconsumption. Some coarse grains are fed to the pigs and cattle.
Table 2-7. Summary of Farm Equipment in Peipan
1 standard tractor (15 hp)1 motor powered plough1 motor powered harrow
50 horsepower of irrigation equipment15 rubber wheel animal-driven carts25 rubber wheel hand cartsAn undetermined number of traces, yokes, ploughs, etc.
For non-commercial use only.

34 Energyand Agriculture in the Third World
Table 2-8. Energy Use in Peipan (Energy in 109 Btu per YearExcept Row 13)
Gross EnergyUseful Energy Efficiency Input
Energy Source 109 Btu/yr. Percentage ]09 Btu/yr.
1. Animal labor 0.25 5 52. Woodfuel }3. Crop residues} di t f I 5 204. Dung irec use as ue
5. Subtotal: noncommercial 1.25 5 25
6. Coal, oil (irrigation and
}farm machinery 0.6 20 37. Electricity
8. Subtotal:commercial 0.6 3
9. Total: 5 + 8 1.85 6.5 28
10. Human energy 0.1 3 311. Chemical fertilizers 0.5 0.5
12. Total energy use: 9 + 10 + 11 2.45 7 31.5
13. Per capita energy use per year 2.45 7 31.5million Btu million Btu
Notes:1. See Table 2-4.2. Human food consumption taken as 8,000 Btu/day (2000 kcal/day). Useful work outputper worker is taken as 200,000 Btu/yr.3. Land cultivated per year-300 ha. Land irrigated-ISO ha. (including double cropping).4. Irrigation energy requirement (useful) is taken as 3 million Btu/ha/crop.
Crop yields vary depending on the region and the degree ofimplementation of the various parts of the National Plan for AgriculturalDevelopment. Table 2-9 shows figures which are probably typical of the Hunanregion.
TROPICAL AFRICA*
Sub-Saharan Africa has a population of about 250 million people, and anenormous area of about 25 million square kilometers. Though it is rich in allmanner of resources from land, sunshine and water to copper and diamonds, theproblems of development here and the poverty of its people are as stark as onemay find anywhere on earth. Here as many as a quarter of all the children die
*Mediterranean Africa (or Africa approximately north of the Tropic ofCancer) is not included in this discussion.
For non-commercial use only.

Table 2-9. Crop Production in Peipan
Summer Crop Winter Crop
Sources: Notes 5, 31, 32.Note: Although we show two crops per year, "a triple cropping system of winter wheat, rice and coarse grain" (corn, barley, etc.) is often adoptedin this region (note 31, p. 234).
Crop
1. Rice2. Wheat3. Potatoes4. Corn, barley and miscellaneous grains5. Soybeans6. Vegetables and fruits7. Fish from ponds
Yield kgfha
3,000
4,000variable1,100variable
?
HectaresPlanted
100
20501020?
Yield kglha
3,0001,000
variable?
HectaresPlanted
5050
Total AnnualProductionTons
45050
100100
11?
3
<cQ'::JCll.....CtiCI)
o.......
:;Ja~~Q..h
CC)
~.c:::-c:Cti
~
For non-commercial use only.

36 Energyand Agriculture in the Third World
before they are a year old. In remote rural areas as many as half the children diebefore they are 10 years old. The people are afflicted by all manner of diseases,caused principally by a combination of disease-bearing insects and malnutritiou."
Malnutrition here often takes the form of protein, vitamin, and tracemineral deficiency even though the availability of calories in the food sometimesexceeds the normal requirements. This is principally because of the predominance of cassava (2.4 percent protein content on a dry weight basis) and cerealsin the diet of most people.
The economic, educational, and technical problems are difficultenough, but constant political strife both within and among the nations of Africahas been and remains one of the principal obstacles to development.
The tribal structure of African society, inflamed by divide-and-rulecolonialists and the inflow of weapons from the industrialized nations, has, inmany African nations, given rise to a political climate which is hostile toeconomic and social development. The colonialists, by imposing nationalboundaries that were convenient to them and arbitrary with respect to thehistory and realities of tribal Africa," converted many independent tribes whofought occasionally, into nation states constantly at war within and with theirneighbors. The nomadic Tuareg of Mali, striken by drought and disease, have, forexample, been at the mercy of the politicians for years and have often suffered apolicy of apathy to their needs. Many have fled to neighboring Niger. In Nigeriathe Hausa and Ibo tribes fought a long and savage civil war; in Sudan Muslims arewaging a bloody struggle for domination over various other ethnic groups; inSouth Africa and Zimbabwe (Rhodesia) white minorities continue to suppressthe majority with aid, trade, and weapons from the West. (Interestingly SouthAfrica is classified as a "developed" country by the United Nations in spite ofthe fact that most South Africans are poor.) Tribal frictions and conflictsabound in tropical Africa, and, in the words of D.F. Owen, are "doubtless aserious hindrance to economic development and political stability."?"
Tanzania* is one of the few nations in tropical Africa where anattempt is being made to mold the traditions of African society into an effectivemeans for the implementation of economic development policy. The concept ofcommunal ownership of land, which was the typical form of land tenure intraditional tribal African society, 58 has become the basis for land reform andagricultural development. President Nyerere, who symbolizes Tanzania's unity,also represents the country's determination to increase agricultural productionby spending a good portion of each year working in and visiting Uiamaa("brotherhood") villages.
These Ujamaa villages, which are larger than the small isolatedvillages more usual in Africa, were established in order that basic services such as
*Much of the discussion on Tanzania is based on conversations with Tanzanianofficials.
For non-commercial use only.

Vignettes of Third World Agriculture 37
900
800
~ 700<,
en~
"0a:;
>= 600
500
."Sorghum, Average for Africa
,.-' ".'-,
" .....-"'-'.,
Maize, Average for Tanzania
Source: Note 47.
1971197219691967Year
19651963
400o~"" """'__----L__-'----L- -'--__-----'_"""""_
1961
Figure 2-1. Annual Yield for Three Cereal Crops 1961-72.Source: Reference 5.
clean potable water, agricultural extension, medical care, education, andtransportation may be made available more easily and cheaply.
In spite of this ideological commitment and the fact that theTanzania African National Union headed by President Nyerere has succeeded inkeeping Tanzania relatively free of tribal tension (Nyerere himself comes fromthe small Zanaki tribe S9
) , Tanzania's agricultural progress has been erratic.Although per capita food production has increased in the last 10 years or so*,the only consistent increase in both per hectare yield and total production for amajor food crop has been in cassava,** a tuber practically devoid of protein. Aglance at cereal production statistics for Tanzania and many other countries intropical Africa reveals that yields vary enormously from year to year.
Figure 2-1 shows the large fluctuations in the yields of maize,millet, and sorghum, which are Africa's most important cereal crops. Theseyields have, on the average; not increased significantly in the past decade,although in some countries such as Kenya they have. Wheat and rice, which are
*It is not clear whether this observation holds for 1974 due to a drought innorthern Tanzania.
**We have used the Food and Agriculture Organization's (FAO) ProductionYearbook for most crop production and land use statistics in this section. It will not becited further in this section.
For non-commercial use only.

38 Energy and Agriculture in the Third World
the cereals next in importance in terms of acreage planted as well as productionhave shown fairly consistent improvement.
The lack of irrigation appears to be one of the principal reaons forAfrica's slow progress in agriculture. In many countries less than 10 percent ofthe cultivated land* is irrigated. In 1965, Nigeria had only 13,000 hectares ofirrigated land out of a cultivated area of about 21 million hectares. Generallyspeaking, the smallness of the irrigated area is not due to a lack of waterresources except perhaps in the Sahel region and the Kalahari desert. The ZaireRiver at its peak has several times the flow of the Mississippi River; LakeVictoria in East Africa is one of the largest bodies of fresh water in the world.There are numerous other lakes and rivers and large stores of underground water(particularly in the Zaire, Zambezi, and Niger River basins60
) which could beused to irrigate tropical Africa's farms. In hilly areas dams, tanks and gravityirrigation could provide reliable sources of water. A principal roadblock appearsto be a lack of investment in agriculture.
Since the relatively large investments required for irrigation and theassociated power facilities cannot be expected to come from farmers who live ahand-to-mouth existence, the schemes must be initiated by governmentinvestment. This is doubly true since the rich in underdeveloped countries preferto live and to invest their money in the cities.
The provision of irrigation is only one of Africa's many agriculturaldevelopment problems. Human, animal, and crop populations are regularlyravaged by disease bearing insects principal among which are the anophelesmosquito, various species of locust and grasshoppers, the tsetse fly, and manykinds of stemborers and plant suckers.** Overgrazing by cattle is another seriousproblem and contributes to the spread of deserts in many areas.?'
The danger of isolated development efforts is well illustrated by theattempts to control sleeping sickness in cattle. These partially successfulattempts have helped increase the rate of population growth among the cattlesince there have been no serious attempts at simultaneously controlling theirnumbers. Thus the serious problems of the overgrazed savannah regions arefurther aggravated. It is D.F. Owen's view that under present conditions anddevelopment programs, sleeping sickness among cattle may, in the long run, turnout to have slowed the destruction of the savannah. 62
Wood is Africa's principal fuel.t The extensive use of wood in theSahel region is probably one of the causes of the spread of the Sahara desert. Incountries like Gambia and Tanzania where wood is plentiful, current patterns ofindiscriminate wood-cutting and its inefficient use may, in the long run, cause
*This includes land that is temporarily fallow. The land actually harvested inany year may be half to two-thirds of the total cultivated area.
**This short discussion of pests and cattle in Africa is based on D.F. Owen'sbook, Man in Tropical Africa.
tStatistics on wood use in Africa are based entirely on Openshaw's research inGambia and Tanzania (see notes 6 and 7).
For non-commercial use only.

Vignettesof Third World Agriculture 39
problems similar to the ones being experienced today by the countries in theSahel region. Yet the use of wood as an energy problem has received littleattention either in national development efforts or in international assessments.
Openshaw has compiled data on wood use in Gambia and Tanzania.While the bulk of the wood is only used for cooking and home heating, it is alsoused extensively in industry as fuel and timber, for water heating, for drying fishand cassava, etc. Per capita annual wood use amounts to about I metric ton (15million Btu) in Gambia and 1.5 tons in Tanzania. Wood therefore supplies about10 times more energy than all commercial fuels* in both Gambia andTanzania.f" It is instructive to note here that in Gambia the per capita use ofenergy for cooking in rural areas is 6 to 7 million Btu per year, a figurecomparable to cooking energy use in rural India (about 5 million Btu). We shalluse this fact in Chapter Three in analyzing the energy needs of rural areas.
In agriculture, human labor is the principal source of energy. Inmany parts of Tropical Africa, the introduction of draft animals is arevolutionary agricultural innovation. Crop yields in Africa are among the lowestin the world, partly because sufficient energy is not available to plough the landwell, to weed thoroughly, or to harvest and thresh the grain. In Africa, as inother parts of the Third World, the peak labor problem is serious and probablyencourages population growth. D.F. Owen has described the cultivation of ricein Gambia:
Sickness and pregnancy are not regarded as excuses for notcultivating rice and all women who are remotely able to work areforced to do so.
The concentration of heavy agricultural work into a restrictedperiod of the year, together with seasonal changes in the availabilityof food, has a pronounced effect on the energy budget of thepeople. From March to May there is little or no work to do, thebody weights of the people remain stationary, and their intake andexpenditure of energy is low. With the onset of the rains heavy workcommences and there is an increase in energy expended, whichcontinues to increase as the rains develop and more and more heavywork becomes necessary. At this time of the year the store of foodfrom the previous harvest is almost exhausted and a seasonal low ofavailable energy is reached at the time when energy expenditure isgreatest. This deficit results in a fall in body weight as the tissues ofthe body are drawn upon. Weight is regained at the beginning of thedry season when food from the harvest becomes available.64
These facts again illustrate how wasteful subsistence agriculture is ofhuman and physical resources, and the crucial role that a proper understandingof energy flows must play in planning agricultural development.
*To be consistent in nomenclature, we do not include wood as a commercialfuel here. In practice it is one of the main sources of energy even in the cities where it is soldfor 25¢ per million Btu as wood and about $1.50/million Btu as charcoal.
For non-commercial use only.

40 Energyand Agriculture in the Third World
The consumption of commercial energy in tropical Africa averagesabout 4 million Btu per capita per year,65 but most of this energy is consumedby a small fraction of the urban population. Rural electrification programs arenot extensive and mechanical irrigation is rare. Oil is the principal form ofcommercial energy, and with the major exceptions of Nigeria, Angola, andGabon, most countries in tropical Africa must import their oil. Some, likeGambia, have not developed any indigenous source of commercial energy andmust depend entirely on imported oil.
Oil-importing African countries have been among the hardest hit bythe 1973-1974 increases in oil prices." Some of them had hoped to obtain oilon concessional terms by severing relations with Israel during and after theOctober 1973 Arab-Israeli war. So far these hopes have not been fulfilled.
Kilombero, Tanzania*The village of Kilombero on the Tanzanian plateau has 100 people
who form 20 households. This small village, typical of Eastern Africa, has 60hectares of non-irrigated land which is held in the form of a tribal trust. Thechosen or traditional head of the village allocates the land to the householdheads, and it may neither be mortgaged nor sold. The individual household headshave usufructary rights to the land which they forfeit if they leave it fallow formore than two years.
The people of Kilombero are far removed from any developmentefforts. The children under 14, who constitute half the population, contractdiseases easily. Schistosomiasis, malaria, ftlariasis, respiratory tract infections,diarrhea, and overt malnutrition (usually in the form of kwashiorkor) arecommon causes of death.P" Many of the common diseases are caused by a lackof clean domestic water supply. In this respect, and in many others, Kilomberois to be contrasted with the Ujamaa villages where the provision of sanitarywater supply has been one of the principal improvements in the lives of thepeople. So far, however, only 15 to 20 percent of the rural population lives inUjamaa villages, and life in Kilombero today is more representative of rural lifein Tanzania and elsewhere in East Africa. The regular contacts with the peoplehere have with the outside world are mostly those with the itinerant graintraders.
The population of Kilombero is growing at about 2 percent per year.This is somewhat slower than the East African population growth rate of 2.5percent because of the migration to the cities. However, the rate of migration tothe cities is smaller in Tanzania because, according to Tanzanian officials, theUjamaa program offers them substantial incentives to remain in the villages.
*The principal references used in compiling this profile of a Tanzanian villagewere The Village Economic Surveys, A Geography of Africa, and the Britannica WorldAtlas. These are numbered 68, 69, and 70 in the notes for this chapter.
For non-commercial use only.

Vignettes of Third World Agriculture 41
Possibly the deep attachment of the people to their land makes the task of theTanzanian government easier than it would be, say, in Latin America.
Geography. Kilombero is located about 900 meters above sea level.At such an altitude, a vegetation of grass-land with broad-leaved deciduousplants predominates. The surface configuration consists of a plateau and steepslopes as one approaches the coast. The summers are hot (with cool nights);the winters are cool but rarely below freezing.
Because of its location on the Tanzanian plateau, Kilombero hascertain advantages when compared with many other East African villages.Northern Tanzania, Uganda, Kenya, Somalia, and Ethiopia have been experiencing the effects of a severe drought which Kilombero has so far escaped. Also as aresult of the cooler climates, the evaporation rates are lower than those on thecoast, thereby increasing the water available to plants.
Kilombero receives from 60 to 90 centimeters of rain a year,concentrated in the summer months. There is a very high degree of rainfallvariability, and Prothero states that "It is not unusual for the highest annualtotal to be as much as four times the lowest recorded total." 71
Farming Conditions and Practices. Kilombero has no irrigationschemes. There is one well in the village which is used for domestic water. Thetwo nearby streams, which are used to water the animals, dry up in the wintermonths. In times of prolonged drought (over two years of less than 50 percentof the average precipitation), villagers have to make a six-mile trek to a river fortheir water needs.
Kilombero villagers own 25 cattle. This is 40 percent fewer than theEast African average, because the Tanzanian plateau is infested with the tsetsefly. The total livestock population of the village is shown in Table 2-10. Unlikethe Hausa in Nigeriaor the Chinese, the people of Kilombero do not make use ofthe animal wastes for fertilizing their fields. Animal droppings are not collected.
The people revere their cattle and regard them as a source of wealth.They are slaughtered only on special occasions. More frequently, they are bled,although blood is not as important a part of the diet here as it is with the Masaicattle herders.
Table 2-10. Livestock Population of Kilombero
Animals
CattlePoultry''Goats
aChickens and ducks.
Total
20300
30
No. perPerson
.23
.3
For non-commercial use only.

42 Energy and Agriculture in the Third World
The tools used by the people in Kilombero includes hoes, axes, andbush knives known as pangas. The proportionate numbers of these tools used areshown in Table 2-11.
Energy. The energy put into the fields in Kilombero is among thelowest in the world, since only human labor is used. The total annual usefulenergy in agriculture, that is, the energy output of half the population at170,000 Btu per person per year, would yield only 0.14 million Btu per hectare.In terms of the food eaten by the workers, however, the energy required is about2.5 million Btu per hectare. This works out to about 3.5 million Btu per ton ofmaize which is one of the main crops grown in Kilombero.* This is comparableto the 3 million Btu/ton for corn grown in the U.S.A. (excluding crop processingand transportationj."
There is no electricity in Kilombero, and all fuel needs are satisfiedthrough the use of firewood. Charcoal is not used. The woodfuel consumptionruns to a total for Kilombero of about 150 tons a year, or about 1.5 tons percapita per year. Table 2-12 shows a summary of energy use in Kilombero.
Agricultural Production. The primary crops of the village ofKilombero are millet, maize, cassava,and peas. Crop yields are low (Table 2-13),and most of the output of the major crops of the village is locally consumed. Ofthe food production 20 percent or more is probably lost to pests due toinadequate storage and another 20 percent or so is sold to iternerant grainmerchants in exchange for cash. On the basis of the average food productionstatistics, it appears that the caloric intake of the people of Kilombero isadequate and even the protein intake may approach adequacy in terms ofweight, but not in terms of quality and completeness. However, averageproduction statistics are misleading when we remember that the yields fluctuatewidely from year to year and that in a year of drought food production could becut in half.
Batagawara, Nigeria**Batagawara is located in the Hausa region of Northern Nigeria and
Southern Niger. This region is quite homogeneous, and conditions of one villageare representative of other villages. It is perhaps the single largest homogenousregion in tropical Africa, having existed under its present social order for manycenturies. Its homogeneity in cultural, linguistic, and religious matters also
*Since one of the reasons for having many children is to provide a source oflabor, we could justifiably include the food intake of all people to calculate the energyintensity. In that case the annual energy expended per hectare would be 7 million Btu andthe energy per ton of maize about 10 million Btu.
**The principal reference for this village profile is Polly Hill's book RuralRausa: A Villageand a Setting (note 73).
For non-commercial use only.

Vignettes of Third World Agriculture 43
Table 2-11. Tools in the Village of Kilombero
Tool
HoesAxesPangas (bushknives)
Total
601530
No. perHousehold
3.75
1.5
Table 2-12. Energy Use in Kilombero (Energy Use in Billion (109 )
Btu Except Row 13)
Energy Source
1. Animal labor2. Woodfuel3. Crop residues} di f I4. Dung irect use as ue
5. Subtotal: noncommercial
Useful Energy
0.11
0.11
EfficiencyPercentage
5
5
Gross EnergyInput
2.2
2.2
6. Coal, oil, natural gas(direct use)
7. Electricity
8. Subtotal: commercial
9. Total: 5 + 8
10. Human energy11. Chemical fertilizers
12. Total energy use: 9 + 10 + 11
13. Per capita energy useper year.
0.11 5 2.2
.008 2.5 0.3
0.12 5 2.5
1.2 25million Btu 5 million Btu
Notes:1. See Table 2-4.2. We assume that 75 percent of the useful human energy is for farm work since agricultureis unassisted by animals or machines.
Table 2-13. Annual Food Production in Kilombero
YieldCrop Area I/a. Kglha.
Maize 25 700Millet 20 700Cassava (wet) 3 6,000Peas (dry) 2 300Sunflower seeds 5 300Beans (dry) 5 500
TotalProduction Kg.
17,50014,00018,000
6001,5002,500
For non-commercial use only.

44 Energyand Agriculture in the Third World
extends to the economic realm. Agricultural activity, for instance, is much thesame throughout the Hausa region and has changed little over the years.
Batagawara, in the Emirate of Katsina, is about 20 miles south of theNiger border. The village has a total population of 1,400, of which 88 percentlive in the village proper (gari) and the remaining 12 percent in dispersed housingin the farmland.
Almost half the population consists of children under 14 years ofage. There are 170 households, and most of them have between 4 and 10members. The 170 households of the village cultivate 530 hectares of manuredland distributed among 530 plots. Land is privately held.
The subdivision of plots servesthe social function of dividingup thegood as well as the bad land among various owners. Batagawaravillagers are wellaware of the benefits of each farming unit comprising one continuous plot. Intimes of hardship when poor farmers have to sell their plots, wealthy farmersattempt to increase the size of their plot by buying or exchanging land to obtainplots adjacent to their own.
Batagawara has a rigid class-structure that is determined by the sizeand quality of the plot that the individual farmer controls. An advantage in landownership generates other advantages in ownership of and access to other goodsas exemplified by the ownership of plow-oxen and steel plows. Of the 170households, 13 own and operate the 15 metal plows in the village. Thisparticular situation exists with almost all mobile capital goods in the village.Thus, averages in production, acreage, or ownership of livestock are notrepresentative of the lot of the average person. Inequitable distribution of landand wealth probably existed under the ancient system of land tenure in whichland was regarded as the property of the community or clan (extended family).The introduction of private land ownership in colonial times, which has beencontinued in independent Nigeria, may have resulted in further inequities inincome distribution.
Nigeria is, of course, the wealthiest major oil-producing country intropical Africa, exporting most of the 2 million barrels a day it produces.?" In1974 Nigeria will earn in foreign exchange, roughly $5 billion for the export ofthis oil-or almost $100 per person per year. If Nigeriadecides to give priority toagricultural development on which 65 percent of her people are directlydependent, it would be among the few underdeveloped nations to have enoughcapital to do the job within the next decade.
Geography. Batagawara is located in a semiarid tropical region ofWest Africa. All months of the year are hot or warm, and there is lightprecipitation and rapid evaporation. It is a region of irregular plains and gentleslopes, generally less than 100 meters above sea level, where grass-land is thepredominant vegetation.
Batagawara is near the southern border of the West African Sahel
For non-commercial use only.

Vignettes of Third World Agriculture 45
region that has suffered a devastating seven-year drought. The drought has notyet hit as hard here as it has to the North in Niger, Mali, Senegal, Upper Volta,Mauritania, and Chad. In 1974 the rains were better, but there is still considerable controversy over whether a long-term change in the climate of theregion is taking place. Long-term reductions in rainfall along with a continuationof past neglect of the ecological realities of the spreading desert can only spelldisaster for the people of this region. Batagawara, which is totally dependent onrain water for the nourishment of its crops, now receives about 50 centimetersof rain a year. Precipitation is concentrated in the late spring and summermonths. There is as much as a two-month variation in the advent of the rainswhich may start as late as July or as early as May, ending sometime in Septemberor October.
Farming Conditions and Practices. Fertilization is the backbone ofHausa agriculture. It is the reason why the Hausa have been able to continue topractice semi-intensive cultivation in the same region for several centurieswithout appreciable soil deterioration. Every scrap of material which is ofmanurial value is carefully preserved for use. The villagers own 100 cattle. Inaddition, every year the Fulani herdsmen of the surrounding region bring inabout 400-500 cattle to graze in fallow Batagawara lands, for this they are paid afee because the droppings of the cattle are left in the land where they graze. Theherdsmen stay with their cattle in Batagawara for about seven months of theyear. Chemical fertilizers, which were introduced here in the sixties, do not yetplaya significant role in Hausa agriculture. Nigeria imports all the chemicalfertilizers it uses, and their use has risen rapidly. But the use of chemicalnitrogen fertilizers, for example, still averages less than one kilogram per hectareof cultivated land.75
Batagawara has no irrigation system. The wells in the village are usedsolely for domestic water supply. There is a total of six wells and four ponds inthe village proper and the surrounding farmland. The water table is less than 20meters from the ground surface.
Batagawara has no mechanically powered equipment. Field equipment consists of hand tools and equipment for the use of animal power.Livestock statistics for Batagawara are shown in Table 2-14.
There are about 0.35 hectares of manured farm-land per person.There is plenty of bushland surrounding the village that could be cleared forcultivation, but it would be unproductive without manure or chemical fertilizers.Most farmers therefore concentrate their efforts on the manured plots. However,some rice is cultivated in the marshland near the village. The production of riceis largely the work and responsibility of the women.
Energy. Most agricultural work is manual. As noted, the 36 ploughoxen are owned by a few families, and the labor of these cattle is generally not
For non-commercial use only.

46 Energy and Agriculture in the Third World
available to most households. Energy flows on the farm are therefore similar tothose we have already described for Kilombero, Tanzania.
Most of the fuel needs are satisfied through the use of fuel wood.Fuelwood consumption is about one metric ton per capita (15 million Btu). Thisis somewhat lower than Tanzanian fuel wood use and is probably due to thewarmer climate. The wealthier people here have kerosene lamps and some havekerosene cooking stoves. Kerosene, like other urban goods, is purchased with the
Table 2-14. Livestock in Batagawara, Nigeria
Average No. Total forAnimals per Household Village
Cattle 0.6 100Plough oxena 0.2 362
Pigs 0.3 50Sheep 2.3 400Goats 3.0 500
aOnly the wealthiest of farmers own plough oxen, and most of the 36plough oxen are owned by five or six households.
Table 2-15. Energy Use in Batagawara, Nigeria (Energy Use in109 Btu per Year Except Row 13)
Efficiency Gross EnergyEnergy Source Useful Energy Percentage Input
1. Animal labor 0.05 5 12. Woodfuel 1.05 5 213. Crop reSidUeS} .4. Dung direct use as fuel
5. Subtotal: noncommercial 1.1 5 22
6. Kerosene (primarily cookingand some lighting) 0.01 20 0.05
7. Electricity
8. Subtotal: commercial 0.01 20 0.05
9. Total: 5 + 8 1.1 5 22
10. Human energy 0.1 2.5 411. Chemical fertilizers 0.1 0~1
12. Total energy use: 9 + 10 + 11 1.3 5 26.1
13. Per capita energy use per year 0.9 5 18.5million Btu million Btu
Notes:1. We assume that the per capita use of wood in Batagawara is 15 million Btu per year, i.e.,the same as that in the Gambia in Western Africa.2. We assume that 75 percent of the human energy (useful) is for farm work since most farmwork is unassisted by animals or mechanically powered equipment.
For non-commercial use only.

Vignettes of Third World Agriculture 47
Table 2-16. Agricultural Production in Batagawara
AnnualAnnual Annual per capitaYield Production Production
Crop Hectares kglha m.t. kg.
Millet 200 600 120 85Maize 200 1,000 200 140Groundnuts
in shell 120 700 84 60Vegetables
and fruits 10 variable small smallRice 10 "'1,000? 1O? 7?
proceeds ortained from the sale of groundnuts. A summary of energy use inBatagawara is shown in Table 2-15.
Agricultural Production. The main crops of Batagawara village aremillet, maize, and groundnuts. There is some production of rice, fruits, andassorted vegetables, but the bulk of the farmland is dedicated to the first three.The yields of groundnuts have declined substantially since the early sixties. Withthe exception of groundnuts, most of the produce is internally consumed.Production statistics are shown in Table 2-16.
Because of the groundnuts consumed here, the diet of the people, ingood years, is probably of a higher quality than that available to the people ofKilombero, Tanzania.
LATIN AMERICA
Agriculture is the main source of livelihood for 40 to 50 percent of LatinAmerica's population of 300 million.?" The population of Latin America isgrowing at about 3 percent per year, more rapidly than any other major regionof the world. The cities bear the brunt of this population growth, and ruralmigration has caused the creation of widespread shanty towns, or villas miserias,as they are often called. Approximately 5 million families live in these villasmiserias: and this portion of the population is growing at about 15 percent peryear.
In spite of this migration to the cities, the rural population has beengrowing at 1.5 percent per year. This population growth rate would not by itselfcause serious land problems since the cultivated area is about 0.6 hectares percapita (of rural population) and the potential for its expansion is large in manyareas."? It is the inequitable distribution of land holdings and capital that ismainly responsible for rural poverty. A recent study'" revealed that in sevenLatin American countries 21 percent of the farm units controlled 56.4 percentof the cultivated land, while 60.3 percent of the farm units contained only 6.6
For non-commercial use only.

48 Energyand Agriculture in the Third World
percent of the area. The private large farms (latifundia) have been dismantled inCuba and to some extent in Bolivia, Mexico, Peru, and Chile, but they are stillcommon in most Latin American countries. Without land reform and "redirection of capital toward the smaller farmer, we 'cannot expect muchalleviation of the poverty, particularly in Latin America where the small farmstminifundia) are scattered over the countryside amidst the latifundia. Thispattern of land settlement puts a premium on land reform and politicalreorganization, because without them capital investments on the farms, roads,communications, irrigation, or rural electrification will be more expensive andless productive, even if the additional capital were to become available to thesmall farmer. This is perhaps most valid in many Latin American countrieswhere, on the one hand, owners of the latifundia who live in the cities arereluctant to invest in the countryside, and on the other hand, the small farms arescattered all over the countryside making improvements such as roads or electrification more expensive than they would be in larger settlements.
It is important to note that land distribution influences thedifferences in land productivity within a region. The differences between regionsand countries, as we shall see, are much more dependent on whetherdevelopment policies favor the provision of inputs such as irrigation, fuel, andfertilizers to the countryside. In other words, if the capital is not directedtowards agricultural development and if it is not spent in a manner that isconsonant with the potential of the region, agricultural development will be slowand the majority of the rural population will remain poor.
Farming conditions in Latin America are perhaps more varied thanelsewhere in the Third World. Wehave dramatized these differences by studyinga village (ejido) in Mexico that has irrigation, fertilizers, commercial fuels, andhigh-yielding seeds available, and a minifundio in Bolivia where the people are aspoor as most small farmers in South Asia and Africa.
However, the differences in rural income in Northern Mexico on theone hand, and Southern Mexico and Bolivia on the other, cannot be due solelyto inequitable land distribution because substantial land reforms have takenplace in these areas. In fact, the land holdings are considerably moreconcentrated in Northern Mexico where the larger landowners have graduallybought out the small farmers, a trend which has accelerated since theintroduction of the high yielding grain varieties.?" The differences between theseregions can be directly attributed to government policies toward agriculturaldevelopment. In Northern Mexico, continual efforts at irrigation, provision offertilizers, high yielding seeds, and so on, have made a naturally arid soilproductive. South of Mexico City and in Bolivia where the rainfall is moreabundant, the soil richer and the land holdings better distributed, the people aremuch poorer. Most farms do not have irrigation or electricity or farm machinery.
Information on the use of noncommercial energy sources in LatinAmerica is scarce. We know of no surveys that have been conducted. However, it
For non-commercial use only.

Vignettes of Third World Agriculture 49
appears that wood and other vegetable matter are the main fuels for most ofLatin America's rural population. In the Andes, wide use is made of the scrubplants that grow above the treeline. Where the climate is cold (Andean region, theregions of high altitude in Central America, and South of 200S latitudegenerally) we can infer from the Tanzanian data that the use of wood (or plants)is likely to be considerably more than one metric ton per capita. We will assumethat in these regions, the use of wood and shrubs for cooking and heating isabout 25 million Btu per year per person.
The use of commercial energy is 22 million Btu per capita in LatinAmerican compared to 6 million Btu/capita in South Asia and 4 millionBtu/capita in Africa.so But the average numbers are misleading because adisproportionately large amount of commercial energy is used by the relativelywell-to-do. Electricity use, for example, is about 650 kwhe/yr/capita in LatinAmerica, yet only about 2 percent of the total electricity generated is consumedin the rural areas where 40 to 50 percent. of the people live." Thus theavailability of electricity to the farmer and his use of it in Latin America is aboutthe same as in India, where 10 percent of the electricity is used in thecountryside, but the total per capita generation is only one-sixth that of LatinAmerica. This is yet another symptom of the maldistribution of income that isendemic in much of the Third World, and which is particularly egregious inmany parts of Latin America such as Brazil (Chapter One).
Arango, MexicoNorthern Mexico, where Arango is located, is the birthplace of the
Green Revolution for tropical countries. Arango was established in 1934 as acollective eiido (village), but the land is now held or leased by individualejidatarios (heads of household). The ejidos as collectives withered away in theforties and fifties due to antipathy on the part of the central government,mismanagement, lack of effective extension services, the peasant's desire to havehis own piece of land, and the preferential lending policies of the Ejido Bank toindividual ejidatarios. 82
The 80 eiidatarios of Arango (420 people) have 380 hectares ofirrigated land, and the average holding is 4.8 hectares. The smallest farm is 4hectares and the largest is 7 hectares-a spread which is remarkably smallcompared to other parts of Latin America and the Third World in general.Arango also has 700 hectares of unirrigated land.
Arango is a rich community by the standards of most of the ruralpopulation of the Third World. We analyze it here to illustrate the dramaticdifferences that high-yielding seeds (particularly wheat), irrigation water,fertilizers, and fuel have made to the lives of millions of farmers in Mexico andelsewhere, in spite of the maldistribution of the resultant wealth and many otherindividual and institutional inequities that, in Mexico, persist 20 years after theinitiation of the Green Revolution.
For non-commercial use only.

50 Energy and Agriculture in the Third World
The conditions on the minifundio (small farm), which is perhapsmore representative of the lot of the Latin American peasant, are considerablymore unpleasant (next case study).
Geography. The Laguna region has an arid subtropical climate withhot summers and relatively cool winters. The annual rainfall is only about 30centimeters. Unirrigated land produces a meager harvest due to the scantyrainfall and is therefore not cultivated, particularly as surpluses of wheat areproduced by the use of high-yieldingvarieties on the irrigated land.
The soil of Arango is typical of over 50 percent of Mexico: "deserticsoil, of arid climate, which includes many areas of shallow stony soil. There issparce cover of shrubs and grass, some suitable for grazing; it is fertile ifirrigated; dry farming is possible in some areas.,,83
Farming Conditions and Practices. Most of Arango's cultivated landis irrigated by an intricate system of canals fed by the Nazas river, which neverruns dry; 30 percent is irrigated from the six wells in the ejido, and theremaining 10 percent from the Aguanaval River which is dry in December andJanuary. Irrigation has freed the ejidatarios from the vagaries of the highlyvariable and scant rainfall in the region and enabled them to use high-yieldingseed varities and fertilizers in a farming cycle that is largely under humancontrol. However, the level of the water table in the region is dropping, andthere is the danger that it may be of little use in the foreseeable future.P"Wilkie classifies much of the Arango's underground water supply as unusable forImgation'" but does not cite precise information on this score so that we cannotjudge whether future expansion of the irrigation water supply is possible withimproved technical inputs.
Farm machinery is widely employed, as are fertilizers and pesticides.Draft animals (Table 2-17) mingle with machines in providing labor for farms,but most of the 400 horsepower for the farms comes from machines. In additionthere are mechanical irrigation pumps with a total of about 100 horsepower. We
Table 2-17. Livestock Population in Arango
Livestock
Mules, burros, horsesOxenDairy cattleHogsPoultry
Total inejido
80302020
350
Note: The cattle in Arango are primarily draft animals, and their number isconsiderably lower than a national average would indicate because most cattlein Mexico are beef and milk cattle.
For non-commercial use only.

Vignettes of Third World Agriculture 51
have- found no evidence to indicate that animal dung is used either for itsfertilizer or fuel potential.
Energy. As with fertilizers and irrigation water, so with fuels: thepeople of Arango use substantially more commercial energy than theircounterparts in most Third World villages. Each home has a kerosene lamp, halfhave (potable) running water, one-fifth have electricity, and one-third have gasstoves. Many families spend $50 or more a year on gas, kerosene, and electricity.Two-thirds of the people still heat their houses and cook by burning agriculturalwastes such as cotton stubble. The fires are usually lighted in the doorway. Twoor three decades ago it was common for Indian farm laborers to collect wood inthe forests during the off-season (winter) and bring it on mule-back to the ejido,but we could not determine whether this is still common practice in the Lagunaregion.
The largest indirect energy input imported into the ejido comes inthe form of chemical fertilizer. One hundred twenty kg/ha. are commonly usedfor the high-yielding wheat varieties which are in almost universal use in thisregion.
Table 2-18 shows a summary of energy use in Arango. Wenote thatwhile the consumption of commercial and noncommercial energy in Arango issimilar, the commercial energy provides 80 percent of the useful energy.
Agricultural Production. The principal crops of the eiido are corn,cotton, beans, and winter wheat (Table 2-19). Other crops are grown in smallquantities. In the summer growing season (June through September), half theacreage is devoted to cotton, 30 percent to corn, 8 percent to beans, and 12percent to miscellaneous other crops. In the winter (November through April),about 50 percent of the land is planted with winter wheat, and the remaining 50percent is apparently left fallow. It is not clear whether this is done because ofthe lack of sufficient water during those months to irrigate more than 50 percentof the land or because farmers want to give part of the land a rest.
Most of the agricultural production is exported to the cities eitherthrough private traders or the Ejido Bank. It is this considerable surplusproduction that is responsible for the relative prosperity of farmers in theLaguna region of Northern Mexico. In fact, most of the food for Mexican citiesand towns in provided by surpluses of relatively few farmers who, by and large,live in Northern Mexico.
Quebrada, BoliviaUnlike all our previous prototypical villages, where we dealt with
communities, this example is about an isolated household, or minifundio, notphysically part of a community. In Bolivia, minifundios resulted from the fragmentation of land that followed the Agrarian Reform of 1952. Minifundios alsodeveloped as a result of the acquisition of land by large landowners that pushed
For non-commercial use only.

52 Energyand Agriculture in the Third World
Table 2-18. Energy Use in Arango, Mexico (Energy Use in109 Btu per Year Except Row 13)
Efficiency Gross EnergyEnergy Source Useful Energy Percentage Input
1. Animal labor 0.15 5 32. Woodfuel and crop residues" 0.3 5 6
3. Subtotal: noncommercial 0.45 5 9
4. Oil for farm machinesb 0.6 20 35. Kerosene for lighting'' small small (E;;l) 0.36. Electricity for irrigation 1.6 20 87. Household electricityd 0.03 20 0.158. Household gas (primarily
for heatingjv 0.35 50 0.7
9. Subtotal: commercial 2.6 22 12.15
10. Human energ/ 0.05 3 1.511. Chemical fertilizer~ 3.3 3.3
12. Total: 3 + 9 + 10 + 11 6.4 25 25.95
13. Per capita energy use per year 15.2 25 62million Btu million Btu
Note: At $1/million Btu for gas and 2¢/kwhe for electricity, a household having bothwould spend about $75 per year on gas and electricity.aWeassume that two-thirds of the people who cook and heat their homes with wood cropresidues use about 20 million Btu/capita/yr.bThe total land involved is about 550 ha. (including double cropping), of which roughly100 ha. is worked by draft animals.c3 million Btu/household per year, assuming one lamp operating five hours/day.dFor the households that have electricity (20 percent) we use an average of 500 kwhe/hrfor domestic electricity use (assuming that 20 percent of the electricity use in Mexico is fordomestic purposes).eWeassume that the households that have gas use it both for heating and cooking. Weassume average gas use is 5 million Btu/capita per year, of which cooking uses 20 percent.At a heating efficiency of 50 percent the useful heat would thus be about 10 millionBtu/yr/household compared to less than half that for homes heated with wood.fAt 10,000 Btu (2,500 kcal) per person per day.gOne hundred twenty kg/ha of nitrogen for wheat; 50 kg/ha for corn and cotton yields atotal nitrogen fertilizer use of about 40 metric tons. Phosphorous and potassium togetheralso amount to about 40 tons.See also notes to Tables 2-4 and 2-8.
Table 2-19. Output of Major Crops in Arango
AnnualYield Production
Crop kg/ha. Area: ha. Metric Tons
Cotton 500 190 95Beans (dry) 600 30 18Winter wheat 3,000 220 660Maize 2,500 110 275
For non-commercial use only.

Vignettes of Third World Agriculture 53
many peasants to progressively smaller holdings-a situation compounded bypopulation growth and the resultant subdivision.
The Quebrada (canyon) region lies between the High PIateau of theAndes and the flatlands of llanos. The Quebradas are populated by peasants ofindigenous American stock, and the region is over 90 percent rural. Few urbancenters exist, and those that do exist are primarily market towns.
Although the range of minifundio sizes is large, 1 hectare ofcultivated land is representative, and we use this for our analysis. The parcela(the household and the land attached to it) we study has six people.
Geography. Quebrada lies between the altitudes of 1,000 and 2,500meters in a mountaneous region of sharp relief. It has a mild temperate climateand an annual precipitation of 85 to 110 centimeters which is concentrated inthe summer (December-February). The rivers and streams become torrentsduring the rainy season and generally have some flow throughout the year.
Farming Conditions and Practices. The many streams and rivers ofthe region are exploited for irrigation. Gravity irrigation, with dikes divertingwater into canals and irrigation ditches, is one of the principal methods, so thatthe energy for water irrigation is largely provided for by nature. Dikes have to berebuilt frequently, particularly after heavy rains.86 However, irrigation is notwidespread in Bolivia. In 1950, the latest year for which we have data, only 5percent of the cultivated land was irrigated.'?
Chemical fertilizers are not common. We could not determinewhether animal dung is collected either for fuel or fertilizer.
livestock are precious, not only as an investment but as a source offood, lard, tallow, wool, hides, feathers (Table 2-20). Some peasants growalfalfa, but the livestock feeds mostly on the scattered and poor quality grass ofthe region which grows scarcer with increasing altitude.
Farms are not mechanized. Farm implements are limited to shovels,picks, hoes, and plows, which are usually wooden and made in the small townsof the region.
Energy. Unlike Arango, farm animals are the main source of farmlabor in Quebrada. In this sense, as well as in the subsistence nature of theminifundio economy, the life of the people here is much like that of peasants inSouth Asia. The farm animals provide not only the field work but also the
Table 2-20. Livestock on a Parcela
Dairy cattleDraft animals (horses, mules, donkeys)SheepPigsRabbitsPoultry
I33257
For non-commercial use only.

54 Energy and Agriculture in the Third World
transportation. Since Quebrada is a mountainous region and since the minifundios are usually quite far from the market towns, we would guess that asubstantial portion of the energy output of the draft animals is devoted totransportation.
Wood is the primary source of heat, and in the higher altitudes tolais used, a sturdy bush that has low moisture content. Fires are harder to startand to keep going at higher altitudes; cooking also requires greater use of fuel,since foodstuffs must be cooked longer. The use of firewood is probably overtwo tons per year per capita since the winters are cold. (In nineteenth centuryUnited States, when firewood was the main source of fuel, the yearly use offirewood per person was about three tons, most of which was probably used fordomestic heating and cooking)."
Peasants fight the cold weather mostly by using heavy woolensweaters made of the warm alpaca and llama wool. A summary of energy use ona parcela is shown in Table 2-21.
Agricultural Production. Maize, potatoes, wheat, and barley are themain crops accounting for 75 percent of the cultivated land; the remaining 25percent is divided between manioc (cassava), vegetables, and fruit trees. Some of
Table 2-21. Energy Use on a Parcela in Quebrada, Bolivia
Efficiency Gross EnergyUseful Energy Percentage Input
3 5 6010 5 200
13 5 260
Energy Source
1. Animal labor (includingtransportation)a,b
2. Woodfuel3. Crop residues} direct use as fuel}4. Dung
5. Subtotal: noncommercial
6. Coal, oil, natural gas (direct use)7. Electricity
8. Subtotal: commercial
9. Total: 5 + 8
10. Human energy11. Chemical fertilizers
12. Total energy use: 9 + 10 + 11
13. Per capita energy use
13
0.5
13.5
2.3
5
2.5
5
5
260
20
280
47
Notes: See Table 2-4.aWe assume that 50 percent of the animal labor (useful) and 50 percent of the humanlabor (useful) is for farm activities.bSince mules and donkeys are somewhat smaller animals than horses and draft cattle,we assume an annual energy intake of 20 million Btu/mule or donkey.
For non-commercial use only.
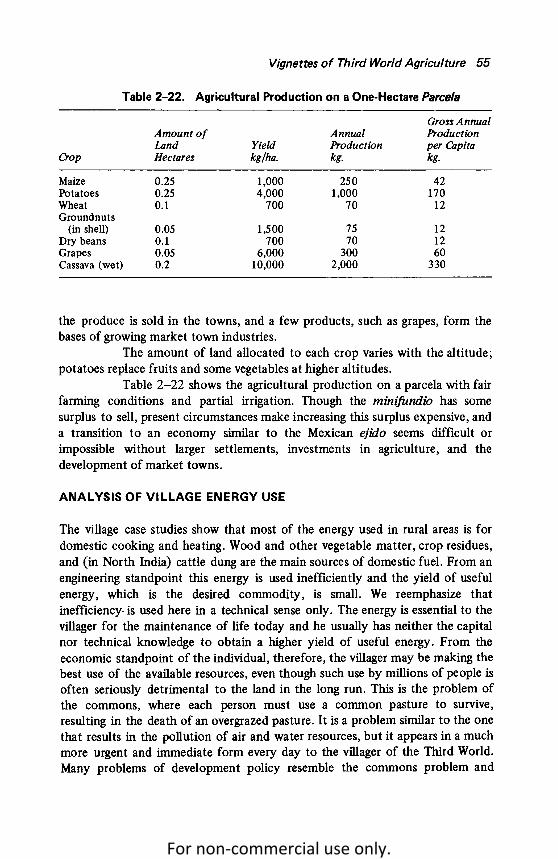
Vignettes of Third World Agriculture 55
Table 2-22. Agricultural Production on a One-Hectare Parcela
Gross AnnualAmount of Annual ProductionLand Yield Production per Capita
Crop Hectares kglha. kg. kg.
Maize 0.25 1,000 250 42Potatoes 0.25 4,000 1,000 170Wheat 0.1 700 70 12Groundnuts
(in shell) 0.05 1,500 75 12Dry beans 0.1 700 70 12Grapes 0.05 6,000 300 60Cassava (wet) 0.2 10,000 2,000 330
the produce is sold in the towns, and a few products, such as grapes, form thebases of growing market town industries.
The amount of land allocated to each crop varies with the altitude;potatoes replace fruits and some vegetablesat higher altitudes.
Table 2-22 shows the agricultural production on a parcela with fairfarming conditions and partial irrigation. Though the minifundio has somesurplus to sell, present circumstances make increasing this surplus expensive, anda transition to an economy similar to the Mexican ejido seems difficult orimpossible without larger settlements, investments in agriculture, and thedevelopment of market towns.
ANALYSIS OF VI LLAGE ENERGY USE
The village case studies show that most of the energy used in rural areas is fordomestic cooking and heating. Wood and other vegetable matter, crop residues,and (in North India) cattle dung are the main sources of domestic fuel. From anengineering standpoint this energy is used inefficiently and the yield of usefulenergy, which is the desired commodity, is small. We reemphasize thatinefficiency- is used here in a technical sense only. The energy is essential to thevillager for the maintenance of life today and he usually has neither the capitalnor technical knowledge to obtain a higher yield of useful energy. From theeconomic standpoint of the individual, therefore, the villagermay be making thebest use of the available resources, even though such use by millions of people isoften seriously detrimental to the land in the long run. This is the problem ofthe commons, where each person must use a common pasture to survive,resulting in the death of an overgrazed pasture. It is a problem similar to the onethat results in the pollution of air and water resources, but it appears in a muchmore urgent and immediate form every day to the villager of the Third World.Many problems of development policy resemble the commons problem and
For non-commercial use only.

56 Energy and Agriculture in the Third World
reflect the universal necessity of people in poverty to attend to today'sproblems, for their very existence would be in jeopardy if they did not.
For the two countries for which the data are available (India andGambia), the use of noncommercial energy for cooking is quite similar-5 to 7million Btu per capita per year. It would appear, therefore, that the mainvariations in noncommercial energy use arise from differences in climate, morefuel being required for heating in colder climates. In areas where fuel is inshort supply, fuel use for heating is low even though the climate may be quitecold. Per capita energy use variations linked with variations in climate are notdirectly related to the productivity of the land. In fact, other things being equal,warmer climates have the potential of producing considerably more thoroughmultiple cropping.
Next to climate, the most important factor in rural energy use is theenergy used in agriculture. This depends as much on the amount of landcultivated as on the technology of cultivation. The lowest energy input perhectare is associated with agriculture unassisted by animal labor or farmmachines. The use of animals to supplement human labor, of course, increasesenergy use per unit of land, but tractors, when used as a substitute for animallabor, decrease the energy requirements. *
Tables 2-23, 2-24, and 2-25 compare the energy use in theproduction of rice, wheat, and maize in the six prototypical villages.
In order to eliminate some sources of error, we compare productiononly if a significant portion of the land and labor is devoted to that crop. Cropprocessing (threshing, drying, etc.) and transportation energy requirements arenot included because we wish to examine the effect of energy input to farms onland productivity. These tables, which are based on the data presented earlier inthis chapter, show the gross energy inputs per hectare for farm work, irrigation,and fertilizers (organic and chemical), the gross energy input per ton of produce,and the useful energy per ton and per hectare ofland.**
Tropical Africa has the smallest input of energy (both gross anduseful) into farm work. The gross energy requirements increase with the use ofdraft animals and decrease where tractors are used in place of draft animals. Theuseful energy input to farm work does not vary much between the places whereanimals and tractors are used. This is probably more dependent on soilconditions and topography, as long as there is some source of energy tosupplement human labor.
The differences in land productivity appear to be largely connectedwith the mix of energy inputs to the farm and the efficiency of the use of the
*This does not make any statement about the energy source used to run thetractor. Crop residues can be substituted for petroleum and the effect on energyrequirements will be similar.
**Note that for fertilizers and irrigation we have used the energy accountingprocedure discussed in Appendix A and summarized in the notes to Table 2-23. Inparticular see note 4, Table 2-23.
For non-commercial use only.

Table 2-23. Comparative Analysis of Energy Use in Rice Production
Grossper GrossEnergy Input to Farms 106 Btulha GrossEnergy Total Useful EnergyCapita Input Input to FarmsEnergy Use Yield Farm to Farms
Place ]06 Btu/yr. kglha Work Irrigation Fertilizer Total 106 Btu/ton 106 Btu/ton ]06 Btulha
Mangaon,India 14.7 850 21.2 0.5 21.7 25.6 1.7 1.4
(including irrigation)Peipan,
China 31.5 3,000 17.5 15 8 40.5 13.5 4 12.1
Notes:1. This table is derived from the data shown on the village case studies. As noted in the beginning of Chapter Two, the data are indicative ratherthan definitive.2. The energy use on farms has been allocated equally among the various crops. Since we are considering only the crops to which major fractionsof the cultivated land are devoted, this approximation should not result in major errors.3. We have assumed that the energy input for mechanized irrigation is 15 million Btu/crop/ha, The corresponding useful energy is 3 million Btu.4. The energy requirements for nitrogen fertilizers are 75 million Btu/ton of nitrogen. We have added 10 percent to this to take into account(approximately) the energy requirements for phosphorous and potassium. In order that organicand chemical fertilizers be shown on an equivalentbasis, we have used the same numbers per unit of fertilizers whether they have chemical or organicsources. This is a major difference betweenTables 2-23, 2-24, 2-25, and 2-26 on the one hand, and Tables 2-4,2-8,2-12,2-15,2-18, and 2-22 on the other. In the latter tables wehave shown the energy required to manufacture chRmical fertilizers, but organic fertilizers do not appear in the calculations.5. Any irrigation that is powered by human and animal labor is included in the category "farm work."
~~.;:)C1l....CitfII
c......:;i::;.Cl
~~Q.::b~0'~e~
~
For non-commercial use only.

Table 2-24. Comparative Analysis of Energy Use in Wheat Production
Gross per Gros~nergy Input to Farms 106 Btufha Gross Energy Total Useful EnergyCapita Input to Input to FarmsEnergy Use Yield Farm Farms
Place 106 Btu/yr. kglha Work Irrigation Fertilizer Total 106 Btu/ton 10 6 Btu/ton 10 6 Btu/ha
Mangaon,India 14.7 850 21.2 0.5 21.7 25.6 1.7 1.4
Peipan,China 31.5 1,000 17.5 5 2 24.5 24.5 4.1 4.1
Arango,Mexico 62 3,000 10.2 15 10 35.2 11.7 3.8 14.3
Quebrada,Bolivia 47 700 35 35 50 2.5 1.8
Notes:1. This table is derived from the data shown on the village case studies. As noted in the beginning of Chapter Two, the data are indicative ratherthan definitive.2. The energy use on farms has been allocated equally among the various crops. Since we are considering only the crops to which major fractionsof the cultivated land are devoted, this approximation should not result in major errors.3. We have assumed that the energy input for mechanized irrigation is 15 million Btu/crop/ha, The corresponding useful energy is 3 million Btu.4. The energy requirements for nitrogen fertilizers are 75 million Btu/ton of nitrogen. We have added 10 percent to this to take into account(approximately) the energy requirements for phosphorous and potassium. In order that organic and chemical fertilizers be shown on an equivalentbasis, we have used the same numbers per unit offertilizers whether they have chemical or organic sources. This is a major difference betweenTables 2-23,2-24,2-25, and 2-26 on the one hand, and Tables 2-4,2-8,2-12,2-15, 2-18, and 2-22 on the other. In the latter tables we haveshown the energy required to manufacture chemical fertilizers, but organic fertilizers do not appear in the calculations.5. Any irrigation that is powered by human and animal labor is included in the category "farm work."
~
~C\lca-e~:b~
[§C\l
5·S.C\l
::ita:~&
For non-commercial use only.

Table 2-25. Comparative Analysis of Energy Use in Maize Production
Gross per Gross Energy Input to Farms 106 Btu/ha Gross Energy Total Useful EnergyCapita Input to Input to FarmsEnergy Use Yield Farm Farms
Place 106 Btu/yr. kgfha Work Irrigation Fertilizer Total 10 6 Btu/ton 106 Btu/ton 10 6 Btulha
Mangaon,India 14.7 1,100 21.2 0.5 21.7 19.9 1.3 1.4
Peipan,China 31.5 2,500 17.5 10 4 31.5 12.6 2.4 6.1
Kilombero,Tanzania 25 700 3.8 0 3.8 5.5 0.14 0.1
Batagawara,Nigeria 18.5 1,000 4.7 0 4.5 9.2 9.2 4.7 4.7
Arango,Mexico 62 2,500 10.2 15 4.5 29.7 11.9 3.5 8.8
Quebrada,Bolivia 47 1,000 35 35 35 1.8 1.8
Notes:1. This table is derived from the data shown on the village case studies. As noted in the beginning of Chapter Two, the data are indicative ratherthan definitive.2. The energy use on farms has been allocated equally among the various crops. Since we are considering only the crops to which major fractionsof the cultivated land are devoted, this approximation should not result in major errors.3. Wehave assumed that the energy input for mechanized irrigation is 15 million Btu/crop/ha. The corresponding useful energy is 3 million Btu.4. The energy requirements for nitrogen fertilizers are 75 million Btu/ton of nitrogen. We have added 10 percent to this to take into account(approximately) the energy requirements for phosphorous and potassium. In order that organic and chemical fertilizers be shown on an equivalentbasis, we have used the same numbers per unit of fertilizers whether they have chemical or organic sources. This is a major difference betweenTables 2-23,2-24,2-25, and 2-26 on the one hand, and Tables 2-4,2-8,2-12,2-15,2-18, and 2-22 on the other. In the latter tables we haveshown the energy required to manufacture chemical fertilizers, but organic fertilizers do not appear in the calculations.5. Any irrigation that is powered by human and animal labor is included in the category "farm work."
"cQ.~
i~
::ita~~h~o's,t!~
~
For non-commercial use only.

60 Energv and Agriculture in the Third World
energy input. As anticipated, irrigation and fertilizers increase energy inputs (wehave also counted organic fertilizer in energy equivalent terms), but the totalenergy requirements per ton of grain are lower-that is, the energy intensitydecreases (Figure 2-2). Rather, land productivity appears to be related to usefulenergy inputs to the land (Figure 2-3). This, of course, is not to say thatindiscriminate increases in fertilizers will decrease the energy intensity orincrease the yields. but within the range shown and the limitations of the data,this seems a sound conclusion.
We have not explicitly included the effect of seed varieties in thesecalculations. To some extent differences in seed varieties are implicit, since it isthe high-yielding varieties that usually respond well to applications of fertilizersand irrigation. But the seeds must suit local conditions and unless they are available or local varieties are significantly responsive to higher inputs of fertilizer,the useful energy inputs may be high, but the yields will not be correspondinglyhigher. High-yielding seed varieties are, in effect, a way in which plant genetics isused to trap solar energy more efficiently. Thus, in China where suitable varietiesof wheat are not yet in widespread use,89 wheat yields are relatively low,90 de
spite the irrigation and fertilizers. This is in contrast to Chinese rice and maizeproduction or to wheat production in Northern Mexico.
The proper understanding and use of energy is only one essentialaspect of a productive agriculture. Of course, proper management, capital.suitable seed varieties, pest control. etc., also make essential contributions to a
Kilombero, Batagawara, Arango, Quebrada,Tanzania Nigeria Mexico Bolivia
50
DRice
II Wheat
[ill Maize
Peipan,China
35
c 30.g.::lco 25
(J:)0
Q.
e 20u8
6. 15c
>~ 10Q)
cwV>
§5<..?
0Mangaon,India
Figure 2-2. Energy Intensity of Farming in the Case Study Villages
For non-commercial use only.

3000
Vignettes of Third World Agriculture 61
P. • A
erpan Arango
2500
2000
CllJ:........Cl
~ 1500"0Qj
>=
500
Peipan, Chinao
Mangaon, India
~~ Peipan a OB,tagaw,,.. Niqeria
eA >QUebrada, BoliviaM
Kilombero, Tanzania
0Arango, Mexico
• RiceA Wheato Maize
O~__~ ....L. ...L- ..L.-__~ --L ..L
o 2 4 6 8 10 12 14Useful Energy 106 Btu/Ha
Figure2-3. Yield and Useful Energy for Three Grains: CaseStudy Results
more efficient harnessing of solar energy in the form of food. The potential forso doing is great, for in the tropical countries where more than 300 frost-freedays are the rule rather than the exception, many crops a year should bepossible. Indeed, in some places such as Southern China, Taiwan, NorthernMexico, and Punjab, much of this potential is already being realized. Insubsequent chapters we shall analyze energy needs for agricultural development,the sources of energy supply, and the implications for development policy.
Notes to Chapter Two
I. Stewart Odend'hal, "Energetics of Indian Cattle in Their Environment,"Human Ecology I (1972).
2. Herman Southworth (ed.), Farm Mechanization in East Asia (New York:Agricultural Development Council, 1972).
3. F. B. Morrisson, Feeds and Feeding (Ithaca, N.Y.: Morrisson PublishingCo., 1947).
For non-commercial use only.

62 Energy and Agriculture in the Third World
4. David Pimentel et al., "Food Production and the Energy Crisis," Science (2November 1973).
5. Production Yearbook 1972, Vol. 26 (Rome: Food and Agriculture Organization of the United Nations, 1973).
6. Keith Openshaw, "The Gambia: A Wood Consumption Survey and TimberTrend Study 1973-2000," Unpublished report to the ODA/LRDGambia Land Resources Development Project, Midlothian, GreatBritain, 1973.
7. Keith Openshaw, "Projections of Wood Use in Tanzania," Unpublishedreport to the Public Works Department, Tanzania, Midlothian, GreatBritain, 1973.
8. Keith Openshaw, "Projections of Wood Use in Thailand," Unpublishedreport to the Public Works Department, Thailand, Midlothian, GreatBritain, 1973.
9. Report of the Energy Survey of India Committee (New Delhi: Governmentof India, 1965).
10. World Energy Supplies 1960-1970, Statistical Papers, Series J, No. 15(New York: United Nations, 1971).
11. Ibid.12. Lester Brown, By Bread Alone (Washington, D.C.: Overseas Development
Council, 1974).13. India 1971-72 (New Delhi: Government of India, 1972).14. Mohindar S. Mudahar, "Dynamic Analysis of Agricultural Revolution in
Punjab, India," Cornell University, Ithaca, New York, July 1974.15. Ibid.16. India 1971-72.17. K. L. Rao, "Irrigation" (New Delhi: Government of India, 1972).18. Ranjit Gupta, The Musahri Plan (Patna, India: Association of Voluntary
Agencies for Rural Development, 1972).19. India 1971-72.20. Economic Situation and Prospects for India- Vol. II: The Energy Sector
(Washington, D.C.: International Bank for Reconstruction andDevelopment, 1974).
21. S. Swayambu, "Power Development," (New Delhi: Government of India,1972).
22. Planning Commission, Report on Evaluation of the Rural ElectrificationProgramme (New Delhi: Government of India, 1965).
23. Report of the Energy Survey.24. World Energy Supplies 1960-1970.25. Gilbert Etienne, Studies in Indian Agriculture (Berkeley: University of Cali-
fornia Press, 1968).26. Gupta, The Musahri Plan.27. Rao, "Irrigation."28. Brown, By Bread Alone.29. L. K. Sen et al., Planning Rural Growth Centers for Integrated Area
Development (Hyderabad, India: National Institute for CommunityDevelopment, 1971).
30. Gupta, The Musahri Plan.
For non-commercial use only.

Vignettes of Third World Agriculture 63
31. Owen L. Dawson, Communist China's Agriculture (New York: Praeger,1970).
32. Leslie Kuo, The Technical Transformation of Communist China's Agriculture (New York: Praeger, 1972).
33. Leo Goodstadt, China's Search for Plenty (New York: John Weatherhill,1972).
34. Mao Tse-Tung, Selected Works of Mao Tse-Tung; Foreign Languages Press,Peking.
35. Goodstadt, China's Search, pp. 58-64.36. Dawson, Communist China's Agriculture.37. Goodstadt, China's Search.38. F. H. King, Farmers of Forty Centuries (Emmaus, Pa: Rodale Press, 1911).39. Goodstadt, China's Search.40. Ibid.41. King, Farmers.42. Dawson, Communist China's Agriculture.43. World Energy Supplies 1960-1970.44. Dawson, Communist China's Agriculture.45. Etienne, Studies.46. Dawson, Communist China's Agriculture, pp. 312-314.47. S. D. Richardson, Forestry in Communist China (Baltimore, Md.: Johns
Hopkins Press, 1966).48. Ibid., p. 66.49. Ibid., pp. 168-169.50. Dawson, Communist China's Agriculture.51. Richardson, Forestry.52. Dawson, Communist China's Agriculture.53. Production Yearbook 1972.54. Dawson, Communist China's Agriculture.55. D. F. Owen, Man in Tropical Africa (New York: Oxford University Press,
1973).56. Ibid.57. Ibid.,p.15.58. Mwalimu Nyerere, The Arusha Declaration (Washington, D.C.: Embassy of
Tanzania, n.d.).59. Henry Bienen, Tanzania (Princeton, N.J.: Princeton University Press,
1970).60. Roger Revelle et al. "Water and Land," Chapter 7 in The World Food
Problem, Vol. II, U.S. Government Printing Office, Washington,D.C., 1967.
61. R. F. Dasmann, J. P. Milton, and P. H. Freeman, Ecological Principles forEconomic Development (New York: John Wiley, 1973).
62. Owen, Man in Tropical Africa, p. 119.63. World Energy Supplies 1960-1970.64. Owen, Man in Tropical Africa, p. 37.65. World Energy Supplies 1960-1970.66. World Bank, "Additional Capital Requirements of Developing Countries,"
Washington, D. C., March 1974.
For non-commercial use only.

64 Energy and Agriculture in the Third World
67. Owen, Man in Tropical Africa.68. Tanganyika Central Statistical Bureau, Village Economic Surveys,
1961-1962.69. R. M. Prothero, ed., A Geography ofAfrica (London: Routledge & Keagan
Paul, 1973).70. Britannica World Atlas, Encyclopedia Britannica, W. Benton, 1972.71. Prothero, A Geography, p. 209.72. Pimentel et al., "Food Production and the Energy Crisis."73. Polly Hill, Rural Hausa: A Village and a Setting (London: Cambridge
University Press, 1972).74. "1973: The Year of Major Changes in Worldwide Oil," Gas and Oil Journal
71 (December 1973).75. Production Yearbook 1972.76. P. Dorner, Land Reform and Economic Development (New York: Penguin,
1972).77. Revelle et al., "Water and Land."78. Dorner, Land Reform.79. Cynthia Hewitt, The Social and Economic Implications of Large Scale
Introduction of New Varieties of Food Grain, Mexico: A CaseStudy, Report to the United Nations, in press.
80. World Energy Supplies 1960-1970.81. "Exposicion en 1a Reunion Continental sobre 1a Ciencia y il Hombre,"
Energia Electrica en America Latina (Mexico, DF, June 1973).82. Ibid.83. Britannica World Atlas.84. R. Wilkie, San Miguel: A Mexican Collective Ejido (Stanford, Calif.:
Stanford University Press, 1971).85. Ibid.86. Heath et al., Land Reform and Social Revolution in Bolivia (New York:
Praeger,1970).87. Production Yearbook 1972.88. Bruce Netschert et al., Energy in the American Economy 1850-1975
(Baltimore, Md.: Johns Hopkins Press, 1960).89. Dawson, Communist China's Agriculture.90. Production Yearbook 1972.
For non-commercial use only.

Chapter Three
Assessing Rural Energy Needs
How are we to determine how much energy poor rural communities need fordevelopment? Projections of energy use are generally made by extrapolating pasttrends in the use of commercial fuels. They rarely take into account thedistribution of energy use among different kinds of consumers, or the levels ofuse that are needed for a healthy and productive existence; and they usuallyignore the fuels which are most important in rural areas-wood, crop residues,and dung. While such projections can serveas a rough proxy for a more detailedexamination of energy's role in the industrialized countries, where commercialenergy use is Widespread and per capita consumption is high, it is not of muchvalue in dealing with the problems and needs of poor countries.
India is one of the few countries to have made some preliminaryefforts to assess noncommercial fuel use in the Energy Survey published in 1965.But India shares with other poor nations in a significant failing in evaluatingenergy needs: projections of fuel use do not systematically include the fuelneeded to spur growth in agriculture. The consequence is the neglect of the mostimportant energy policy problems of poor countries, which center around thequestion of how available capital can be invested in the countryside to provideproductive employment and a rapid rate of economic growth.
The Indian government's 1965 report on rural electrificationexcluded many poor people from its calculations from the start. In discussinggrowth potential for rural electricity use, the report says:
For the purpose of assessment of further demand, landless laborershave not been considered relevant as potential customers, partlybecause of their low economic status and partly because of the typeand conditions of their houses.'
This was a self-defeating premise on which to base rural electrification policy. Obviously, when income is low, demand or ability to buy food or
65
For non-commercial use only.

66 Energy and Agriculture in the Third World
fuel or necessities of life will be low also. To the free market economist, a"shortage" may not exist if prices rise high enough to curb demand and bring itinto balance with supply, but the shortage is real enough for the hungry.Development is concerned with creating demand and fulfilling needs. It istherefore important to separate "demand" for essential commodities (in the freemarket sense of the word) from the need for them, and the investment requiredto fulfill those needs.*
In this chapter, we will attempt to present a method for evaluatingenergy needs for agricultural development. An actual determination of energyneeds depends on a host of physical and economic characteristics of the regionsuch as the amount of land, adequacy and variability of rainfall, depth ofunderground water, distance from towns, and the like. Nonetheless, the natureof rural energy needs throughout the Third World is similar enough that themethod we present here could find widespread applicability. Both theoreticaland field research are needed to improve upon the method and numericalestimates described here. Energy needs can be split into three categories:**
1. Domestic energy needs-cooking, heating, and lighting, forexample.
2. Energy for agriculture and industry-that is, energy needs foreconomic growth and the creation of productive employment. Power forirrigation pumps, coke for steel production, or oil for the transportation ofessential goods are examples.
3. Energy needs for the provision of essential social services such aseducation and medical care.
Energy plays a much smaller role in the provision of social servicesthan in the other two categories, and concept of need is also much more amatter of opinion. The amount of money and fuels devoted to "defense"depends on the perception of the threat to security and on prestige. Someschools do use light from sunshine. A small mobile medical unit might provideuseful service to 10,000 villagers, while a monumental hospital designed to servethe rich in the city may serve a tenth as many people and use several times morefuel. None of this is meant to denigrate the importance of education or medicalcare, or domestic water supply and the like; these services are incontestablyessential. But their energy cost is usually small when compared to, say, cookingor irrigation. We will therefore deal with these issues only in the context ofintegrated development.
*The Indian government has now accepted this concept in principle at leastand has incorporated it into a "minimum needs" program which is a large portion of theFifth Plan q.974-1979). The program's goals are to provide the poor with a certain minimum standard of living "by social consumption and investment in the form of education,health, nutrition, drinking water, housing, communications and electricity."?
**We do not include energy uses for recreation because these are rather small,and large expenditures of energy for recreation in poor countries would be extravagancesrather than needs.
For non-commercial use only.

Assessing Rural Enerqy Needs 67
It must be emphasized that both domestic and developmental energyneeds depend not only on the desired work or products but also on theefficiency with which the energy is used. This needs to be stressed because of thewidespread and persistent confusion about the relation of economic growth andenergy use growth. Production is related not so much to gross energy input intothe economy as to the useful work obtained from energy use (Chapter Two) andthe composition of the economy.3 Economic growth would be tied to growth inenergy use only if the composition of the economy and technology wereconstant.
But both factors change. Thus, gross per capita energy use in theUnited States doubled between 1850 and 19504 * while per capita GNPincreased almost five-fold between 1870 and 1950. 7 This occurred even whilethe U.S. economy was rapidly shifting from agriculture to industry, which isgenerally much more energy-intensive.f
Greater efficiency of energy use was thus at least as important asgreater energy use in increasing the gross national product of the U.S. in theperiod 1850-1950. Three energy technologies were primarily responsible: theinternal combustion engine, the steam engine (and turbine), and the electricgenerator. These technologies tended to use coal, oil, natural gas, andhydropower more economically than less concentrated sources of energy such aswood; per capita economic growth thus resulted primarily from fuel substitutionand only to a lesser extent from total per capita energy growth.
The analysis in this book leads to the conclusion that what isimportant is an increase in useful work, which must be obtained from acombination of more fuel use, fuel substitution, and an increase in the efficiencyof energy resources that are now used.
To defme energy needs it is therefore necessary to know how energyis used today (Chapter Two), the capital costs associated with increasing theefficiency of energy use, and the costs associated with increasing the supplyof various fuels. We will first discuss the domestic energy sector, and then go onto examine the agricultural sector, interspersed with comments on how theseprinciples might apply to some of the villagesand countries described in ChapterTwo.
DOMESTIC ENERGY NEEDS
Cooking and heating are the main domestic uses of fuel for people everywhere.Comparing the information gathered by Openshaw in Gambia.i" and the EnergySurvey of India,l1 and the Khadi Village Industries Commission.P we find thatenergy use for cooking in the two countries is about the same. In Gambia about
*Draft animals are included. There were about 10 million draft animals (mostly horses) in the U.S. in 18705 each probably weighing about 400 to 500 kilograms andconsuming 40 to 50 million Btu of energy per year. 6
For non-commercial use only.

68 Energy and Agriculture in the Third World
55 percent of the woodfuel is used for cooking, 35 percent for heating, and 10percent for all other uses (primarily ironing). Cooking fuel is an extremelyimportant part of the energy picture in rural areas of the Third World, generallyrepresenting about 50 percent of the fuel use in many areas, and perhaps up to80 percent or 90 percent in the warmer areas, especially where wood is in veryshort supply, as in the Gangetic plain.
The data from Gambia and India indicate that annual fuel use forcooking with open, slow-burning fires is 5 to 7 million Btu per capita. Because ofthe low efficiency of such stoves, the fuel use is much higher than in the U.S.A.where the annual per capita use of 3 million Btu for electric stoves (includingwaste heat at the power plant) and the one to two million Btu for gas stoveswithout pilot lights." * Approximate data on the use of liquid petroleum gasesfor cooking in Indian cities indicates an annual cooking energy use of 1 to 1.5million Btu per capita.!" To summarize, per capita annual energy needs forcooking vary between 1 and 7 million Btu, depending on the fuel, on the way inwhich it is burned, on the kinds of cooking vesselsused,** and, of course, on thequantity and type of food that is cooked.
Of course, the relative efficiency of fuels for cooking is only oneaspect of the energy problem. Whether it is desirable to improve the efficiencyof fuel use depends on tangible and intangible economic considerationsprimarily capital cost, land availability, soil conservation and flood control, andthe opportunity costs of using land to produce fuelwood, and of using dung andcrop residues directly as fuels.
Whether wood is readily available and what kind of damage resultsfrom extensive wood-cutting are two of the most important factors in evaluatingpresent use of wood as fuel. The soil erosion, the spreading deserts, andvulnerability to floods in deforested areas all over the Third World are clearsignals that unplanned use of forest resources call and does have serious adverseconsequences. IS Further, even in countries where woodlands are plentiful,extensive and unplanned use o{ woodfuel has depleted the capital stock offorests. In Gambia, for example, Openshaw has made the following observations:
Formerly only dead or dying trees were removed for woodfuel butnow living trees are cut and at increasingly greater distances from thevillages. In many of the sampled villages, the people complained thatwoodfuel was more and more difficult to obtain: now the collectorshave to set off at mid-day in order to collect and be back fornightfall, whereas previously the woodfuel was just outside the door.Some further ventured the information that it was man's destruction
*Note that per capita energy use for cooking tends to increase as the numberof people per household decreases. In the U.S. the number of people per household is muchsmaller than in poorer countries.
**Much less energy is needed to cook with pressure cookers than with ordinary pots. A research effort at determining the energy use for cooking with pressurecookers, the costs, and the design of cheaper pressure cookers certainly seems worthwhile.
For non-commercial use only.

Assessing Rural Energy Needs 69
of the trees that had brought about this situation. All villagers saidthey would co-operate in tree planting schemes to establishwoodfuel plantations provided they were shown the basic skillsandthere appears to be a real need for village woodjots.l"
Apparently, an enormous amount of labor is now invested in thecollection of fuelwood. Openshaw estimates that the capital costs of establishingvillage woodlots to supply fuel wood-excluding land costs and the costs of locallabor-would be about $20 per hectare. The money would be spent primarily toprovide suitable plant varieties and to train villagers to operate the plantations;the investment would be in the local currency. While it may be reasonable toomit the cost of land in areas where it is plentiful (see below), it is not correct toomit the cost of construction labor for schemes which do not yield immediatebenefit. Until the woodlots mature the villagers would still have to spend thecustomary amount of labor for collecting fuel. Openshaw's estimates forlarge-scale plantations which include the cost of labor run to about $200 perhectare.
Each hectare would have an annual yield of about 15 tons of wood,or enough cooking fuel for 40 to 50 people. The gestation period would varywith the species of tree used for the plantation. For fuelwood plantations inGambia, Openshaw recommended eucalyptus, or the Indian Neem tree, in whichcase it would take about 10 years for a plantation to mature. At $5 per ton ofwood (30¢ per million Btu) the annual output per hectare would be worth $75.At a discount rate of 10 percent the present worth of all the wood that will beproduced from this scheme, starting 10 years from the date of planting, is about$300; the present worth of the capital invested is $120 assuming that $200 isinvested in equal installments of $40 over the first five years. The main benefitsof the scheme in places like China and Gambia, where felling of live trees iswidespread, would probably accrue in terms of soil and water conservation,since, according to Openshaw's estimates, wood plantations can supply fuel withonly one-fifth the land that is used with present practices. Because of this it isreasonable to omit the cost of land from the estimate of capital cost.
One must also note that the capital cost of replacing wood withpetroleum (kerosene) would, in general, cost more than a wood plantation. (Thisincludes the effects of the higher efficiency of oil use. The capital investmentrequired for 1 million Btu per year of oil production, refining, and transport inthe U.S. are about $6 to $8.17
) If the costs of oil exploration, of the specialstoves required to burn oil, and of oil transport to the villages are added, thenthe cost of conserving land by using petroleum instead of wood is seen to be atleast twice as large as the cost of village woodlots.
It is important to bear in mind that the availability of land is anecessary element. Where both land and fuel are scarce, as they are in theGantetic plain, and the same land could be used to cultivate food instead of fuel,the calculation is less simple.
For non-commercial use only.

70 Energy and Agriculture in the Third World
The management of the village woodlot will need special care. Therewill be temptations of cutting prematurely before the stand is established, orovercutting once it is. If there are many poor people in the village, some willprobably harvest wood for illegal sale. These and other problems (such asequitable distribution of the wood, or the allocation of jobs to care for theplantation) must be anticipated and reasonable solutions sought if theinvestment is to be fruitful. On the plus side, good planning and management ofwoodlots could permit them to be integrated with long-range national andregional afforestation and soil conservation programs designed to ensure thestability and continuing productivity of tropical soils. The technical aspects offorestry are beyond our competence, but we venture this suggestion as it seemsto merit serious study.
Where the supply of land is limited, the problems of supplying fuelfor keeping warm are much more difficult because there are so many immediateneeds which the limited land and capital resources must fulfill. Energy use forheating in poor countries depends not only on the weather but also on theavailability of fuel. Of course, tropical areas, such as the Indian coastal regionand South East Asia, need no fuel for keeping warm. But in the Gangetic plainpeople do suffer from cold weather. A light frost at night is common in thewinter;" yet there is practically no heating beyond that provided by thecooking fires. In contrast, the use of fuel for heating in Gambia is much largereven though the climate is warmer.
In the cold climates the poor try to keep warm by wearing suchclothes as they can garner and by huddling around open fires; in Kashmir, peoplewear loose clothing and carry a small pot of embers underneath. But the term"space heat," which connotes a well-built house with effective stoves or centralheating systems, hardly applies to most of the homes in the Third World.
Whatever the terminology, keeping out the cold is a necessity inmany areas of the Third World such as North China, Afghanistan, the Andean,and Himalayan regions and most places south of the Tropic of Capricorn. Forexample, in the Sao Paulo district of Brazil, there were more than 40 reportedcases of death from exposure to cold during a four-week cold spell in 1974.
Warm clothing would immensely improve the lot of poor peoplewho live in such regions. Hot water and soap to wash them with would makethem last much longer, for where clothes are washed. by beating them againstrocks, they wear out quickly. For example, a hand woven cotton shirt costingabout $1 may resist only two months of wear if it is washed by beating againststones, but would last much longer if it is washed more gently. A small investment in a solar water heater and a few wooden tubs would greatly extend thelife of clothes and help to keep people warm.
Wood is the most common fuel for heating. As noted in ChapterTwo, China's afforestation program suffers serious setbacks because fuelwoodsupply is not a part of the program. Development strategy for cold climates must
For non-commercial use only.

Assessing Rural Energy Needs 71
take into account fuel needs for keeping warm. Where land is at a premium, as inmuch of China, the pressure on the land could be eased by an integrated planwhich includes village woodlots in afforestation programs, improved housing,and installation of efficient wood-burning furnaces, such as downdraft stoves ofthe Franklin type that were once common in the U.S.A. These could be madewith local materials, such as bricks. The capital costs of such a scheme are likelyto be high, though local labor and materials and simple, efficient design couldreduce them. But the costs of not undertaking a sound program to meet theseneeds are likely to be higher; for when it is cold, people will fmd the fuel and useit in the most expedient way, making the struggle for soil and water conservationmuch harder. A shortage of timber is one of the major factors limiting Chineseeconomic development, in Richardson's opinion.l? With a furnace costing about$50 to $100 (based on the wholesale price in the U.S.A. of a simple, downdraftcast iron, wood-burning heating-cum-cooking stove), fuel requirements forfamilies living in cold areas of China could be cut in half, thus relieving thecountry's critical wood shortage. The amount of wood consumed in a reasonablyefficient furnace is on the order of 1,500 Btu per house* per hour per degreecentigrade difference between the indoor and outdoor temperatures. If weassume that heating fuel must keep the house at about 10°C (SO°F)-withclothes providing the warmth above that temperature-then the fuel needs inNortheastern China, where the climate is comparable to that in Minnesota,would be about 50 or 60 million Btu per year, or about 4 tons of wood perfamily (0.8 tons per capita). This is probably less than half the amount that ispresently used. In cold areas where gothermal hot water or volcanic heat isavailable, it may be cheaper to combine housing programs with the provision ofspace heat and hot water from gothermal energy rather than wood. This methodof heating is common in Iceland. In countries such as Tanzania, where land isplentiful and the climate not as cold, but capital is in short supply, efficientstoves probably cannot be justified since their capital costs are likely to exceedthose of villagewoodlots.
In the northern stretches of the plains of the Ganges and IndusRivers, the mean winter temperatures are 10°C to 15°C with nighttimetemperatures often in the 0 to 10°C range. The forests have long since beencleared. Clothes and quilts stuffed with cotton are the main methods of keepingwarm. The lack of forests, the severe and chronic shortages of food, the scarcityof land and abundance of people, the flooding problems that have been causedby deforestation, make the outlook for provision of heating fuel appear dim.
Immediate and sustained increases in the production of food are theparamount need in the Gangetic plain. Much of the misery on this earth isconcentrated in that fertile belt of land, which includes Bangladesh and the
*We assume a small, well-built house. We do not include the costs associatedwith the house in this calculation since good housing is an even greater need than spaceheating.
For non-commercial use only.

72 Energy and Agriculture in the Third World
Indian states of West Bengal, Bihar, and Uttar Pradesh. .In an area where almostall the land is devoted to cultivation, it will be difficult, if not impossible, toestablish successful woodlots unless the productivity of the land can be increasedsimultaneously. The village commons, used for pasture, could be used to growwood, but its use as a village woodlot has to be tied to increases in food for cattlewhich could come from increases in food (and hence fodder) production andintensive cultivation of cattle feed. In other parts of India, such as hill areasalong the coasts, wood is the principal domestic fuel and cow dung is used asmanure. Here it should be more feasible to establish village woodlots to supplyfuel and help control soil erosion.
There is another related problem. Rural families, particularly thosewith little or no land, like to have their own cattle because they make use of the"free" grazing land and provide the owners with a source of labor for the fieldsand transportation, and dung for cooking. The nutrients that these cattle getfrom the commong grazing land and the fodder are, in large measure, not returned to the soil; thus its productivity is degraded. The current low level of productivity is probably maintained by nitrogen-fixing blue-greenalgae,some humanexcrement deposited in the common land, the partial return of dung as the cattlegraze and, in some areas, silt deposited by periodic floods. This is anotherillustration of how rural development problems are bound up with each other.
PEAK LABOR AND SELECTIVEMECHANIZATION
Wehave noted that one of the most severe problems in agricultural economics allover the world is the peak labor problem-that is, certain operations in the cropcycle, such as transplanting rice, harvesting, threshing, and so on, demand muchmore labor in a brief period than is ordinarily required for most of the year. Inthe cultivation of rice in Taiwan, transplanting takes 12 percent of the totalannual labor and harvesting another 16 percent.j? although these two operationstogether may last less than 30 days. In Chapter Two we noted that the sameproblem exists in Chinese agriculture and in the villages of Gambia. It exists inthe U.S.A., where large numbers of migrant farm workers move with the seasonsto where there is peak demand for labor, and still are unemployed for much ofthe year.
The problem is particularly acute where, for lack of a suitableclimate, adequate irrigation, or other farm inputs, only one crop is grown eachyear. Multiple cropping can increase employment but causes its own peak labordemands, for it puts a premium on quick harvesting and land preparation forsowing the next crop.
The peak labor problem adversely affects rural development in threeways:
For non-commercial use only.

Assessing Rural Energy Needs 73
1. It causes high unemployment for much of the year and this inturn is a principal reason for the low productivity of labor.
2. It can inhibit the adoption of agricultural innovations particularly in the typical situation, where the small farmer cannot afford to hire theadded labor needed at critical times.
3. It leaves many small farmers with little option but to have morechildren to provide labor for the farm. This requires no capital outlay, but itslong-run costs are much larger than those of using animals or machines.
The relation of the labor needs of agriculture to lower birth rates hasnot, to our knowledge, been empirically studied. Industries and serviceshave nocomparable peak labor demands. Therefore, as agricultural population dec1inesthat is, as the productivity of labor in agriculture increases, and peak laboroperations are mechanized-and industrial and service employment increases, itwould appear that one of the main incentives for having many children iseliminated, since families which obtain their income outside agriculture feel littleeconomic need for having large numbers of children. This means that a reductionor elimination of the peak labor demand in agriculture could result in a lowerbirth rate. Moreover, new or additional employment could be in any economicsector-agriculture and related industries, urban industries, or the servicesector-as long as the peak labor demand is reduced. Empirical research on theconnection of peak labor demand and the birth rate is desperately needed, for itcould have profound implications for development policy.
Peak labor demand can be reduced or eliminated by selectivemechanization of those agricultural operations that cause it. This meansproviding energy to substitute for human labor at these critical times in the cropcycle. The source of energy could be more draft animals, stronger draft animals,or fuels such as oil, biogas, wood, and coal to power machines.
There is, of course, no single prescription for what source of powershould be used to reduce peak labor requirements. Conditions vary from oneregion to the next and from one farmer to the next. Even so, some broadobservations should help in making a more detailed analysis of what mix ofpower sources is appropriate to a particular situation.
In tropical Africa there are large numbers of cattle that are not usedfor draft purposes. In many areas the cattle are kept to provide essential proteinin the form of milk and blood, and occasionally, in the form of meat. Sometimesthey are sold for slaughter and provide a source of revenue as well. Many ofthese cattle could be used to provide power for farms and light irrigation, and insome areas this is being done. The problems are those of introducing newtechnology into agriculture, providing adequate extension services and, perhaps,overcoming social resistance to the use of cattle for draft purposes.
In India the situation is considerably different. Though much abusehas been heaped on the Indian farmer for his supposedly irrational attitude
For non-commercial use only.

74 Energy and Agriculture in the Third World
toward cattle, detailed studies such as the ones by Harris" and Odend'halfshow that these attitudes are firmly rooted in the economic realities in which thefarmer finds himself and that religious belief "derives power and sustenancefrom the material rewards it confers upon both men and animals.,,23 It is alsoclear from a number of studies that shortages of power on Indian farms arefrequent during the busy season (ploughing just after the first rains, forexample).24,25,26 Farmers who do not own enough cattle to plough their ownfields cannot rely on borrowing them at the time they need them most. Theshortage of power on the farm sometimes inhibits the use of heavier and moreeffective farm implements such as steel ploughs.
Fodder and pastureland for cattle are often in short supply. For thisreason Indian farmers calculate the food budgets of animals with great care,bestowing food and attention on working bullocks or pregnant cows, with therest left to fend for themselves. Mayer has described this graphically:
The working bullocks, on whose efficiency cultivation entirelydepends, are usually fed with chopped bananas at the time of fodderscarcity. But the milch cows have to live in a semi-starved condition,getting what nutrition they can from grazing on the fields after theirrice harvest (Gangulee 1935: 17).
At present cattle are fed largely according to the season. Duringthe rainy period they feed upon the grass which springs up on theuncultivated hillsides... But in the dry season there is hardly anygrass, and cattle wander on the cropless lands in an often halfstarvedcondition. True there is some fodder at these times in the shape ofrice straw and dried copra, but it is not generally sufficient, and isfurthermore given mainly to the animals actually working at thetime. (As quoted in Harris27).
Obviously the lot of the Indian bullock and cow is as hard or harderthan the lot of the farmer. It seems fair to conclude that, as in many otheractivities, most Indian farmers make about as thorough use of their cattle astheir circumstances permit.
In a few areas of India there may be some grazing land, not suitedfor intensive agriculture, but which may support some increase in the populationof cattle. For many, if not most, areas of India, an increase in bullock powercould come from intensive cultivation of cattle feed and from advances in foodcrop yields which, in general, also increase the supply of fodder for animals (seeChapter Four for a fuller discussion). Mechanizing irrigation would releasebullock labor now used for that purpose.f" This would permit some increase inthe power available for tilling, either by way of better fed bullocks or morebullocks or both, since the feed now used to sustain the bullocks which work toirrigate the fields, would be available for other tasks.
For non-commercial use only.

Assessing Rural Energy Needs 75
From the social or national point of view, it may be more desirableto increase the number of draft animals than to improve the strength of a smallernumber of animals (where a choice must be made). This is because a largeranimal population affords poorer farmers the opportunity to acquire more cattlefor their small farms. Indeed, one of the principal reasons that farmers keepcows alive at a bare subsistence level and feed them as well as possible onlyduring pregnancy and the initial period of lactation is the hope that they willbear male offspring. But the argument for stronger and larger animals isthreefold: they can draw better and heavier implements; the protein requirements of draft animals do not increase when they are workingr" and the marginal efficiency of draft animals is higher than the average efficiency.P" That isto say, an added Btu fed to an existing animal will result in larger availableuseful energy than the same calorie fed to a new animal. Thus if food for cattleremains limited, fewer animals could make better use of the energy and proteincontent of the food now available to them.
Increasing fodder production and in turn feeding a larger animalpopulation is the traditional method in increasing the power on farms in Indiaand other poor countries. This method is slow and cannot be expected to yieldthe large increases in installed horsepower which are necessary for rapidagricultural growth. In Japan where small mechanized farms are common, theaverage installed horsepower is 1.6 hp per hectare (Table 2-1, Chapter Two). Inmany poor countries installed horsepower is little more than a third of thisamount.
In India, for example, the 150 million or so draft animals representan installed power of about 75 million horse power or about 0.6 hp per hectare.An addition of 1/2 to 1 horsepower per hectare to bring Indian farms closer tothe Japanese level would mean adding 70 to 140 million horsepower which isneeded to fulfill the power needs of India's farms (excluding irrigation-see thefollowing sections). This is beyond the potential for expanding draft animalpopulation in the next decade.
It appears, therefore, that to make more power generally available tofarms in many poor countries a combination of elements is required: moreintensive use of grazing land, limited increases in cattle population (whenfeasible), and farm machines. We reemphasize that rapid increases in foodproduction result in large increases in crop residues and that these residues canbe used as fodder to support both stronger and more draft animals.
Small farm machines similar to the walking tractors'" in common usein Japan and Taiwan are clearly called for in India and in many parts of Asia(e.g., China) and latin America, where a similar dearth of power is evident.
*Elimination of the cab and a simpler construction reduces the weight of thetractor, thereby increasing its energy efficiency. It also reduces the capital cost.
For non-commercial use only.

76 Energy and Agriculture in the Third World
These same engines can, in many instances, be used for irrigation and small-scaleindustries.
The principal policy problems connected with introducing farmmachines have to do with their capital requirements and employment effects.
CAPITAL REQUIREMENTS
Individual plots of land in the Third World are small-often one hectare or less.This makes it difficult for the small farmer to purchase farm machinery, for evenone small tractor (5 to 15 horsepower) suffices for many small farms. Therefore,small farmers can neither get loans for purchasing machines nor use themprofitably if they have the means to buy them-even though the capital cost perhorsepower of a small tractor is $20 to $30 compared to $50 to $100 for a pairof bullocks. *
A simple comparison of tractors with draft animals on the basis ofcapital cost would be misleading, even apart from the questions of access to theservices of machines (discussed in the next two sections).
In addition to working in the fields, bullocks, horses, and mulesprovide power for transportation, some irrigation and, in many parts of India,they provide cooking fuel in the form of dung. However, mechanical power isnearly always required to exploit the potential of underground water forirrigation and multiple cropping. Aninal and human labor is insufficient foranything but light irrigation to supplement rains. Therefore, the cost of selectivemechanization and mechanical irrigation using different combinations of draftanimals, farm machines, engine-operated pumps, or electric pumps will varygreatly with the area under consideration.
Decreasing peak labor requirements will not by itself produce morefood. The equipment cannot pay for itself unless other capital investments inother areas are made simultaneously. Irrigation is by far the most capitalintensive of these investments; it requires anywhere from $100 to $1,000 ormore per hectare. 32, 33 The lower end of this range applies to small-scale projectssuch as persian wheels, tubewells, and tanks; the higher end to large dams withlong canals (including interest during construction, which greatly increases thecost of many large-scale projects which take 10 years or more before they yieldany benefits). Still more capital is required for the power required to pump thewater. Even assuming the low end of all these estimates-$20 per hectare forfarm machines, $100 per hectare for tubewell irrigation, and $200 per hectare
*Engines usually have limited overload capability. In this respect draft animalsare superior to machines because an animal with an average output of 1 horsepower iscapable of delivering many times that for one or two minutes." Therefore, in some cases itmay' not be possible to reduce the size of small tractors because the peak power requirements of some field operations may be several horsepower.
For non-commercial use only.

Assessing Rural Energy Needs 77
for the power facilities,* a conventional development scheme would require atleast $320 per hectare.
Undertaking such a scheme on three-fourths of India's cultivatedland would require $32 billion or about six times the total annual governmentalexpenditure. Of course, not all irrigation projects will be as cheap as $100 perhectare. The requirements of flood control, the dearth of underground water,the need to exploit hydropower resources will dictate that in many areasmedium and large-scale works are more appropriate. In addition, theseagricultural development works require large investments in industries, in roadsand railways, in fuel production, in cities and market towns, to say nothing ofother essential expenditures on health, education, and the like. India, like manyother countries, is truly short of development capital and every effort must bemade to spend it as effectively as possible.
REDUCING CAPITAL COSTS
Costs depend principally on the choice of technology and on the way theequipment is designedand used. For example, the capital costs for a compost pitare lower than those for a chemical fertilizer plant, and different kinds ofirrigation projects and farm machines differ greatly in cost. Treated bamboo orbaked clay pipes may be cheaper than steel pipes.** Of course, the choices arenot always mutually exclusive and different conditions demand differentprojects and equipment. However, as we have shown, even the relatively cheapfarm machines and tubewell irrigation 'can be beyond the reach of poorcountries.
This situation arises partly because development schemes usuallymake poor use of capital equipment. The electric motor attached to an irrigationpump is used only when the pump is operating-usually less than 20 percent ofthe time. The engine in the tractor usually sits idle when the tractor chassisdoes-or about 90 percent of the time. Irrigation pumps are switched on at anytime during the peak season and, together with the air conditioning ingovernment offices and luxury hotels, creates peak demands on expensiveelectric generating capacity. This is the machine equivalent of the peak laborproblem.
To reduce capital costs, equipment and its most expensive parts canbe designed to be used in as many essential applications as feasible, so that idle
*This assumes an installed power requirement of about I horsepower perhectare. This figure, of course, varies enormously from one place to the next, because of thedifferent water requirements, water table depths, etc.
**Baked clay pipes are currently used in some areas of South India. 34 Bamboopipes are also used, but they tend to deteriorate with exposure to water and sunshine andcannot withstand high pressures. Research on treating bamboo pipes to retard deteriorationand improve their strength could yield handsome dividends.
For non-commercial use only.

78 Energy and Agriculture in the Third World
time is reduced as much as possible. For example, when the engine of a tractoror mechanized rice transplanter is not being used in the fields, it should be usedto pump water (as is often done in Punjab, for example) or haul a trailer withsurplus agricultural produce to a nearby market town.
Electrified irrigation systems, crop processing, and small-scaleindustries should be designed to minimize the installed electric generatingcapacity for a given consumption of electricity. Drip irrigation (the method ofdelivering a continuous supply of water to plants through small holes punched inthe pipe), while requiring higher unit investment for distributing water to thefields, may reduce overall capital costs by keeping irrigation water needs to aminimum (since water is absorbed better when it is delivered in small continuousdoses). This method can reduce the number of wells required to irrigate the landand, possibly, the power to pump the water.
When the electric motors that drive irrigation pumps are not beingused for irrigation, they could power grain-milling machines, sugarcane crushers,oil pressers, or small-scale industries such as cotton, spinning, and weaving.Thisapproach would cut the capital cost of equipment, .make feasible somedevelopment schemes which are now impractical because of their high capitalcost, and create more economic opportunities in the villages.
The capital equipment that already exists in underdevelopedcountries can also be used more productively. Pumps can be installed in existingwells to provide a more copious supply of water for irrigation. Electric powerplants in underdeveloped countries operate at low capacity factors: * 40 percentis typical and lower capacity factors are not uncommon." Improving this capacity factor by making more complete use of installed equipment in agriculture, assuggested above, and in industry could reduce the needs for capital in thisessential but capital-intensive sector.
Industries such as paper and petrochemicals that use large quantitiesof low- to medium-grade steam, could install both electric generators andhigh-pressure steam turbines to produce electricity and the requisite grade ofprocess steam together, thus savingfuel and reducing the capital requirements ofnew industries. 35
, 36 In many instances the total annual operating costs ofexisting industrial installations that use oil could be markedly reduced;"Automobile factories could cut back production of cars and turn out moretractors and farm implements. Private automobiles and motorcycles, which lieidle perhaps 95 percent of the time, are a luxury which, with appropriatemodifications, could be put to more effective use as tractors, irrigation engines,and transport vehicles for food and fertilizers.
In the United States 6 million automobiles are junked each year andsold for scrap at $30 a ton. With some fixing up, many of the engines could beused in industry and in small power plants to drive generators in villages and
*Capacity factor is defined here as the proportion of a plant's capacity that isactually in use averaged over one year.
For non-commercial use only.

Assessing Rural Energy Needs 79
small towns. While the costs of transporting an auto engine (and other usableparts) from the U.S. to Africa, Asia, or Latin America may be high-perhapsseveral hundred dollars-a 100 horsepower engine at $15 per horsepower wouldbe worth $1,500. This concept can be extended to include all manner ofvaluable equipment from cooking ranges and refrigerators to hospital equipmentnow discarded in the industrialized nations because labor there is too expensiveto service it. A comprehensive effort should be undertaken immediately toevaluate the problems (e.g., spare parts) and potential of such transfers of capitalequipment. This appears to be an avenue of reducing the capital costs ofdevelopment that has not yet been systematically explored.
A major policy implication of the approach outlined here is thatonly integrated development programs can accomplish rural development atminimum capital cost. Obviously, machines cannot be designed for multipleapplications if one doesn't know what the specific applications will be.Moreover, if versatile machines are designed, but then put to use for one purposeonly, the end result will be higher, not lower, capital cost. Birth controlprograms this year, irrigation the next, domestic water supply the year afterthat, and farm machines 10 years later will not effectively cut capital costs. Thecompartmentalized approach may be suited to the empire building thatpoliticians and bureaucrats the world over engage in, but it will not bring aboutrapid development. Some urgently needed efforts, such as afforestation schemesand many irrigation projects, can take effect even in the absence of an integrateddevelopment plan. Lack of a plan is no excuse for delay in beginning theseprograms.
MECHANIZATION AND EMPLOYMENT POLICY
Mechanization has important implications for the job opportunities available tothe landless, the land renters, sharecroppers and the owners of very small plotsof land who must have jobs outside their own land to make ends meet. Thedemand for peak labor is probably the only important leverage the poorest andmost powerless people have in village societies. Villages are dominated by thelandowners who not only control the most important physical resource-Iandbut are also often in the majority. Obviously, most of these landowners are poorthemselves but not as poor and vulnerable as the landless.
Farm machines whose only purpose is to eliminate peak labordemands will deprive the poorest people of their only source of economicpower. With the continuing strong pressure on food and money supply becauseof population growth and inflation, it is likely that the landless will be deniedfood, that they will migrate to the cities en massein search of it, and die becausethey won't find it. The current large-scale migrations to the cities by poorvillagers of India and Bangladesh hunting in vain for food are a clear signal thatthe starving out of the landless is not an academic speculation.
For non-commercial use only.

80 Energyand Agriculture in the Third World
As peak labor requirements in agriculture are reduced, more jobopportunities must be created. This can be done by multiple cropping, publicworks that create productive assets such as dams and roads, collection andprocessing of local fuels, the development of market towns, and effective use ofcapital equipment by all.
The creation of such opportunities for the poor in villages cannot beleft to chance or the good will of the more powerful segments of rural society.Raj Krishna has made the following observations on the minimum needsprogram in India which is part of the current (fifth) five-year plan:
In view of past experience the proposal to pump Rs. 11 ,000 crores[a total of $14 billion over five years] for works in the rural areasevokes the grave anxiety that if the quality of a large number oflocal projects is as bad as it has been, and the leakage of funds due tocorruption is as great as it has been, there may be neither asubstantial addition to productive capacity nor a significant incometransfer to show for the enormous outlay. Instead of reducing thepoverty and idleness of the poorest, it may further enrich the ruraloligarchy and bureaucracy, and increase inequity and tension in thecountryside. Therefore, two critical requirements of the success of amassive works programme are: a radical restructuring of the districtdevelopment administration, and a radical politicisation of theunder-employed rural proletariat. Strong and well-staffed ProjectFormulation Bureaus must be established in every district to prepareshelves of technically and economically sound local projects.Recognized private consultancy firms can also be mobilized for thistask. And the unemployed, the landless, the crop-sharers and theinsecure tenants must be organized into militant unions to demandthat project funds and benefits really reach the poorest and are notswallowed by contractors, rich farmers and petty bureaucratsthrough whom they are channelled. Incidentally, these unionsshould also demand that land reform laws be implemented withinspecified periods of time, and that in the distribution of credit andinputs, the small and marginal farmers receive fixed minimumquotas. Without militant rural unionism, laws and policies have notbenefited and will not benefit the mass of the rural proletariat. Iwould even suggest that the Government should subsidize theorganization of rural unions-regardless of the nature of the partieswho organize them-in proportion to the certified membership ofeach union.
The work guarantee principle will have to be built into the worksprogramme in one region after another as the capacity to implementlarge shelves of local projects grows. There are two fundamentalethical reasons in support of the "right to work." First, the existenceof unemployment of the order of 9 percent of the labour force isnot a failure of the working class but a failure of society as a whole
For non-commercial use only.

Assessing Rural Energy Needs 81
for which the workers suffer. They must receive compensation forthis suffering, along with an opportunity to work with self-respect.Second, if the right to property is constitutionally protected, subjectto some restrictions, there is no reason why the right to work shouldnot be similarly protected. Property and work are both desired asdurable sources of income; and if one source of income, which thepropertied classes have, is protected, there is no reason why the othersource of income which the propertyless have is not protected[emphasis added] .38
Public works programs must be designed to create productive assets,particularly those which will increase agricultural production, or facilitate itsstorage and distribution (roads). As a specific example, we illustrate how the useof some of the funds of India's minimum needs program could be used.
It has been estimated that irrigation works in India require aninvestment of $3 per man day of labor. 39 The capital outlay per man day forminor irrigation works such as wells and tanks is probably lower. Landreclamation, minor irrigation, soil conservation, and road construction alone canprobably absorb about 6 million man years of labor during India's 1974-1979fifth five-year plan. Minor irrigation works alone would create irrigation facilitiesfor 14 million hectares of land. If we assume that irrigation works take abouthalf the total labor for the four activities listed above, the total investmentrequired over five years to irrigate 14 million hectares would be about $2 billion.Of this, $240 million or so could be in the form of food payments to workers(equivalent to 1.2 million tons of wheat at 1974 world prices, or about 1.2percent of India's current food grain production). This in turn could createroughly 3 million permanent jobs in agriculture and increase annual foodproduction by approximately 5 million tons.*
In the Punjab-Haryana region of India, where the use of high-yieldingwheat varieties, irrigation, fertilizers, and pesticides immensely improved the lotof the average farmer, unemployment decreased in spite of rapid mechanizationbecause of the very rapid growth of agricultural production (particularly wheat)following the introduction of the high-yielding seeds." But Raj Krishna hasshown that unless agricultural growth is rapid (more than 5 percent per year),the rate of mechanization of threshing can cause unemployment to increase.f **The rate of mechanization in agriculture, particularly for threshing, should be
*Raj Krishna estimates that irrigation works in India result in net increase inemployment of 51 man days per hectare.t" The potential is greater because only 20 percentof India's irrigated land is now cropped more than once.The estimate of increased foodproduction from minor irrigation works has been derived from the estimates for UttarPradesh (on the Gangetic Plain) made for the third five-year plan as quoted by Etienne (note25).
**Note that unemployment will increase as long as the rate at which new jobsare created and filled is less than the rate of growth of the labor force. Thus both employment and unemployment can increase simultaneously.
For non-commercial use only.

82 Energy and Agriculture in the Third World
consistent not only with the needs of increasing production, but also with thecapacity of the rest of the economy, including public works programs, to absorbthe displaced labor.
In many countries, farmers with small and medium holdings (1 to 5hectares) control most of the land and constitute the majority of the ruralpopulation. These farmers need liberal extension of enough credit to buy farmmachines, or bullocks, and to dig private wells to suit their needs; agriculturalextension services; and timely provision of suitable seeds, fertilizers andmaterials to build channels for water or wells, and often this kind of help issufficient enough to ensure rapid progress." However, many small farmerscannot offer enough collateral to get the loans they need for these purposes.Many small farmers could not make full use of a tubewell or a tractor or a pairof strong bullocks which may still be essential on a part-time basis to improvethe productivity of their land. There is, therefore, a need for the government toown and operate tractors, tubewells, fuel and power production and distributionsystems (both centralized and decentralized) and the like, so that small farmerscan have access to them. With such an ownership scheme, the general principleof equipment designed for multiple use has great potential. Such equipment canbe used to increase agricultural production and simultaneously to createemployment for the landless.*
Custom farming, in which irrigation water and farm machine servicesare provided to farmers by private individuals who own the equipment, isanother way of providing these services to small farmers. If the custom farmingapproach has the advantage that privately owned equipment is likely to be bettermaintained and more profitably used than state-owned equipment, it has thedisadvantage that the services may not be made available to small farmers onterms they can afford. Private loans from moneylenders in India often carryinterest rates as high as 36 percent a year. 44 Thus any widespread promotion ofthe custom farming approach must be accompanied by adequate regulation toensure that small farmers get their due.
Within this general framework, we can set forth the specific energyneeds of agricultural development.
ENERGY NEEDS OF AGRICULTURE
Decreasing peak labor requirements will probably require a few hundred hoursof machine use per hectare and a power requirement of 1/2 to 1 horsepower.This implies an energy use on the order of 1 to 3 million Btu per hectare percrop (in addition to animal labor). With high-yielding varieties of wheat and ricethreshing often causes a greater peak labor demand, as energy requirements for
*The implement used will depend on the crop. It could, for example, be a ricetransplanting machine, or harvestor, a mechanical thresher, or a sugarcane crushing machine.
For non-commercial use only.

Assessing Rural Energy Needs 83
threshing depend on the amount of grain produced per hectare, rather than theamount of land cultivated.
Energy requirements for irrigation and drainage vary a great dealfrom one region to the next. Indeed, if rainfall is regular and a cold climatepermits only one crop a year, irrigation may not be necessary at all. Forexample, only 3 percent of U.S. corn fields are irrigated." This situation doesnot apply to most underdeveloped countries where rainfall is generally irregular,occurring mostly during a single three or four month rainy season and wherewarm climates permit planting many crops a year, given a regular water supply.Moreover, the high-yieldinggrain varieties require the application of water at theproper time and generally tolerate less variation than the traditional varieties.With few exceptions, irrigation is necessary to increase yields, stabilize foodproduction (that is, decrease yearly fluctuations in yields), and produce severalcrops a year.*
Gravity irrigation, in which water flowing downhill is channeledonto terraces on the hills, and artesian wells, in which underground water isbrought to the surface by the pressure of the layer(s) of rock above it, requirelittle or no mechanical energy. Where the water table is near the surface, as it isin the Gangetic plain and many other areas, the required useful energy may beon the order of 1/2 million Btu per hectare per crop. This may increase to 5million Btu/ha./crop or more (useful energy) in arid areas with deep watertables, or canal works where water has to be pumped up hills.** For example, itwould require large amounts of energy to pump the waters from the Gangeticplain onto the Deccan plateau in South India, or the waters of Lake Victoria upto the Tanzanian plateau.
Since underground water is available close to the surface in theGangetic plain, the useful energy requirements there would be about 1/2 millionBtu/ha./crop. This means a total useful energy requirement of 150 million Btufor Mangaon's 300 hectares. A month's useful energy output of all the draftcattle and half the humans in Mangaon would be 35 to 40 million Btu, using anoptimistic efficiency estimate of 5 percent (Appendix A). Cattle wouldcontribute about 85 percent of this total.
As a practical matter, the useful energy which could be realized fromanimals and humans at the beginning of a development effort is likely to bemuch smaller than this estimate, since not all draft cattle and people in thevillage could be spared for one task, and shortages of food and fodder wouldlimit the work that people and animals could do. The work output of draft
*Current research on seed varieties that will produce high yields without irrigation will, if fruitful, reduce the need for irrigation. But present needs for increased foodproduction and hence for irrigation are too great to wait for the fruition of long-termresearch, which is often uncertain.
**Irrigation energy requirements vary, of course, with the crop and the rainfall during the time it is planted. This discussion is illustrative of irrigation energy requirements under the various conditions described in Chapter Two.
For non-commercial use only.

84 Energy and Agriculture in the Third World
animals and humans can be increased somewhat as more food and fodderbecame available-that is, as agricultural production increases. But such increasesin work output are not likely to come near meeting the energy requirements oflift irrigation. However, if irrigation water cannot be provided by other means,or if the water requirements are small, then providing light irrigation with draftanimals and human labor would at least help to supplement rains and ensure oneproductive crop a year during the monsoon season.
Fixed nitrogen* can be provided to the soil in four ways: (a)applying chemical nigrogen; (b) applying organic nitrogen from agricultural,animal and human wastes; (c) planting legumes which harbor nitrogen-fixingbacteria in their roots (e.g., soybeans, pulses); (d) seeding the soil withnitrogen-fixing bacteria grown in cultures outside the soil.
We have only scanty information on the last method, but apparentlyit works in a manner similar to rotating crops with legumes." Organic wastes,except when they come from leguminous plants, do not increase the stock offixed nitrogen, but return to the soil the nitrogen that the crops absorbed fromit. Chemical nitrogen and legumes do increase the stock of fixed nitrogenbecause, in each case, free nitrogen derived from the atmosphere is fixed (bychemical and biological processes, respectively).
The return of organic fertilizers to the soil is important because it isrelatively cheap. Without it, large doses of chemical fertilizers must be added,and even if legumes are planted to fix nitrogen, phosphorous, potassium, andother trace minerals must be added to maintain the productivity of the soil.**Complete recycling of nutrients is, of course, not possible and some externalsource of nutrients is usually necessary, particularly if several crops are planted.
Legumes are important sources of protein in poor countries, andmultiple cropping with one or more legume crops each year would accomplishthe dual purpose of increasing the supply of protein and fixing nitrogen in thesoil. It is also important to note that legumes not only enrich the soil withnitrogen but make additional fuel and fertilizer available in the form of the cropresidues. Thus in Peipan (China) each hectare planted with soybeans producesalmost three tons of crop residues with an energy value of about 40 million Btuand a nitrogen content of about 10 kg. In addition, each hectare yields 70 kg. ofnitrogen (in the form of protein) in the soybeans. If the soybeans are consumedlocally, then most of the nitrogen reappears in urine and feces, while some of it
*We will not discuss the energy requirements for potassium and phosphorousfertilizers and pesticides, since they are much smaller than those for chemical nitrogen. Thecapital requirements for phosphorous and potassium fertilizers are also comparatively smallsince they are available in natural deposits and the quantities necessary for most crops aresmaller than those of nitrogen.
"Significant quantities of trace minerals, particularly phosphorous and lime(calcium) are available in the bones of animal carcasses and in fish scrap. The use of ashesleft over from burning wood, crop residues, and dung would also enrich the soil withpotassium (about 5 percent) and smaller amounts of other nutrients. This method of soilfertilization has been practiced in China and Japan for centuries.??
For non-commercial use only.

Assessing Rural Energy Needs 85
is retained to provide for the growth of children.* Thus, careful management ofhuman excrement can result in a substantial increase in the stock of fixednitrogen in an agricultural economy where legumes are grown. In China suchmanagement has enabled the soil to be cultivated without loss of productivityfor thousands of years. Not long ago, it was common for Chinese farmers to paygold for human excrement collected in the cities."
The safe return of human feces and urine to the fields is importantnot only for their fertilizer potential but also crucial to the improvement ofsanitary conditions in rural areas, and hence the health of rural people. Forexample, in many rural areas of Egypt schistosomiasis, a debilitating blood flukedisease acquired primarily through contact with infected water, affects half thepeople.50 Its control depends primarily on the sanitary disposal of human fecesand urine which, for lack of suitable facilities, are now discharged along thebanks of rivers and canals. In Chapter Four we shall see that the investment inlatrines necessary to control the disease can also be productively used forproviding fertilizers and fuel, thus increasing the benefits of irrigation canals tofarrning. Considering the enormous cost of the disease in terms of lost labor andagricultural production, as well as the direct costs of controlling the disease, onecould even conceive of payments to people to use latrines.
The fertilizer potential of organic wastes can be exploited either bycomposting (fermentation in the presence of air) or by anaerobic fermentation.Composting results in a complete loss of the fuel value of the wastes, since thebacteria convert the carbon to carbon dioxide, and some of the nitrogen involitile form (ammonia) escapes to the atmosphere. Anaerobic fermentation, orbiogasification, produces the gaseous fuel methane from organic wastes; with nosignificant loss of fertilizer value. It requires a higher capital investment thancomposting, but as we shall see in Chapter Four, fuel and electricity producedfrom the fuel would in many cases be considerably cheaper than that providedby present methods of centralized generation and rural distribution lines. If abiogasification system is not economically feasible, then composting should beencouraged to recycle nutrients to the soil. Of course, composting is already incommon practice in many countries, but in many others, such as Tanzania, it isnot.
Chemical nitrogen is the most energy-intensive form of fertilizer andthe most expensive. The average u.s. price of urea (46 percent nitrogen) rosefrom about $100 a ton in September 1973 to around $255 a ton-or about$550/ton of contained nitrogen." It is even more expensive for the manycountries that import chemical nitrogen from the u.s. since one must addtransport costs and the fact that the fertilizers must be paid for in scarce foreign
*The nitrogen excreted by humans varies from a low of 4 grams per day whenthe diet is low in nitrogen (protein) to 18 grams per day when the diet is nitrogen rich (highin protein). Most of the nitrogen appears in the urine in the form of urea. An intake of 50grams of protein per day (average in many countries) by an adult in nitrogen balance willresult in the excretion of about 8 grams of nitrogen per day.48
For non-commercial use only.

86 Energy and Agriculture in the Third World
exchange. It takes 75 million Btu to produce a ton of nitrogen from natural gas,and 100 or more million Btu if it is produced from oil and coal, as it is in India.The cost of the fuel alone is around $150 to $200 in most places. (The cost ofproducing chemical nitrogen is much lower in the U.S. where it is produced fromrelatively cheap natural gas.) Unless world oil prices decline substantially-andthe prospects for that seem dim-it is unlikely that world prices for chemicalnitrogen will fall below $300/ton in the next few years. Indeed, the currentshortage of manufacturing capacity and high demand for chemical nitrogen, andthe high rates of inflation worldwide make it likely that the price will go upbefore it comes down. Expansion of manufacturing capacity, particularly in thePersian Gulf countries where surplus natural gas is plentiful, would reduce thecost substantially, but one cannot predict that a simultaneous reduction in pricewould follow in view of the 1973-74 explosion in oil prices. For most countries,most of this cost will be in foreign exchange. And it will take still furtherexpenditures to deliver the fertilizer to the villages.
The continued use of chemical fertilizers is crucial to maintainingthe gains in food production of recent years as a result of the use ofhigh-yielding seeds. Yet short-term increases in fertilizer supply from the industrialized nations will not be forthcoming due to a shortage of fertilizer plantcapacity. As noted, India has an installed capacity of around 2 million tons ofnitrogen a year, but produces only about 1 million tons and has the potential ofrapidly expanding its production of chemical nitrogen. But most other countriesare not so fortunate.
Chemical fertilizers are important in conjunction with organicfertilizers for several reasons. First, nutrients which are lost by leaching,*volatilization, and necessarily imperfect recycling must be replaced by chemicalfertilizers, except in the case of fixed nitrogen where nitrogen fixing bacteria(either from legume plants or from industrially-grown bacteria) can fill part ofthe gap. Second, in most cases organic fertilizers cannot immediately provideenough nutrients for high-yielding grain varieties (Table 4-5, Chapter Four).Third, high-yielding grain varieties demand nutrients in precise combinations.Organic methods will not produce these exact combinations. Chemical fertilizersare necessary to give the plants the balanced supply of nutrients they require.
The exact requirements for chemical nitrogen will vary with thevariety of seeds used and with the number and variety of crops. If two grains,rice and wheat for example, and one legume such as peas, are planted each year(three crops are feasible in many cases) the chemical nitrogen requirements arelikely to be high, perhaps on the order of 100 kg. per hectare per year. In
*In many tropical and semitropical areas the water hyacinth has caused seriousproblems, clogging canals and waterways. It absorbs nutrients leached from the soil into thewater and is one of the most efficient plant converters of solar energy, producing up to 200tons of dry matter per hectare per year. The use of the water hyacinths as a source of fuel,or in compost pits (along with other organic material), and perhaps, in biogas plants couldconvert this plant pest into a useful resource (see Chapter Four and Appendix B).
For non-commercial use only.

Assessing Rural Energy Needs 87
addition, smaller amounts of phosphorous, potassium, magnesium, calcium andsulphur would be required, the quantities being determined by the seed varieties,soil characteristics, rainfall, and drainage, and the composition of the organicfertilizers returned to the soil. It would take about 7.5 million Btu tomanufacture 100 kg. of nitrogen so that growing three crops a year in Mangaonwould require roughly as much energy for chemical fertilizers as would beneeded for lift irrigation. In other areas where the water is deeper underground,fuel energy requirements for lift irrigation would probably predominate. Thecapital investment required to produce 100 kg. of chemical nitrogen annually ina large-scale plant is about $40. Most, perhaps all, of this capital could begenerated within an expanding agricultural sector.
There are three other areas where significant amounts of energy areneeded for agricultural development: (a) development of market towns(including the requisite services and industries); (b) manufacture of the capitalgoods for agriculture in large-scale industries·; (c) transportation of surplusagricultural produce to cities and towns.*
In the case of market towns and cities, energy is needed not only forthe industry and commerce that serve the villagers but also for direct (domestic)and indirect (commercial, transport, and industrial) uses to satisfy the requirements of people who live in the towns and cities.
The energy needs of market towns and cities will depend primarilyon the climate, transportation distances and methods, and the mix of industries.Detailed studies must be carried out for each country to determine what theseenergy needs are and how they can be met. Wecan get an inkling of the diversityof the conditions by noting that in many African towns wood and charcoal arethe principal cooking fuels, whereas in fuel-short North India, many people haveto wait in long lines for their small rations of expensive kerosene. Neverthelessanalysis in the urban sector should be somewhat easier because more data areavailable.
The energy required to manufacture the capital goods needed foragriculture can be approximately estimated. The cost of fmished steel-basedgoods (engines, for example) is roughly $5 per kilogram, while it is about $10per kilogram for electrical goods such as motors and generators. Thus if theinvestment per hectare in pumps, tractors, engines, and so on is around $200(exclusive of energy supply) the equivalent weight of steel would be about 40kilograms. (Other materials would also be required, but we use this steelequivalent to obtain an order of magnitude estimate of the energy investment.)It takes about 70 million Btu to produce one ton of finished steel goods.52 Thusthe energy investment in the capital goods for agriculture would be around
*The transportation energy requirements for bringing capital goods to villageswould be small by comparison since these goods usually have a high value per unit weightand must be transported only once in many years. The quantities of fertilizers and pesticideswhich must be transported each year would be relatively small compared to the volume offood moved.
For non-commercial use only.

88 Energy and Agriculture in the Third World
3 million Btu per hectare. This energy investment can be reduced not only byputting a single piece of equipment to many uses but also by incorporating manyeconomical energy conservation methods in both new and existing plants. Forexample, the energy consumed to make a ton of steel ingots can be economicallyreduced by about one-third, and similar achievement is possible in many otherindustries such as cement, paper, and so on, with technology that is availabletoday."
Some rather heavy energy investments are also needed to manufacture the energy supply facilities. Current design of village size biogas plants(capacity 1 billion Btu per year), for example, require 8 kilograms of steel and20 kilograms of cement (requiring an energy investment of 700,000 to 750,000Btu) per million Btu per year of capacity.54 If 10 to 15 million Btu per year areneeded to work one hectare of land, the required energy investment to build thebiogas plant for each hectare supplied with fuel would be 7.5 to 10 million Btu.The total energy investment in capital goods per hectare (irrigation pumps, farmmachines and the biogas plant) is thus comparable to the annual energy requirements needed to work one hectare of land. This relationship will, of course,vary depending on the amount of time the equipment is actually used. While thisenergy investment in capital equipment is quite small compared to the totalenergy consumed over the life of the energy consuming equipment (20 or 30years), the energy requirements during a period of rapid growth may be quitelarge. We illustrate with a hypothetical example. To introduce this package ofcapital goods (farm machines, irrigation pumps and tube wells, biogas plants) on10 million hectares of cultivated land per year (or roughly 10 percent of thecultivated land not now irrigated) would require approximately one-tenth of onequadrillion Btu (10 14 Btu) per year or about 3 percent of India's currentcommercial energy use. During the second year of such a program the energy useby the machines installed in the first year would about equal the energy requiredto manufacture the equipment. After 10 years, however, the annual energy useof all the tractors and pumps in the field would be 10 times higher than theenergy use in the manufacturing industry to equip another 10 million hectares.
The heavy demands that such a (hypothetical) program would makeon India's steel and cement production* make it imperative that the use of thesematerials be reduced so far as practicable. For example, a recent analysis of thecurrent designs of biogas plants, showed that these designs are wasteful ofmaterials," and concluded that a reduction of more than 50 percent is possiblein the steel and cement required to build biogas plants (see Appendix B forfurther details).
*Roughly 1.5 million tons of steel and 2 to 3 million tons of cement peryear, or roughly 25 percent and 20 percent, respectively, of India's annual production ofthese commodities.
For non-commercial use only.

Figure 3-1. Model of a Traditional Village Economy
:t:a
I5'cc:.:0c::~~
~~aCIi
~
Typical Practicein North India(Fuel +Waste)
Leather, I I tMeat,etc.
Typical Practice in China(Fertilizer +Waste),.,---."
Fuelwood
Fuelwood
Animal.Products 'I I ,Processing
CommonGrazing
i r ~-----~-------------------'---41----'~--;-,Irregular Supply
ToAnimals
Exports andImports are I I I 'Small
Note: For the sakeof clarity,many items, such asmilkproduction and manufactureof agricultural implements,have not been shown explicitly.
For non-commercial use only.

ImportedConsumerandCapitalGoodsandServicesfromMarketTowns
'. ••• • I Fuel I I I I
, I ,II Chemical Fertilizer I '
Figure3-2. Model of a Developing Village Economy
Fuelwood ~
gt~~
~)::.
~r)'s..e~S·sCI)
:ita:~~
For non-commercial use only.

Assessing Rural Energy Needs 91
ECONOMIC MODELS
The many interrelated problems of agricultural development that we havediscussed, and some that we have not discussed only because their energyimplications are minor, require that we view the agricultural economy as anevolving system. Figure 3-1 shows a flow diagram of the major economicfeatures of a traditional village economy. Figure 3-2 illustrates a developingvillage economy.
In the traditional village economy, the crops barely provide for thefood needs of people and the fodder for the cattle. The rate of growth in thestock of capital goods is small. The energy needs are met by the use of wood andcrop residues and, in India, dung. The useful work obtained is small and isinadequate to fuel rapid agricultural growth. The cattle eat crop residues andgraze freely on common land. In comparison to the need, the draft animals yieldlittle useful work, and milk animals, little milk.
By contrast, a developing village economy exports a large proportionof its food production and imports capital goods, fertilizers, and consumergoods. The availability of sufficient energy plays a crucial role in such aneconomy. The main differences between the two flow diagrams are signified byheavy boxes and lines.
Conventional economic models that deal with land, labor, capital,savings, and so on need to be combined with physical or resource models such asthe ones illustrated here. Developing both micro and macro models of this kindwould be an immensely useful tool in understanding the potential fordevelopment and in the design of integrated development efforts. We willillustrate, in a rather simplified way, the application of this integratedtechnical-economic approach at the end of Chapter Four.
Notes to Chapter Three
1. Planning Commission, Report on Evaluation of the Rural ElectrificationProgramme (New Delhi: Government of India, 1965).
2. Planning Commission, Approach to the Fifth Plan (New Delhi: Governmentof India, 1973), p. 9.
3. Energy Policy Project, A Time to Choose: America's Energy Future(Cambridge, Mass.: BallingerPublishing Company, 1974).
4. Bruce Netschert et al., Energy in the American Economy, 1850-1975(Baltimore, Md.: Johns Hopkins Press, 1960).
5. U. S. Cattle and Livestock Statistics (Washington, D.C.: U.S. Department ofAgriculture, n.d.).
6. F. B. Morrisson, Feeds and Feeding (Ithaca, N.Y.: Morrisson PublishingCompany, 1947).
For non-commercial use only.

92 Energyand Agriculture in the Third World
7. Long Term Economic Growth, 1860-1970 (Washington, D.C.: U. S.Bureau of Economic Analysis, U. S. Department of Commerce,1973).
8. Robert H. Williams (ed.), The Energy Conservation -Papers (Cambridge,Mass.: Ballinger Publishing Company, 1975).
9. Keith Openshaw, "The Gambia: A Wood Consumption Survey and TimberTrend Study, 1973-2000," Unpublished report to the ORA/6RDGambia Land Resources Development Project, Midlothian, GreatBritain, 197 3.
10. Keith Openshaw, "Projections of Wood Use in Tanzania," Unpublishedreport to the Public Works Department, Tanzania, Midlothian, GreatBritain, 1973.
11. Report of the Energy Survey of India Committee (New Delhi: Governmentof India, 1965).
12. Khadi Village Industries Commission, "Gobar Gas-Why and How,"Bombay, n.d.
13. Energy Policy Project, A Time to Choose.14. O. P. Kharabanda, Larsen and Toubro Limited, Bombay, India, private
communication, 1973.15. R. F. Dasmann et al., Ecological Principles of Economical Development
(London: John Wiley & Sons Ltd., 1973).16. Openshaw, "The Gambia," p. 43.17. J. Hass, Financing the Energy Industry (Cambridge, Mass.: Ballinger Pub
lishing Company, 1974).18. Dudley Stamp, Asia (New York: E. P. Dutton & Co., 1958).19. S. D. Richardson, Forestry in Communist China (Baltimore, Md.: Johns
Hopkins Press, 1966).20. You-Tsao Wang, "Farm Mechanization in Taiwan: Its Problems and
Research Needs," in H. Southworth (ed.), Farm Mechanization inEast Asia (New York: Agricultural Development Council, 1972).
21. Marvin Harris, "The Cultural Ecology of India's Sacred Cattle," CurrentAnthropology 7 (1966).
22. Stewart Odend'hal, "Energetics of Indian Cattle in Their Environment,"Human Ecology 1 (1972).
23. Harris, "The Cultural Ecology."24. Ibid.25. Gilbert Etienne, Studies in Indian Agriculture (Berkeley: University of
California Press, 1968).26. J. Mellor et al., Developing Rural India (Bombay: Lalvani Publishers,
1972).27. Harris, "The Cultural Ecology," p. 55.28. Planning Commission, Report on Evaluation of the Rural Electrification
Programme.29. U. S. Cattle and Livestock Statistics.30. Ibid.31. Ibid.32. Odend'ha1, "Energetics of Indian Cattle."
For non-commercial use only.

Assessing Rural Energy Needs 93
33. Etienne, Studies.34. Ibid.35. Energy Policy Project, A Time to Choose.36. E. P. Gyftopoulos et al., Potential Fuel Effectiveness in Industry (Cam
bridge, Mass.: Ballinger Publishing Company, 1974).37. Robert H. Williams, Director of Research, Institute for Public Policy Alter
natives, Albany, New York, private communication, December1974.
38. Raj Krishna, "Unemployment in India," Indian Journal of AgriculturalEconomics 28 (January-March 1973): 20.
39. Ibid.40. Ibid.41. M. S. Mudahar, "Dynamic Analysis of Agricultural Revolution in Punjab,
India," Cornell University, Ithaca, New York, July 1974.42. Raj Krishna, "Measurement of the Direct and Indirect Employment Effects
of Agricultural Growth with Technical Change," Externalities in theTransformation of Agriculture (Ames: Iowa State University, inpress).
43. Etienne, Studies.44. Ibid.45. D. Pimentel et al., "Food Production and the Energy Crisis," Science (2
November 1973).46. Ananda Krishnan, Science Attache, Embassy of India, Washington, D.C.,
private communication, 1974.47. F. H. King, Farmers of Forty Centuries (Emmaus, Pa.: Rodale Press, 1910.48. C. H. Best and N. B. Taylor, The Physiological Basis of Medical Practice
(Baltimore, Md.: Williams & Wilkins Company, 1945).49. King, Farmers.50. H. van der Schalie, "World Health Organization Project, Egypt 10-A Case
History of a Schistosomiasis Control Project," in M. Taghi Farvarand J. P. Milton (eds.), The Careless Technology (Garden City, N.Y.:The Natural History Press, 1972).
51. Crop Reporting Board of the Statistical Reporting Services, AgriculturalPrices (Washington, D.C.: U. S. Department of Agriculture, September 1974).
52. A. B. Makhijani and A. J. Lichtenberg, "An Assessment of Energy andMaterials Utilization in the U.S.A.," Electronics Research Laboratory Memorandum ERL-3l0 (revised), University of California,Berkeley, September 1971.
53. Gyftopoulos et al., Potential Fuel Effectiveness.54. C. R. Prasad, K. Krishna Prasad, and A. K. N. Reddy, "Biogas Plants: Pros
pects, Problems, and Tasks," Economic and Political Weekly(Bombay) (August 1974).
55. Ibid.
For non-commercial use only.

For non-commercial use only.

Chapter Four
Fuel for Agriculture
Poor countries need all the energy they can get, as cheaply as they can get it.Previously, development policy in most underdeveloped countries has bypassedthe proper management and effective use of "noncommercial" energy sourcespartly because cheap oil was available, but also because technology is usuallyborrowed from the industrialized countries which have failed to develop and tapthese sources of energy.1, 2
We wish to examine, in light of the discussion of energy needs, andalso in view of the large increases in the prices of oil and fertilizers in 1973 and1974, the economics of decentralized energy sources in providing fuel andelectricity to Third World villages. A comparison of some decentralized systemswith current methods of providing energy for agriculture, primarily in the formof oil and electricity, reveals that in many instances the decentralized approachesare less costly while in others the centralized approach is more appropriate. In allinstances that we have studied, investments can and should be used more fully soas to reduce the capital costs of development and to increase the opportunitiesfor productive employment.
Among the decentralized technologies, we have devoted the mostattention to the conversion of organic materials to gas in village biogas plantsbecause it appears to be an economical way to provide fuel and fertilizers forThird World villages with a great, but so far almost untapped, potential. There isanother important reason. The basic raw materials for producing fuel and fertilizer in biogas plants-crop residues-increase as agriculture becomes more productive. In fact, the agriculture sector has the potential of taking care of its ownenergy needs and having some left over for the rest of the economy as well(being a net supplier of energy to the economy). In each of the prototypicalvillages of Chapter Two, the potential availability of biogas is larger thanthe fuels now used for farm machines and irrigation. Even in places wherepresent fuel use is large, as in Arango, Mexico, the potential from biogas is still
95
For non-commercial use only.

96 Energy and Agriculture in the Third World
greater than today's energy use in agriculture. Even in the U.S.A., where theamount of fuel and fertilizers consumed on farms is relatively enormous, potential availability for methane from crop residues and animal dung exceeds energyuse for agriculture." Of course, it will take, among other things, time and moneyto build these energy and fertilizer producing village plants. But the potential isthere and will grow with growing agricultural production.
Conventional technologies for providing fuel and electricity foragriculture and industry are not examined here because these have beenextensively studied both by governments and by international organizations.
The problems of coal production and use and the potential ofhydropower in India, for example, has been the subject of intensive investigationboth by the government'' and the World Banks The expansion of electric powerusing large hydroelectric and central station thermal power plants in SoutheastBrazil was the subject of an effort that lasted many years."
The economics of these conventional energy sources for supplyingenergy to industries and villages are relatively well known and well understood.Therefore, we will merely use the experience with conventional energy sourcesto compare them with some decentralized sources of energy which have notbeen as intensively studied or tested in practice.
SOLAR ENERGY
The solar energy that falls continually on the earth is the Third World's mostabundant energy resource. The solar energy that falls on Saudi Arabia alone eachyear is about equal to the entire proved reserves of coal, oil and natural gas inthe world.
The technologies for using solar energy are in varied stages ofdevelopment. Simple systems which use flat glass collectors to heat water fordomestic uses have been commercial for some time and are widely used in Japan.Similar solar heaters which heat air (instead of water) can be used for dryingfood. Such applications of solar energy are in many cases economical today,'but they cannot provide a substantial portion of the energy needed foragriculture.
Technologies to produce mechanical energy or electric power fromsunshine are not yet economical. However, the resurgence of interest in solarenergy caused by the oil price increases of 1973 and 1974 has already generateda significant amount of progress on various fronts. The direct conversion of solarenergy to electricity using solar cells is, for example, being intensivelyresearched, and in the U.S.A. recent reports indicate that a new process mayfinally reduce the cost of producing silicon solar cells to manageable levels."
An urgent program of research and development of solar energy
For non-commercial use only.

Fuel for Agriculture 97
technologies must be launched by Third World countries, with the cooperationof the oil-exporting nations and the industrialized countries if possible.
Solar energy as manifested in wind may have more immediateapplication in meeting one of the most pressing energy needs of agriculture:pumping water for irrigation. Producing electricity from wind is expensive,particularly if the electricity must be stored (in batteries, or in a variety of otherways). But windmills for powering pumps may be economically feasible in manyareas, especially if the windmills are also used for other purposes, such assugarcane crushing, when they are not being used to pump water.* An effort toevaluate the economics of windmills for multiple agricultural uses has, to ourknowledge, not been made and is urgently needed.
ELECTRIC POWER-INTRODUCTION
The usual way of supplying electric power for rural places is to generateelectricity in a large central plant and send it through an extensive transmissionnetwork to a wide area. The cost of electricity in the village, from large-scale oilor coal-fired thermal electric generating plants, is the standard against whichalternatives are usually measured. It will be the measure here.
Two important values must be carefully established before realisticchoices for development can be made. These are the capacity factor and the interest rate for invested capital. "Capacity factor" is the proportion of a powerplant's capacity which is actually in use, on the average, over a period of time.
The capacity factor in villages is very low. In India, the averageannual rural capacity factor is about 10 percent (800 kwh/kw)." This compareswith the 40 percent which is characteristic of urban demand in India and manyother underdeveloped countries.'? The effect of such low capacity factors is togreatly amplify the capital cost per unit of electricity generated and to reducethe relative importance of variable costs. Capital-intensive power supply systemswill therefore be at a disadvantage unless development takes place simultaneously with electrification and as power becomes available, its use for such purposesas irrigation for multiple cropping rises in such a way as to increase the capacityfactor.
The interest rate for capital is an important determining factor in thechoice of the technology to be used. A commonly accepted rule of thumb is 12percent!"; this figure does not include depreciation or inflation. While thisinterest rate is quite high as compared to rates that are sometimes used to justify
*A sufficient reduction in the cost of energy from windmills to make thempromising is made possible by the elimination of the electric generators and, particularly,electricity storage. The storage of energy is not critical in this system because the energyrequirements are spread over many days. A few windless hours would therefore not affectthe system, provided the needed energy is delivered during the several days or weeks when itis needed.
For non-commercial use only.
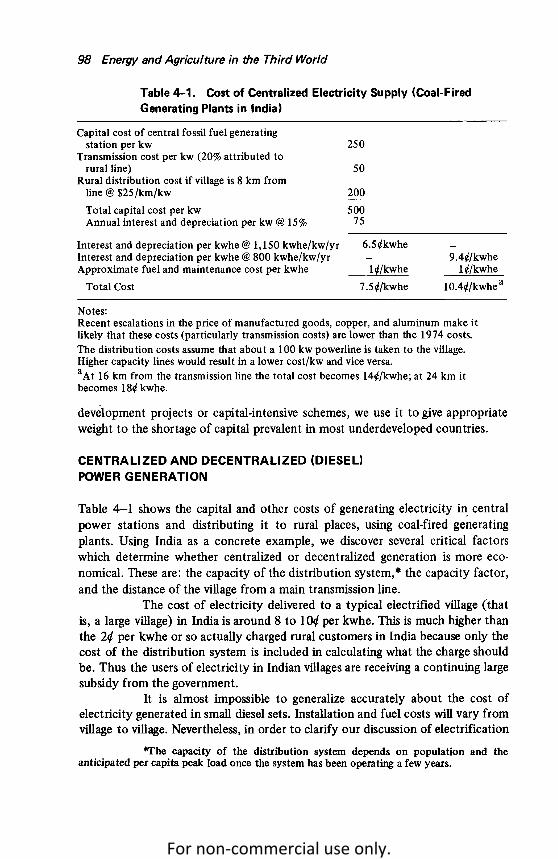
98 Energy and Agriculture in the Third World
Table 4-1. Cost of Centralized Electricity Supply (Coal-FiredGenerating Plants in India)
Capital cost of central fossil fuel generatingstation per kw 250
Transmission cost per kw (20% attributed torural line) 50
Rural distribution cost if village is 8 km fromline @ $25/km/kw 200
Total capital cost per kw 500Annual interest and depreciation per kw @ 15% 75
Interest and depreciation per kwhe @ 1,150 kwhe/kw/yrInterest and depreciation per kwhe @ 800 kwhe/kw/yrApproximate fuel and maintenance cost per kwhe
Total Cost
6.5¢kwhe
l¢/kwhe
7.5¢/kwhe
9.4¢/kwhe1¢/kwhe
1O.4¢/kwhea
Notes:Recent escalations in the price of manufactured goods, copper, and aluminum make itlikely that these costs (particularly transmission costs) are lower than the 1974 costs.The distribution costs assume that about a 100 kw powerline is taken to the village.Higher capacity lines would result in a lower cost/kw and vice versa.aAt 16 km from the transmission line the total cost becomes 14¢/kwhe; at 24 km itbecomes 18¢ kwhe.
development projects or capital-intensive schemes, we use it to give appropriateweight to the shortage of capital prevalent in most underdeveloped countries.
CENTRALIZED AND DECENTRALIZED (DIESEL)POWER GENERATION
Table 4-1 shows the capital and other costs of generating electricity i~ centralpower stations and distributing it to rural places, using coal-fired generatingplants. Using India as a concrete example, we discover several critical factorswhich determine whether centralized or decentralized generation is more economical. These are: the capacity of the distribution system, * the capacity factor,and the distance of the village from a main transmission line.
The cost of electricity delivered to a typical electrified village (thatis, a large village) in India is around 8 to lO¢ per kwhe. This is much higher thanthe 2¢ per kwhe or so actually charged rural customers in India because only thecost of the distribution system is included in calculating what the charge shouldbe. Thus the users of electricity in Indian villagesare receiving a continuing largesubsidy from the government.
It is almost impossible to generalize accurately about the cost ofelectricity generated in small diesel sets. Installation and fuel costs will vary fromvillage to village. Nevertheless, in order to clarify our discussion of electrification
*The capacity of the distribution system depends on population and theanticipated per capita peak load once the system has been operating a few years.
For non-commercial use only.

Fuel for Agriculture 99
Table 4-2. Cost of Electricity from Small-Scale Diesel Generator
Capital cost per kwa b $250Annual depreciation and interest per kw @ 17% 43
Interest and depreciation @ 1,150 kwhe/kw@ 800 kwhe/kw
Labor, maintenance, etc. cFuel costd
Total cost of electricity
3.7¢jkwhe
1.3¢jkwhe6.0¢/kwhe
l1¢/kwhe
5.3¢/kwhe
1.9¢/kwhe6.0¢/kwhe
13.2¢/kwhe
aInstalled high-speed diesel-electric set (100 kw).bInterest at 12 percent depreciation at 5 percent;cAssumes an annual cost of $1500 for a 100 kw plant for labor and maintenance.dAssumes generator efficiency is 25 percent and diesel fuel available in villages at $5.00/million Btu-$3.00/106 Btu diesel fuel in major center + 50¢/106 Btu distribution markup, + $1.50/106 Btu transportation cost. This last cost assumes a main haul of 500 km at1O¢/ton-km and rough road haul in bullock cart for 20 km at 20¢/ton-km.
alternatives, we will use the costs detailed in Table 4-2. High crude oil prices andthe transportation costs in underdeveloped countries make it unlikely that thecost of diesel delivered to the villagewould be less than $4 or $5 per million Btu.On the whole it appears that electricity from decentralized small-scale dieselgenerators is more expensive than power from central stations if the village isreasonably large (more than a few hundred people) and less than about 10 km toa high-tension transmission line (see Tables 4-1 and 4-2). As footnote a toTable 4-1 shows, the costs of electricity from central power stations is sensitiveto the distance of the village from a high-tension line. Indeed, at $25/kw thelocal transmission cost quickly becomes the major cost, so that beyond 10 kmsmall-scale diesel plants begin to look attractive. Higher capacity factors, alwaysdesirable, would mitigate this effect, and make centralized plants more attractive at longer distances.
In oil-exporting countries, such plants deserve serious considerationas they can be installed quickly, Of course, in countries such as India andBangladesh, oil competes with food for foreign exchange resources. Othersources of fuel for decentralized plants are more desirable.
USING BIOLOGICAL MATERIALS FOR ANENERGY SOURCE
Biological materials are the most important immediately viable decentralizedenergy source for electric power and for mechanical power as well. They can beused directly as fuel or converted to other forms.
The economics and technology of using wood and agriculturalwastes directly to raise steam for power production are not very favorable.Capital costs are high and the efficiencies of small plants are low (10 percent).
For non-commercial use only.

100 Energy and Agriculture in the Third World
Steam engine generating plants with a capacity of a few hundred kilowatts cost$600 to $800 per kw. Given the low capacity factors encountered in rural areas,electricity costs of 10¢ to 20¢ per kwhe may be expected even if we ignore fuelcosts.
The reduction of capital costs for small- and medium-scale powersystems using low grade fuels (those which have a low energy content per tonwhen compared to bituminous coal), such as wood, peat, and oil shale, should bean important priority for energy research and development because such fuelsare widely available. Many are currently economical in large-scale systems. Oilshale, for example, fuels a 1.6 million kilowatt electric generating station in theU.S.S.R. and produces power competitively with central station plants based oncoal.'? The residues from an oil shale power plants can be used for makingbricks, as aggregate for concrete, and so on. Many countries have oil shaleresources (e.g., Brazil) where this approach may be economically feasible.
The destructive distillation of wood in the absence of air (pyrolysis)is an ancient technology which may be an economic approach to providing fuelfor small towns, though not for most villages, since the plants required are toolarge and the costs of pyrolysis are sensitive to the size of the system.
Pyrolysis of wood (or other organic matter such as newspapers andfood wastes) produces charcoal, a medium Btu gas (10,000 to 18,000 Btu percubic meter compared to about 36,000 Btu for natural gas) and combustibleliquids with around 70 percent efficiency.13,14,15
We are not aware of any recent attempts to evaluate this oldtechnology-made obsolete by cheap oil-for use in poor countries in view ofcurrent high oil prices. However, there are a few indications that the economicsof wood pyrolysis may be attractive.
First, wood is currently used in China as a tractor fuel and was usedeven when prices of oil were IOW. 16 Possibily the high cost of transporting oil inrelatively small quantities to rural areas and the relatively slow pace of China'sexploitation of oil resources played a major role in favoring the use of wood insome areas.
Second, wood pyrolysis was phased out in the industrializedcountries because of cheap oil and the relatively high cost of labor (associatedprimarily with the collection and transportation of wood). Neither of theseconditions applies today to poor countries.
The capital costs of large plants (1,000 tons per day or more) forpyrolysing municipal wastes in the U.S.A. have been variously estimated to bebetween $3,000 and $20,000 per ton per day of capacity. These tentative costsare based on "experience with pyrolysing coal and oil and on limited laboratoryand pilot plant testing. ,,17 These costs include some expensive pollution controlequipment and are based on the high cost of construction labor in the U.S.A.These two factors would tend to lower capital costs in the poor countries, whilethe smaller-scale plants needed in most cases would tend to drive them up. If
For non-commercial use only.

Fuel for Agriculture 101
pilot plants built in poor countries show that the capital costs are in the $1,000to $5,000 per ton per day range, wood pyrolysis could provide a variety ofuseful and economical fuels, including some substitutes for imported oil, fortowns near sources of wood.*
BIOGASI FICATION
Biogasification is perhaps the most important technology for convertingbiological material to more useful forms of fuel. It can be put to widespread usein the near future, its economics appear favorable, and it produces organicfertilizers in addition to fuel.
In this process complex biological materials are broken down byanaerobic bacteria (that is, bacteria that work in the absence of atmosphericoxygen) to simple organic compounds which are in turn converted to methaneand carbon dioxide. Of the biological materials encountered in nature, onlymature wood appears to be largely resistant to breakdown. The plant materialand manure that comprise most agricultural residues are broken down. (Detailsand references on the biological, technical and economic aspects of biogasification are given in Appendix B.)
A biogas plant consists of digestors (the receptacles in which thebiogasification takes place), facilities for storing and slurrying the residues, andsometimes facilities for grinding the residues and drying the residuum from thedigestor. A system large enough to supply a village reliably should include two orthree digestors and gas storage.
The digestors produce an intermediate Btu gas (20,000 Btu/cu.m.)consisting primarily of methane (55 to 65 percent by volume) and carbondioxide. Standard techniques for the removal of carbon dioxide and the smallamounts of hydrogen sulfide can purify the gas and produce a high Btu gas(methane) similar to pipeline quality natural gas. The Monfort Company, in Greeley, Colorado (U.S.), plans to build a large biogas plant on its cattle feedlot andsell the purified gas to a natural gas pipeline company.
From the point of view of returning nutrients contained in biologicalmaterials to the soil, biogasification has an advantage over ploughing in manure,since the fertilizer is already in usable form, in contrast to manure which mustusually be allowed to decompose in the soil for many days before planting. Thisis especially important with multiple cropping, since prompt planting permitsmore crops.
The use of biogas as a basic energy resource for villages has been
*At a 70 percent conversion efficiency, one ton per day of (dry) wood wouldproduce about 4 billion Btu of fuel per year. If the plant capacity factor is assumed to be 70percent, a capacity of one ton per day would yield an annual output of about 3 billion Btu,or about $3,000 if one assumes an overall value of $1 per million Btu for the mix of fuelsproduced. The annual cost of wood at $5 per ton would be about $1,250.
For non-commercial use only.

102 Energy and Agriculture in the Third World
recommended by the Fuel Policy Committee of India'" and it is now the objectof special study of the National Academy of Sciences of the U.S. as a promisingsource for supplying energy to villages in the near future. Much of the work onthe development of small biogas plants has been done in'India,19,2o and in thepast year there has been a resurgence of interest in applying this technology tomeet some of India's fuel and fertilizer problems." Thousands of small biogasplants have been built on individual farms, particularly in India and Taiwan.Currently, most of the gas is used for residential purposes.
The basic resource-agricultural residue-is found wherever there areagricultural communities. The technology for converting these residues is alsowell enough understood for us to make a preliminary economic evaluation and acomparison of the costs of village electrification schemes based on biogas withthose based on central station generation.
A possible rather advanced village scheme is outlined in Figure 4-1.(As we shall see, proper phasing and use of capital dictate that such a schemewould be gradually built up over a number of years.) An important feature ofthis scheme is that farmers are paid for the residues which they deliver. The pricepaid for the residues will vary from region to region depending largely on theease of collecting the residue, the suitability of the residue for gasification, andwhether the wastes are currently used for other purposes such as cooking. Pricesmight vary from about 704 per million Btu of animal manure in North Indianvillages where dried manure is used for cooking fuel and is scarce, to 20¢ permillion Btu for crop residues or dung where these are abundant and are notpresently used.
Paying for raw fuel on the basis of energy content will favor thedelivery of crop residues for they have a much higher energy value per ton thanwet manure, which, in its fresh state, has a water content of up to 80 percent.This has an important advantage but may also create a problem which mustreceive simultaneous attention. The advantage is that it is more efficient togasify crop residues directly rather than feeding them to animals. If high pricesfor crop residues deprive cattle of their fodder, the result could be a reduction inthe number of cattle (which mayor may not be desirable), or still feebler cattle,or more overgrazing of pastures. The price paid for the fuel for the biogas plantshould ordinarily be based upon the prevailing wage rate and the fuel andfertilizer value of the material, but it may have to be modified and varied fromone year to the next depending on the availability of crop residues to takeaccount of the important indirect effects on the village economy.
The gas the plants produce which is not used immediately forelectricity would be compressed and stored. Bottled gas would provide the fuelfor farm machines and, if necessary, for cooking. The compressed gas could alsobe taken from storage and used to generate electricity to meet peak demands.Agricultural use of electricity is seasonal, but a digestor can only operate
For non-commercial use only.

~~
0-..,~
~
[C?QJ
high pressuregas
highpressure gas
----~~.I CookingI K: bottled (only in' fuel short
areas)
residue
,. I Residue Storage
crop drying,water heatingetc.
crop residues(organic) garbageanimal dung including lorganic materialhuman feces urine
Figure 4-1. Schematic Diagram of Village Biogas-Electricity Scheme System
~
For non-commercial use only.

104 Energy and Agriculture in the Third World
economically at consistent high capacity factors. Compressed gas storage is reltively inexpensive in both economic and energy terms.
The large amount of waste heat produced in the generating plant(about 75 percent of the total input) would be relativelyhigh grade heat with atemperature of about 300°C. Part of this heat could be used to regulate thedigestor temperature. The rest could be used for crop drying, producing rawsugar, heating water for domestic uses, and so on.
The residuum of undigested materials which leaves the digestor is anexcellent organic fertilizer. (For many of the high-yielding seed varieties, it willprobably be necessary to add chemical fertilizers to the organic sludge in orderto have the correct quantity and mix of nutrients that these plants require.) Itcould be returned to the land either mixed in the irrigation water or as asemi-solid, after dewatering. In some places such as North India and Tanzania,this return of nutrients would mean a large increase from present use offertilizer. In others, such as China and South India, it would reduce organicfertilizer losses inherent in composting, but the principal benefit frombiogasification would be the fuel produced. Digestor residuum does not attractflies which spread many diseases, and digestion at the right temperatures alsosuppresses the pathogens in human feces.
The safe disposal of human excrement (feces and urine) is one of themost important measures for the prevention of disease in Third World villages.*The pathogens that human excrement harbors (various species of bacteria,protozoa, and helminths) cause a variety of serious diseases such as cholera,typhoid, schistosomiasis, amoebic dysentery, and enteritis. These pathogens canbe destroyed by uniform heating to 60°C for 30 minutes to one hour. Inanaerobic digestors that operate in the intermediate temperature (mesophilic)range 25°C to 40°C, the pathogens may take several weeks to be destroyed.However, it is not clear whether organisms are as completely destroyed in themesophilic temperature range as they are in the thermophilic (40° to 60°C)which would apply to properly managed compost piles, or to anaerobicdigestors, appropriately heated, for example, with waste heat from a biogaselectricity generating plant. If field data indicate that intermediate temperaturesare not effective, and an electric generator is not installed with the biogas plant,then heating the excrement to the requisite temperature with gas before feedingit to the digestor may be necessary. The amount of heat required would beabout equal to the amount of gas generated from the feces. In thesecircumstances there would be no net gain in fuel from processing the humanexcrement; the gains would be in improved health and in the output of fertilizer.Composting of excrement, which may be cheaper but more difficult to manage,would achieve the same result.
Apart from the significant health benefits, large quantities of
*This discussion is based on the book Composting by H. B. Gotaas (note 22).
For non-commercial use only.

Fuel for Agriculture 105
fertilizers, particularly fixed nitrogen, can be recovered from human excrement(particularly urine which has a high nitrogen content). Building latrines could bea profitable proposition on the basis of the value of the recovered fertilizer. Toinduce people to use such latrines, the area or the latrines themselves could beequipped with a supply of water for sanitary purposes. If the operation isconducted on a nonprofit basis, an annual payment could be made to eachfamily for using the latrines, even if the other social, human, and economicbenefits are not taken into account.
Some approximate calculations for the costs and value of output forsuch a scheme are shown in Table 4-3. The cost of latrines is based on estimatesfor Indian villages made by the Khadi Village Industries Commlsston'" to whichapproximate costs of water supply have been added. An important point to noteis that the amount of nitrogen collected from human excrement (three-fourthsof it coming from urine) is 75 percent of that available in a much larger quantityof animal dung (excluding animal urine).
The labor required to collect the organic materials for the biogas
Table 4-3. Approximate Economics of Installing Latrines inMangaon for the Recovery of Fertilizers
1. Cost of 20 latrines excluding piping and water supply @ 50 each''2. Water supply and piping for 20 latrines3. Pump and piping to feed excrement to the biogas plant
4. Total capital cost
5. Annual interest (12%) and depreciation (3%)6. Annual labor cost (1 man-year)
7. Total annual operating cost
8. Value of nitrogen (80% of potentialb at $400/ton)9. Value of P20 S (80% of potentialb at $250/ton)
10. Value of K20 (80% of potentialb at $150/ton)
11. Total value of annual output?
12. Possible annual incentive payment per family of five
$1,0001,0001,000
$3,000
$ 450300
s 750
$1,200250100
$1,550
$ 4
aOne latrine for 10 families (50 people). One well, a small pump, and pipes would be themain costs of the water supply system.bWe have assumed the lower end of the values for the normal amount and the nutrient content of the human excrement (including urine) per person. As the people eat more and getmore protein, more nitrogen becomes available in the excrement. We have taken credit forall the nitrogen collected even though much or most of the human excrement is deposited inthe fields. With current practice, however, the nitrogen excrement is not uniformly spreadand is not available to most plants in the field. Some damage may even be caused to plantsnear the areas where people urinate. While some of the nitrogen would become available tothe next crop after ploughing, most of it (which is in the form of water soluble urea) wouldbe lost by leaching, by volatilization, and by bacterial degradation.cThe fuel value of the excrement has not been taken into account because it is assumed(conservatively) that the biogas generated from the human excrement will be used to preheat the feces to destroy disease-carrying organisms.
For non-commercial use only.

106 Energy and Agriculture in the Third World
plant would not need specialized training. General instruction in propermanagement of animal wastes, particularly urine, would be sufficient. A trainedvillager could operate a village biogas plant. More highly trained maintenanceand management personnel stationed in market towns serving 10 to 15 villages,*could provide assistance, and could take care of routine troubleshooting in acomplete biogas-electricity system. Still more highly specialized services mightbe provided from a regional center. This linking together of energy development at the village, market town and regional levels, like the integration ofother activities at these levels, as discussed earlier in this book and in many excellent works on the subject, is essential to the success of decentralized electrification.
The great problems in village development, including energy development, are political and organizational. Discussion of the merits and problems ofdecentralized schemes have rarely addressed this question.
Decentralized energy systems have often been dismissed on thegrounds that maintenance would be difficult. We mentioned earlier thatelectricity use in Indian villages declines even when the electricity comes from acentralized source, which points to a lack of maintenance in the villages. Muchof the capital investment for agricultural development must be made in the villages, in tubewells, pumps, motors, irrigation channels, and so on, whatever thesource of fertilizers or power. If these facilities are not maintained, then no program can achieve the goal of agricultural progress. If the personnel to servicethese essentially decentralized aspects of agricultural development are available,then the added problems of biogas plants and decentralized electricity generation should not be difficult.
To estimate the energy from wastes available for power generation,we must know the energy content of the basic resource-the agriculturalresidues. Neither the quantities nor the energy content of crop residues invillages have been satisfactorily measured. Accurate estimates require thefollowing information: (a) a breakdown of crop production in individual villages;(b) the agricultural residues associated with each ton of harvested crop; (c) theamount of crop residues consumed by animals; (d) statistics for the animalpopulation, including both numbers of animals of each type and the averageweight of these animals; (e) data relating to manure production and its qualitywith due regard to feeding conditions normally encountered in villages,and theease of collection of the manure.
None of this information is available in any authorative form. Wehave nevertheless attempted preliminary estimates of the available energyresidues in the prototype villages described in Chapter Two, which arerepresentative of many agricultural societies in the Third World.
Table 4-4 shows the amount of residues associated with a ton of
*The area that market towns can serve depends on a number of factorsincluding the rapidity of the means of transportation.
For non-commercial use only.

Fuel for Agriculture 107
Table 4-4. Estimated Residue Coefficients for Major Crops
ResidueCoefftcient"
Husked riceb
CorneCottond
Soybeand
WheatdBarleydRyed
Oatsd dGrain sorghumSugar caned dPotato, cassava
early varieties'ilate varietiesc
early varieties'ilate varietiesc
1.852.901.251.951.20
f3.002.60g
1.751.501.951.750.850.25
h0.20
aResidue coefficient is the ratio of the weight of dry matter of residue torecorded harvested weight at field moisture. For grains and straw fieldmoisture content is assumed to be 15 percent.bData are for India and are for the same crops (FAI, 1969).[24) Paddy is unhusked rice, when using agricultural statistics to determine residues. It isimportant to note whether the statistics are for rice or paddy. In calculatingthe residues from FAI (1969), rice hulls are included as residue. For earlymaturing varieties they amount to about 30 percent of the residue, while forlate-maturing varieties they amount to about 20 percent of total residue.<The major distinction in straw to grain ratios is not between dwarf and tallvarieties of rice (see FAI, 1969, p. 43) but between early and late maturingvarieties, the former including the new high-yielding varieties.dResidue coefficients as determined by individual crop experts and forwardedby Dr. Robert Yeck of the Agricultural Research Service of the United StatesDepartment of Agriculture, Washington, D.C. (25) Small grain estimates werefor straw and an additional factor of 0.25 for chaff has been included.eThere is a wide disparity in estimates of corn residue coefficients. IR&T(1972) estimate 0.55. (26) SRI (1974) use figures that imply a coefficient of1.2.(27)fBoth lint and seed are included in the harvested crop.gBased on SRI (1974) other estimates of residue coefficients are: IR&T(1972) 0.55; and 0.85-2.6 by the USDA as in (d) above. Soybean is taken tobe representative of other legumes.hData for potato comparison made on basis of similarity of habit.
harvested crop. These estimates are crude not only because of the scatteredmeasurements but, more importantly, because crop residues vary with thevariety of seed that is used.
Table 4-5 shows the data on the production of dung and itsfertilizer value. These data have been used to compute amount of energy andfertilizer available in organic wastes of the protypical villages of Chapter Two.The results are shown in Tables 4-6 and 4-7.
Table 4-6 shows that the amount of per capita energy that could be
For non-commercial use only.

Nitrogen Content PercentageofDry Matter
Table 4-5. Manure Production Data
Fresh Manure Assumedper 1,000 kg AverageLiveweight Liveweight
Animal (kg/yr) (kg)
1. Cattle 27,000 2002. Horses, mules,
donkeys 18,000 1503. Pigs 30,000 504. Sheep and goats 13,000 405. Poultry 9,000 1.56. Human feces
without urine 40 to 807. Human urine'' 40 to 80
Fresh ManureProductionAssumedper Head(kglyr Except Item 7)
5400
27001500500
13
50 to 10018 to 25 kg
dry solids/yr
Assumed Moisture Content ofFresh Manure(Percent)
80
80807060
66 to 80
Solid andLiquid Wastes
2.4
1.73.754.16.3
15 to 19(urine only)
SolidWastes Only
1.2
1.11.82.06.3
5 to 7
~
~Cllca'<:
~Q..
c6'~,c::~~
5'SoCll
:;!a~:::tQ..
Source: Note 22.aWe have not used the extreme of variations of nitrogen in human urine discussed in Chapter Three, but rather the more usual range as cited innote 22.
For non-commercial use only.

Table 4-6. Energy Supply from Agricultural and Animal Wastes
CurrentFuel Use
Crop Residue Potential for FarmEaten by. Net Energy csu«; Biogas Machines Potential
Crop Animalsb Available able d from and Ir- per CapitaResidue! Dung from Wastes Wastel rigation Energy
Popu- 106 Btu 106 Btu 106 Btu Wastel 106 Btu 106 Btu 106 Btu from BiogasVillage lation /yr % [yr /yr 106 Btulyr [yr /yr /yr 106 Btulyr
1. Mangaon,India 1,000 8,000 70 6,000 6,000 8,000 6,000 3,600 0 3.6
2. Peipan,China 1,000 20,000 30 6,000 5,000 19,000 14,000 8,400 3,000 8.4
3. Kilombero,Tanzania 100 800 10 100 500 1,200 800 500 0 5.0
4. Batagawara,Nigeria 1,400 6,000 10 600 7,000 12,000 9,000 5,400 0 3.9
5. Arango,Mexico 420 30,000 10 3,000 1,300 28,000 22,000 13,000 11,000 31.0
6, Quebrada,Bolivia(one parcela) 6 20 10 2 30 50 35 20 0 3.3
aThis table has been compiled from the data on residues in Tables 4-4 and 4-5 and from the agricultural production data in Chapter Two. Numbersare rounded. The energy value of crop residues is taken as 15 million Btu/ton, and dung at 14 million Btu/ton on a dry basis.bWe assume that in India and China, where grazing land is scarce, animals eat a large proportion of the crop residues. In Kilombero, Batagawara,and Quebrada, we assume that sufficient grazing land is available so that the animals get most of their food from the pastures. In Arango, the residues are so large that only a small fraction is required to feed the animals.cNet energy from wastes is equal to the energy value of the dung plus the crop residues not fed to the animals.dWe have assumed that a maximum of 70 percent of the cattle and horse dung can be collected, 80 percent for pig dung, and 30 percent for thedung of sheep, goats, and chickens. The efficiency of collection could possibly be even higher if the animals were kept in properly designed sheds.For crop residues, we assume that 80 percent of the residues not fed to animals can be collected.ewe assume a biogasification efficiency of 60 percent. This is a simplification because the yield will depend on the temperature in the digestor, itsdesign and the mix of the materials put into it. However, considering the uncertainty in the data, this assumption is probably a relatively minorsource of error.
~!:l0-'"':b~o·s,t:~
~
For non-commercial use only.

--Table 4-7. Annual Organic Nitrogen Supply in the Case Study Villages c
Excluding Human Excrement~C1lca
Nitrogen in Nitrogen Total Nitrogen -eNitrogen in Collectable Collectable Nitrogen Available s
Nitrogen Collectable WastesC in Human Collectable per Hectare Q.)::.
Cultivated A vailable in Wastesb (Solid and Liquid) Excrement in Solid and Cultivated~Land Net Residues" (Solid Only) Included, (Solid and Liquid) Liquid Land per ?).
Place ha kg. kg. kg. kg. d Wastes Year t::-~Mangaon, ca
India 300 10,000 4,000 7,000 3,000 10,000 33 5·Peipan, S-
Chinae 200 13,000 7,000 9,000 4,000 13,000 65 C1l
Kilombero, ~Tanzania 60 1,000 500 800 300 1,100 18 a:Batagawara,Nigeria 530 13,000 6,000 9,000 4,200 13,200 25 §
Arango, ;tMexicoe 380 7,000 5,000 6,000 1,700 7,700 20 Q.:
Quebrada,Bolivia(one parcels) 1 70 40 50 18 68 68
aWehave assumed a nitrogen content of 0.2 percent for crop residues.bPor animal and human excrement we have used the data shown in Table 4-5.cNet residues calculated as in Table 4-6.dWe assume that a maximum of 80 percent of the nitrogen in human excrement can be collected. For Arango and Peipan we have used intermediatevaluesfor the total nitrogen excreted per person per year, and for the other villageswe have used the low end of the range shown in Table 4-5. Therationale is that people of Arango and Peipan have more adequate diets which are also higher in nitrogen content (protein).eThe nitrogen figures for Peipan and Arango are probably underestimates since the crops are currently well fertilized. The nitrogen content of thecrop residues is probably considerably higher, especially since corn (which has a high nitrogen content in the residue) is a major crop in both areas.
For non-commercial use only.

Fuel for Agriculture 111
generated in the form of biogas-which can be used to power irrigation, farmmachines, and goods transportation-is not the same in all the villages. Arango,Mexico, contains much the largest potential. This reminds us that as agriculturalproduction increases, the production ofcrop residues increases with it. In energyterms, increasing yields of crop means that we capture solar energy moreefficiently. Crop residues can provide increasingamounts ofenergy to support agrowing agriculture.
We also see from Table 4-6 that the energy use for irrigation andfarm machines is in each case lower than the potential availability ofbiogas.
Table 4-7 shows a somewhat different picture for fertilizers. Exceptin the cases of Arango and Peipan, the quantities are several times the amountsof nitrogen fertilizers that are now used. But the available nitrogen fertilizerfrom manure varies a good deal and is often not sufficient to allow the use ofhigh-yielding seed varieties. Thus other sources of fertilizer are necessary.Phosphorous, potassium, and other trace minerals must usually be mined. (Ashesleft over from wood burning contain a large quantity of potassium, about 5percent by weight, and smaller quantities of phosphorous, about 0.5 percent,and other nutrients.) Fortunately, these mineral fertilizers are less expensivethan chemical nitrogen both because the per unit prices are lower and theamounts needed are usually less than the amount of nitrogen needed. Fixednitrogen can be produced in a number of ways (Chapter Three). Rotating cropsand planting legumes can not only provide protein for humans and animals butalso can produce nitrogen for the soil from the crop residues and the enrichedhuman excrement which the crop indirectly produces.
In most cases, however, planting several crops each year will requirethe use of chemical nitrogen. For example, a crop of soybeans plus all thecollectable organic wastes in Mangaon would provide perhaps half of thenitrogen requirements for growing a crop of rice and a crop of wheat in the sameyear. It would, of course, be a long time before Mangaon could achieve such anadvanced stage of agricultural development. We use this calculation only toillustrate that the use of wastes and chemical fertilizers are not mutuallyexclusive but, rather, complementary.
COST OF A BIOGAS-ELECTRICITY SYSTEMIN MANGAON
In this section we compare the costs of a biogas-electricity system in Mangaonwith the costs of conventional rural electrification projects in India which arebased on centralized electricity generation.
In comparing the costs of electricity produced in a biogas-electricpower system with a centralized system, one should take into account the valueof the fertilizer returned from the system to the land. In Mangaon this nutrientvalue is now lost, as virtually all collected manure is burned as fuel.
For non-commercial use only.

112 Energyand Agriculture in the Third World
Table4-8. Fertilizer Prices Paid by U.S. Farmers
Price in $/Ton
Fertilizer September 1974 September 1973 September 1972
1. Nitrogen (based onthe price of ureawith a 46% nitro-gen content) 555 231 198
2. Phosphorous (P2OS) ,
(based on super-phosphate with 46%P20S content) 451 225 187
3. Potassium (K2O),(based on potashwith 60% K20content) 167 117 105
Source: Note 28.
We have assigned a value of $400 per ton of nitrogen content, $250per ton of phosphorous (P205) content, and $150 per ton of potassium (K2 0 )content. These are lower than the September 1974 prices paid by U.S. farmersshown in Table 4-8. The prices paid by U.S. farmers have historically beenconsiderably lower than those paid by farmers in other countnes.P The(official) prices paid by Indian farmers for urea in October 1973 were, forexample, about $300 per ton of nitrogen content." or 30 percent higher thanthe September 1973 prices paid by U.S. farmers. Since September 1973 theprices of nitrogen in the U.S. have more than doubled. Prasad, Prasad, andReddy cited a retail price of nitrogen in India of about $550 per ton in June1974.31 * Moreover the actual prices paid by Indian farmers who cannot acquirefertilizers directly from the government may be much higher, and a bag offertilizer may change hands and prices several times before it is applied to thefield.32 We have used lower estimates than prevalent prices in order not tounderestimate the costs of operating biogas plants.
Table 4-9 shows the capital costs for two biogas-electricity schemes,one with provisions for supplying gas for cooking, the other without. The costshown in column A indicates that if half the biogas produced is used forcooking, the capital costs of the biogas is only slightly less than that for acentralized scheme (assuming a main transmission line exists at distance 8kilometers from Mangaon, Table 4-1, Chapter Four). This arises not only
*The high cost of chemical fertilizers, usually in foreign exchange, points upthe great value of composting as an immediate and cheap source of fertilizers in placeswhere agricultural, animal, and human wastes are not now used. OnlY unskilled labor andsome extension workers are needed to implement a composting program. Thoughcomposting (aerobic fermentation) does not yield fuel, as biogasification does, it will taketime and money to build biogas plants, and composting could serve as a valuable stop-gapmeasure.
For non-commercial use only.

Fuel for Agriculture 113
Table 4-9. Capital Costs of Biogasification-Electrification Systemin Mangaon (in 1974 Dollars)
Biogasification plant''Gas plant auxiliariesLand costGas storage and compression bCooking fuel distribution cylinders and gas stovelElectric generator with reciprocating gas engine and
switchgear @ $160/kw installeddConstruction supervision and training'i
Subtotal
Interest on capital during six months' construction @ 12%)
Total
Cost per kw
WithCookingFuelA
8,0001,0001,0001,5008,000
12,0001,000
32,500
2,000
34,500
$460
WithoutCookingFuelB
8,0001,0001,0001,500
22,5001,000
35,000
2,000
37,000
$265
aSee Appendix B. We assume two digestors, each producing 140 cubic meters of biogas perday. The gas production in columns A and B is the same. Exclusive of the energy use in thebiogas plant, the digestors will produce about 2 billion Btu of fuel per year, Digestor costsbased on notes 19, 20, 21.bStorage for 50 percent annual production of unscrubbed gas.cIncludes $6,000 capital cost for market town headquarters for 12 villages.dBased on mid-1974 quotation from a manufacturer in the U.S.A. and includes approximate shipping costs. In the scheme with cooking fuel we have 75 kw generator (Col. 1);without cooking fuel the entire output of the gas plant goes to the 240 kw generator. Agasoline engine or diesel engine can be substituted for the gas engine.
eColumn A assumes all 200 families in the village use methane for cooking, $6,000 forcylinders, $2,000 for stoves. Column B assumes zero use.
because of the costs of distributing and using cooking fuel but, moreimportantly, because only half of the gas produced can be used to generateelectricity. The capital cost per kilowatt of the biogas-electricity scheme withoutgas for cooking (column B, Table 4-9) is about half that of the centralizedscheme.
To reduce capital costs in the Gangetic plain, where fuel is in shortsupply and dung and crop residues are used for cooking, it will be essential toprovide a cooking fuel cheaper than biogas so that the entire output of gas canbe used for productive purposes. The washery byproducts of Bihar's coal minesfor example, be used as a cooking fuel.* However, since we do not haveestimates of the costs, we will not discuss it further.
One way to reduce the costs of supplying cooking fuel would be to
*The Report of the Energy Survey of India Committee" recommended thisstep in 1965, but did not provide cost estimates.
For non-commercial use only.

114 Energy and Agriculture in the Third World
increase the efficiency of burning crop residues and dung directly so that surpluscrop residues and dung can be gasified for use in agriculture. Efficient stovesdesigned along the lines of wood burning stoves." now marketed in the U.S. butmade of local materials like clay or bricks might be suitable. The Magan Choola,a cooking stove designed for use in Indian villages," modified to includedowndraft circulation could also be used. Burning dung and crop residues involves the loss of significant quantities of fertilizers and should be viewed only asa stop-gap measure until alternate fuels become available.
Prasad, Prasad, and Reddy, in their recent investigation of theeconomics of biogas plants in India,36 considered the possibility of waterhyacinth plantations as a source of raw materials for gasification in biogas plants.The water hyacinth, a very efficient convertor of solar energy producing 125 to200 tons of dry matter per hectare per year, could also be grown for direct useas cooking fuel in brick or clay stoves, bypassing the gasification step. * A onehectare tank supplying 140 tons of water hyacinths a year (about 2 billion Btu)would provide sufficient cooking fuel for Mangaon, if the fuel is used at twicethe efficiency of current use, but half the efficiency of gas burners.
Table 4-10 shows an approximate estimate of the costs of a biogaselectricity system combined with a one hectare water hyacinth plantation forcooking fuel supply. While the capital costs for the provision for cooking fuelwith water hyacinths are assumed to be greater than that of distributing andusing biogas for cooking ($10,000 compared with $8,000), the cost per kilowattof the biogas-electricity-water hyacinth scheme is much lower-$335 per kwcompared to $460. This is because the entire capacity of the digestors and storage can be devoted to electricity generation when the water hyacinth plantationsupplies the cooking fuel, whereas half the capacity of the biogas plant hasto be devoted to providing cooking fuel. The opportunity cost of using onehectare of land to supply cooking fuel would be negligible compared to thebenefit, since 1 billion Btu of biogas could irrigate two crops a year on 200hectares of land in Mangaon.
In most villagesof the world fuel supplies are not as tight as they arein the Gangetic plain. In fact, in most areas dung is not used as a fuel and thereare surplus crop residues which, if collected and gasified, would increase the fuelavailable for use in agriculture. For villages in such areas it would not benecessary to supply gas for cooking and the capital required for a biogas plant ora biogas-electricity system (per unit of annual gas production or per installedkilowatt) would be less than that for a village of comparable population in theGangetic plain.
The annual costs of the three schemes (shown in columns A and B of
*Experiments with biogasification of water hyacinths (of which we are aware)have not so far yielded good results (Appendix B). Experimental and field data are alsonecessary to determine the burning characteristics of dewatered and dried water hyacinthsin cooking stoves.
For non-commercial use only.

Fuel for Agriculture 115
Table 4-10. Capital Cost of Biogas-Electric System with WaterHyacinth for Cooking Fuel
1. Biogas-electricity system with cooking fuela
2. 1 hectare water hyacinth plantationv3. 200 cooking stoves at $30 each4. Water hyacinth dewatering, storage, and distribution
5. Total
6. Capital cost per kw
$37,0002,0006,0002,000
$47,000
s 335
a140 kw generator. Annual biogas production 2 billion Btu. See Table 4-9, column B.bThe construction costs of a water hyacinth plantation are assumed to be about the same asthose of a fish tank. The costs of the latter have been obtained from the Musahri Plan (note37).
Table 4-9 and in Table 4-10) are shown in Table 4-11. With the conservativeassumptions that are used in calculating these costs, the cost of electricityproduced in the scheme in which biogas would be is distributed as cooking fuelis slightly higher than the cost of the centralized scheme shown in Table 4-1 ofthis chapter. For the other two cases the cost of electricity would beconsiderably lower (5.8¢ per kwhe compared to 7.5¢/kwhe). In the case wherewater hyacinth is distributed as cooking fuel, the price charged is $1.00 permillion Btu, and its efficiency of use is assumed to be half that of the gas stove.It is assumed that no charge will be made for the special stoves needed in eithercase.
One of the conclusions to be drawn from Tables 4-9 and 4-11 isthat, contrary to current practice, biogas should not be used for cooking unlessnecessary.
The cost of manure collection in Table 4-11 is high because it isassumed that only animal dung is used in the biogas plant. Crop residues containabout five times as much energy per ton as wet dung so that the cost per millionBtu of input to the digestor, and hence the cost of electricity, would be loweredas more crop residues are used (that is, as more food is grown and surplus cropresidues become available). The cost of electricity depends critically on thefertilizer content of the residuum in the biogas digestors. In Table 4-11 we haveassumed that only the nitogen in the solid portion of the dung is available. Thisgives an annual production of four tons of nitrogen, two tons of phosphorous(P2 0 S ) , and two tons of potassium (K2 0 ). Proper preparation of householdstables (or common stables) with straw, sawdust, and other cellulose litter willabsorb the urine (see note 22). This would increase the nitrogen available toseven tons per year with smaller increases in phosphorous and potassium. Thenitrogen can be further increased to 10 tons of nitrogen per year if latrines forcollecting human excrement are installed and widely used. The data in Table4-12 show that when animal urine is included the cost of electricity in all cases
For non-commercial use only.

116 Energy and Agriculture in the Third World
Table 4-11. Annual Costs for Three Biogas·Electricity Schemes forMangaon, India
A B CWith Biogas No Cooking Water Hyacinthfor Cooking Fuel Provi- Plantations forFuel sion Cooking Fuel
1. Annual interest andand depreciations $ 5,700 6,100 7,600
2. Residue collection at $2/tonfresh manure 2,600 2,600 2,600
3. Local labor and main-tenanceb 1,300 1,300 1,300
4. Market town services 500 500 5005. Labor for distributing
cooking fuelv 300 600
6. Gross annual costs $10,400 10,500 12,600
7. Credit for cooking fuelsalesd $ 2,000 2,000
8. Credit for fertilizers 2,400 2,400 2,400
9. Total credits $ 4,400 2,400 4,400
10. Net annual operating cost $ 6,000 8,100 8,200
11. Annual electricity genera-tion at 1,000 kwhe/hwf 75,000 kwhe 140,000 kwhe 140,000 kwhe
12. Cost per kwhe 8.0¢ 5.84 5.9¢
alnterest rate 12 percent. Biogas plant (digestors) and water hyacinth plantation depreciatedat 3 percent per year, other capital at 5 percent per year.bAbout one man-year, plus parts.cOne man-year for distributing gas. Two man-years for processing and distributing waterhyacinths.dCharge for biogas used for cooking $2.00 per million Btu. Charge for water hyacinth forcooking $1.00 per million Btu. Cooking stoves provided free.eCredit taken only for fertilizers available in the solid portion of collected dung-fow tonsof nitrogen at $400 per ton, two tons of phosphorous (P2 Os) at $250 per ton, and two tonsof potassium (K20) at $150 per ton.fEngine-generator efficiency 25 percent. An electricity generation of 1,000 kwhe/kw hasbeen assumed. This capacity factor is less than capacity factor of 1,150 kwhe/kw used forcentralized plants for the purposes of comparing the two systems because the decentralizedplants will require a somewhat larger installed capacity for the same load due to relativelyheavy demand that motor starting requirements will place on the decentralized system.
is lower than that of the centralized system. The costs of electricity and biogasare lowest when human excrement is also used. The cost of compressed biogasfor agricultural use is also shown in Table 4-12.
REDUCING CAPITAL COSTS
The foregoing discussion of costs is based entirely on current patterns ofelectricity use. These are wasteful of capital. Rapid development will require
For non-commercial use only.
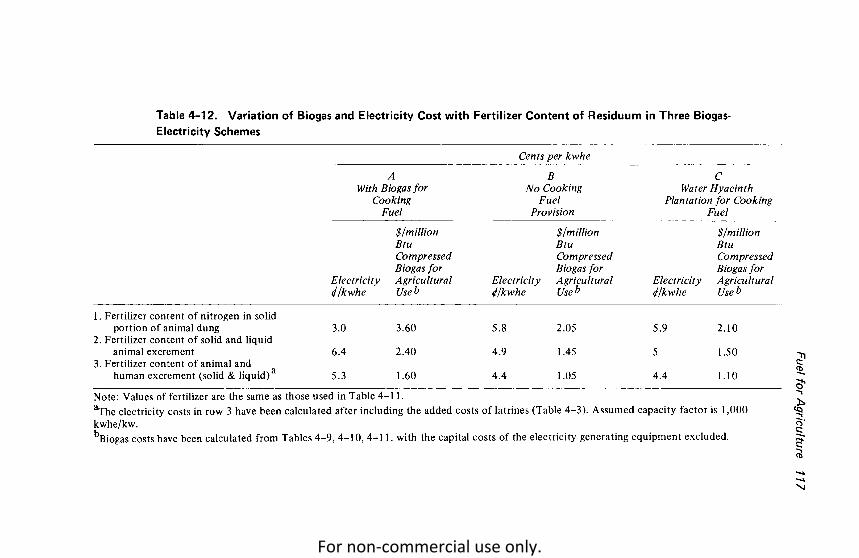
Table 4-12. Variation of Biogas and Electricity Cost with Fertilizer Content of Residuum in Three BiogasElectricity Schemes
Cents per kwhe
AWith Biogas for
CookingFuel
BNo Cooking
FuelProvision
CWater Hyacinth
Plantation for CookingFuel
Electricity[Ikwhe
$/millionBtuCompressedBiogas forAgriculturalUseb
Electricity<I/kwhe
$/millionBtuCompressedBiogas forAgriculturalUseb
Electricity<I/kwhe
$/millionBtuCompressedBiogas forAgriculturalUse b
1. Fertilizer content of nitrogen in solidportion of animal dung 3.0 3.60 5.8 2.05 5.9 2.10
2. Fertilizer content of solid and liquidanimal excrement 6.4 2.40 4.9 1.45 5 1.50
3. Fertilizer content of animal andhuman excrement (solid & liquid) a 5.3 1.60 4.4 1.05 4.4 1.10
Note: Values of fertilizer are the same as those used in Table 4-11.aThe electricity costs in row 3 have been calculated after including the added costs of latrines (Table 4-3). Assumed capacity factor is 1,000kwhe/kw.bBiogas costs have been calculated from Tables 4-9,4-10,4-11, with the capital costs of the electricity generating equipment excluded.
~!:t0-..,h~n'c::~~--""'.J
For non-commercial use only.

118 Energy and Agriculture in the Third World
that capital be used much more effectively than it has been previously, the moreso for countries that are hard pressed to pay for food, fertilizer, and oil imports.In India rural electrification and irrigation account for almost all thegovernment's rural capital investment. If the cost of these programs is to bereduced-so they can be offered to more people-it is imperative to improve thecapacity factors as this will make electricity from whatever source, central orlocal, and from whatever fuel-cheaper. Figure 4-2 which shows a graph ofelectricity cost versus capacity factor illustrates this principle, and shows theenormous reduction in electricity cost achieved when improvement of only afew percent is made in the prevelant low capacity factors.
Typical Rangeof Rural Capacity Factors
Central Station Generation (from Table 1, Chapter IV)
Biogas-Electricity System-No Cooking Fuel(from Table 11, column B, Chapter IV)
706020 30 40 50------. Capacity Factor %
", ....,........ .......
..._-----------------
20
18
16
1! 14~~........en..... ,ca 12
,,ti ,0 ,o ,> ,o~ 10 ,0'::: ,..... ,u~ ,UJ ,
i 8,,
\\\
6
4
2
00 10
Figure 4-2. Variation of Electricity Cost with Capacity Factor.
For non-commercial use only.

Fuel for Agriculture 119
In most cases it would be preferable to delay the introduction ofelectricity until a sufficient capacity for its use has been built up. Irrigationpumps and farm machines could be powered by internal combustion engines(the same ones for both purposes so far as possible). This would reduce thecapital cost of providing energy for agriculture considerably. As illustrated inTable 4-13, the costs per unit of useful energy obtained from an internalcombustion engine directly are much lower than the corresponding costs forelectricity because the intermediate generating step is eliminated. As the smallindustries in the villagedevelop, electricity could be introduced.
Electricity is desirable for irrigation and for powering stationarysmall machines because electric motors are more reliable and need much lessmaintenance than internal combustion engines. After electricity is introduced,the internal combustion engines could be used on farms for transporting surplusproduce to market towns as well as for some stationary applications such assugarcane crushing.
Electrification is important not only for its obvious uses inagriculture but also for the positive psychological effect it has on people'sattitudes, for establishing a modest communications system, and so on. From anenergy point of view, using local energy resources to generate electricity has anenormous advantage both over centralized generation and the use of fuels inmany dispersed internal combustion engines. The waste heat, which is usually300°C or higher, can be put to many beneficial uses, such as crop drying, rawsugar, manufacture, water heating, operating biogas plants at higher temperatures to produce more gas from the same digestors, district heating in cold areas,combined steam and electricity generation in market towns, and so on.
Figure 4-3 shows a comparison of the efficiency of decentralizedsystems using agricultural wastes and centralized electricity generating system.
It will be noted that the centralized system can provide electricityonly; fuel for machines that power mobile equipment must be provided fromanother source. Nor can waste heat from the centralized system be deliveredeconomically for agricultural use.
In the three systems using crop residues, little of the waste heat canbe recovered if the biogas is compressed and used in dispersed machines. In asystem where stationary engines use the gas to generate electricity, largequantities of high-grade usable waste heat are recoverable for the applicationsmentioned above.
A comparison of two village systems in parts (a) and (b) of Figure4-3 shows that energy is used more efficiently if crop residues are gasifieddirectly than if the animals are fed these residues and the dung is gasified. Theamount of high-grade waste heat to be captured and used is also much greaterbecause the large energy losses of the animals' metabolism are avoided. Of course,animals are the largest source of power on the farm in underdeveloped countries,and this stock of capital should be put to effective use. The amount of useful
For non-commercial use only.

Table 4-13. Comparison of the Costs of Useful Energy for Agricultural Use from Electricity and Biogas (Dollars per
Million Btu of Useful Energy)
Elecmcity'' Biogasb
CWater Hyacinth
Plantation forCooking
1. Fertilizer content in solid portion of animal dung2. Fertilizer content of solid and liquid animal
excrement3. Fertilizer content of human and animal excrement
(solid and liquid)
A BWith Biogas for No Cooking Fuel
Cooking Fuel Provision
Electricity a Biogai Electricitya Biogasb
25.70 18.00 18.80 10.30
20.60 12.00 15.80 7.30
17.10 8.00 14.20 5.30
19.00
16.00
14.30
11.00
7.50
5.50
~
~CI)
ca"<
sQ...~
~o'~e~
:s'sCI)
:;!a~~Q...
a1 kwhe = 3,413 Btu. Assume efficiency of electricity use = 90%, that is 3,100 Btu of useful energy per kwhe generated.bAssume efficiency of biogas use = 20%, that is 200,000 Btu of useful energy per million Btu of biogas.Source: Table 13 derived from Table 12 using above efficiencies. Costs rounded to nearest 10 cents. Electricity generating plant capacityfactor 1000 kwhe/kw/yr. Higher capacity factors would result in reduced electricity costs.
For non-commercial use only.

Metabolism0.45-0.47 Loss
CropResidues
Useful Work 0.03-0.05
0.4 Loss
0.1 CollectionLoss
0.16Conversion Loss
InternalCombustionEngine·Generator
0.06 Electricity(a) Animal-Biogas System
0.23 Loss
0.09 Loss
0.09 Heat
Total Useful EnergyObtainable .. 0.19
CropResidues
Total Useful EnergyObtainable .. 0.37
0.15 Electricity 0.22 Heat
(b) Crop Residue Biogas System
CropResidues
0.1 Loss
0.5 Industrial Steam(Medium·LowPressureandTemperature)
Total Useful EnergyObtainable .. 0.7
Figure 4-3. Efficiency of Four Systems for Providing Energy to aVillage or Market Town
0.2 Electricity
Oil,Coal
0.2 Loss 0.45
(c) Market Town Total Energy System
0.07
Total Useful EnergyObtainable .. 0.28
0.25 Electricity
(d) Central Station Generation for Rural Electrification
"'1'l~-0-..,h
CQ
[eca
-I\)-For non-commercial use only.

122 Energyand Agriculture in the Third World
energy derived from draft animals can be increased several fold if the dung isused efficiently. The current efficiency of using crop residues for animal feed,animals for farm work, and dung for cooking is around 6 to 7 percent in India.
Part (c) of Figure 4-3 illustrates a system for using crop residues inmarket towns to supply electricity and industrial steam.* Such a system isenergy efficient, but it has two major disadvantages. First, it fails to recycle mostof the nutrients contained in the crop residues; second, for small market townsthat do not have a large demand for electricity the system would involve ratherhigh capital cost ($500 to $800 per kw). The total costs could, however, bereduced if the steam were used in an industry with a low capital/output ratio.
Of course, using central power plants to supply electricity to markettowns, with populations of 5,000 or more people and diversified industry andcommerce, would in many countries be at least as economical as supplyingenergy with crop residues.** Fuel supply in towns and cities with sewagesystems can be increased by the recovery of fuel in sewage treatment plants-astandard technology that operates on the same principle as small biogas plants.In India all large villages and small towns already have electricity. The chiefproblem is to use the invested capital efficiently, rather than to develop theelectricity supply.
But in many African countries, in mountainous regions and otherareas where electricity grids do not exist, it would be extremely expensive tocreate these grids just to supply electricity to market towns and villages. In suchcases the question is not whether decentralized or centralized electricity supplyis cheaper, but whether electricity can be supplied at all with centralized sources.
The direct employment effects of investing in central power plantsversus decentralized village systems are radically different. Leaving aside theincreased employment in agriculture that both systems produce, let us focus onthe jobs they create directly. Using Mangaon as a model, the villagebiogas-electricity system creates 10 times more jobs, for the same output, thancentralized electricity and fertilizer plants. The number of people required tooperate a decentralized system can suit the need for jobs in the village. Forexample, the number of jobs can be kept constant as energy production expandsif some cattle are housed in common sheds, or if more crop residues are useddirectly for gasification, so that less labor is needed to collect raw material forthe biogas plant. Likewise, the plant can gradually be mechanized, if the village'sneed for jobs levelsoff.
*Dung would probably be too expensive to transport.**In large market towns, crop residues could be gasified and the gas used as
feedstock to manufacture chemical nitrogen. This could only be done when a considerablesurplus of crop residues is available. A plant producing 10,000 tons of nitrogen per yearwould need abuut 100,000 tons of crop residues per year. This would mean an agriculturalarea of 1,000 square kilometers (radius about 18 km) would have to generate a crop residue surplus of one ton per hectare to supply the plant.
For non-commercial use only.

Fuel for Agriculture 123
Finally we compare the overall capital costs of supplying electricityand fertilizers to an Indian village such as Mangaon, India, with the centralizedand decentralized schemes. Table 4-14 shows that if biogas is used for cooking,the costs would be only about 15 percent lower than that of the centralizedscheme. Using the water hyacinth scheme to supply the cooking fuel wouldmake this decentralized scheme 35 percent cheaper, and if cooking fuel is notrequired but other conditions are similar to those prevailing in Mangaon, thedecentralized scheme costs only half as much as the centralized approach.
Table 4-14. Comparison of Capital Costsfor Centralized andDecentralized Schemes, Mangaon, India (Dollars)
Decentralized Schemes
A B CBiogas No Water Hya-for Cooking cinth forCooking Fuel Cooking Centralized
Provision Scheme
34,500 b b 40,000c
37,500 b b 44,000
a 37,000 47,000 73,000
Installed Capacity
75 kw electricity a+ 4 tons nitrogen per year+ 2 tons P20S per year+ 2 tons K2 0 per year
75 kw electricity a+10 tons nitrogen per year+ 3 tons P20 S per year+ 3 tons K20 per year
140 kw electricity+ 4 tons nitrogen per year+ 2 tons P2 0 S per year+ 2 tons K20 per year
140 kw electricity+10 tons nitrogen per year+ 3 tons P2 Os per year+ 3 tons K20 per year
a 40,000 50,000 80,000
aThe higher of the two estimates of fertilizer production in the decentralized scheme include the fertilizer content of animal urine and human excrement (solid and liquid).While the lower estimates include only the fertilizer content of solid animal manure. Anapproximate capital cost of $3,000 has been added to account for the cost of the latrines(Table 4-3).bThe capacity of the digestor is the same in all cases. When biogas is used for cooking, theinstalled capacity of the electricity system is lower, assuming the same capacity factor.cCentralized electricity supply costs $500 per kw (Table 4-1). The capital cost of a capacityof one ton per nitrogen fertilizer (nitrogen content) per year is about $400 based on thecosts of a coal- and oil-based plant currently being built in India. (Capital costs for anatural gas-based plant are around $250 per ton) (note 38). The capital cost of one ton peryear of P20S or K2 ) capacity is assumed to be $100.[39] In addition, an investment about$200 per ton per year of nitrogen fertilizer capacity is needed to produce the requisite coaland oil for the fertilizer plant.
For non-commercial use only.

124 Energy and Agriculture in the Third World
FUEL FOR FARM MACHINES
Even more than with rural electrification, a principal problem with supplyingfuel for farm machines is not so much the price of oil relative to other sourcesbut the foreign exchange shortage. In many countries, due in part to high oil,fertilizer, and food prices, a lack of enough foreign exchange makes it impossibleto import enough oil to fuel farm machines and the irrigation pumps powered byinternal combustion engines. Thus in Punjab, Northwest India, which suppliesthe country with most of its surplus wheat,40 many tractors and irrigationpumps lay idle in 1974 because farmers could not get enough oil.
In relatively large villages (say, 500 or more people) where gas forcooking is not required, biogas would be a cheaper fuel than oil for fueling farmmachines and small trucks or tractors with trailers. For example, a farm machineused 10 hours a day for 15 days will require about 10 million Btu of fuel,assuming an average power output of 5 horsepower. Diesel fuel delivered to thevillage will cost over 50¢ a gallon (about $4 per million Btu), and gasoline will beeven more. Oil costs for such an operation are likely to be about $40, and in allcases this is in foreign exchange funds, either spent or not earned. Fuel from abiogas plant can be provided for $25 or less, including the cost of the gascontainers and compression equipment.
Where biogas must be used for cooking and no use is made of thefertilizer content of animal urine or human excrement, the costs of biogas andoil for farm machines are comparable.
In villages smaller than 100 people, the costs of the compressors andother equipment needed to bottle this gas may make oil the cheaper alternativeeven at present high prices, particularly if there are only a few farm machines.The relative economics in such cases would also be greatly affected by the location of the village since transporting oil to remote places is quite expensive.Maintaining equipment properly in isolated places may also be expensive. But ifthere are many small villages within a radius 10 or 20 kilometers, biogas wouldprobably be the cheaper alternative since common maintenance facilities could beprovided. The decision for small villages must be made on a case-by-case basis,considering the development needs and settlement patterns of each area.
In sum, the discussion of energy needs and the calculationspresented here indicate that the fuel and fertilizer needs of villages and markettowns in the Third World can best be met by a combination of the centralizedand decentralized approaches, rather than by the centralized approach alone ashas been the case so far. The potential of rural sources of fuel and fertilizers inspurring agricultural growth seems great. Pilot projects are needed to determinemore accurately the costs and problems of implementing such decentralizedprojects in different areas of the Third World.
For non-commercial use only.

Fuel for Agriculture 125
A SIMPLE ILLUSTRATION RELATING ENERGYNEEDS AND ENERGY SUPPLY TOAGRICULTURAL PRODUCTION
As a specific illustration of the concepts presented in Chapters Three and Four,we examine the potential for agricultural development in Mangaon, India.Because of its poverty, and the scarcity and low productivity of land in thatregion, the resource constraints are greater than they would be in most otherregions. In the Sahel region, the problems may be related to long-term climaticchanges; in the Andean region it is the scattered nature of the agricultural settlements that presents major social and economic obstacles to development.
A sketch of Mangaon as it is today-with its one crop per year, lessthan one ton per hectare economy-was presented in Chapter Two. Thepotential for agricultural production, labor and land productivity, and numberof productive jobs, is immensely greater. Water resources are abundant; the landis fertile; there are plenty of fish in the rivers.
To explore the potential of the region, let us examine whether intheory (that is, institutional constraints aside) it is possible for Mangaon to growenough food for its own people and export half of the food it produces. Let usdefine "enough food," for simplicity, as 2,500 kilocalories and 70 grams ofprotein per person per day (see Table 4-15).
We assume that the population of Mangaon will grow at about 2percent per year. Initially, the provision of medical care will probably increasethe population growth rate. However, simultaneous economic development, withdue attention to the various factors affecting birth rates, should work towardlowering the birth rate substantially as the development programs take root.
The results of our calculations should not be interpreted literally, for
Table 4-15. Food Needs of Mangaon
1. Gross supply of milled wheat and rice2. Net supply of wheat and rice assuming 20% for seed
and grinding and storage losses.3. Total annual wheat and rice production requirements
for 1,100 people.4. Protein intake from grain assuming 7% protein
contained in processed grain.5. Gross protein supply required from other sources
(pulses, fish, milk).a6. Total annual protein required from other sources
for 1,100 people.
700 gms/day/person
550 gms/day/person
290 tons per year
38 gms/day/person
35 grns/day/person
14 tons per year
aPulses, fish, and milkwould also provide for the remaining caloric intake.
For non-commercial use only.

126 Energy and Agriculture in the Third World
they are simplified and represent only one hypothetical example of what couldbe achieved within today's technical and economic constraints.
The principal constraints we consider, other than the fixed amountof agricultural land, are these:
1. No source of energy is available from outside the village. This isrelated to the foreign exchange shortage which limits oil imports, and to manydiverse problems with India's coal industry.
2. No more than 15 kgjha of chemical nitrogen per year is availableduring the intial period of five years. This corresponds approximately to India'scurrent capacity to produce chemical nitrogen.*
3. The capital available for borrowing from outside the village is nomore than $10 per year per person.
Because of the warm climate, fertile soil, and plentiful supply ofwater, three or more crops a year can be grown in Mangaon (except sugarcane,which takes a full year to mature). Recall that in the Hunan region of China,which is somewhat colder than Mangaon, growing three crops a year iscommonplace.
Growing three crops a year requires irrigation and fertilizers, and weassume it requires one horsepower per hectare of farm machines. Constraints oncapital available from outside the village will limit the initial rate at whichprojects can be undertaken, assuming that, to begin with, there is no capitalavailable in the village.
We assume that a loan of $10,000 per year ($10 per person) can beobtained at a 12 percent interest rate, to be paid back in husked grain at 30¢jkgand that the first payment would be in the fifth or sixth year. Repayment of theprincipal and interest in the form of food effectively makes the investmentinflation-proof, in an economy where prices are in large measure determined byfood prices. It would also make it easier to pay for the labor invested in futuredevelopment projects with food, a policy which is desirable to elicit an adequatesupply of labor and good quality of work.
The cost of tubewell irrigation (excluding the cost of the engines andenergy supply) is about $150 per hectare.** Farm machines would cost about$20 per hectare ($300 for a 15 horsepower tractor, manual starter). Weassumethat the engine of the farm machine would also provide the motive power forthe irrigation system. If we add $20 per hectare primarily for drainage works(important in the Gangetic plain) and $10 per hectare for contingencies andother small but important investments such as food storage, we find that,excluding energy supply, $10,000 would irrigate and supply the farm machinerequirements for about 50 hectares.
*Constraints on other fertilizer materials and pesticides are ignored for thesake of simplicity. Organic insecticides, such as the general purpose insecticide extractedfrom pyrethrum flowers, can be used if necessary.
**Throughout this illustration we have used the data of the MusahriPlan writtenby Ranjit Gupta (note 37) as the basis for estimating the capital costs and employment.
For non-commercial use only.

Fuel for Agriculture 127
A biogas plant to convert dung to methane and organic fertilizerwith a capacity of 1 billion (109
) Btu of biogas per year would cost about$10,000. This includes interest during construction and facilities for supplyingand distributing cooking fuel. Forty percent of the fuel would be set aside forcooking to replace the dung so used.* Wehave used the estimates for the biogasplant with gas for cooking (column A, Table 4-9, Chapter Four), since the costfor the water hyacinth system (Table 4-10) is somewhat speculative. Noelectricity would be generated in the initial period, and the gas would supplyfuel for cooking (400 million Btu), for farm machines and irrigation pumps on50 hectares (500-550 million Btu), and for operating the biogas plant compressor and pumps (about 50 million Btu).
The biogas plant would also supply 3 tons of fixed nitrogen, I ton ofphosphorous (P20S ) , and 1 ton of potassium (K20) per year. We assumeconservatively that only one-third of the animal urine is collected with the dung,and that no provision is made to collect human excrement. If 10 kg of chemicalnitrogen were available for each of the 300 hectares in Mangaon (that is, aboutequal to the current use), and if it were used only on the irrigated land, the totalsupply of nitrogen, organic plus chemical, would be about 120 kg/ha. The phasing of the project should be such that the gas plant is completed before the firsttube-well comes on line. The total cost of this initial phase would be $21,000, orabout two years' supply of capital. This would include $1,000 for the chemicalnitrogen and the $20,000 in capital assets built during the period. Some of thebenefits could, however, be derived during the first and second years, since thegas plant can be built in a few months. The construction during this phase wouldemploy about 40 people full time (270 days a year) for two years.
Let us assume that on the 50 irrigated hectares three crops-say,wheat, rice, and green beans-are planted during the third year. A rice yield of2,000 kg/ha (husked)-which is the average for Punjab, and much less than theyields in Taiwan and Japan-would increase Mangaon's rice supply by 50 percentfrom 120 tons to about 180 tons; this assumes that the 50 hectares irrigatedwere initially used for rice production. A wheat yield of 1,500 kg/ha, which ishalf that often obtained in Punjab with high-yielding varieties, would increasethe wheat supply by 300 percent from 25 tons to 100 tons. When this iscombined with a bean yield of 1,000 kg/ha (dry weight), the total foodproduction would just about supply Mangaon's food needs as listed in Table4-15. In addition, the fuel value of the crop residues would be increased from8 x 109 Btu to about 13 x 109 Btu. Just the extra fuel could supply all ofMangaon's agricultural energy needs for growing three crops a year on each of
*Table 2-4, Chapter Two, shows that 2 billion Btu of dung supplies abouthalf the cooking fuel for Mangaon. Producing 1 billion Btu ofbiogas per year would requireabout 1.65 billion Btu of dung. This means that 40 percent of the people in Mangaon wouldneed a replacement fuel for cooking.
For non-commercial use only.

128 Energy and Agriculture in the Third World
the 300 hectares. This initial phase would create at least 20 permanent jobs inagriculture and maybe even twice that number.
If the next two years' capital were used in the same fashion,Mangaon could export about 130 tons of grain (wheat and rice) and 50 tons ofbeans. At 30¢/kg this amounts to $54,000. The total increase in annual foodproduction at the end of the fifth year would be about 360 tons-around$108,000. This is about twice the capital invested, including a 12 percentinterest rate. From this point on it should theoretically be possible not only torepay the loan but to finance additional development with locally generatedsavings. Table 4-16 and Figure 4-4 show these financial and production aspectsof the scheme in more detail. Note that if 25 percent of the production isretained by the village cooperative to pay back the loan and invest in furtherdevelopment, capital from outside the village is required for only four years.
70
1st Repayment Installment
60
o8.~ 50en.S"0c:Cll1;;...<5 40c:Cllo
...J
3rdInstallment
....oc: 30:::JoE«
120
10
Annual $10,000Loan 4th
Installment
Final Installment
2345678~ Years from Start of the Project
ou...._..L-_-'-_~__.L-_-I-_~_~__......--
Figure 4-4. Borrowing and Repayment Schedule for Mangaon
For non-commercial use only.

Table 4-16. Investment and Output in a Multiple Cropping Scheme for Mangaon
TotalAnnual Increase inLoanb Annual Output':
Yeara $ $
0 10,0001 10,000 small2 10,000 ?3 10,000 54,0004 81,0005 108,0006 135,0007 162,0008 189,000
Locally Generated AnnualSavingsd$
13,00020,00027,00034,00040,00047,000
LoanRepaymenti$
10,00017,00024,00030,0009,000
InvestmentFrom LocalFunds$
?. fFood Storage10,00010,00010,00010,00038,000
~he number in the column designated "Year" denotes the number of years from the start of the project. For simplicity it is assumed that theentire capital investment is made at the beginning of the year.bThe total investment required per hectare is about $200. The annual loan is the capital borrowed from sources outside the village, initiallyassumed to be the only available development capital.cIt is assumed that three crops a year are grown-rice, wheat, and beans-and that the yields per hectare are 2,000 kg and 1,000 kg, respectively.The value of the produce is taken as 30¢/kg. Base yield, i.e., yield before project implementation, is taken as 850 kg/ha.dIt is assumed that 25 percent of all the increases in production over the initial production is retained by the village cooperative for loan repayment and further capital investment.eInterest is calculated at 12 percent per year on the unpaid balance.fIt is assumed that the savings in year 3 are used to build up emergency food stocks either within the village or in a nearby market town.
~~
0-...,h~?i't::-~Cti
~
For non-commercial use only.

130 Energy and Agriculture in the Third World
According to the Musahri Plan, a plan prepared for the Musahridevelopment block of Bihar by Ranjit Gupta and others?", the potential forpisciculture in the area is great. A four hectare fishery, including land for theembankments, and so on, would cost about $8,000 and produce about 6,000 kgof fish per year. The annual operating costs are estimated to be about $2,000,including a 12 percent interest on capital. This is probably one of the mostrewarding development investments that could be made in the area, for even ifone assumes the value of fish to be only $1/kg, the annual output from eachhectare would be about $1,500.
Vegetable farming is another area of great promise. It requires theinput of much more labor than grains, but the value of the annual output as wellas the net profit per unit of land is also much greater."
This illustration is, of course, very simplified. The pattern ofinvestments would change as development proceeds. The investments made inelectricity generation, roads, food storage, domestic water supply, fisheries,animal husbandry, marketing surplus food, and so on, would increase whileinvestments in cooking fuel distribution and irrigation pumps would decrease.
As their food needs are fulfilled, people would spend larger andlarger portions of their increased income on other essential goods such as betterhousing or bicycles. This would create additional economic growth and providefor more employment. We have stressed that capital equipment be used as fullyas possible so as to decrease the investments needed for small-scale industries.Raj Krishna estimates that the rate of economic growth induced in thenonagricultural sector would be about equal to the growth in agriculture."However, he considers much lower rates of agricultural growth and differentmechanization policies than the ones we have discussedin Chapter Three, so thatit is difficult for us to judge whether the results of his model apply here.
Relatively small but essential investments for medical care, inafforestation and land conservation, in training people to run and maintain thefacilities, and in the organization and administration of the development wouldbe needed. Some areas may require major investments in flood control.Accomplishment of this kind is not possible with the present compartmentalizedway of doing things, for it requires careful phasing.
Achieving such progress is not likely to be as fast as we havedepicted. But the calculations illustrate that the potential is there for the peopleof the Gangetic plain to participate fully and fruitfully in economic development, and that this potential can be realized within the rather stringentconstraints on capital that exist in India. Growth rates in food production of 15to 20 percent a year are attainable and were, in fact, achieved in Punjab in the1966-1970 period.
The resource constraints on development in different countries andregions will, of course, be different. Large biogas plants can hardly be built inthe Andean region if the farms remain as scattered as they are; or in the Sahel
For non-commercial use only.

Fuel for Agriculture 131
region if the nomads stay nomads. In some countries, such as Tanzania, land ismore plentiful, as is fuel supply, but providing the trained people to initiaterapid agricultural development may be the limiting factor in the short run.
Notes to Chapter Four
1. Energy Policy Project, A Time to Choose: America's Energy Future(Cambridge, Mass.: Ballinger Publishing Company, 1974).
2. Alan Poole, "The Potential for Energy Recovery from Organic Wastes," inRobert H. Williams (ed.), The Energy Conservation Papers (Cambridge, Mass.: Ballinger Publishing Company, 1975).
3. Ibid.4. Report of the Energy Survey of India Committee (New Dehli: Government
of India, 1965).5. Economic Situation and Prospects of India- Vol. II: The Energy Sector
(Washington, D.C.: International Bank for Reconstruction andDevelopment, 1974).
6. Power Study of South Central Brazil (Nassau, Bahamas: CanambraEngineering Consultants Limited, 1966).
7. H. Tabor, "Solar Energy Utilization," Paper presented at the InterregionalSeminar on Rural Electrification (of the United Nations), NewDehli, August 1971.
8. Robert Morey Associates (Dana Point, Californi), Energy Information 9(June 1974); 2.
9. Planning Commission, Report of Evaluation of the Rural ElectrificationProgramme (New Dehli: Government of India, 1965).
10. World Energy Supplies 1960-1970, Statistical Papers, Series J, No. 15,United Nations, New York, 1971.
11. J. Price Gitt inger , Economic Analysis of Agricultural Projects (Baltimore,Md.: Johns Hopkins Press, 1972).
12. Oil Shale Utilization: Progress and Prospects (New York: United Nations,1967).
13. Judith E. Liebeskind, "Pyrolysis for Solid Waste Management," Chemtech(September 1973): 537-542.
14. E. R. Kaiser and S. B. Friedman, "The Pyrolysis of Refuse Components,"Combustion (May 1968).
15. Bureau of Mines, Converting Organic Wastes to Oil (Washington, D.C.: U. S.Department of the Interior, 1971).
16. S. D. Richardson, Forestry in Communist China (Baltimore, Md.: JohnsHopkins Press, 1966).
17. Liebeskind, "Pyrolysis."18. Report of the Energy Survey of India Committee.19. Khadi Village Industries Commission, "Gobar Gas: Why and How,"
Bombay, India, n.d.
For non-commercial use only.

132 Energyand Agriculture in the Third World
20. Ram Bux Singh, Biogas Plants (Ajitmal, Etawah, Uttar Pradesh: Gobar GasInstitute, 1971).
21. C. R. Prasad, K. Krishna Prasad, and A. K. N. Reddy, "Biogas Plants:Prospects, Problems, and Tasks," Economic end Political Weekly(Bombay) (August 1974).
22. Harold B. Gotaas, Composting (Geneva: World Health Organization, 1956).23. Khadi Village Industries Commission, "Gobar Gas."24. V. K. Saolapurkar and S. V. Balkundi, Rice (New Dehli: Fertilizer
Association of India, 1969).25. Robert Yeck, Agricultural Research Service, U.S. Department of Agricul
ture, Washington, D.C., personal communication, 1974.26. International Research an Technology Corporation, Problems and
Opportunities in the Management of Combustible Solid Wastes(Washington, D.C.: U. S. Environmental Protection Agency, 1972).
27. Stanford Research Institute, Effective Utilization of Solar Energy toProduce Clean Fuel (Washington, D.C.: National Science Foundation, 1974).
28. Crop Reporting Board of the Statistical Reporting Services, AgriculturalPrices (Washington, D.C.: U. S. Department of Agriculture, 1974).
29. Production Yearbook 1972, Vol. 26 (Rome: Food and AgricultureOrganization of the United Nations, 1973).
30. Fertilizer Statistics 1972-1973 (New Dehli: Fertilizer Association of India,December 1973).
31. Prasad, Prasad, and Reddy, "Biogas Plants."32. Raj Krishna, Senior Economist, World Bank, personal communication,
December 1974.33. Report of the Energy Survey of India Committee.34. Carol H. Stoner (ed.), Make Your Own Power (Emmaus, Pa.: Rodale Press,
1974).35. Village Technology Handbook (Mt. Rainier, Md.: Volunteers in Technical
Assistance, Inc., 1973).36. Prasad, Prasad, and Reddy, "Biogas Plants."37. Ranjit Gupta, The Musahri Plan (Patna, India: Association of Voluntary
Agencies for Rural Development, 1972).38. C. J. Pratt, Industrial Projects Division, World Bank, Washington, D.C.,
private communication, 1973.39. Ibid.40. M. S. Mudahar, "Dynamic Analysis of Agricultural Revolution in Punjab,
India," Cornell University, Ithaca, New York, July 1974.41. Ibid.42. Raj Krishna, "Measurement of the Direct and Indirect Employment Effects
of Agricultural Growth with Technical Change," In Externalities inthe Transformation of Agriculture (Ames: Iowa State University, inpress).
For non-commercial use only.

Chapter Five
Energy and Development Policy
Underdeveloped countries can do a great deal more than they are doing toameliorate the misery of the poor even with the severe burden of limited capital,strained by worldwide increases in food, oil, and fertilizer prices.
Decentralized fuel and fertilizer projects have been stressed in thisbook because they have been relatively neglected in development strategywhereas they could assume a much larger role. These projects are not areplacement, however, but a supplement to the more conventional energysources, which must also be exploited. The hydropower resources of Brazil, thecoal resources of India, the natural gas of Bangladesh all have a role to play inspurring agricultural growth, and in building the industries and services that areessential to agricultural progress.
These investments in energy supply must be made in accordancewith an evaluation of a country's energy needs. In countries where the basicneeds of people for food, housing, clothing, water supply, medical care, and thelike have been met, there can be considerable debate over the definition ofneeds. For poor countries the needs are clear. Investments of energy, and ofcapital and human labor, must be made in those areas which are related to thefulfillment of these basic human needs.
In agriculture the heaviest investments of both energy and capitalmust go for irrigation works and fertilizers. Farm machines and improving thequality of draft animals that work the fields must also receive high priority inmany areas. Corresponding investments should be made in industry to producethe steel, cement, pumps, and so on to supply agriculture with the capital goodsit needs to get moving,
Domestic energy needs for cooking and for keeping warm must alsobe met. Forest and woodland resources must be managed much more carefully ifthey are not to wither away as they have in many parts of the world. Infuel-short areas, particularly the Gangetic plain, supplying the fuel needed for
133
For non-commercial use only.

134 Energy and Agriculture in the Third World
both domestic and agricultural uses will strain the available capital resources.Nevertheless, as we have shown, it is essential to take care of pressing everydayhuman needs while at the same time improving fuel management and techniquesof burning wood and other vegetable matter. Poor people will meet today'sneeds as they must, even at the cost of long-run threats to their existence, anddevelopment policy must take account of this conflict.
The population problem is another most important instance of theconflict between present needs and long-run development. The enormousdemand for peak labor in subsistence agriculture appears to be one of the mainreasons for the poor, who cannot afford machines or hired labor, to have manychildren. Among the other major reasons are lack of medical care, high infantmortality, and the strong imperative many poor rural people feel to have asurviving son. If a couple in an Indian village wishes to be about 95 percentcertain that one son will survive to look after them and to tend the fields whenthey are unable to do so, they must have six children.' Three or four of theseusually survive to adulthood. For old age, if it comes, most rural families of theThird World can hardly do better than plan for one son to survive.
A successful birth control policy aimed at reducing populationgrowth, desperately needed in most countries, must concern itself with thesepeak-labor and medical care aspects of the problem. Provision of medical careand selective mechanization of peak labor operations in agriculture will beessential features.
While steps are being taken to reduce peak labor requirements,simultaneous provision must be made to ensure that the laborers who aredisplaced have other opportunities for productive employment. Creatingopportunities through multiple cropping, vegetable farming, pisciculture, publicworks, market town development, and so on is important to increase the pace ofeconomic growth and to distribute its benefits equitably. As Mahatma Gandhi soaptly put it in 1934:
Mechanization is good when hands are too few for the workintended to be accomplished. It is an evil where there are morehands than required for the work as is the case in India. The problemwith us is not to find leisure for teeming millions inhabiting ourcountry. The problem is how to utilize their idle-hours which areequal to the working days of six months in the year. Deadmachinery must not be pitted against the millions of living machinesrepresented by the villagers scattered in the seven hundred thousandvillages of India. Machinery to be well-used has to help and easehuman effort.f
Creating jobs is not always enough. The proper conditions for workmust also be present. In Gambia, for example, the idle season is very importantin increasing body weight, which is then expended in the peak season. Under
For non-commercial use only.

Energy and Development Policy 135
these circumstances, paying people in food to work on public works projects inthe slack season would be one way to reduce unemployment during this period,and at the same time improve people's ability to work the fields during the peakperiods. Two further examples will illustrate the point.
A friend of the author was involved with a volunteer school buildingeffort in villages in Uttar Pradesh, India. He said that villagers would sit andwatch, but would not join in the work that was being done for them. Often theydid not think of the school building as a place to hold classes, but a convenientspot for wedding ceremonies and the like. In regard to the last point, manyvillagers, particularly the older ones, do not think much of education becausethe schooling system in India, much influenced by the system of the colonialdays, creates in young people an antipathy to manual labor and farm work.Since they often cannot find employment outside agriculture, the educated areoften not an asset but rather an economic and social burden upon their parents."Unwillingness" to work and apathy of the poor toward what appears to be intheir own interest is directly related to periodic or chronic malnutrition. Whyshould the villager who subsists on one meal a day put forth an effort to build abuilding, the benefits of which are far off and marginal, at best?
In contrast, an American missionary armed with wheat wanted toinitiate some development in the hill areas of Orissa, among the poorest regionsof India. When he started out 10 years ago, he asked the people of the villagewhere the program was to begin what the needs of the villagewere. The villagerswanted an irrigation tank, but claimed that the 700 people required for two orthree months to build the project would not be available. The village couldcontribute, at most, a tenth of that number. The missionary advised the elders ofthe village to inquire in the neighboring villages whether the people would workif a day's wages were 1.4 kg. (3 lbs.) of wheat and a few grams of cooking oil.*He said he would be back in a week to see whether the construction of theneeded earthen dam could be initiated. The following week 700 workers were onhand and the project was completed on time. This experience was repeateddozens of times during the 10 years he spent working in Orissa.
The portion of the investment in development projects that ispayment to workers can, and in food-short areas, should be in the form of food.Four hundred thousand tons of wheat can provide full-time employment (270working days per man-year) for one million people for one year. At 1974world prices of wheat, this would cost about $80 million per year.
If such investments are used to create productive assets such asirrigation tanks or wells, they could help to ensure adequate food production inthe future while easing current and future employment problems. As anexample, an investment in minor irrigation works in India of $2 billion dollarsover 5 years, $240 million of which could be in food to pay labor (equivalent of3 million man-years of labor paid 1.2 million tons of wheat), would create
*At 1974 world prices of wheat, this is equivalent to a wage of about 30 centsa day. At the prices of the mid 1960s, it was equivalent to about 10 cents a day.
For non-commercial use only.

136 Energy and Agriculture in the Third World
roughly 3 million permanent jobs in agriculture and increase annual foodproduction by approximately 5 million tons (see Chapter Three for details).
Simultaneous investments in roads, fertilizers, and so on couldincrease food production further, considering the synergistic effects thatirrigation, fertilizers, transport and storage of food exert on the availability offood for people.
Development plans are often thrown into disarray because duringtimes of natural disasters, such as droughts, governments must devote largeamounts of money to buy food for the hungry. During such catastrophic timesgovernments often delay action until they are virtually forced to it; the problemcan no longer be ignored when millions of people begin streaming into the citiesin search of food, as they did in the Sahel region, in Bangladesh and in India in1973 and 1974. By permitting such delays, and often even denying the veryexistence of serious food shortages, many underdeveloped countries lose theirbest chance of dealing with the problem. The food which might have been used,with foresight and planning, to create productive assets in the countryside mustin the end be given to the hungry anyway-with no long-term benefits to showfor it.
Our discussion here has inevitably departed from strict concern withenergy and entered into some wider considerations about development. Energypolicy is, of course, just one of the strands in development policy and cannotsucceed by itself. Equitable, productive distribution of food is fundamental. Notonly is it necessary from a practical and a humanitarian point of view; it is also aprecondition for convincing poor people that they will share in the fruits ofdevelopment. Without that conviction, the rural poor are most unwilling andunlikely to make the changes that development may require.
Small farmers and landless laborers are conservative for good reason.They live so close to the bone that innovations can put them at great risk. If anew seed variety fails because of increased susceptibility to pests, or because thegovernment-owned store is short of fertilizer, they and their families face almostcertain starvation.
Birth control programs or land reform efforts are both examples ofinnovations that require profound changes in attitude. Experience has shownthat these efforts are successful only when the mass of people have a feeling ofparticipation in the benefits that will come from change. Economic growth, anda just share in the product of that growth, are far more important than absolutelevels of income.
Given the fundamental political commitment, much can be done byunderdeveloped countries themselves, with their own resources, to feed theirpeople and meet their essential needs. Foreign aid, in the form of oil or food ordevelopment capital, can certainly help, but it is up to the Third World countriesto make full use of their own resources and those offered by others. They mustdistribute the food they have equitably, and use it productively. They must plan
For non-commercial use only.

Energy and Development Policy 137
development so as to create and maintain useful jobs. They must put greaterreliance on their own sources of fuel and fertilizer, in order to bridge the gapbetween the immediate needs of their people and long-term needs of vastlyincreased food production. And they must demonstrate convincingly thatprogress and economic growth are for the benefit of all their people.
Notes to Chapter Five
1. William Rich, "Smaller Families through Social and Economic Progress,"Monograph No. 7 (Washington, D.C.: Overseas DevelopmentCouncil, 1973).
2. Quoted in Gunnar Myrdal, Asian Drama (New York: Pantheon, 1968),p.1212.
For non-commercial use only.

For non-commercial use only.

Appendix A
Useful Energy
As far as farm work and irrigation are concerned, we define useful energy asthe amount of energy developed at the plow or the shaft of the pump. Thisdefinition has in inherent theoretical deficiency in that the theoretical amountof energy to turn the soil, to cut a plant, or to pump water along a horizontalpipe may be much smaller than the energy needed in practice. However, it has agood deal of practical value in that the significant differences in technologies ofapplying energy to the farm lie in the source of power. A unit of useful energydelivered in a given time to the shaft of a mechanical pump or a tractor iscomparable to a unit of useful energy at the shaft of a foot pump or anox-driven plow.
Of course, the amount of useful energy actually necessary to plow afield or pump water depends on factors such as the type of soil, the depth ofplowing, the method of irrigation, the rainfall pattern, the kind of crop, thetopography, and the source of the i.rigation water. In order to compare energyuse in agriculture in different parts of the world, we must take these differencesinto account. To take differences in farm conditions into account (roughly), wecompare only the production of a particular variety of food such as rice orwheat. This does not resolve all the problems such as different seed varieties, butit should eliminate many, but probably not all, major sources of error.
For irrigation we calculate the hypothetical amount of energy thatwould be necessary if all the irrigation were from an underground water sourceat a constant depth. The calculation of the actual amount of energy is useful forenergy supply considerations and varies greatly from one area to the next.However, this does not appear to explain the major discrepancies that appear invarious references. According to Dawson! Chinese planners use a rule of thumbof 0.4 horsepower per hectare for tubewell irrigation, and apparently, the annualpower consumption per irrigated hectare is about 250 kwhe. In India, the RuralElectrification Survey" reported that the average installed horsepower for
139
For non-commercial use only.

140 Appendix A
tubewell irrigation was about 2 horsepower per hectare and a power consumption of 1800 kwhe/hectare. In Bihar, India, where the water table is often only afew meters deep, the Survey reported about 1.2 horsepower/hectare and anannual power use of 300 kwhe/hectare. In Bihar, at least, it appears that theinstalled power for tubewell irrigation is seriously underutilized. For many partsof India the Survey may have underestimated the sales of water by owners ofpumpsets with the result that the power requirements would tend to beoverstated. While we do not have adequate data to comment on the accuracy ofthe Chinese power estimates for irrigation, it is possible that the lower powerrequirements in China may partly be attributable to the more even annualdistribution of the rainfall, the use of gravity irrigation in hilly areas and perhapsa lower average water table depth. To circumvent these difficulties of data andto compare the effects of irrigation water on crops in energy equivalent terms,we assume a useful energy requirement of 3 million Btu (about 850 kwhe) percrop per hectare which is between the Chinese and Indian estimates," Since theactual energy requirements vary greatly from one region to the next, our analysisyields no more than a qualitative idea of the effect of energy used for irrigation.We assume the net efficiency of electricity generation, transmission, distributionand use (in a motor) of 20 percent. Weassume the same efficiency (20 percent)for pumps driven by internal combustion engines.
In the U.S., the oil consumption by tractors is about 7 millionBtu/ha," This yields useful energy of 1.4 million Btu/ha. at an engine and driveefficiency of 20 percent. For farm animals the calculation is hampered by a lackof field data on annual energy output and the amount of this energy used forvarious purposes such as plowing, or transportation, or water pumping.
We can arrive at an approximate estimate of the efficiency by notingthat (a) the dung output of Third World cattle is between 10 to 15 million Btu."(b) the dung represents between 40 percent and 60 percent of the caloric valueof the food intake (Chapter Four); (c) draft cattle and horses develop aboutone-half horsepower and are used for about 1,000 hours per year. Thiscalculational procedure yields a useful energy output of about 1.2 million Btu(500 horsepower hours) per draft animal per year, or an efficiency of about 5percent. Morrison" cites an efficiency of about 3 percent for U.S. workhorsesused for about 1,000 hours per year. Stewart Odend'hal has made somemeasurements of the work output of draft animals in West Bengal, India." Heestimated that draft animals in West Bengal consume about 30 million Btu peryear, have a power output of 0.6 to 0.7 horsepower, and work around 1,000hours per year. These findings are approximately in accord with our assumptionsof 0.5 horsepower per animal, and food intake of 25 million Btu per year, andan annual working time of 1,000 hours per year. We will use an efficiency of 5percent which is higher than Morrison's estimate but approximately in accordwith Odend'hal's research. We further assume that, unless otherwise specified, 75percent of this energy is used for farm operations. If there is one draft animal
For non-commercial use only.

Useful Energy 141
per hectare (as is common) the annual useful energy in farm operations would be0.9 million Btu/ha.
The calculation for human labor is similar except that only 40percent to 50 percent of all human beings are available for work. Unlessotherwise specified, we assume that half of the available human labor is used inthe fields.
The differences in caloric intake and quality of diet also have aneffect on the amount of field work that draft animals or farm laborers can do.Due to a lack of data, we have largely ignored these differences.
For chemical fertilizers, we assume that the amount of useful energyis equal to the amount of energy required to produce the fertilizer. This is not avery satisfactory definition, but we resort to it because of the empiricaldifficulties associated with using a more rational measure. A rational measure ofthe usefulness of fertilizer energy (chemical or organic) could be the energyassociated with the increase in plant weight due to use of a unit of fertilizerwhich enables the more efficient capture of solar energy. Thus, if a kilogram ofnitrogen causes an increase in wheat yield of five kilograms and an increase inthe weight of the crop residue by five kilograms, then the total useful energyoutput would be about 150,000 Btu. This is to be compared with the 75,000Btu it takes to manufacture a kilogram of chemical nitrogen fertilizer (nitrogencontentj.f * The manufacture of organic fertilizer in biogasification plants canactually yield efficiently usable energy (methane) as well as fertilizer. Theprimary empirical difficulty with using this production measure of fertilizerefficiency is that the increase in production has a synergistic effect with irrigation (indeed it is often contingent upon the availability of irrigation water) andit is strongly dependent on the variety of seeds used. Suitably designed fieldexperiments are necessary for the adoption of this measure of fertilizer efficiency.For this book we use the energy required to manufacture a unit of chemicalfertilizer as representing useful energy obtained from using fertilizers. In comparing various countries, we attribute the same amount of useful energy outputper unit weight of organic fertilizers (unless otherwise specified).
Notes to Appendix A
1. Owen L. Dawson, Communist China's Agriculture (New York: Praeger,1970).
2. Planning Commission, Report on Evaluation of the Rural ElectrificationProgramme (New Dehli: Government of India, 1965).
3. David Pimentel et aI., "Food Production and the Energy Crisis," Science(2 November 1973).
*The energy requirements for the manufacture of potassium and phosphorousfertilizers are much smaller than those for chemical nitrogen since the former are generallyobtained from natural deposits.
For non-commercial use only.

142 Appendix A
4. Ibid. _.5. Harold B. Gotaas, Composting (Geneva: World Health Organization, 1956).6. F. B. Morrisson, Feeds and Feeding (Ithaca, N.Y.: Morrisson Publishing
Co., 1947).7. Stewart Odend'hal, "Energetics of Indian Cattle in Their Environment,"
Human Ecology (1972).8. Pimentel et al., "Food Production."
For non-commercial use only.
Appendix B
Biogasification
This appendix gives further information on some technical and economic aspectsof biogasification-sthat is, the production of methane by anaerobic fermentation. We will first discuss the biological aspects of the fermentation. In thesecond part we will discuss the design of suitable digestor systems.
THE ANAEROBIC FERMENTATION PROCESS
As noted in the main text, anaerobic fermentation is a promising technique forconverting organic raw material into a more useful form of energy (in this case,methane). The process is relatively efficient, produces an attractive product, andgenerates a nutrient-rich effluent which can be recycled to maintain the fertilityof the ecosystem producing the raw material. Precise understanding of theprocess, however, is incomplete, particularly when materials other than sewageare considered. Considerable research must be carried out before an optimalsystem can be achieved.
General
Anaerobic fermentation is a complex process in which manydifferent micro-organisms act symbiotically. Most organic materials-with theexception of rubbers, waxes, resins, lignin, and some complex hydrocarbonscan be converted to methane (CH4), carbon dioxide (C02), and traces of othergases. The basic conversion steps are illustrated in Figure B-1.
Although this diagram is very simplified, it serves to emphasize thebroad division of the process into two phases: an "acid-forming" phase and.a"methanogenic" phase. The micro-organisms of the acid-forming phase degradecomplex organic compounds such as starches, cellulose, proteins, and lipids, toshort-chain fatty acids, alcohols, carbon dioxide, and hydrogen. The micro-
143
For non-commercial use only.

144 Appendix B
complex substrate ----..... fatty acids ----..... CH4alcoholsC02 C02
traces of otherH2 gases including
acidogenic Imethanogenic H2Sphase phase
Figure B-1. Basic Conversion Steps in the Anaerobic MethaneFermentation
organisms of the methanogenic phase convert these simple compounds andhydrogen into CH4 and C02.
A variety of simple compounds is produced in the acid-formingphase. Some are:
methanol2-propanolbutanolethanolglycerol
acetatebutyrateformatelactatepropionatevalerate
The substrates which can be used directly by methanogenic bacteria (definedstrictly as micro-organisms producing methane, rather than as micro-organisms inthe methanogenic phase) are limited in number. Only methanol, acetate, andcarbon dioxide and hydrogen have been indisputably demonstrated to besubstrates. Hence, a complex association of micro-organisms is necessary in themethanogenic phase to convert the compounds listed above to substrates for theactual methanogenic bacteria.
A general principle of great importance is that this microbialecosystem is finely adjusted to a particular steady-state environment. Anyabrupt change of any factor in this environment will disrupt the ecosystem,perhaps irreversibly. Hence, changes in nutrient material, the amount of nutrientmaterial, temperature, pH, salinity, and ion concentration should all beminimized, and, if necessary, be introduced gradually.
Many reviews of the microbiology of the methane fermentationexists. Among the most recent are Toerian and Hattingh (1969),1 and Wolfe(1971),2 and Pfeffer (1974).3 Annual reviews of resear.ch on the process are tobe found in the annual review issues of the Journal of Water Pollution ControlFederation.
For non-commercial use only.

Biogasification 145
Comparison of the Acid-Forming andMethanogenic PhasesOptimum environments for the two phases appear to be different,"
The acid-forming phase also appears to be more stable and less fastidious thanthe methanogenic phase. In sewage treatment the methane-forming step is therate limiting step in the overall conversion. Growth rates of methanogens arelower (generation time = 4.8 hours) than those of acidogens (generation time =0.56 hours). It is not clear, however, that the methane-forming step is ratelimiting when the material digested is high in cellulose."
Some workersv' suggest physically separating the two phases inorder to achieve greater reliability and efficiency.
Conversion EfficiencyConversion efficiency may be defined as:
Btu methane produced
Btu organic matter destroyed
The consensus among students of biogasification (e.g., Wolfe, 1971) is that 80percent of the calorific value of degraded material is in the form of methane. Itshould be emphasized here that conversion efficiency is not the same as netconversion efficiency. Net conversion efficiency is defined as:
Btu methane produced
Btu organic matter added
in which the calorific value of the undigested residuum is accounted for. Undernormal conditions, the net conversion efficiency rarely exceeds 65 percent andmay vary widely from one material to another.
KineticsThe kinetics of batch digestion have been described by the equation:
where:
P is the cumulative gas production from a unit weight of organicmaterial at a specified time, t
For non-commercial use only.

146 Appendix B
Po is the ultimate cumulative gas production from a unit weight oforganic material after a time long enough for the reaction tocome essentially to a close
k is the rate of reaction, expressed as the gas produced in a day asa fraction of the gas remaining to be produced.
Discussions of the kinetics of methane digestion can be found in Imhoff andFairs and Boshoff,? Boshoff shows a close correlation between predictedtheoretical results and experimental results in Figure B-2. One may note herethat both the rate of digestion, k, and the final yield, Po' are increased by anincrease in temperature. Figure B-3 shows the effect that use of different rawmaterials has on both the rate of digestion and the final yield.
Factors affecting final yield and rate of digestion are, in fact, notentirely understood, but one that has been studied extensively is temperature.
TemperatureThere are three basic temperature ranges:
cryophilicmesophilicthermophilic
10-25 degrees centigrade25-40 degrees centigrade40-60 degrees centigrade
There is fairly general agreement that the rate of digestion, k, increases withtemperature. Imhoff and Fair lo give the following data relating k to temperaturein sewage digestion.
cumulativegas yieldliters/kg
600
400
200
• P =620 (1 - e- 0.06t) at 32°e
.p = 565 (1 - e- 0.05t) at 22°e
Po = 620 at 32° e
Po = 565 at 22°e
• experimental results-- theoretically predicted results
20 40 60detention time (days)
Source: Notes 6 and 7.
0'-------'----0..--'---"'------'--'
Figure B-2. Correlation of Experimental and TheoreticallyPredicted Cumulative Gas Yield (P), in Batch Digestion of ResidueSeeded Elephant Grass
For non-commercial use only.

Biogasification 147
digestion at 32°Cprefermented cow dung used as starter
1000
800
600cumulativegasyieldliters/kg
400
200
plantain peelselephant grass(12 weeks old)adried papyrus reed
elephant grass(24 weeks old)a
fresh papyrus reed
coffee husk
20 40 60
detention time (days)
aRefers to maturity of grasswhen harvested.
Source: Notes 6 and 7.
Figure B-3. Comparative Gas Production from Different RawMaterials During Batch Digestion
temperature(degrees C)
1015202530
k
0.0430.0600.0840.1190.164
Maly and Fadrus!' do not use rate but detention time, for gas production fromsewage to come essentially to completion. Their data are:
temperature(degrees C)
203050
detention time(days)
80-10033-5020
For non-commercial use only.

148 Appendix B
The conclusion for sewage digestion is, therefore, that the rate of digestiondoubles with every increase of 10 degrees centigrade'? or 15 degreescentigrade." The relationship between k and temperature is not simple,however. As Figure B--4 shows, there is a transition between the mesophilic andthe thermophilic range.
Generally speaking, the relationship between rate and temperatureholds for other materials, though the evidence available is not complete. Acentral trade-off in digestor design is between mesophilic and thermophiliccultures (see below). Successful versions of both have been operated for a varietyof materials, including the organic component of urban refuse?' 1S grass16
, 17 andcattle 18 , 19 manure.
The effect of temperature on total final gas yield, Po, is less definite.It would appear that the extent of degradation of different classesof compoundsis temperature dependent.F Degradation of fats decreases with increasingtemperature, whereas that of protein increases with increasing temperature.
temperature of digestion(degrees C)
30 50
degradation of fats (%)degradation of organic nitrogen (%)degradation of organic carbon (%)
64.957.955.7
55.569.155.8
However, for most materials the variations in yield with temperatures are not
2.0
1.6
relative 1.2time ofdigestion
0.8
0.4
o 0 . 10 20 30 40 50 60temperature (degrees Centigrade)
Source: Note 8.
Figure 8-4. Relation of Time of Digestion to Temperature
For non-commercial use only.

Biogasification 149
likely to be significant, at least about 30°C. However, unheated digestors doyield less gas when it gets cold." Heated digestors yield 50 percent more gas andthus achieve a higher net energy conversion efficiency-a matter of importancein many villages where supplies of organic matter inputs may be rather tightrelative to fuel needs. To make efficient use of the raw materials, digestorsshould at least be heated to mesophilic temperatures and maintained attemperatures between 30°-35°C. A sudden stop of even several degreescentigrade can set back the culture for a day or two.
Net Energy Conversion EfficiencyThis term was defined earlier in the appendix. In our calculations in
the text we have assumed a 60 percent net energy conversion efficiency. Asshown in Figure B-3, yields even after a 60-day batch detention time at 32°Ccan vary substantially from one kind of plant material to another. Boshofff"found that the age of plants when harvested, regardless of whether the harvestedmaterial was dried, and what size the pieces were to which plant material waschopped, affected the yield. Specifically he found that material dried at roomtemperature had a higher yield than fresh material (Figure B-3). This finding, ifconfirmed, should dispel doubts about the validity of storing crop residues fordigestion.
The use of a 60 percent net conversion efficiency for crop residuesand manure is a reasonable simplifcation, and on the average attainable, giventhe temperature and detention time which we assumed (32°C, 30-day detentiontime). Any error involved in choosing between 55 percent and 60 percentefficiency would not be significant given the margin or error in our relativelycrude village data.
Singh23 found that dry leaf powder and fresh manure both yieldingabout 540 to 580 liters of biogas per kg of dry matter when constanttemperatures (over 30°C) were maintained. This approximates a 60 percent netenergy conversion efficiency. He reports some surprisingly higher yields forsugarcane thresh and maize straw. In the light of Boshoffs data in Figure B-3,Singh's results for these last two may not be unrealistic. United AircraftResearch Laboratories/" achieved slightly lower yields for grass clippings andcattle manure with high-rate thermophilic digestion-the yields for bothmaterials were similarly close to one another. Hamilton Standard operated athermophilic digestor at 8 kg/m3 digestor volume/day which yielded 620 litersof biogas per kg of volatile solids." Assuming 50 percent CH4 and 4300 kcal/kgvolatile solids, this is equivalent to a net energy conversion efficiency of 65percent. Varani of Biogas of Colorado, Inc., generally achieves a 55--60 percentefficiency with feedlot manure in the pilot plant operating in Golden,Colorado.j" In general, inadequate yield data are presently available in reliablepublished form for the variety of different village materials which may bedigested.
For non-commercial use only.

150 Appendix B
It may be useful to point out here that experiments on the digestionof water hyacinth, a very productive aquatic weed which has been cited as apossible additional source of biomass to put in village digestors.f" have so farbeen rather disappointing.P * While other investigations may reverse theseresults, they do emphasize the need for specific tests of particular materials,preferably by several different investigators.
Improvement of Net Energy Conversion
Efficiency
An improvement in the energy conversion efficiency of theanaerobic methane fermentation would reduce the cost of raw material used perunit volume of methane produced. The effect on the total cost of biogas willdepend on the cost of increasing the efficiency versus the savings realized by theresultant decrease in the raw materials required to produce a given amount ofgas. As presently developed, the process is moderately efficient, but possibilitiesfor increasing the net conversion efficiency exist. Two will be mentioned here:the development of two-stage digestors and pretreatment of raw material.
The principle of two-stage digestors has been stated earlier.Preliminary results from a two-stage digestor operating at 48°C at the Universityof Pennsylvania" indicate that higher net energy conversion efficiency andhigher feed-rates can be achieved with two stage digestors than with single stagedigestors. The University of Pennsylvania results are:
net energyconversion efficiency
single stage digestor at 48°Csingle stage digestor at 37°Ctwo-stage digestor at 48°C
48%
55%
75%
Two-stage digestors are, therefore, a very promising technique, particularly ifhigher feed-rates can be maintained. Until more data are available, however, itwould be premature to either speculate as to why they are more efficient or toassume that the results obtained in the laboratory with simulated solid waste(Purina Dog Chow) can be obtained with plant material. Work on two-stagedigestors is presently being carried out at the Institute of Gas Technology inChicago.
Treatment of indigestible residues may increase digestibility andthus, yield and net conversion efficiency. It has been shown that treatment of
*It is for this reason that we assumed that water hyacinths would be useddirectly as cooking fuel and did not evaluate the economics of using water hyacinths tosupply gas for agricultural use.
For non-commercial use only.

Biogasification 151
cow dungJO and ryegrass straw" with sodium hydroxide increases thedigestibility of these materials for ruminants. Since the processes in ruminantdigestion are similar to those in the methane fermentation, increases indigestibility and yield can be anticipated from treatment of plant material.
The increase in yield is substantial. Smith found that soaking manurefor three weeks in a concentrated solution of sodium hydroxide (15 gNaOH/I00 g dry matter) resulted in greater than 90 percent digestibility inartificial rumens. That is to say, previously indigestible materials was madealmost completely digestible.
Data from Anderson and Ralstorr" are summarized in Table B-1.The degradation of lignin appears to be an important factor in increasingdigestibility. Combining this information (bearing in mind that fecal material hasa low digestibility, while untreated straw has 30-33 percent digestibility), wemay further note that increasing the time that the raw material is soaked inNaOH may increase the digestibility of that material. Since Anderson and
Table B-1. Effect of Chemical Treatment with NaOH onDigestibility and Chemical Composition of Ryegrass Straw
(a) Effect of Treatment on Digestibility (Data from Two Experiments)
Treatment Level(g NaOH/IOOg Straw)
No treatment68 (approx. 1% solution)
10
No treatment15 (2% solution)30 (4% solution)45 (6% solution)60 (8% solution)
MeanDigestibility(Percentage)
30.256.263.263.9
33.267.873.185.590.2
Percent Improvementover Untreated Straw
86.0109.4111.6
90.5105.5140.1153.4
(b) Effect of Treatment on Levels of Lignin and Crude Protein in Straw
Solution Strenthof Treatment (Percentage)
Lignin Crude ProteinPercent Decline Below Percent Decline BelowUntreated Straw Untreated Straw
0.52.04.06.08.0
19.554.975.588.591.9
7.010.143.969.972.7
Note: Straw soaked for 24 hours at ambient temperature in NaOH solution; 15 ml solutionfgof straw. Straw then dried. Digestibility determined by loading at 1 gflOO ml (10 kgfm 3 ) inbuffered rumen solution at 39° C for 24 hours.Source: Note 31.
For non-commercial use only.

152 Appendix B
Ralston used treatment times of only 24 hours, this means that a treatment levelof 6 g NaOH should produce more than an 86 percent increase in digestibility. Ifthis is the case, then one may suggest that a treatment level lower than that usedby Smith (15 g NaOH/lOOg fecal dry matter) would result in a very satisfactoryincrease in digestibility of certain materials.
It is obviously important that the smallest possible amount of NaOHbe used for treating the raw material. Therefore, it is logical to confine chemicaltreatment to the indigestible residue from a methane digestor, if this is possible.The treated residue may then be returned to the digestor. The lignin-rich fibrousmat resulting from digestion of crop residues might be a particularly goodcandidate for treatment. Contamination and cost are the main constraints, but ifsufficiently low treatment levelscan be achieved, treatment of residue representsa promising technique for increasing yields. It is possible that with recycling andrinsing, less than 0.5 g of NaOH need be consumed per 100 g dry matter ofmaterial. The Institute for Gas Technology is also presently investigatingtreatment methods.
Approaches other than these may be possible. It has, for example,been suggested that addition of activated charcoal increases the net conversionefficiency for sewage in mixed cultures, and that none of the increases yield isdue to digestion of the charcoal. Since we know that ground coal is digestible"this claim may be viewed with some skepticism. It is, nevertheless, intriguing.
Some materials (e.g., mercury, antibiotics) are toxic to microorganisms. This problem sometimes causes unreliable operation urban sewagetreatment plants because a variety of chemicals and metals are present in theinfluent. However, the influent to a village biogas plant would be morehomogenous and contain fewer toxic materials of the type present in urbansewage treatment plants. Reliable and efficient operation of village biogas plantswill require routine maintenance on the part of village level operators andprobably frequent inspection and assistance on the part of market towntechnicians. The training of such operators and technicians must be an importantpart of any scheme for widespread application of biogas plants. Herbicides,pesticides, and fungicides in high concentrations may also be potentiallydisruptive, and the effect of increased use of these materials on biogas plantoperation should be monitored.
SOME ASPECTS OF THE DESIGN OFBIOGASI FICATION SYSTEMS
Tank DesignThe basic outline of a village biogas-electricity system was presented
in Chapter Four. An important variable of the costs in this system are thoseassociated with the conversion of agricultural wastes to gas and the storage of
For non-commercial use only.

Biogasification 153
gas. Gas storage capacity is necessary due to the wide fluctuation in hourly andseasonal loads.
The estimated cost of a digestor was shown in Table 4-9 of ChapterFour. The conversion system is assumed to be essentially mesophilic digestioncarried out in a vertical-mixing digestor of the type described by Singh.34 Wehave selected the mesophilic culture instead of the thermophilic culture becauseit is the only culture that has been tested in this type of digestor which in turn is
the only type of digestor that has been extensively tested under villageconditions. The thermophilic process does, however, have some advantages. Therate of digestion is increased since the detention time in the digestor issubstantially reduced. As a result a greater quantity of gas is produced per unitof digestor volume and, thus, digestor capital costs per unit output of gas arereduced. Another consequence is that mixing (in digestor designs where this isnecessary) requirements are reduced." On the other hand, more heat inputs arerequired for thermophilic digestion. Pfeffer has presented an interestingdiscussion of the trade-offs between thermophilic and mesophilic digestors in arecent publication.P' The choice between mesophilic and thermophilic cultureswill be largely influenced by the relative unit costs of digestor volume and heat,both of which are subject to change due to technical improvements. The ease ofmaintenance is another consideration. Until more data are available for villageconditions, it would be premature to speculate on the relative merits ofthermophilic and mesophilic cultures.
We have assumed costs per unit volume as found in Prasad, Prasad,and Reddy.*37 We have assumed a loading rate of 3.2 kg/m3 digestorvolume/day or 1050 kg/m 3 digestor volume/year (based on Singh39 assuming a90 percent load factor to allow for maintenance). For example, in Mangaon thismeans that a digestor volume of 295 m3 is required to handle about 300 tonsper year of manure. It is quite possible that both the volume and the cost perunit volume of the system as costed are too high with the result that our costestimates are too high.40 Since biogas-electricity systems compare ratherfavorably with conventional rural electrification in spite of this overestimate,better digestor design would make such systems even more attractive.
The digestors designed by Singh use concrete walls and a mild steelfloating gas holder." These are expensive and probably unnecessary-that is, thedigestors are overdesigned. Chlorinated polyethylene, butyl rubber, or othermaterials could be used to cover and perhaps line the walls of the digestors. Analternative might be to add a bituminous emulsion to earth which is then tampedinto the walls. Such emulsions are effectively hydrophobic even at smallconcentrations and have been used to seal ponds which would otherwise drainaway through porous subsoil.
*The costs used by Prasad, Prasad and Reddy appear to be based on Singh'swork. " Singh's digestors are of the free standing type, and in essence, are simplifications ofthe digestors used for sewage treatment in many countries.
For non-commercial use only.

154 Appendix 8
The loading rate may also be too low, if thermophilic digestion isused. Hamilton Standard produced about 0.25 cubic meters per kilogram ofvolatile solids in manure'f with a loading rate of 8 kg per m3 of digestor volumeper day. With these rates only 40 percent of the volume assumed for the systemin Chapter Four would be required. The construction cost would be reducedapproximately in proportion to the reduction in volume. The materials requiredscale roughly as the two-thirds power of the volume, so that a 60 percentreduction in volume would correspond roughly to a 45 percent reduction inmaterials. The culture used in this example was thermophilic. The high loadingrate used means that this reduction in cost may not all be translated to reducedbiogas costs because increasing the loading rate at a given temperature decreasesthe gas yield, as shown in Figure B-5. The pilot plant of Biogas of Colorado,Inc., operates at approximately the same loading rate as the one we haveassumed (3.2 kg/m3/day).
While we do not assume that the residuum is dewatered in thissytem, dewatering may be desirable if the residuum is to be stored for a longtime or hauled over long distances (more than a few kilometers). Residuum fromthe digestion of cattle manure has proven to be remarkably difficult to de-
0.6
0.5CIl
~
"0Cf)
l!1.;:;~ 0.4o>.....oCl~
~0.3
:::loc::o.;:;g 0.2
"t:lottCIlIIIo
0.1
" ,',Operating Temperature
<, About 50°C
" ","
" ...
Legend
• Measured Values
--Inferred Trend
204 8 12 16Animal Waste Loading Rate Kg/Cu.M.lDay
Source: Note 12.
O~--~---~---.,..a,,------:,-=----~o
Figure 8-5. Gas Production Vs. Loading Rate
For non-commercial use only.

Biogasification 155
water.43, 44 It is possible that lower loading rates, longer detention times, and
more complete digestion may improve the dewatering characteristic of cattlemanure. F. Varani of Biogas of Colorado found that at a loading rate of 3.2 kgof volatile solids per m3 per day of digestor volume and a 30-day detention timethe residuum dewatered satisfactorily, but at 8 kg per m3 per day and a lO-daydetention time, it was impossible to dewater the residuum.
Another way to reduce costs besides using cheaper constructionmaterials and higher loading rates is to fundamentally redesign the digestors. Themost prominent candidate at present is the linear displacement digestor. In theconventional vertical-mixing type common today, material is mixed throughoutthe volume of the digestor as it is added (in theory). Generally, in order toachieve the necessary circulation, a vertical cylindrical configuration is used.
In a linear displacement digestor, however, the raw material enters atone end of a canal, while the effluent is drawn off from the other end. Materialthus flows slowly down the length of the canal, and the movement of the cultureapproximates a plug flow. Different stages of digestion should predominate atdifferent points along the length of the canal. Gas is drawn off through the roof.Schematic diagrams of a vertical mixing digestor and a linear displacementdigestor are shown in Figure B-6. Reduced construction and materials costs aretwo major advantages of the linear design. (No mixing is assumed, though somemay be used). Very simply, it costs less to dig a trench and cover it than to put ahole in the ground, build up load-bearing walls, and cover that. A roughcalculation of the cost of a linear displacement digestor equal to the size of thatcosted in the text (about 300 cubic meters) indicates that the cost per unitvolume may be less than 50 percent of the cost of a vertical-mixing type builtwith steel and cement.
It would be premature to assume that such low-cost digestors are areality. None have been reported in the standard literature by widely recognizedauthorities. It has even been suggested that linear displacement or plug flowdigestors cannot work, even in theory. However, the theory that predicts thatplug flow digestors won't work can be used to show that batch digestors won'twork either. But batch digestors definitely do work. Moreover, the small lineardigestor built in Golden, Colorado, does produce gas. It is essential that anumber of linear displacement digestors of various designs be built as soon aspossible and tested. This matter is too important to be left to speculation andthe odd pilot plant, or even one demonstration plant. More experimental dataare necessary to determine the costs of linear digestors, the gas production rates,and so on. Only such data will enable an accurate comparison between the linearand vertical mising designs.
Carbon Dioxide RemovalCO2 removal is at present an expensive process for small-scale plants,
unless a source of lime is locally available. Therefore, we have not consideredCO2 removal in a village system. CO2 removal would, of course, improve the
For non-commercial use only.

156 Appendix B
(a) Vertical Mixing Type
gasholder
cfrCulaG~ ,
influent-e--e- ====::::::
gas - -----+--'~===_effluent
(b) Linear Displacement Type
, , , I
culture
gas
____--'.t...1__--'Itl"-__---'
influent - -r"T""'Ir-r""""T'""'T-r'T""'Ir-r""""T'""'T-r"..,....,r-T...,....T""'!
tLongitudinal section of canal
roof
___----J~-le_ve_e--
Transverse section of canal
Figure 8-6. Schematic Diagrams of the Vertical Mixing and LinearDisplacement Digestors (Heating System Not Shown)
economics of gas storage and improve the economics of compressed gas formobile machinery. When designing CO2 removal facilities, it should beremembered that only a partial purification would result in significant benefits.It is by no means necessary to purify the gas to "pipeline" standards. Internalcombustion engines run well with unscrubbed biogas.4s
, 46
Gas StorageGas storage is an essential feature of a biogasification system.
Optimum storage capacity can only be accurately determined when digestor unitvolume costs, unit storage costs, and the variation in seasonal loads are known.
The basic problem can be illustrated as follows. The economics ofdigestor operation improve as load factors improve. On the other hand, rural or
For non-commercial use only.

Biogasification 157
digestor operation improve as capacity factors improve. On the other hand,rural or agricultural loads for either gas or electricity are highly variable on bothan hourly and seasonal basis, and capacity factors are low. Without storage capacity, the digestor costs would increase by five or six times, and much more careful management would be required to match output with demand. Temporaryshut-down of digestors for maintenance or repair could also be very disruptivewithout some gas storage.
The load patterns for gas will vary from place to place since theydepend on the importance and pattern of irrigation use, the number of cropsgrown, whether cooking gas is part of the system, patterns of machine use, andso on. Storage requirements are related to the number of consecutive days orweeks that output is exceeded by demand, as well as to the level of demandabove the annual average.
For example, if there are two periods of equal peak demandseparated by three months of zero demand, the storage required would be equalto about 25 percent of total output instead of the 40 percent that would berequired if the same demand occurred during one continuous period. It is
evident, therefore, that the ratio of storage capacity to total output can bereduced by scattering peak load periods throughout the year. Multiple croppingshould have this effect, and its introduction will improve the economics ofvillage biogas plants.
In the analysis in Table 4-9, Chapter Four, a storage capacity ofabout 40 percent of total gas output was assumed. The unscrubbed gas is storedat 1,500 psi in a lined cylindrical pit (420 m-'), with a reinforced concrete roofcosting $30/m2 .
It may be possible to use abandoned wells for storing biogas, whichmay reduce the costs of storage.
Heating the DigestorAs discussed in the first section of this appendix, it has been shown
that both yield and rate of gas production may be increased by stabilizing thetemperature of the digestor at mesophilic or thermophilic temperatures insteadof letting it fluctuate with the ambient temperatures. Wehave also indicated thatit might be advantageous to operate at higher themophilic temperatures. Animportant trade-off here is between the cost of heat and the cost of digestorvolume.
The amount of heat required is a function of the operatingtemperature of the digestor, the temperature of the water entering the digestor,the ambient temperature, and of the quantity of water entering the digestor.Total heat requirements are the sum of (a) the heat loss through the digestorwalls and (b) the heat required to bring the influent water up to digestortemperatures. A major factor in determining (a) is the presence or absence of ametal gas holder for the digestor. Eighty percent of the heat loss in conventionalsewage digestion is through the metal gas holder .47 Eliminating or adequately
For non-commercial use only.

158 Appendix 8
insulating the gas holder will substantially decrease heating requirements.Recycling of effluent water, with precautions to minimize heat loss
during recycling, can result in dramatic saving in heat requirements. Suchrecycling, however, requires dewatering of the effluent. We are not familiar withdewatering technology and are uncertain regarding its applicability to villagesystems. We have assumed that during a part of the year effluent water will beintroduced directly into irrigation systems, and, during the rest of the year,stored in pits which are inexpensive to excavate. Dewatering might, however, besuperior.
If electricity generation and waste heat utilization are combinedwith biogasification at the outset, it is unlikely that heat supply will be a majorproblem, though difficulties may be encountered due to intermittent generationon the one hand and the need for reasonably constant heat inputs on the other.Heat requirements are unlikely to exceed 5 or 10 percent of the energy outputwhen digestors are operated at mesophilic temperatures. However, in order toachieve maximum utilization of capital, we have suggested in Chapter Four thatelectrification may be deferred. In this case, solar heating may be appropriate.
Digestors (particularly those operating at mesophilic temperatures)are in many ways particularly suited to solar heating, particularly in tropical andsubtropical latitudes where adequate insulation is available throughout the year.Digestors require only low temperature heat so that simple flat plate collectorswill be reasonably efficient. Digestors provide their own thermal storage, sothere is little need for any additional heat storage. Solar heating is a feature ofthe proposed Biogasof Colorado, Inc., plant.
To achieve consistently good gas yields, it may be necessary toinstall thermostatic controls in village biogas plants. In fuel short areas, everyeffort should be made to avoid the use of biogas for heating digestors. In otherareas, where the supply of organic matter is not a limiting factor in the supply ofenergy for agriculture, the costs of heating with solar or other systems should becompared with the costs of using biogas since in these cases there is noopportunity cost attached to the use of biogas for digestor heating.
A biogasification system in a village may initially operate atmesophilic temperatures using solar heating. After electrification, some of thewaste heat available could be used to operate the digestors at thermophilictemperatures. This may permit digestors of the same volume to convert largerquantities of waste to gas, thus permitting some expansion of fuel-producingcapacity without the construction of additional digestors.
Notes to Appendix B
1. D. F. Toerien and W. H. J. Hattingh, "Anaerobic Digestion-I: The Microbiology of Anaerobic Digestion," Water Research 3 (l960).
2. R. S. Wolfe, "Microbial Formation of Methane," Advances in MicrobialPhysiology 6 (1971).
For non-commercial use only.

Biogasification 159
3. J. T. Pfeffer, Reclamation of Energy from Organic Waste, EPA670/2-74-016. (Cincinnati, Ohio: National Environmental ResearchCenter Office of Research and Development, Environmental Protection Agency, 1974).
4. F. G. Pohland and S. Ghosh, "Developments in Anaerobic TreatmentProcesses," in R. P. Canale (ed.), Biological Waste Treatment (NewYork: John Wiley, 1971).
5. Pfeffer, Reclamation of Energy.6. Pohland and Ghosh, "Developments."7. M. Altmann, "Technology for the Conversion of Solar Energy to Fuel
Gas," University of Pennsylvania, University Park, July 1973.8. K. Imhoff and G. M. Fair, Sewage Treatment (New York: John Wiley,
1956).9. W. H. Boshoff, "Reaction Velocity Constants for Batch Methane Fermenta
tion on Farms," Journal ofAgricultural Science 68 (1967).10. Imhoff and Fair, Sewage Treatment.11. J. Maly and H. Fadrus, "Influence of Temperature on Anaerobic
Digestion," Journal of the Water Pollution Control Federation 43(1971).
12. Imhoff and Fair, Sewage Treatment.13. Maly and Fadrus, "Influence of Temperature."14. Imhoff and Fair, Sewage Treatment.15. S. Ghosh and D. L. Klass, "Conversion of Urban Refuse to Substitute
Natural Gas by the Biogas" Process." Paper presented to theFourth Mineral Waste Utilization Symposium, Chicago, 1974.
16. Ram Bux Singh, Biogas Plant Generating Methane from Organic Wastes(Ajitrnal, Etawah, Uttar Prodesh, India: Gobar Gas Research Station,1971).
17. United Aircraft Research Laboratory, Technology for Conversion of SolarEnergy to Fuel (Washington, D.C.: National Science Foundation,1974).
18. Singh, Biogas Plant Generating Methane.19. U.S. Department of Agriculture-Hamilton Standard, Proposal for Thermo
philic Fermentation of Feedlot Wastes-Pilot Plant Evaluation(Washington, D.C.: USDA, 1974).
20. Maly and Fadrus, "Influence of Temperature."21. Singh, Biogas Plant Generating Methane.22. Boshoff, "Reaction Velocity Constants."23. Singh, Biogas Plant Generating Methane.24. United Aircraft Research Laboratories, Technology.25. USDA-Hamilton Standard, Proposal.26. F. Varani, Biogas of Colorado, Golden, Colorado, personal communication,
1974.27. C. R. Prasad, K. Krishna Prasad, and A. K. N. Reddy, "Biogas Plants:
Prospects, Problems, and Tasks," Economic and Political Weekly(Bombay) (August 1974).
28. United Aircraft Research Laboratories, Technology.29. Altmann, "Technology."
For non-commercial use only.

160 Appendix B
30. L. W. Smith et al., "In Vitro Digestibility of Chemically Treated AnimalFeces," Journal of Animal Science 31 (1970).
31. Anderson and Ralston, "Chemical Treatment of Ryegrass Straw," Journalof Animal Science 37 (1973).
32. Ibid.33. G. E. Johnson, "Production of Methane by Bacterial Action in a Mixture of
Coal and Sewage Solids," U.S. Patent 3,640,846, 1972.34. Singh, Biogas Plant Generating Methane.35. Pfeffer, Reclamation of Energy.36. Ibid.37. Prasad, Prasad, and Reddy, "Biogas Plants."38. Singh, Biogas Plant Generating Methane.39. Ibid.40. Prasad, Prasad, and Reddy, "Biogas Plants."41. Singh, Biogas Plant Generating Methane.42. USDA-Hamilton Standard, Proposal.43. S. Ghosh, Institute of Gas Technology, Chicago, personal communication,
1974.44. W. Jewel, Cornell University, Ithaca, New York, personal communication,
1974.45. Singh, Biogas Plant Generating Methane.46. Roger Grant et al., Cooperative Extension Service, Pennsylvania State
University, University Park, Pennsylvania, personal communication,1974.
47. L. H. Thompson, Chief Engineer, Sewage Treatment Branch, Public HealthEngineering Department, London County Council, London, personalcommunication, 1973.
For non-commercial use only.

Bibliography
Altmann, M. "Technology for the Conversion of Solar Energy to Fuel Gas."University of Pennsylvania, University Park, July 1973.
Anderson and Ralston. "Chemical Treatment of Ryegrass Straw." Journal ofAnimal Science 37.
Best, C. H., and Taylor, N. B. The Physiological Basis of Medical Practice.Baltimore, Md.: Williams & Wilkins Company, 1945.
Bienen, Henry. Tanzania. Princeton, N.J.: Princeton University Press, 1970.Boshoff, W. H. "Reaction Velocity Constants for Batch Methane Fermentation
on Farms." Journal ofAgricultural Science 68.Britannica World Atlas. Encyclopedia Britannica, W. Benton, 1972.Brown, Lester. By Bread Alone. Washington, D.C.: Overseas Development
Council, 1974.Bureau of Mines. Converting Organic Wastes to Oil. Washington, D.C.: U. S.
Department of the Interior, 1971.Cambel, A. B., et al. Energy R&D and National Progress. Washington, D.C.: U. S.
Government Printing Office, 1965.Crop Reporting Board of the Statistical Reporting Services. Agricultural Prices.
Washington, D.C.: U. S. Department of Agriculture, September1974.
Dasmann, R. F., et al. Ecological Principles of Economic Development. London:John Wiley & Sons Ltd., 1973.
Dasmann, R. F.; Milton, J. P.; and Freeman, Ph. H. Ecological Principles forEconomic Development. New York: John Wiley, 1973.
Dawson, Owen. Communist China's Agriculture. New York: Praeger, 1970.Dorner, P. Land Refore and Economic Development. New York: Penguin, 1972.
Economic Situation and Prospects for India- Vol. II: The EnergySector. Washington, D.C.: International Bank for Reconstructionand Development, 1974.
Energy Policy Project. A Time to Choose: America's Energy Future. Cambridge,Mass.: Ballinger Publishing Company, 1974.
161
For non-commercial use only.

162 Bibliography
Etienne, Gilbert. Studies in Indian Agriculture. Berkeley: University ofCalifornia Press, 1968.
"Exposicion en la Reunion Continental sobre la Ciencia y el Hombre." EnergiaElectrica en A merica Latina. Mexico: Stanford University DF, June1973.
Fertilizer Statistics 1972-1973. New Dehli: Fertilizer Association of India,December 1973.
Ghosh, S., and Klass, D. L. "Conversion of Urban Refuse to Substitute NaturalGas by the Biogas" Process." Paper presented at the FourthMineral Waste Utilization Symposium, Chicago, 1974.
Gillman, Katherine. "U.S. Energy Use in Historical Perspective." Special staffreport of the Energy Policy Project of the Ford Foundation, NewYork, November 1973.
Gittinger, J. Price. Economic Analysis of Agricultural Projects. Baltimore, Md.:Johns Hopkins Press, 1972.
Goodstadt, Leo. China's Search for Plenty. New York: John Weatherhill, 1972.Gotaas, Harold B. Composting, Geneva: World Health Organization, 1956.Gupta, Ranjit, The Musahri Plan. Patna, India: Association of Voluntary
Agencies for Rural Development, 1972.Guyol, Nathaniel. Energy in Perspective of Geography. Englewood Cliffs, N.J.:
Prentice Hall, 1971.Gyftopoulos, E. P., et al. Potential Fuel Effectiveness in Industry. Cambridge,
Mass.. Ballinger Publishing Company, 1974.Harris, Marvin. "The Cultural Ecology of India's Sacred Cattle." Current
Anthropology 7.Hass, J. Financing the Energy Industry. Cambridge, Mass.: Ballinger Publishing
Company, 1974.Heath, et al. Land Reform and Social Revolution in Bolivia. New York: Praeger,
1970.Hewitt, Cynthia. The Social and Economic Implications of Large Scale
Introduction of New Varieties of Food Grain, Mexico: A CaseStudy. Report to the United Nations, in press.
Hill, Polly. Rural Hausa: A Villageand a Setting. London: Cambridge UniversityPress, 1972.
Imhoff, K., and Fair, G. M. Sewage Treatment. New York: John Wiley, 1956.India 1971-72. New Delhi: Government of India, 1972.International Research and Technology Corporation. Problems and Opportuni
ties in the Management of Combustible Solid Wastes. Washington,D.C.: U.S. Environmental Protection Agency, 1972.
Johnson, G. E. "Production of Methane by Bacterial Action in Mixture of Coaland Sewage Solids." U.S. Patent 3,640,846, 1972.
Kaiser, E. R., and Friedman, S. B. "The Pyrolysis of Refuse Components."Combustion.
Khadi Village Industries Commission. "Gobar Gas-Why and How." Bombay,n.d.
King, F. H. Farmers of Forty Centuries. Emmaus, Pa.: Rodale Press, 1911.
For non-commercial use only.

Bibliography 163
Krishna, Raj. "A Model of the Unemployment Trap, with Policy Implications."In Fiscal Measures for Employment Promotion in DevelopingCountries. Geneva: International Labor Office, n.d.
Krishna, Raj. "Measurement of the Direct and Indirect Employment Effects ofAgricultural Growth with Technical Change." In Externalities in theTransformation of Agriculture. Ames: Iowa State University, inpress.
Krishna, Raj. "Unemployment in India." Indian Journal of AgriculturalEconomics 28.
Kuo, Leslie. The Technical Transformation of Communist China's Agriculture.New York: Praeger, 1972.
Liebeskind, Judith E. "Pyrolysis for Solid Waste Management." Chemtech,September 1973, pp. 537-542.
Long Term Economic Growth, 1860-1970. Washington, D.C.: U.S. Bureau ofEconomic Analysis, U.S. Department of Commerce, 1973.
Makhijani, A. B., and Lichtenberg, A. J. "An Assessment of Energy and MaterialsUtilization in the U.S.A." Electronics Research Laboratory Memorandum ERL-310 (rev.), University of California, Berkeley, September 1971.
Maly, J., and Fadrus, H. "Influence of Temperature on Anaerobic Digestion."Journal of the Water Pollution Control Federation 43.
Mao Tse-Tung. Selected Works of Mao Tse-Tung. Peking: Foreign LanguagesPress.
Mellor, John. "Report on Technological Advance in Indian Agriculture as ItRelates to the Distribution of Income." International Bank forReconstruction and Development, December 1969.
Mellor, John, et al. Developing Rural India. Bombay: Lalvani Publishers, 1972.Morrisson, F. B. Feeds and Feeding. Ithaca, N.Y.: Morrisson Publishing Co.,
1947.Mudahar, Mohinder S. "Dynamic Analysis of Agricultural Revolution in Punjab,
India." Cornell University, Ithaca, New York, July 1974.Muller, Ronald. "Poverty is the Product." Foreign Policy 13: 71-103.Myrdal, Gunnar. Asian Drama. New York: Pantheon, 1968.National Council for Applied Economic Research. Market Towns and Spatial
Development in India. New Dehli: NCAER, 1965Netschert, Bruce, et al. Energy in the American Economy 1850-1975.
Baltimore, Md.: Johns Hopkins Press, 1960."1973: The Year of Major Changes in Worldwide Oil." Gas and Oil Journal 71.Nyerere, Mwalimu. The Arusha Declaration. Washington, D.C.: Embassy of
Tanzania, n.d.Odend'hal, Stewart. "Energetics of Indian Cattle in Their Environment." Human
Ecology 1.Oil Shale Utilization: Progress and Prospects. New York: United Nations, 1967.Openshaw, Keith. "Projections of Wood Use in Tanzania." Unpublished report
to the Public Works Department, Tanzania, Midlothian, Great Britain,1973.
For non-commercial use only.

164 Bibliography
Openshaw, Keith. "Projections of Wood Use in Thailand." Unpublished reportto the Public Works Department, Thailand, Midlothian, GreatBritain, 1973.
Openshaw, Keith. "The Gambia: A Wood Consumption Survey and TimberTrend Study 1973-2000." Unpublished report to the ODA/LRDGambia Land Resources Development Project, Midlothian, GreatBritain, 1973.
Owen, D. F. Man in Tropical Africa. New York: Oxford University Press, 1973.Owens, Edgar, and Shaw, Robert. Development Reconsidered. Lexington, Mass.:
D. C. Heath and Company, 1972.Pimenthel, David, et al. "Food Production and the Energy Crisis." Science, 2
November 1973.Pfeffer, J. T. Reclamation of Energy from Organic Waste. EPA 670/2-74-016.
Cincinnati, Ohio: National Environmental Research Center Office ofResearch and Development, Environmental Protection Agency,1974.
Pohland, F. G., and Ghosh, S. "Developments in Anaerobic Treatment Processes." In Biological Waste Treatment edited by R. P. Canale. NewYork: John Wiley, 1971.
Planning Commission. Approach to the Fifth Plan. New Delhi: Government ofIndia, 1973.
Planning Commission. Report on Evaluation of Rural Electrification in India.New Delhi: Government of India, 1965.
Poole, Alan. "The Potential for Energy Recovery from Organic Wastes." In TheEnergy Conservation Papers edited by Robert H. Williams. Cambridge, Mass.: Ballinger Publishing Company, 1975.
Power Study of South Central Brazil. Nassau, Bahamas: Canambra EngineeringConsultants Limited, 1966.
Prasad, C. R.; Prasad, K. Krishna; and Reddy, A. K. N. "Biogas Plants; Prospects,Problems, and Tasks." Economic and Political Weekly (Bombay),August 1974.
Production Yearbook 1972. Vol. 26. Rome: Food and Agriculture Organizationof the United Nations, 1973.
Prothero, R. M., ed. A Geography ofAfrica. London: Routledge & Keagan Paul,1973.
Rao, K. L. "Irrigation." New Delhi: Government of India, 1972.Report of the Energy Survey of India Committee. New Delhi: Government of
India, 1965.Rich, William. "Smaller Families Through Social and Economic Progress."
Monograph No.7. Washington, D.C.: Overseas Development Council, 1973.
Richardson, S. D. Forestry in Communist China. Baltimore, Md.: Johns HopkinsPress, 1966.
Robert Morey Associates (Dana Point, California). Energy Information 9:2.Roger Revelle et al. "Water and Land," Chapter 7 in The World Food Problem,
Vol. II, U.S. Government Printing Office, Washington, D.C., 1967.Saolapurka, V. K., and Balkundi, S.V. Rice. New Delhi: Fertilizer Association of
India. 1969.
For non-commercial use only.

Bibliography 165
Sen, L. K., et al. Planning Rural Growth Centers for Integrated Area Development. Hyderabad, India; National Institute for Community Development, 1971.
Serra, Jose. El Milagro Brasilero: Realidad 0 Mito. Santiago de Chile: Quimantu,1971.
Shaw, Robert. "Jobs and Agricultural Development." Monograph No.3.Washington, D.C.: Overseas Development Council, 1970.
Sidel, Victor, and Sidel, Ruth. "The Delivery of Medical Care in China."Scientific American 230: 1927.
Singh, Ram Bux. Biogas Plants. Ajitrnal, Etawah, Uttar Pradesh: Gabar GasInstitute, 1971.
Smith, L. W., et al. "In Vitro Digestibility of Chemically Treated Animal Feces."Journal of Animal Science 31.
"Soil and Water." In The President's Report of Agriculture. Washington, D.C.:U.S. Government Printing Office, n.d.
Southworth, Herman, ed. Farm Mechanization in East Asia. New York:Agricultural Development Council, 1972.
Stamp, Dudley. Asia. New York: E. P. Dutton & Co., 1958.Stanford Research Institute. Effective Utilization of Solar Energy to Produce
Clean Fuel. Washington, D.C.: National Science Foundation, 1974.Stoner, Carol H., ed. Make Your Own Power. Emmaus, Pa.: Rodale Press, 1974.Swazambu, S. "Power Development." New Delhi: Government of India, 1972.Tabor, H. "Solar Energy Utilization." Paper presented at the Interregional
Seminar on Rural Electrification (of the United Nations), NewDelhi, August 1971.
Tanganyika Central Statistical Bureau. Village Economic Surveys, 1961-1962.Toerien, D. F., and Hattingh, W. H. J. "Anaerobic Digestion-T: The Micro
biology of Anaerobic Digestion." Water Research 3.United Aircraft Research Laboratory. Technology of Conversion ofSolar Energy
to Fuel. Washington, D.C.: National Science Foundation, 1974.U.S. Cattle and Livestock Statistics. Washington, D.C.: U.S. Department of
Agriculture, n.d.U.S. Department of Agriculture-Hamilton Standard. Proposal for Thermophilic
Fermentation of Feedlot Wastes-Pilot Plant Evaluation. Washington, D.C.: USDA, 1974.
van der Schalie, H. "World Health Organization Project, Egypt 10-A CaseHistory of a Schistosomiasis Control Project." In The CarelessTechnology edited by M. Taghi Farvar and J. P. Milton. Garden City,N.Y.: The Natural History Press, 1972.
Village Technology Handbook. Mt. Rainier, Md.: Volunteers in TechnicalAssistance, Inc., 1973.
Wang, You-Tsao. "Farm Mechanication in Taiwan: Its Problems and ResearchNeeds." In Farm Mechanication in East Asia edited by H. Southworth. New York: Agricultural Development Council, 1972.
Wilkie, R. San Miguel: A Mexican Collective Ejido. Stanford, Calif.: StanfordUniversity Press, 1971.
Williams, Robert H., ed. The Energy Conservation Papers. Cambridge, Mass.:Ballinger Publishing Company, 1975.
For non-commercial use only.

166 Bibliography
Wolfe, R. S. "Microbial Formation of Methane." Advances in Microbial Physiology 6.
World Bank. "Additional Capital Requirements of Developing Countries."Washington, D.C., March 1974.
World Energy Supplies 1960-1970. Statistical Papers, Series J. No. 15. NewYork: United Nations, 1971.
For non-commercial use only.

Index
Africa, tropical: profile, 34agriculture: crop residues, 111; energy
consumption, 16; energy needs, 82;production in Arango, 50; productionand India profile, 26; in Quebrada, 54;rural similarities, 20; seed varieties, 60;wastes as energy source, 99
Anderson, and Ralston, 151assessment, 1; capital needs and Third
World, 78; electricity and biogasification,116; irrigation costs, 126
balance-of-payments, 4Biogas of Colorado, Inc., 150biogasification: assessment, 143; availability,
97; conversion steps, 143-146; costs andhuman excrement, 118; electricity system,111; gas storage, 156; technology, 101
birth control: China policy, 29; peak labordemand, 73; rate, 134; in William Rich, 10
Bolivia: profile of Quebrada, 51Boshoff, W.H., 146Brazil: oil shale, 100; welfare, 3
capital: biological material as energy source,99; cost reduction, 116; foreign exchangeshortage, 126; goods manufacture andenergy needs, 86; investment to replacewood, 68; requirements in Third World,76; scarcity and definition, 7
China: afforestation program, 70; energyintensity, 16; profile, 28; and tubewellirrigation, 139
Dawson, O.L., 29, 134decentralization: in China, 28; of energy
sources, 97; and energy supply, 122
167
development: defined, 66dung: and biogas, 127; energy role in Third
World, 76; India profile, 23; output inThird World, 140; potential, 85
economic growth: concept of, 2electric power: analysis and exclusion of
poor, 65; assessment, 97; and cropresidue, 122; demand, 119; and humanexcrement, 116; generation, waste heatutilization and biogasification, 158
energy: agriculture requirements, 83; conversion efficiency, 149; India profile, 26;in Kilombero, 42; land and productionanalysis, 56; power on farms, 119; inQuebrada, 53; wood in China, 33;requirements in Third World, 18
farmers: capital contribution, 9; inQuebrada, 53
fertilizer: and capital investment, 133;chemical, 86; and Hausa agriculture, 45;and human excrement, 105; in IndiaprofJIe,25
food: cooking and energy, 118-121; production in China, 71; shortage, 4
fuel: biogasification and cooking, 102, 114;in cooking, 68; farm machines, 124;installation and cost in rural area, 98;noncommercial, 23, 65; wood, 38
Gambia, 39Gandhi, Mahatma, 134government: investments and policy, 133
135; subsidy in India, 98
Hamilton Standard, 149
For non-commercial use only.

168 Index
Harris, M., 74
Imhoff, K. and Fair, G.M., 146income: redistribution, 3, 28India: biogas electricity !lYstem, 111;
cooking and fuel supply, 68; energyintensity, 16; Fuel Policy Committee, 102;noncommercial fuel, 71; profile, 20-24;technology investigations, 96
industrialization, 4; capital shortage, 128Institute of Gas Technology, 150irrigation: in Arango, 50; capital investment,
133; in China, 32; and energy.inputs, 60;energy use calculation, 139; gravity, 83;Green Revolution, 11; labor productivityand employment, 7; mechanical, 76; provisions in Latin America, 48; tropicalAfrica, 38
Japan: energy intensity, 18; energy potential,75
Krishna, Raj, 80
labor: nonmechanized agriculture, 6; rolein agriculture, 39
land: distribution, 48; organization, 130;productivity and energy analysis, 56;reform, 11; reform in China, 28
Latin America: profile, 47
Maly, J. and Fadrus, H., 147medical care: health, 134; health and
excrement, 104; in Mangaon, 125Mexico: profile of Arango, 49models: economic, 90Monfort ce., 101Musahri Plan, 130Myrdal, Gunnar, 5
Nigeria: Batagawara profile, 42nutrition, 11Nyerere, Pres., 37
Odend'hal, S., 74oil: role in Nigeria, 44Openshaw, K., 39, 69Owen, D.F., 36
Pfeffer, J.T., 144policy: and analysis of village energy use,
55; capital requirements, 79; priorities,133
Prasad, C.R., Prasad, K.K., and Reddy,A.K.N., 112, 153
production: analysis, 56Prothero, R.M., 41
Rich, William, 9Richardson, S.S., 30, 71
Singh, R.B., 149social system: in Batagawara, 44; class and
energy consumption, 49; educationalservices and medical care needs, 66; andland use, 79; tropical Africa, 36; villagedevelopment, 106
solar energy, 96
Tanzania, 36; profile, 40, 41technology: biogasification, 101; and
capital goods, 87; decentralized, 95; gasproduction, 153-155; mechanical irrigation,76
Third World: fuel and farm machines, 124;role of dung, 140; rural energy needs, 85
Toerian, T.F. and Hattingh, W.H.J., 144
United Aircraft Research Labs., 149
Varani, F., 155
Wilkie, R., 50wood: and China profile, 30. pyrolysis,
100; in Quebrada, 54; soil erosion, 68World Bank, 96
For non-commercial use only.

For non-commercial use only.

For non-commercial use only.