Embed Size (px)
Citation preview
4 Int. J. Global Energy Issues, Vol. 13, Nos. 1–3, 2000
Copyright © 2000 Inderscience Enterprises Ltd.
Energy and the protection of the atmosphere
Nebojsa Nakicenovic and Arnulf GrüblerEnvironmentally Compatible Energy Strategies Project, InternationalInstitute for Applied Systems Analysis, A-2361 Laxenburg, AustriaFax: (+43–2236) 71313.
Abstract: The essay reviews major environmental problems of energydevelopment within a broader development and sustainability context. The roleof energy in human development and major historical trends as well as theirimplications for carbon dioxide emissions are discussed. After summarizing thescientific understanding of current and possible future climate change the paperreviews available mitigation and adaptation options including: energyefficiency improvements, fuels switching, zero-carbon energy options,emission abatement and disposal at large point sources, enhancement of naturalsinks, and adaptation measures. Specific circumstances of developing versusindustrialized countries are outlined. The essay concludes with a review ofpolicy instruments that could reconcile protection of the atmosphere withhuman development and sustainability objectives.
Keywords: Energy; carbon dioxide; climate change; historical trends;mitigation options; policy instruments.
Reference to this paper should be made as follows: Nakicenovic, N. andGrübler, A. (2000) ‘Energy and the protection of the atmosphere’, Int. J.Global Energy Issues, Vol. 13, Nos. 1–3, pp.4–57.
Biographical notes: Nebojsa Nakicenovic is Project Leader of theEnvironmentally Compatible Energy Strategies Project at the InternationalInstitute for Applied Systems Analysis (IIASA), Laxenburg, Austria. He alsoserves as Convening Lead and Lead Author for the Intergovernmental Panel onClimate Change (IPCC) and as guest professor at the Technical University ofGraz. Prof. Nakicenovic holds bachelor's and master's degrees in economicsand computer science from Princeton University, New Jersey, USA and theUniversity of Vienna, where he also completed his Ph.D.
Arnulf Grübler is a research scholar at IIASA, Laxenburg, Austria and LeadAuthor for the IPCC. He holds masters and PhDs degrees from the TechnicalUniversity in Vienna, Austria and is lecturer at the Mining University, Leoben,Austria. He is editorial board member of Technological Forecasting & SocialChange and Journal of Industrial Ecology. His recent publications includeTechnology and Global Change, published by Cambridge University Press.
1 Introduction
The earth’s atmosphere is affected by many interrelated anthropogenic sources ofinterference that can lead to environmental impacts and ultimately to irreversible changesin the climate system. Human interferences include local and regional air pollution andincreasing concentrations of greenhouse gases, aerosols and halocarbons. Combustion of
Energy and the protection of the atmosphere 5
fossil fuels and unsustainable uses of biomass fuels cause extensive local and regional(transboundary) air pollution often resulting in acidification that damages entireecosystems. The extraction, conversion and combustion of fossil fuels, and to a lesserdegree land-use changes and agriculture, lead to increasing concentrations of greenhousegases that are altering the radiative balance of the atmosphere, possibly causing climatechange. Human activities have increased the atmospheric concentration of many naturallyoccurring gases and have also added new ones. Anthropogenic sources ofchlorofluorocarbons are adding to the greenhouse effect and are gradually destroying theozone layer. Taken together, these human activities are projected to change regional andglobal climate. These changes will affect large populations and especially thosecommunities that are most vulnerable, particularly the poor who have lower abilities andresources to adapt to changing climatic conditions.
Protection of the atmosphere is one of the important preconditions for ensuring thateconomic development can proceed in a sustainable manner. This essay addresses issuesrelated to the protection of the atmosphere from energy-related pollution sources. Itanalyses the relationship between energy and development, prevailing trends in energyuse throughout the world and possible future developments. Possible impacts on theatmosphere, and strategies for mitigating and avoiding adverse impacts of possibleclimate change are discussed. The report concludes with an assessment of the availablepolicy measures for the protection of the atmosphere within the context of sustainablehuman development.
1.1 Local and transboundary air pollution
Local and transboundary pollutants from energy-related activities cause the deteriorationof air quality in many urban and some rural regions throughout the world [1,2]. Variousforms of pollution often result in respiratory diseases and other health impacts andhazards. They also result in economic damage and endanger ecosystems.
High levels of indoor air pollution from burning low quality biomass or coal intraditional open fireplaces are widespread in developing countries [3]. This is harmingthe health of women and children in particular. Sulphur and particulate concentrationsthat are associated largely with coal combustion far exceed the World HealthOrganization standards in numerous large urban agglomerations, especially in developingcountries [2].
Sulphur dioxide and nitrogen oxides emissions from fossil power plants and densemotorized traffic cause regional and transboundary air pollution that leads to acidificationof forests, lakes and soils. ‘Acid rain’ has been a particular problem in Europe and NorthAmerica. More recently, transboundary air pollution and increasing acidification havealso become sources of concern in the rapidly developing, coal-intensive economies ofEast Asia [4].
1.2 Increasing concentrations of greenhouse gases
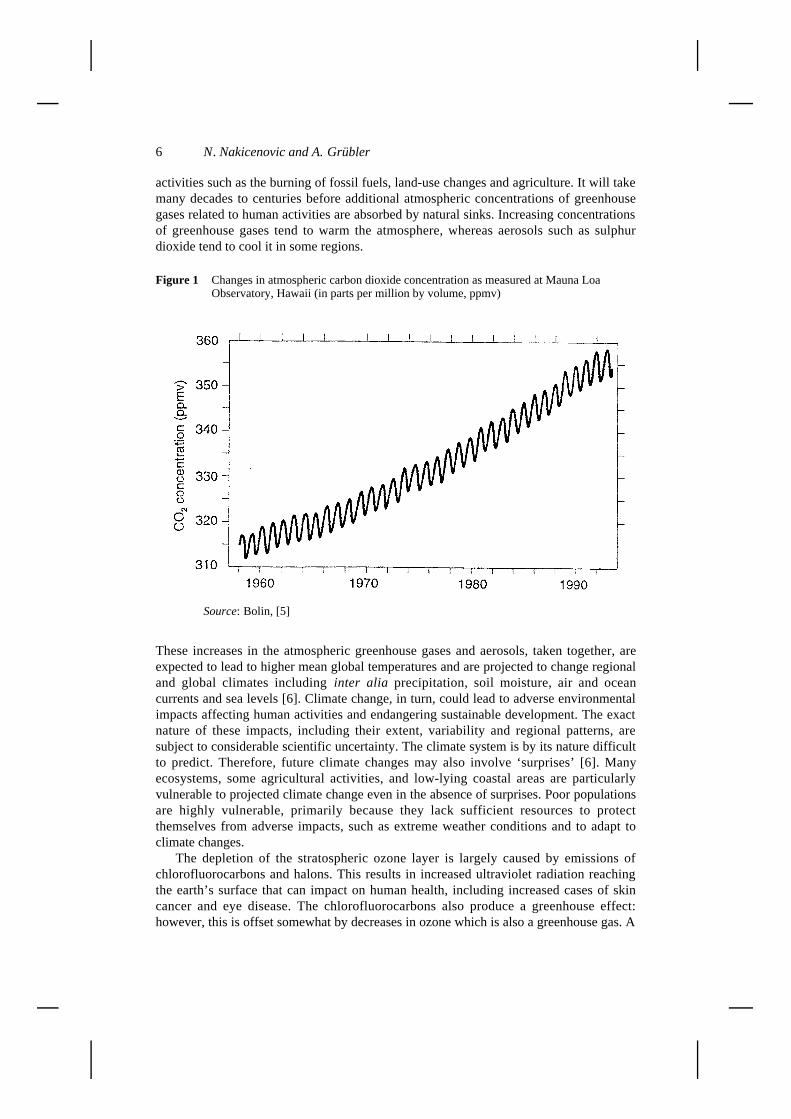
Concentrations of greenhouse gases have increased significantly since the beginning ofthe fossil fuel era two centuries ago. Atmospheric concentrations of carbon dioxide haveincreased by 30% (Figure 1), those of methane by 150% and those of nitrous oxides byover 10%. Scientific evidence is strong that most of these increases are due to human
6 N. Nakicenovic and A. Grübler
activities such as the burning of fossil fuels, land-use changes and agriculture. It will takemany decades to centuries before additional atmospheric concentrations of greenhousegases related to human activities are absorbed by natural sinks. Increasing concentrationsof greenhouse gases tend to warm the atmosphere, whereas aerosols such as sulphurdioxide tend to cool it in some regions.
Figure 1 Changes in atmospheric carbon dioxide concentration as measured at Mauna LoaObservatory, Hawaii (in parts per million by volume, ppmv)
Source: Bolin, [5]
These increases in the atmospheric greenhouse gases and aerosols, taken together, areexpected to lead to higher mean global temperatures and are projected to change regionaland global climates including inter alia precipitation, soil moisture, air and oceancurrents and sea levels [6]. Climate change, in turn, could lead to adverse environmentalimpacts affecting human activities and endangering sustainable development. The exactnature of these impacts, including their extent, variability and regional patterns, aresubject to considerable scientific uncertainty. The climate system is by its nature difficultto predict. Therefore, future climate changes may also involve ‘surprises’ [6]. Manyecosystems, some agricultural activities, and low-lying coastal areas are particularlyvulnerable to projected climate change even in the absence of surprises. Poor populationsare highly vulnerable, primarily because they lack sufficient resources to protectthemselves from adverse impacts, such as extreme weather conditions and to adapt toclimate changes.
The depletion of the stratospheric ozone layer is largely caused by emissions ofchlorofluorocarbons and halons. This results in increased ultraviolet radiation reachingthe earth’s surface that can impact on human health, including increased cases of skincancer and eye disease. The chlorofluorocarbons also produce a greenhouse effect:however, this is offset somewhat by decreases in ozone which is also a greenhouse gas. A
Energy and the protection of the atmosphere 7
reduction of the ozone depleting substances is regulated by the Montreal Protocol [7], butsome of the replacements for ozone depleting substances are, in turn, potent greenhousegases.
1.3 Energy for development and climate change
Energy production and use is the main source of many of the threats to the earth’satmosphere. Despite tremendous increases in commercial energy use to date, the majorityof the global population still has inadequate access to the kind of energy services enjoyedby the inhabitants of the industrialized countries. More than two billion people have noaccess to modern energy services whatsoever [8]. A lack of adequate energy services isone of the unfortunate symptoms of poverty. The inequalities are so great that it would bevirtually impossible for the majority of the world’s population to enjoy similar resourceintensive energy-use patterns as those prevailing in industrialized countries. Theassimilative capacity of the biosphere to absorb gigantic releases of pollutants would befar exceeded; although science is at present not in a position to suggest particularthreshold levels or exact boundary conditions for future energy development.
More sustainable energy patterns throughout the world and the protection of theatmosphere are therefore recognized as important policy objectives at both national andinternational levels [1]. International environmental agreements are being extended fromthe local and national to international levels. Examples include the European Conventionon Long-Range Transboundary Air Pollution [9] and its 1995 Second Sulphur Protocol,the Montreal Protocol [7] for the reduction of chlorofluorocarbon emissions, and theUnited Nations Framework Convention on Climate Change (FCCC) whose ultimateobjective is the “stabilization of greenhouse gas concentrations in the atmosphere at alevel that would prevent dangerous anthropogenic interference with the climate system”[10].
Adequate protection of the earth’s atmosphere to prevent ‘dangerous’ interferenceinvolves a number of formidable challenges. Considerable energy increases are requiredto satisfy basic human needs and to further social and economic development. However,the current, largely inadequate, use of energy in many instances already producesemissions that exceed tolerable levels in urban regions and that exceed critical loads formany ecosystems in rural regions. Remedies are needed urgently, but the currentdependence on fossil fuels for the provision of energy services will persist for manydecades to come. Again, the adverse impacts of energy use are going to increase withoutappropriate and timely countermeasures. Restructuring towards more sustainable energy-use patterns would require large research and development (R&D) efforts and determinedpolicy measures. It is very capital intensive, requiring new forms of financing and manydecades of capital turnover.
Protection of the atmosphere at the local, regional and global levels faces a number ofcompeting social and economic policy concerns. Some of them have higher prioritiessuch as the eradication of poverty, provision of adequate health care and employmentopportunities and a number of other basic human needs. The challenge of protecting theatmosphere is further compounded by persistent scientific uncertainties concerning theexact nature of the interaction between human activities and the atmosphere and aboutthe possible impacts of climate change, including the costs and benefits of adaptation andmitigation.
8 N. Nakicenovic and A. Grübler
The FCCC provides guidance for policies directed at protecting the atmospheredespite scientific uncertainties. This includes taking ‘precautionary measures’ especiallywhere there are threats of ‘serious irreversible damage’. The FCCC also states that the‘lack of scientific certainty should not be used as a reason for postponing such measures’,that measures should be globally cost-effective, comprehensive and that they should takeinto account different socio-economic contexts [10].
2 Energy for development
Energy needs are driven by three principal factors: population growth, economic andindustrial development and technological change. Energy can be seen as one of thefundamental requirements for economic growth and social improvements and not just aconsequence of such growth. This section assesses the role of energy in economicdevelopment, energy-related environmental impacts as a function of the level ofeconomic development and some salient preconditions for sustainable energydevelopment.
2.1 The role of energy in economic development
Prior to the Industrial Revolution, the energy system relied on harnessing natural energyflows and animate and human power to provide the required energy services, in the formof heat, light and work. Power densities and availability were constrained by site-specificfactors. Mechanical energy sources were limited to draught animals, water and windmills.Burning of fuel-wood and tallow candles were the only means of converting chemicalenergy to heat and light. Energy consumption typically did not exceed 0.5 toe (tons of oilequivalent) per capita per year [11].
Today, some two billion people still rely on similar traditional energy end-usepatterns. They use traditional energy forms and technologies and have no or inadequateaccess to modern energy services. This severely constrains the satisfaction of basic needs:it precludes the modernization of economic structures and hinders human development.
Figures 2.1 shows the 1990 per capita energy consumption in a number of worldregions by source and contrasts this with their respective populations. The height of thebars in Figure 2.1 is proportional to current capita energy use, the width of the bars isproportional to population size. Hence, the area of each bar is proportional to total energyuse. The differences in the per capita primary energy consumption in the world areindeed very large. Less than a third of the world’s population consume more than two-thirds of global energy. Cumulative historical consumption is even more unevenlydistributed: about 85% of all energy used to date has been consumed by less than 20% ofall the people who have lived since 1850.

Energy and the protection of the atmosphere 9
Figure 2.1 Primary energy use in 1990 (in toe ) by source, compared to population (in millions), for different world regions
Source: [12]
Current per capita commercial energy consumption varies by a factor of more than 20between North America and South Asia. For example, total primary energy use is about0.4 toe per capita in Bangladesh. This is ten times lower than per capita use in WesternEurope and the Pacific OECD and about 20 times lower than in North America. Thesedisparities are even higher in the use of modern, commercial energy forms, i.e., excludingthe consumption of traditional, non-commercial energy such as biomass. For example,commercial energy use is only 0.1 toe per capita in Bangladesh. This is nearly 100 timessmaller than Canada with 9.4 toe per capita. Commercial energy use per capita can differby as much as 500 between individual countries in the most extreme cases.
Western Europe and Japan have much lower per capita energy consumption whencompared to North America with about the same levels of affluence. This indicates asubstantial degree of diversity in energy consumption patterns even among industrializedcountries. Disparities are also large among developing countries and they are even largeracross different social and economic groups everywhere.
Another important difference is in the structure of energy supply. Developingcountries rely primarily on coal and other solid fuels such as traditional and non-commercial biomass [13]. Most of the industrialized countries draw on large shares ofcrude oil and natural gas in their primary energy consumption; some regions havesubstantial contributions of nuclear energy and modern renewable sources.
There is a visible and statistically significant relationship between per capita energyconsumption and per capita economic output across individual countries and regions andover time, despite the large differences in current and historical patterns of energy use.This relationship is shown in Figure 2.2. Economic output is measured in terms of Gross
10 N. Nakicenovic and A. Grübler
Domestic Product (GDP) both at prevailing market exchange rates (mer) and atpurchasing power parities (ppp). The relationship holds for both measures. The maindifference is that the purchasing power of consumers in developing regions and ineconomies in transition is higher than if measured in terms of international marketexchange rates.
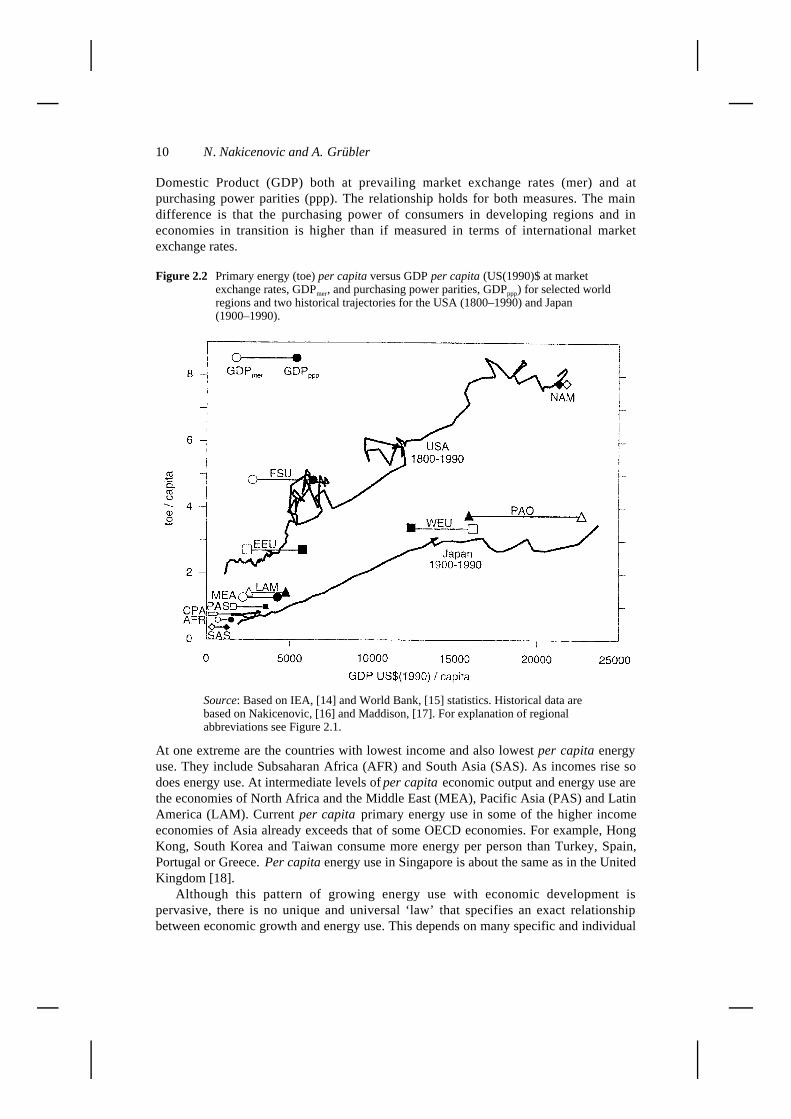
Figure 2.2 Primary energy (toe) per capita versus GDP per capita (US(1990)$ at market exchange rates, GDPmer, and purchasing power parities, GDPppp) for selected world regions and two historical trajectories for the USA (1800–1990) and Japan (1900–1990).
Source: Based on IEA, [14] and World Bank, [15] statistics. Historical data arebased on Nakicenovic, [16] and Maddison, [17]. For explanation of regionalabbreviations see Figure 2.1.
At one extreme are the countries with lowest income and also lowest per capita energyuse. They include Subsaharan Africa (AFR) and South Asia (SAS). As incomes rise sodoes energy use. At intermediate levels of per capita economic output and energy use arethe economies of North Africa and the Middle East (MEA), Pacific Asia (PAS) and LatinAmerica (LAM). Current per capita primary energy use in some of the higher incomeeconomies of Asia already exceeds that of some OECD economies. For example, HongKong, South Korea and Taiwan consume more energy per person than Turkey, Spain,Portugal or Greece. Per capita energy use in Singapore is about the same as in the UnitedKingdom [18].
Although this pattern of growing energy use with economic development ispervasive, there is no unique and universal ‘law’ that specifies an exact relationshipbetween economic growth and energy use. This depends on many specific and individual
Energy and the protection of the atmosphere 11
factors prevailing in a given country or region. It depends on historical developmentpaths, natural resource endowments, settlement patterns, transport requirements, policyand tax structures and on many other geographic, climatic, economic, social andinstitutional factors. This also explains the persistent differences in energy-use patternsbetween countries and regions even at comparable levels of income. Differentdevelopment pathways span all the extremes from ‘high energy intensity’ to ‘high energyefficiency’. This is illustrated in Figure 2.2 with the development paths of the USA andJapan; they show no apparent signs of convergence. Per capita energy consumption islower in Japan than in the USA; this was the case throughout the whole period ofindustrialization and at all levels of income.
2.2 Environmental impacts of energy
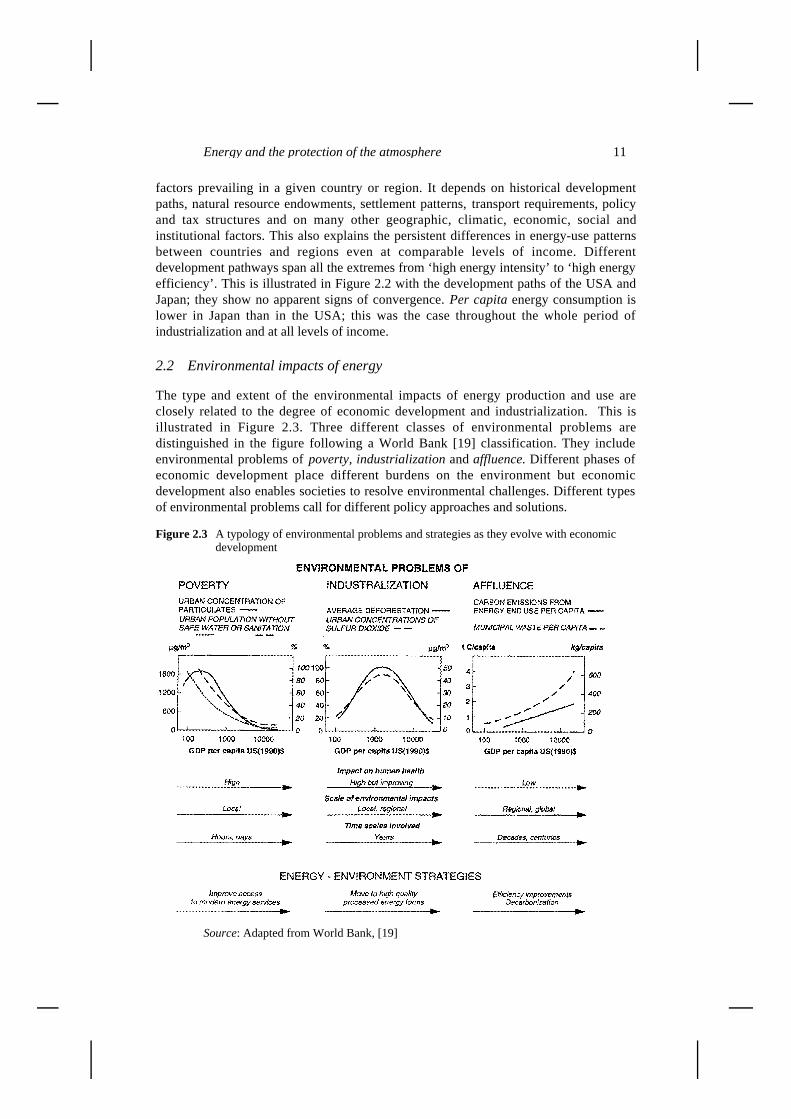
The type and extent of the environmental impacts of energy production and use areclosely related to the degree of economic development and industrialization. This isillustrated in Figure 2.3. Three different classes of environmental problems aredistinguished in the figure following a World Bank [19] classification. They includeenvironmental problems of poverty, industrialization and affluence. Different phases ofeconomic development place different burdens on the environment but economicdevelopment also enables societies to resolve environmental challenges. Different typesof environmental problems call for different policy approaches and solutions.
Figure 2.3 A typology of environmental problems and strategies as they evolve with economic development
Source: Adapted from World Bank, [19]

12 N. Nakicenovic and A. Grübler
Examples of environmental problems that result from poverty include inadequatesanitation, lack of clean drinking water, high levels of indoor and outdoor particulatematter air pollution. Indoor air pollution is largely due to (inefficient) burning of fuel-wood in traditional open fireplaces. High outdoor particulate air concentrations arelargely due to biomass and coal combustion and, to a lesser degree, to motorized traffic.Impacts are usually limited to those areas close to the source of pollution. Adverseimpacts often include poor human health, sometimes also resulting in high mortalityespecially when it occurs in combination with poverty. The main and most effectivepolicy response to these types of environmental problems is economic development itself.The eradication of poverty and increasing incomes improve accessibility to modernenergy services that decrease indoor and particulate pollution. Human health generallyimproves with economic development.
The second category of environmental problems related to the process ofindustrialization includes high ambient concentrations of sulphur dioxide and high levelsof hazardous industrial wastes. Problems emerge primarily in urban and industrial areas,but with increasing levels of industrialization they also spread to larger regions and startaffecting many ecosystems in addition to impacting on human health. Theseenvironmental impacts can range in duration from days, such as urban smog, to muchlonger time spans in cases of regional-scale pollution like acid rain, toxification of riverbasins, or deforestation of whole regions.
The environmental problems associated with industrialization tend first to intensifyand increase in magnitude and extent, they then reach a peak and thereafter decline. Theincrease during the initial phase of industrialization is due to the expansion of productionand urbanization. The reasons for the decline are also related to economic development.Once basic economic needs are satisfied and income levels have increased, the amenitiesof a clean local environment become important social and economic objectives.Economic growth also provides the resources required to tackle environmental problemssuccessfully. The policy measures required to resolve the environmental problems ofindustrialization need to combine incentives for a cleaner environment with regulatorymechanisms. Incentives need to further structural change toward more efficient use ofenergy and other resources including better energy end-use devices, cleaner fuels andimproved public infrastructures, among others. Regulatory mechanisms inter alia includeenvironmental standards, financial and tax incentives, control of large emissions pointsources, and regular equipment maintenance and replacement.
The last category of environmental problems associated with economic developmentaccording to the above classification is related to affluence. Typical examples includeever-increasing volumes of municipal wastes and energy-related emissions of greenhousegases, most notably carbon dioxide (CO2). The direct impacts on human health (toxicity)are generally low. Environmental impacts are mostly of an indirect long-term nature,extending over decades to centuries. Their extent and exact nature are often uncertain;sometimes it is not clear whether environmental impacts are even occurring or will everoccur. Examples include climate change and loss of biodiversity. Spatial scales extendfrom the regional to the global level. In contrast to the first two categories, theenvironmental problems of affluence tend to become exacerbated with rising levels ofincome and consumption, and evidence is still outstanding as to whether municipal wasteor carbon dioxide emissions might saturate with rising affluence. Hence, policy strategiesneed to be comprehensive and cover numerous economic activities; they need to promote

Energy and the protection of the atmosphere 13
long-term structural changes for production and consumption alike. There are generallyno easy, quick ‘technological fixes’.
Two important generic strategies to address environmental issues at high levels ofincome and consumption include improved energy efficiency and ‘decarbonization’ ofenergy, that is, changes towards cleaner fuel supply and end-use structures. Improvedefficiency generally reduces resource use and environmental impacts across all pollutantsand across all spatial and temporal scales. ‘Decarbonization’ also entails elements ofmultipurpose strategies as it can simultaneously reduce global, regional and local energy-related pollution. In addition to efficiency improvements and cleaner energy, so-called‘end-of-the-pipe’ pollution abatement systems have been successfully applied to largepoint sources and more recently to some mobile sources. These include sulphur andnitrogen scrubbers for power plants and catalytic converters for motor vehicles. Thesesystems have the advantage that they can be effected relatively quickly. However, theyhave a more limited effect in reducing emissions than other more generic options, such asstructural change. They tend to reduce one pollutant in one particular location, rather thanhave the broader impact of a switch to cleaner fuels or to inherently emission-free energysystems.
2.3 Energy and sustainable development
The notion of sustainable development concerns both current and future generations. Forcurrent generations, the first and foremost precondition for sustainable development is theeradication of poverty and satisfaction of basic human needs. Once these needs aresatisfied, the next objective of sustainable development is to provide the basis for humanchoices. These involve many dimensions including cultural, social and economic. Assuch they cannot be resolved by scientific methods but are, of course, a question ofvalues, preferences and policies. The same applies for future generations, albeit theuncertainties are larger because the social, cultural and economic contexts for futuregenerations is unknown.
The necessary preconditions for sustainable development are:
1 avoidance of catastrophic events threatening the life support functions of the earth,including irreversible changes, and
2 provision of the means and capabilities for present and future generations to satisfytheir basic needs and giving them the possibility of making choices about their livesbeyond basic needs, including the capacity to adapt to changing social, economic andenvironmental conditions.
This means the transference of increased knowledge and know-how, technology andcapital from the present to future generations. These transfers are compensation for theuse of resources by current and past generations.
For sustainable energy development this implies making sufficient energy servicesavailable to every citizen of the planet now and in the future so that basic human needscan be satisfied. However, because the current energy system predominantly relies onfossil fuel use, this involves consuming resources. In order to compensate futuregenerations for the consumption of depletable energy resources (coal, oil and gas) energysystems need to become more efficient, have a larger portfolio of technologies and
14 N. Nakicenovic and A. Grübler
options to choose from and have drastically lower environmental impacts at all levelsfrom local to global.
Another prime energy objective in the context of sustainable development is to avoidirreversible changes while fulfilling the above goals. For example, things that must beavoided include: greenhouse gas emissions at levels that would provoke major disruptivechanges in the climate system; sulphur emissions and deposition that surpass the criticalloads at which food production can be sustained; and total consumption of all easilyaccessible fossil fuel resources, particularly higher grades of oil and gas. One way ofinterpreting the above conditions for sustainable energy development is to use fossil fuelsas an endowment for preparing the necessary long-term transition towards a non-fossil,sustainable energy system.
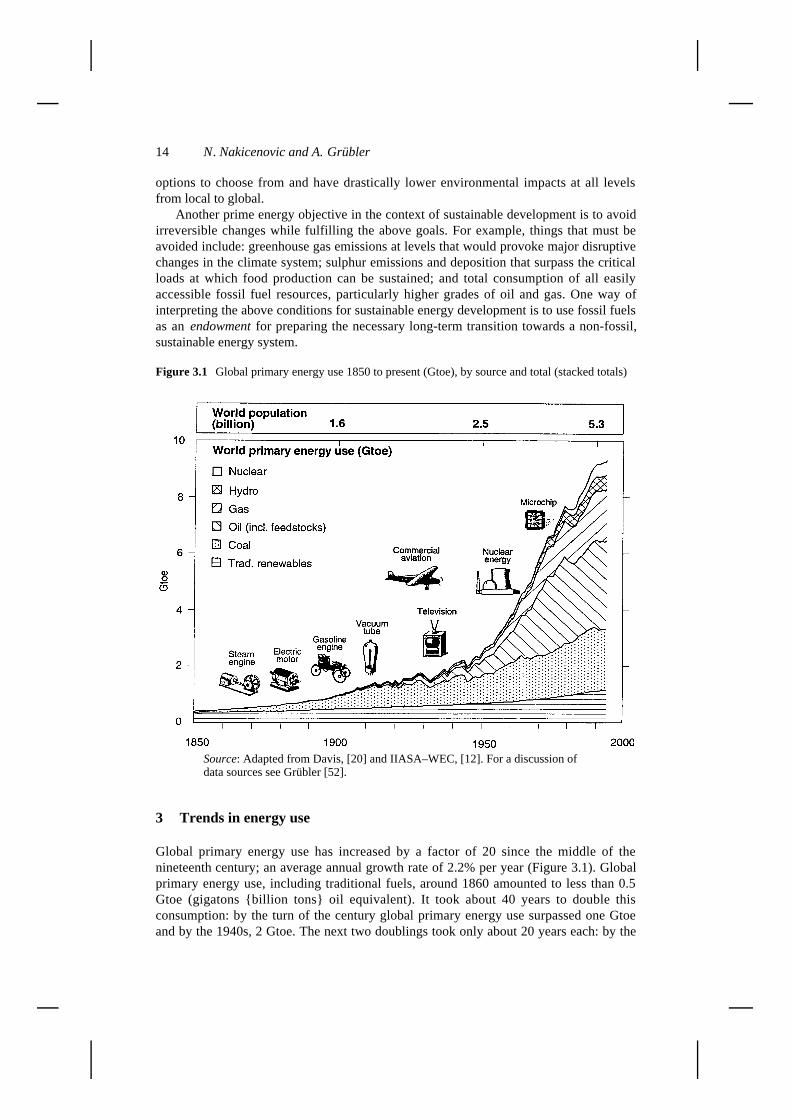
Figure 3.1 Global primary energy use 1850 to present (Gtoe), by source and total (stacked totals)
Source: Adapted from Davis, [20] and IIASA–WEC, [12]. For a discussion ofdata sources see Grübler [52].
3 Trends in energy use
Global primary energy use has increased by a factor of 20 since the middle of thenineteenth century; an average annual growth rate of 2.2% per year (Figure 3.1). Globalprimary energy use, including traditional fuels, around 1860 amounted to less than 0.5Gtoe (gigatons {billion tons} oil equivalent). It took about 40 years to double thisconsumption: by the turn of the century global primary energy use surpassed one Gtoeand by the 1940s, 2 Gtoe. The next two doublings took only about 20 years each: by the

Energy and the protection of the atmosphere 15
early 1960s global energy use surpassed 4 Gtoe and exceeded 8 Gtoe at the beginning ofthe 1980s. In 1994 global primary energy use amounted to 9.1 Gtoe [21,12].
There is a considerable variation in energy consumption growth rates over time andbetween different world regions. For example, global fossil energy consumption grew at5% per year between 1950 and 1970, at 2.3% per year between 1970 and 1990, and atonly 0.3% per year between 1990 and 1994. At the same time, the mix of primary energysources has changed dramatically.
The legacy of the tremendous expansion in the use of predominantly fossil fuels has,however, also become apparent. Since the onset of the Industrial Revolution theatmospheric concentration of carbon dioxide increased from 280 ppmv (parts per millionby volume) to 358 ppmv in 1994 (see Figure 1.1 above).
3.1 The role of technological change
The history of economic growth and development is mirrored by corresponding increasesin energy use. In turn, the increased availability of energy has enabled economic andhuman development. The enormous growth in economic output and energy use was bothdriven and enabled by continuous structural and technological changes.
Since the onset of the Industrial Revolution, two ‘grand transitions’ have shapedstructural changes in energy systems at all levels. The first was initiated with a radicaltechnological end-use innovation: the steam engine powered by coal. The steam cyclerepresented the first conversion of fossil energy sources into work; it allowed energyservices to be site independent since coal could be transported and stored as needed, andit permitted power densities that were previously only possible in exceptional locations ofabundant hydropower. Stationary steam engines were first introduced for lifting waterfrom coal mines, thereby facilitating increased coal production. Later, they providedstationary power for what was to become an entirely new form of organizing production:the factory system. Mobile steam engines, on locomotives and steam ships, enabled thefirst transport revolution as railway networks were extended to even the most remotelocations and ships converted from sail to steam. Characteristic energy consumptionlevels during the ‘steam age’, approximately the mid-nineteenth century in the UK, wereabout 2 toe per capita per year. By the turn of the twentieth century, coal had replacedtraditional non-fossil energy sources and supplied virtually all the primary energy needsof industrialized countries.
The second grand transition was the increased diversification of both energy end-usetechnologies and energy supply sources. Perhaps the most important single innovationwas the introduction of electricity as the first energy carrier to be easily converted tolight, heat or work at the point of end use. A second key innovation was the internalcombustion engine that revolutionized individual and public transport through the use ofcars, buses and aircraft. Like the transition triggered by the steam engine, this‘diversification transition’ was led by technological innovations in energy end use, suchas the electric light bulb, the electric motor, the microchip and the computer, the internalcombustion engine and aircraft. However, changes in energy supply have been equallyfar-reaching. In particular, oil emerged from being an expensive curiosity at the end ofthe nineteenth century to reaching the dominant global position it has occupied for thelast 30 years.
16 N. Nakicenovic and A. Grübler
3.2 Historical trends by energy source
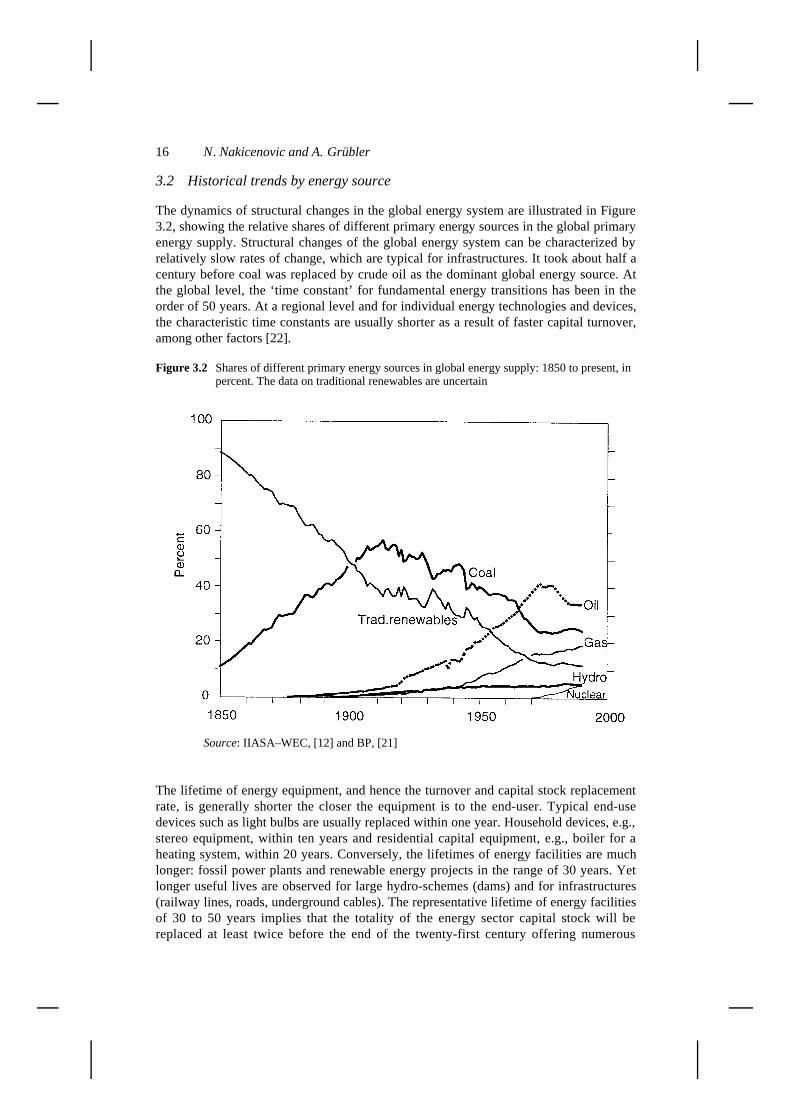
The dynamics of structural changes in the global energy system are illustrated in Figure3.2, showing the relative shares of different primary energy sources in the global primaryenergy supply. Structural changes of the global energy system can be characterized byrelatively slow rates of change, which are typical for infrastructures. It took about half acentury before coal was replaced by crude oil as the dominant global energy source. Atthe global level, the ‘time constant’ for fundamental energy transitions has been in theorder of 50 years. At a regional level and for individual energy technologies and devices,the characteristic time constants are usually shorter as a result of faster capital turnover,among other factors [22].
Figure 3.2 Shares of different primary energy sources in global energy supply: 1850 to present, in percent. The data on traditional renewables are uncertain
Source: IIASA–WEC, [12] and BP, [21]
The lifetime of energy equipment, and hence the turnover and capital stock replacementrate, is generally shorter the closer the equipment is to the end-user. Typical end-usedevices such as light bulbs are usually replaced within one year. Household devices, e.g.,stereo equipment, within ten years and residential capital equipment, e.g., boiler for aheating system, within 20 years. Conversely, the lifetimes of energy facilities are muchlonger: fossil power plants and renewable energy projects in the range of 30 years. Yetlonger useful lives are observed for large hydro-schemes (dams) and for infrastructures(railway lines, roads, underground cables). The representative lifetime of energy facilitiesof 30 to 50 years implies that the totality of the energy sector capital stock will bereplaced at least twice before the end of the twenty-first century offering numerous
Energy and the protection of the atmosphere 17
opportunities for efficiency improvements and for restructuring the energy system awayfrom fossil fuels.
3.3 Trends in energy use by sector
Sectoral energy use patterns vary considerably across different world regions andcountries. From 9 Gtoe primary energy consumed worldwide in 1990, about 6.5 Gtoewere delivered to final use, implying an overall primary to final energy conversionefficiency of about 72%. The 6.5 Gtoe final energy is divided unequally among sectors.The largest share of about 40% is due to combined energy use in agriculture, householdsand commercial sectors, including the direct use of traditional, non-commercial fuelscollected and consumed locally. The next largest share of about 31% is accounted for byindustrial energy uses and another 6% by industrial feedstock requirements (non-energyuses of fossil fuels). Globally, the transport sector has the lowest share of about 23% inall final energy use, but the highest growth rate of all sectoral energy uses [23]. Table 3.1disaggregates this global situation in 1990 by major developing world regions and bythree global ‘macro-regions’ as defined by the Climate Convention: the OECD, thereforming (transition) economies (REFs) and the developing countries (DCs). Table 3.2gives the corresponding average annual growth rates between 1970 and 1990.
In the OECD countries, final energy consumption is almost equally distributed amongthe three sectoral uses given in Table 3.1. In the reforming economies, industrial usesaccount for by far the largest share and in developing countries, agricultural, householdand commercial activities. In both the OECD and developing countries, the highest ratesof growth are transportation energy requirements. Industrial energy use has actuallydecreased in the OECD countries. In contrast, industrial energy use is growing rapidly indeveloping countries due to economic development and industrialization.
Table 3.1 1990 primary and final energy use by sector, for three world macro-regions and for sixdeveloping regions, in Mtoe
OECDa REFsb DCsc AFR MEA CPA SAS PAS LAM WORLD
Primary 4181.0 1738.8 3056.2 287.5 348.5 944.8 443.7 424.0 607.8 8976.0
Final incl. 2881.2 1200.0 2368.7 221.8 237.8 751.0 356.4 343.4 458.3 6449.9
Industry 799.6 551.7 676.3 33.3 71.4 338.9 74.6 67.3 90.9 2027.6
Transport 907.8 167.0 380.1 24.9 106.8 49.1 35.6 56.3 107.5 1454.8
Othersd 918.1 433.0 1249.6 160.7 50.3 355.9 241.4 205.2 236.1 2600.7
Feedstockse 255.7 48.3 62.7 2.9 9.3 7.2 4.9 14.6 23.8 366.7
Source: Based on IEA, [14] statistics and WEC, [24]
For definitions of regional abbreviations see Figure 2.1aFCCC Annex II countries.bFCCC Annex I countries undergoing the process of transition to a market economy.cDeveloping countriesdIncludes non-commercial fuels.eNon-energy uses.
18 N. Nakicenovic and A. Grübler
Table 3.2 Primary and final energy use by sector, for three world macro-regions and for six developing regions. Average annual growth rates 1970–1990
OECD REFs DCs AFR MEA CPA SAS PAS LAM WORLD
Primary 1.3 2.6 4.5 3.5 7.7 4.7 4.2 4.1 3.8 2.5
Final incl. 0.9 2.2 4.0 2.9 7.4 4.3 3.7 3.3 3.4 2.1
Industry –0.4 1.6 4.2 2.2 6.7 3.3 6.2 7.4 4.5 1.4
Transport 2.2 2.0 5.8 2.1 11.8 5.3 4.0 7.7 3.9 2.9
Others 0.7 3.2 3.3 3.2 3.6 5.2 3.1 2.3 2.6 2.2
Feedstocks 2.0 2.7 7.9 5.2 8.2 20.8 1.5 10.7 7.8 2.7
Numbers in italics indicate growth rates above average
Date source: see Table 3.1
3.4 Trends in energy patterns by region
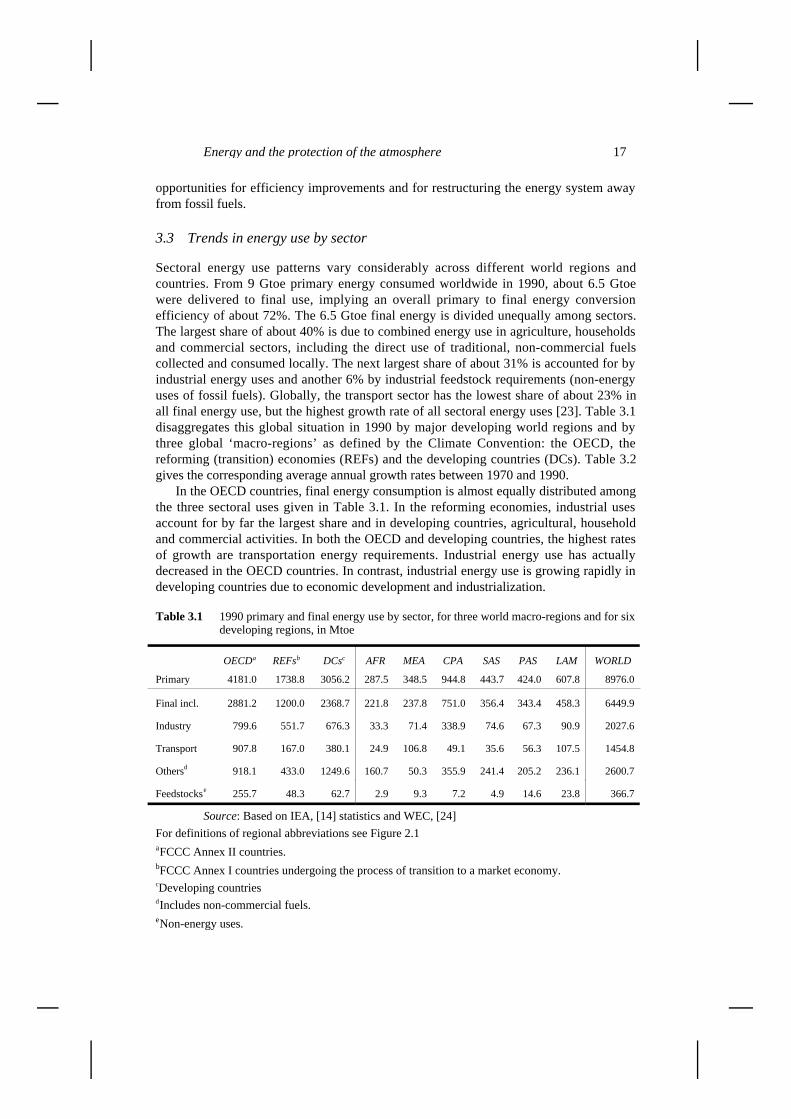
Much of the historical increase in global primary energy consumption has occurred in themore developed countries. While they still consume two thirds of all primary energy,their share is declining as the world develops. Energy consumption is growing rapidly,especially in the economies undergoing vigorous development in some regions of Asiaand most of the increases in future energy consumption can be expected to occur in whatare now developing countries.
Figure 3.3 Global fossil primary energy use since 1850, industrialized versus developing countries, in Gtoe.
Source: Based on data in Grübler and Nakicenovic, [25] and Fujii, [26].

Energy and the protection of the atmosphere 19
Figure 3.3 shows global primary energy consumption since 1850 disaggregated intoindustrialized and developing countries. It clearly illustrates that most of the historicaland present energy consumption is indeed accounted for by the now industrializedregions of the world. It also shows that during most of the present century, growth ratesof energy consumption in the developing economies exceeded those of the industrializedcountries by a wide margin, albeit at substantially lower absolute consumption levels.
Table 3.3 documents some of these differences in the levels of primary energy useand the average annual growth rates between three ‘macro-regions’ of the world.Especially high are the growth rates of fossil energy consumption in the developingcountries, in particularly during the 1950s and 1960s, averaging almost 9% per year. Thisillustrates the rapid replacement of traditional by commercial (fossil) energy forms inaddition to and beyond the increase in energy consumption along with economicdevelopment in these regions. Although the growth rates have slowed down over the lastdecade, this process still continues today.
Table 3.3 Levels of total primary energy use, total and fossil energy (in parentheses) in Gtoe (top part) and average annual growth rates for selected periods, in percent per year (bottom part) for three macro-regions of the world as defined by the Climate Convention.
In Gtoea 1850 1900 1950 1970 1990 1994 b
OECDc .4 (<.1) .9 ( .5) 1.4 (1.2) 3.1 (2.8) 4.2 (3.4) 4.4 (3.7)
REFsd – – (<.1) .3 ( .3) 1.0 (1.0) 1.7 (1.6) 1.4 (1.2)
DCse – – (<.1) .4 ( .1) 1.1 ( .6) 3.1 (1.9) 3.3 (2.2)
World >.4 (<.1) > .9 ( >.5) 2.1 (1.6) 5.2 (4.4) 9.0 (6.9) 9.1 (7.0)
1850–1900 1900–1950 1950–1970 1970–1990 1990–1994 Totalperiod f
OECDc – (4.6) – (2.0) 4.0 (4.2) 1.6 (1.0) 1.4 (1.7) 2.7 (2.5)
REFsd – – (4.1) 5.7 (6.4) 2.8 (2.4) –6.4 (–7.2) 3.2 (4.1)
DCse – – (3.8) 5.1 (8.9) 5.1 (6.3) 2.3 (3.2) 4.8 (6.9)
World 1.7 (4.9) 1.7 (2.3) 4.5 (5.0) 2.8 (2.3) 0.4 (0.3) 2.2 (3.5)aInclude feedstock uses of energy, and non-commercial and renewable energybPreliminary datacFCCC Annex II countriesdFCCC Annex I countries undergoing the process of transition to a market economyeDeveloping countriesfPeriod for which data are available
3.5 Energy intensities of economic activities
Another important effect of economic development and technological change is theirimpact on energy intensities. Energy intensities express the amount of energy requiredper unit of economic output, usually measured by GDP, either for the economy at large orfor particular sectors/activities. The principal impact of technological change is that itstimulates efficiency improvements and structural changes in economic activities, thusgenerally lowering energy intensities.

20 N. Nakicenovic and A. Grübler
The causes of energy intensity decreases are many and complex. They include, first,technological improvements in individual energy end use and conversion components –for example, a more efficient stove or a more efficient power plant; structural shifts in theenergy system, such as moving from coal-fired electricity generation to a gas-firedcombined cycle plant; and interfuel substitution at the level of energy end use, like thereplacement of fuel-wood by Liquid Petroleum Gas (LPG). They include economic shiftsfrom more to less energy-intensive activities, and changing patterns of energy end uses,and ultimately, changing lifestyles. Not every change in every one of these categoriesrepresents a decrease in energy intensity but taken together, the overall trends arepersistent and pervasive.
Figure 3.4 illustrates the scale of energy intensity improvements since the onset of theIndustrial Revolution for total and commercial primary energy, respectively. Energyintensities for developing and transitional economies are expressed per unit of GDP basedon market exchange rates (GDPmer) and based on purchasing power parities (GDPppp).
Figure 3.4 Primary energy intensity for selected countries, total and commercial energy, in kgoe per US(1990)$. Intensities are given both for GDPmer and GDPppp. (For USA and Japan GDPmer ≈ GDPppp)
Data sources: Nakicenovic, [27]; Martin, [28] and TERI, [29]

Energy and the protection of the atmosphere 21
Aggregate energy intensities, including noncommercial energy, generally improve overtime and this is true in all countries. A unit of GDP in the USA, for example, nowrequires less than one-fifth of the primary energy needed 200 years ago [27]. Thiscorresponds to an average annual decrease in energy intensity of roughly one percent peryear. The process is not always smooth, as data from other countries illustrate. Periods ofrapid improvements are interlaced with periods of stagnation. Energy intensities mayeven rise in the early takeoff stages of industrialization, when an energy and materials-intensive industrial and infrastructure base needs to be developed.
While aggregate energy intensities generally improve over time, commercial energyintensities follow a different path. They first increase, reach a maximum and thendecrease. The initial increase is due to commercial energy carriers substituting fortraditional energy forms and technologies. Once that process is largely complete,commercial energy intensities decrease in line with the pattern found for aggregateenergy intensities. Because most statistics document only modern, commercial energyuse, this ‘hill of energy intensity’ has been discussed frequently in the literature (e.g.[30]). Its existence in the case of commercial energy intensities, however, does notdiminish the power of the result for aggregate energy intensities – there is a decisive,consistent long-term trend toward improved energy intensity across a wide array ofnational experiences.
History matters. While the trend is one of conditional convergence across countries,the patterns of energy intensity improvements in different countries reflect their differentsituations and development histories. Economic development is a cumulative process,incorporating in different countries different consumption lifestyles, different settlementpatterns and transport requirements, different industrial structures and different takeoffdates into industrialization. Thus the evolution of national energy intensities is pathdependent. In Figure 3.4, for example, there is an evident distinction between the ‘highintensity’ energy development trajectory of the USA and the ‘high efficiency’ trajectoryof Japan.
3.6 Carbon dioxide emissions and carbon intensities
Energy extraction, conversion and end use impact on the environment at all levels: local,regional and global. At the global level, the emissions of so-called greenhouse gasescould possibly lead to irreversible global climate change. Energy is the most importantsingle source of greenhouse gases. It contributes about two thirds of all anthropogenicsources of carbon dioxide emissions, the most important of all greenhouse gases and isalso a major source of methane, the second most important greenhouse gas.
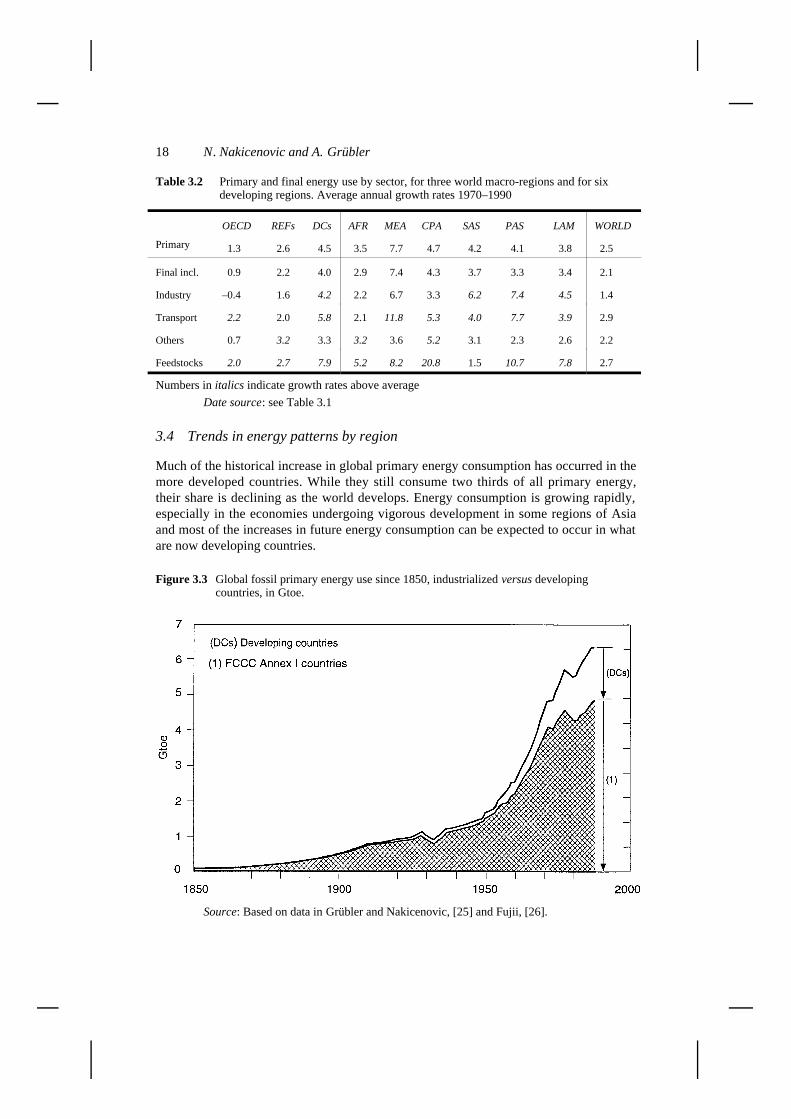
Figure 3.5 shows 1990 per capita , energy-related and non-energy (e.g., deforestation)carbon dioxide emissions in a number of world regions by source and relates these to therespective population size. The area of each bar is proportional to total carbon dioxideemissions in the particular region. The current levels of per capita, fossil-fuel carbonemissions across the world regions differ by a factor of 30. A persistent per capitaemission gap remains even after including carbon emissions from land-use changes,currently concentrated in tropical latitudes.
22 N. Nakicenovic and A. Grübler
Figure 3.5 1990 per capita CO2 emissions (tons C per capita) per region and source, fossil fuels and range for biota sources compared to population (million)
Source: IPCC SAR WG II, [22]
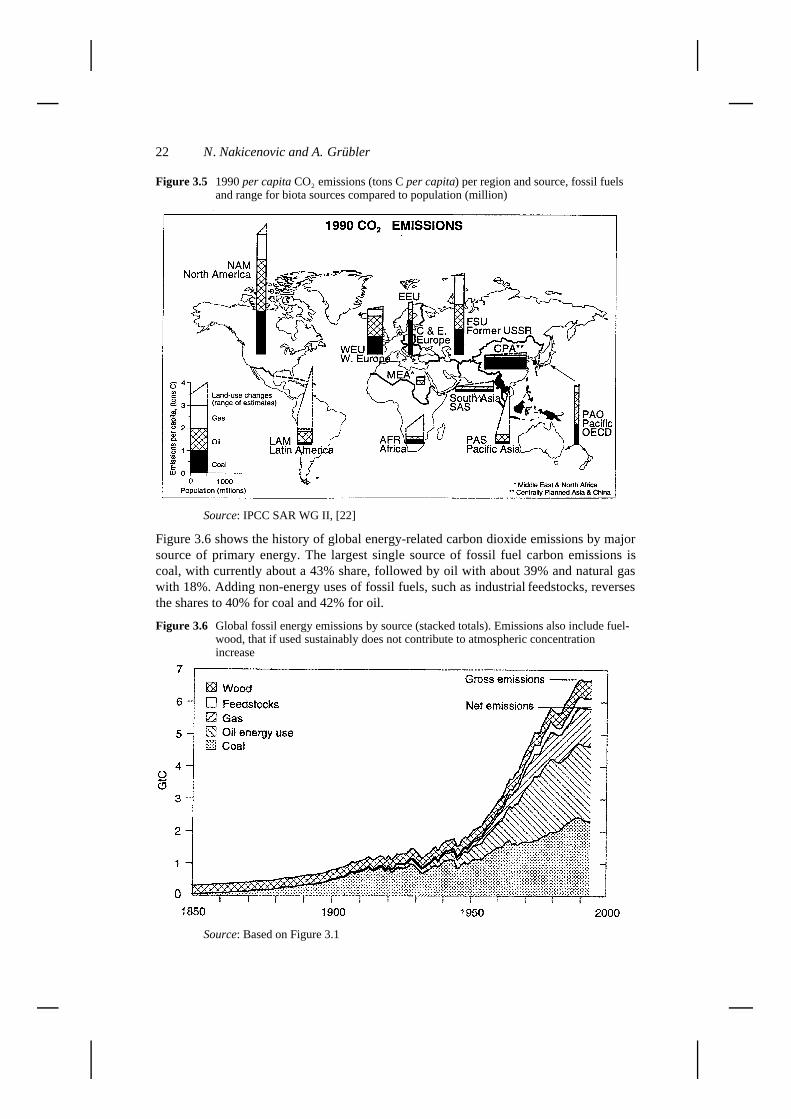
Figure 3.6 shows the history of global energy-related carbon dioxide emissions by majorsource of primary energy. The largest single source of fossil fuel carbon emissions iscoal, with currently about a 43% share, followed by oil with about 39% and natural gaswith 18%. Adding non-energy uses of fossil fuels, such as industrial feedstocks, reversesthe shares to 40% for coal and 42% for oil.
Figure 3.6 Global fossil energy emissions by source (stacked totals). Emissions also include fuel-wood, that if used sustainably does not contribute to atmospheric concentration increase
Source: Based on Figure 3.1
Energy and the protection of the atmosphere 23
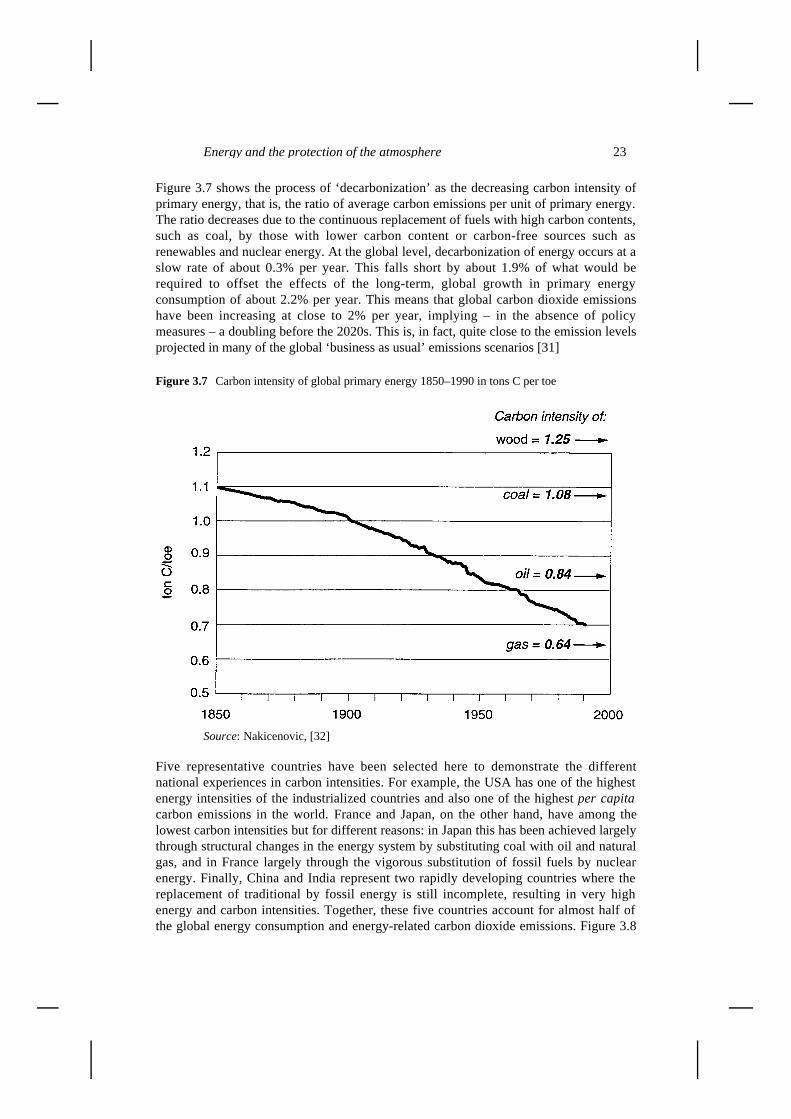
Figure 3.7 shows the process of ‘decarbonization’ as the decreasing carbon intensity ofprimary energy, that is, the ratio of average carbon emissions per unit of primary energy.The ratio decreases due to the continuous replacement of fuels with high carbon contents,such as coal, by those with lower carbon content or carbon-free sources such asrenewables and nuclear energy. At the global level, decarbonization of energy occurs at aslow rate of about 0.3% per year. This falls short by about 1.9% of what would berequired to offset the effects of the long-term, global growth in primary energyconsumption of about 2.2% per year. This means that global carbon dioxide emissionshave been increasing at close to 2% per year, implying – in the absence of policymeasures – a doubling before the 2020s. This is, in fact, quite close to the emission levelsprojected in many of the global ‘business as usual’ emissions scenarios [31]
Figure 3.7 Carbon intensity of global primary energy 1850–1990 in tons C per toe
Source: Nakicenovic, [32]
Five representative countries have been selected here to demonstrate the differentnational experiences in carbon intensities. For example, the USA has one of the highestenergy intensities of the industrialized countries and also one of the highest per capitacarbon emissions in the world. France and Japan, on the other hand, have among thelowest carbon intensities but for different reasons: in Japan this has been achieved largelythrough structural changes in the energy system by substituting coal with oil and naturalgas, and in France largely through the vigorous substitution of fossil fuels by nuclearenergy. Finally, China and India represent two rapidly developing countries where thereplacement of traditional by fossil energy is still incomplete, resulting in very highenergy and carbon intensities. Together, these five countries account for almost half ofthe global energy consumption and energy-related carbon dioxide emissions. Figure 3.8

24 N. Nakicenovic and A. Grübler
shows the historical evolution of carbon intensity of energy for these five countries. It isnoteworthy that decarbonization has occurred in all of these five countries despite theirdiversity. However, without continuing structural changes in the energy system towardsless carbon intensive and carbon free sources of energy, trend reversals cannot beexcluded in the future.
Figure 3.8 Carbon intensity of primary energy for selected countries, in tons C per toe
Source: Nakicenovic, [32]
3.7 Contributions to atmospheric concentration increases
The industrialized countries account for some 70% of the present carbon dioxideemissions. They are also responsible for most of the historical emissions. Although atmuch lower absolute levels, the emissions of developing countries are growing morerapidly than in the industrialized ones. Figure 3.9 shows the history of fossil energycarbon dioxide emissions by major world regions. Some 240 GtC (Gigatons, or billiontons, of elemental carbon) have been released into the atmosphere by energy-relatedactivities. This is much larger than the estimated carbon release from deforestation andland-use changes over the same period of some 120 GtC [33].

Energy and the protection of the atmosphere 25
Figure 3.9 Global energy-related carbon emissions by major world region (stacked totals), in GtC
Source: SAR WG II, [22]
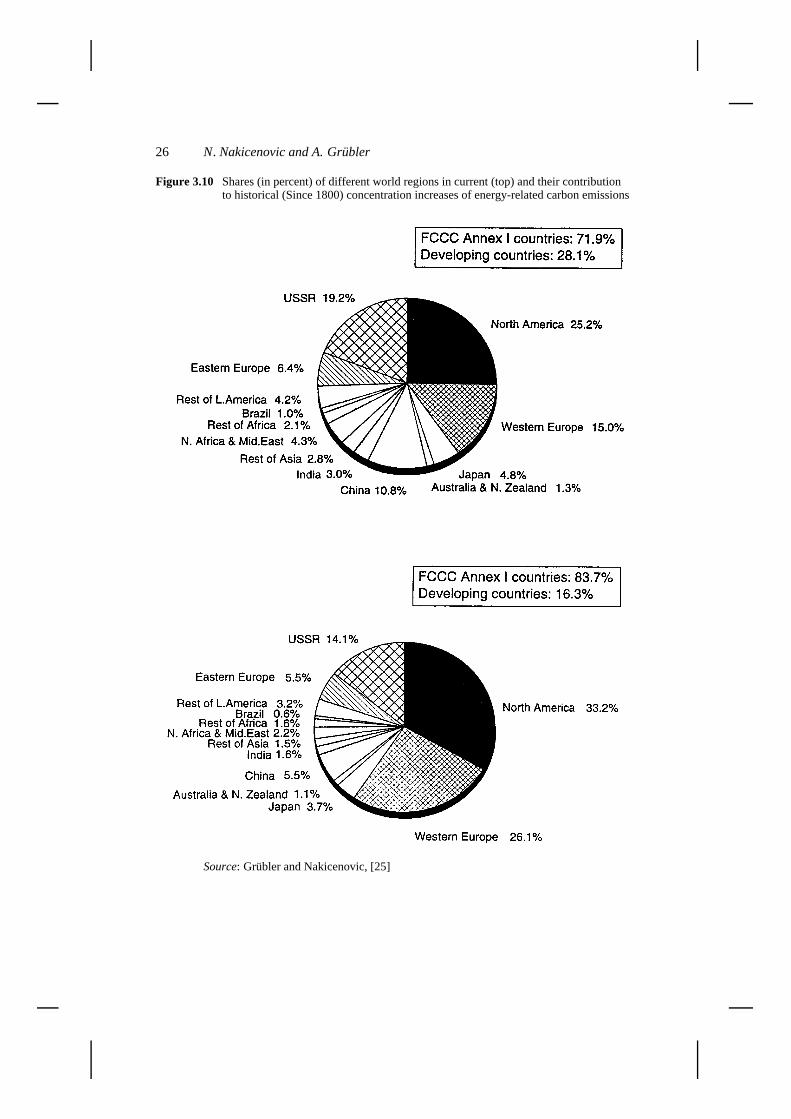
The significant divide between developed and developing countries in current fossilenergy carbon emissions becomes even larger when considering their historicaldimension: because of the long lifetime of atmospheric carbon, estimates indicate thatabout 84% of the fossil energy carbon dioxide emissions since 1800 still remaining in theatmosphere can be attributed to the past emissions of the now industrialized countries[25]. Some of the carbon dioxide emitted by James Watt’s first steam engine is stillairborne. At the other extreme, the share of developing countries in energy relatedatmospheric carbon dioxide buildup is, at 16%, very low, especially in view of the factthat about 70% of the people that have lived on earth since 1800 reside(d) in thesecountries [25]. The upper part of Figure 3.10 summarizes the regional breakdown ofenergy-related carbon dioxide emissions at the end of the 1980s, and the lower partshows the contribution of each region to atmospheric concentration increases over theentire period since 1800.
The significant differences in historical contributions to atmospheric concentrationincreases between industrialized and developing countries are somewhat reduced whenthe analysis is extended to all sources and species of greenhouse gases. Nevertheless, thepreponderance of the industrialized countries persists [25]. The differences in recent andhistorical shares of the potential ‘global warming pie’ between regions illustrate theimplications of considering the actions of past generations, in addition to theresponsibilities to be assumed by present and future generations, in climate changemitigation and adaptation efforts (see [26]). This asymmetry is also reflected in the FCCCthrough the concept of ‘common, but differentiated responsibilities’ and the specificcommitments contained in the Convention for industrialized countries [10], particularlythose not undergoing a process of transition to a market economy (FCCC Annex IIcountries, corresponding to the OECD members with the exception of Mexico).
26 N. Nakicenovic and A. Grübler
Figure 3.10 Shares (in percent) of different world regions in current (top) and their contribution to historical (Since 1800) concentration increases of energy-related carbon emissions
Source: Grübler and Nakicenovic, [25]

Energy and the protection of the atmosphere 27
4 Impacts on the atmosphere
4.1 Scientific understanding of climate change
The large variations in the atmosphere on an hourly or daily basis constitute the weather.It is governed by nonlinear ‘chaotic’ dynamics and is therefore not predictable in thedeterministic sense beyond a week or two in the future [34]. A common definition ofclimate refers to the average weather, usually described in terms of mean and otherstatistical quantities that measure variability over a period of time and given geographicalarea [34]. Mean climate is also variable over different temporal and spatial scales. For thelonger time-scales of decades to centuries associated with the change of climate due tothe effect of enhanced greenhouse warming, the United Nations Framework Conventionon Climate Change (FCCC) defines the climate system as the “totality of the atmosphere,hydrosphere, biosphere and geosphere and their interactions” [10]. According to theSecond Assessment Report (SAR) of the Intergovernmental Panel on Climate Change(IPCC), often ‘climate change’ denotes those variations due to human interference while‘climate variations’ refers to the natural ones [34].
Atmospheric trace gases help to regulate the temperature regime of the earth.Radiation from the sun is the source of energy which drives the climate system. Incomingsolar radiation warms the surface of the earth. Much of this energy is in the visible part ofthe electromagnetic spectrum. To balance the incoming energy from the sun, the earthitself must radiate on average the same amount of energy back to space by emitting in theinfrared part of the spectrum. Part of the re-emitted radiant heat is trapped by trace gasesin the atmosphere producing the ‘greenhouse effect’.
Figure 4.1 Schematic illustration of the earth’s radiative balance, in Watts per m2
Source: IPCC SAR WG I, [34]

28 N. Nakicenovic and A. Grübler
Most of the atmosphere consists of nitrogen and oxygen which are both transparent toinfrared radiation. These two gases constitute 99% of dry air. The most importantinfrared absorbing atmospheric gases are water vapour and carbon dioxide which accountfor 90% of the natural greenhouse effect. In addition to water vapour and carbon dioxide,other greenhouse gases include methane, nitrous oxide and tropospheric ozone. Figure4.1 gives a schematic illustration of the earth’s radiation and energy balance. Without allof these radiatively active gases that absorb infrared radiation, the surface temperature ofthe earth would be some 30 degrees Kelvin lower and earth would be inhabitable to lifeas we know it. This natural greenhouse effect is also involved in governing the surfacetemperature of the neighbouring plants Venus and Mars.
Since the onset of the Industrial Revolution human activities have not only increasedthe atmospheric concentrations of naturally occurring greenhouse gases, but have alsoadded new ones. Chlorofluorocarbons (CFCs) also produce a greenhouse effect, althoughthis is offset somewhat by the observed decrease in stratospheric ozone since the 1970scaused principally by CFCs and halons [33]. Human activities have altered theconcentrations of greenhouse gases both directly by anthropogenic emissions of carbondioxide, methane, nitrous oxide and CFCs and indirectly by influencing the complexatmospheric chemistry, including increases in stratospheric water vapour concentrations,depletion of stratospheric ozone and increases of tropospheric ozone concentrations.
Human activities also affect the amount of aerosols in the atmosphere whichinfluences climate in other ways They scatter some incoming solar radiation back tospace and thereby cool the earth’s surface. A further effect of aerosols is that many ofthem act as nuclei on which cloud droplets condensate and hence alter the reflection andthe absorption of solar radiation by the clouds. Aerosols occur naturally in theatmosphere, e.g., from the eruption of volcanoes or by being blown off the surface ofdeserts. Sulphur dioxide from coal power plants and biomass burning are the mainaerosols resulting from human activities. Previously this was thought to have only localsmog and regional acidic precipitation impacts. Recent IPCC findings indicate that someof the net climate warming resulting from the increased concentrations of greenhousegases is being partially offset by increased concentrations of sulphur dioxide. Becausehuman-made aerosols typically remain in the atmosphere for only a few days they tend tobe concentrated near their sources such as industrial regions. However, the aerosol effectsdo not cancel the global-scale effects of the much longer-lived greenhouse gases andsignificant climate changes can still result especially once aerosol emissions areeffectively controlled to combat local and regional air pollution [34].
Analysis of observations of surface temperature indicates that there has been a globalmean warming of 0.3 to 0.6 degrees Kelvin during the last 100 years. The observed trendof a larger increase in minimum than maximum temperatures is apparently linked toassociated increases in low clouds and aerosols as well as the enhanced greenhouse effect[34]. In addition, the warmest seven years on observed record have occurred since theearly 1980s. The last 15 years have on average probably been warmer than any similarperiod during the last 600 years [5].
It is also known that the 250 GtC of carbon dioxide emitted due to fossil fuel use andsome 120 GtC emitted due to deforestation and biomass burning have increased theatmospheric carbon dioxide content by about 28% compared to pre-industrialconcentration levels. Concentrations of other greenhouse gases such as methane, nitrousoxide and CFCs have also increased markedly. Their total combined effect, without that
Energy and the protection of the atmosphere 29
of water vapour, is at present equivalent to an increase in carbon dioxide of almost 50%[5].
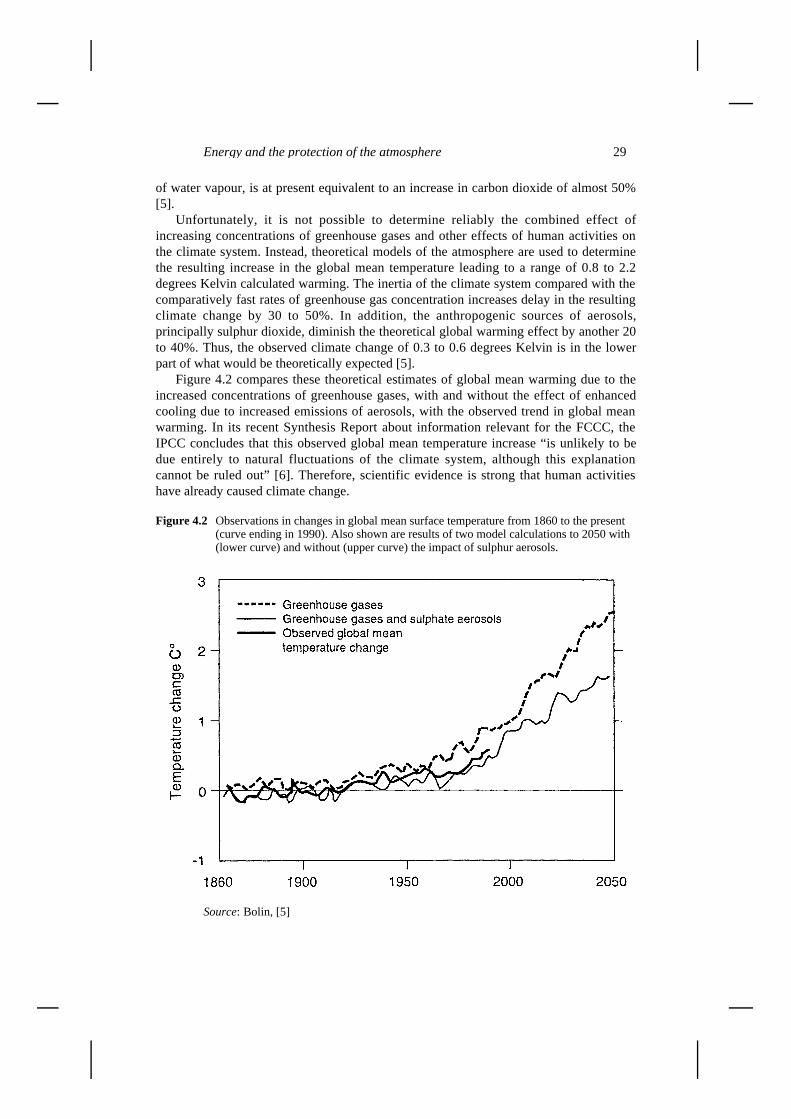
Unfortunately, it is not possible to determine reliably the combined effect ofincreasing concentrations of greenhouse gases and other effects of human activities onthe climate system. Instead, theoretical models of the atmosphere are used to determinethe resulting increase in the global mean temperature leading to a range of 0.8 to 2.2degrees Kelvin calculated warming. The inertia of the climate system compared with thecomparatively fast rates of greenhouse gas concentration increases delay in the resultingclimate change by 30 to 50%. In addition, the anthropogenic sources of aerosols,principally sulphur dioxide, diminish the theoretical global warming effect by another 20to 40%. Thus, the observed climate change of 0.3 to 0.6 degrees Kelvin is in the lowerpart of what would be theoretically expected [5].
Figure 4.2 compares these theoretical estimates of global mean warming due to theincreased concentrations of greenhouse gases, with and without the effect of enhancedcooling due to increased emissions of aerosols, with the observed trend in global meanwarming. In its recent Synthesis Report about information relevant for the FCCC, theIPCC concludes that this observed global mean temperature increase “is unlikely to bedue entirely to natural fluctuations of the climate system, although this explanationcannot be ruled out” [6]. Therefore, scientific evidence is strong that human activitieshave already caused climate change.
Figure 4.2 Observations in changes in global mean surface temperature from 1860 to the present (curve ending in 1990). Also shown are results of two model calculations to 2050 with (lower curve) and without (upper curve) the impact of sulphur aerosols.
Source: Bolin, [5]
30 N. Nakicenovic and A. Grübler
The FCCC recognizes that human activities may be causing irreversible climate changeand that preventive measures should be taken. Its prime objective as expressed in itsArticle 2 is the “stabilization of greenhouse gas concentrations in the atmosphere at alevel that would prevent dangerous anthropogenic interference with the climate system”[10].
Because of the difficulty in predicting the magnitude and geographical distribution ofclimate change, determination of what might be considered to be ‘dangerous’ levels ofanthropogenic interference with the climate system is primarily a policy rather than ascientific question. People have adapted with varying degrees of success to naturalclimate variability in the past. Since there is great uncertainty about where, how quicklyand how severe adverse impacts of climate change might be and what the potentialbenefits might be, this analysis will focus on possible strategies to stabilize greenhouseconcentrations at alternative levels.
Leaving aside the question of determining ‘dangerous’ levels of greenhouse gases,other problems are posed by the objective to stabilize their concentrations. It is knownthat enhanced concentrations of most greenhouse gases remain on average in theatmosphere for 50 to 100 years. An exception is methane with a lifetime of somewhatmore than a decade. This has two important implications for sustainable development.First, a significant decrease in greenhouse warming might take half a century or moreeven after stabilizing greenhouse gas concentrations [5]. Second, the long time scale ofclimate change and the atmospheric lifetimes of most greenhouse gases are almostmatched by the long time scales of replacing human infrastructures, such as the energysystem. Even if emissions were immediately stabilized, the long-time constants of theatmosphere system imply a lag of many decades to centuries before stabilization ofconcentrations is achieved and an equivalent lag before stabilization of temperatureoccurs.
4.2 Range of future emissions
The crucial scientific question in the context of possible climate change is to determinedifferent greenhouse gas emissions scenarios that bracket a sufficiently wide range ofalternative atmospheric concentration levels. By doing so one can explicitly specifyalternative energy development paths that correspond to different concentration levelsand thus aid the policy process of identifying stabilization of concentrations at a “levelthat would prevent dangerous interference with the climate system” [10].
Figure 4.3 shows historical carbon dioxide emissions levels and a wide range ofalternative future trajectories from the literature. The lower ones lead to stabilization ofconcentrations levels, while the high emission paths imply a continuous increase ofconcentrations beyond the end of the next century. A number of alternative stabilizationlevels and emission pathways leading to them are illustrated including 450 parts permillion by volume (ppmv), 550 ppmv (doubling of pre-industrial concentration), andranging to quite high concentrations up to 750 ppmv. The alternative scenarios in Figure4.3 have in common a doubling of the global population to about 12 billion by the end ofthe next century. For simplicity, only two sets of scenarios are shown.
Energy and the protection of the atmosphere 31
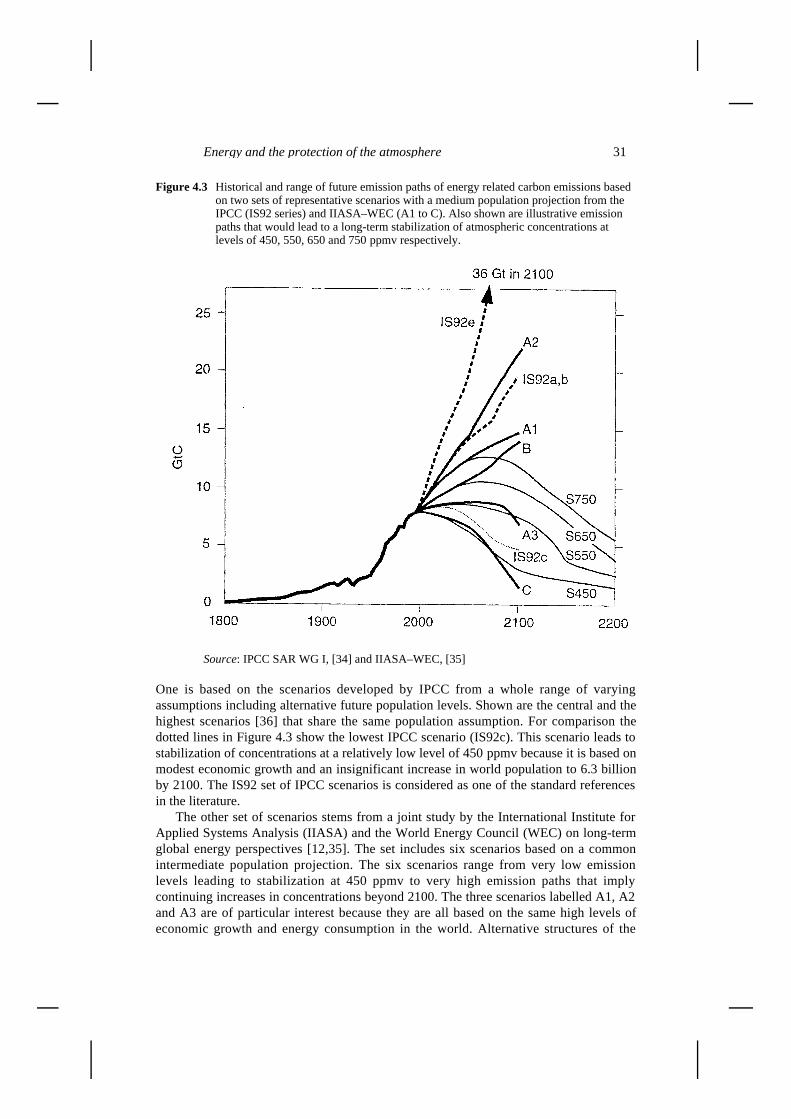
Figure 4.3 Historical and range of future emission paths of energy related carbon emissions based on two sets of representative scenarios with a medium population projection from the IPCC (IS92 series) and IIASA–WEC (A1 to C). Also shown are illustrative emission paths that would lead to a long-term stabilization of atmospheric concentrations at levels of 450, 550, 650 and 750 ppmv respectively.
Source: IPCC SAR WG I, [34] and IIASA–WEC, [35]
One is based on the scenarios developed by IPCC from a whole range of varyingassumptions including alternative future population levels. Shown are the central and thehighest scenarios [36] that share the same population assumption. For comparison thedotted lines in Figure 4.3 show the lowest IPCC scenario (IS92c). This scenario leads tostabilization of concentrations at a relatively low level of 450 ppmv because it is based onmodest economic growth and an insignificant increase in world population to 6.3 billionby 2100. The IS92 set of IPCC scenarios is considered as one of the standard referencesin the literature.
The other set of scenarios stems from a joint study by the International Institute forApplied Systems Analysis (IIASA) and the World Energy Council (WEC) on long-termglobal energy perspectives [12,35]. The set includes six scenarios based on a commonintermediate population projection. The six scenarios range from very low emissionlevels leading to stabilization at 450 ppmv to very high emission paths that implycontinuing increases in concentrations beyond 2100. The three scenarios labelled A1, A2and A3 are of particular interest because they are all based on the same high levels ofeconomic growth and energy consumption in the world. Alternative structures of the

32 N. Nakicenovic and A. Grübler
economy and energy system, however, lead to radically different emissions. In scenarioA1, for example, which is based on increasing shares of natural gas, emissions reach 15GtC in 2100. In the coal-intensive A2 scenario, they reach 22 GtC. In scenario A3, whichis based on a larger contribution of nuclear and renewable energy sources, emissionsreach only 7GtC, which is comparable to current emissions levels. This last scenario isconsistent with concentration stabilization at 550 ppmv despite high levels of economicand energy growth. It illustrates that sustainable energy development need not beassociated with austerity measures. The emissions in scenario B are comparable to thoseof A3 scenario by 2050 but then increase to twice the level of A3 by 2100 due to a lack ofsignificant structural changes in the energy system and a continuing reliance on carbon-intensive sources of energy.
The two C scenarios are a special case because they were constructed to stabilizeemissions at current levels by the mid-21st century in order to meet an emissions ceilingof 2 GtC by 2100 [37]. Such an emission profile would lead to stabilization ofconcentrations at the comparatively low level of 450 ppmv. This assumes a new regimeof global environmental governance, including full implementation of the FCCC withensuing emission control protocols and aggressive international cooperation centredaround environmental protection and international economic equity. Stabilization at 450ppmv can be considered to ensure sustainability from the point of view of possibleclimate change. Few would argue that 450 ppmv is a ‘dangerously’ high concentrationlevel for future generations. In contract to the IPCC IS92c scenario that achievedstabilization via extremely low (exogenous) demographic and economic growthassumptions, this scenario achieves stabilization at 450 ppmv levels due to deliberatepolicy action in a world of 12 billion people and with a significant reduction in currenteconomic disparities between world regions.
The scenarios shown in Figure 4.3 span a very wide range of possible future carbondioxide emissions, from two to 36 GtC by 2100, from a stabilization of concentrations ata low level of 450 ppmv to a continuous increase beyond a doubling of currentconcentrations that is reached as early as the 2070s. This range includes the majority ofemission scenarios available in the literature [31].
The analysis of alternative scenarios indicates that their cumulative emissions overtime are the single most important characteristic for determining the level of futuregreenhouse gas concentrations. This is an important and a robust result [5]. It means thatthe shape of the emissions paths is not that crucial as long as the total emissions are notchanged by a given period. For example, scenarios that foresee a more rapid increase inemissions to begin with would have to have a faster decline later on to achieve the samelevel of stabilization. What is common to all of the paths that lead to stabilization is thattheir emissions must fall to 3GtC or less per year by the time stabilization is achieved.This emissions level corresponds to the capacity of natural sinks to absorb additionalcarbon dioxide emitted to the atmosphere.
An overall result of this analysis is that scenarios that lead to stabilization at levels ofabout 450 ppmv have cumulative emissions in the range of about 600 GtC by 2100.Scenarios with cumulative emissions of more that 1,000 GtC by 2100, result inconcentrations of more than 550 ppmv, or more than double the pre-industrial levels.Scenarios in excess of 1,000 GtC cumulative emissions by 2100 lead to continuingincreases in concentration levels extending beyond that period. In comparison, the currentatmospheric carbon dioxide content is about 760 GtC. Therefore, sustainable energydevelopment from the point of view of the current understanding of possible climate

Energy and the protection of the atmosphere 33
change implies cumulative carbon dioxide emissions by 2100 in the range of less than1,000 GtC.
Most of the scenarios that lead to emissions in this lower range of the scale involveactive measures to change the structure of future energy systems so as to lead to lowerenvironmental impacts and at the same time providing sufficient energy for economicdevelopment in the world. As an illustration that such transitions to lower futuregreenhouse gas emissions paths should not be considered to occur automatically, sufficeit to say that the currently known reserves of conventional fossil energy in the world areestimated at 3,000 to 5,000 GtC, an amount that by far exceeds the above cumulativeemissions levels. The total occurrences of fossil deposits in the earth’s crust that might bein theory available to humanity as a ‘carbon endowment’ are estimated to be in the rangeof 25,000 GtC [34].
It has already been mentioned that the historical responsibility for the currentatmospheric carbon dioxide concentrations beyond the pre-industrial levels rests with thenow developed parts of the world. They are responsible for more than 80% of thisincrease. In the future, most scenarios indicate that the share of global emissions from thecurrently developing countries would increase as they industrialize and their levels ofaffluence reach those now prevailing in the developed parts of the world. By the end ofthe next century, the now developing countries may account for anywhere between 60and more than 80% of global greenhouse gas emissions. This also means that globalemission reduction strategies must take into account the future energy perspectives of thedeveloping countries. It can be argued that this puts an additional responsibility on thenow developed countries to set an example and develop the required technologies,institutions and policy measures to achieve emissions reductions. These countries notonly have the required know-how and experience but also possess the majority of thefinancial and institutional resources needed for developing the necessary preconditionsfor sustainable energy development.
5 Options for mitigation and adaptation
What are the options for the protection of the atmosphere? Mitigation and adaptationoptions and policy instruments for their implementation, need to be varied andcomprehensive in view of the multitude of pollutants, the pervasiveness of emissionsacross a wide range of human activities, and the time scales involved in possible climatechanges. The most obvious option to mitigate against undesirable impacts of unabatedemissions is emission reduction.
Modern societies depend on elaborate and complex systems for converting energyfrom less to more desirable forms. Losses occur in all these conversion processes andemissions of various pollutants are released into the atmosphere. The overall emissionsreleased by the energy system depend on the structure and efficiencies of energy supply,conversion and end use. Emissions reductions can be achieved by efficiencyimprovements, fuel switching and structural change to cleaner energy forms and bytechnological means of reducing pollutants from large point sources. Two furthermitigation options are the enhancement of greenhouse gas sinks and adaptation measures.These options and their mitigation and adaptation potential are assessed below. The final

34 N. Nakicenovic and A. Grübler
part of this section (5.7) then reviews some special circumstances in different worldregions.
5.1 Efficiency improvement potentials
Efficiency improvements constitute the most generic mitigation options. A more efficientprovision of energy services not only reduces the amount of primary energy required but,in contrast to other options with single objectives of reducing emissions of a particulargreenhouse gas, efficiency improvements also reduce adverse environmental impactsacross all pollutants, resource use and energy costs. It is also the option that is generallyconsidered to have the largest mitigation potential. However, although efficiency isimportant it is not the only determinant of all energy systems performance. Otherdeterminants include, for example, the availability and controllability of energy flows,capital and operating costs, etc. Energy can be used more or less efficiently; thissometimes depends on technical factors or the capacity utilization, but more often it is aquestion of economic and social choice, i.e., the question of lifestyles and, consequently,the kinds of energy services that are demanded and provided.
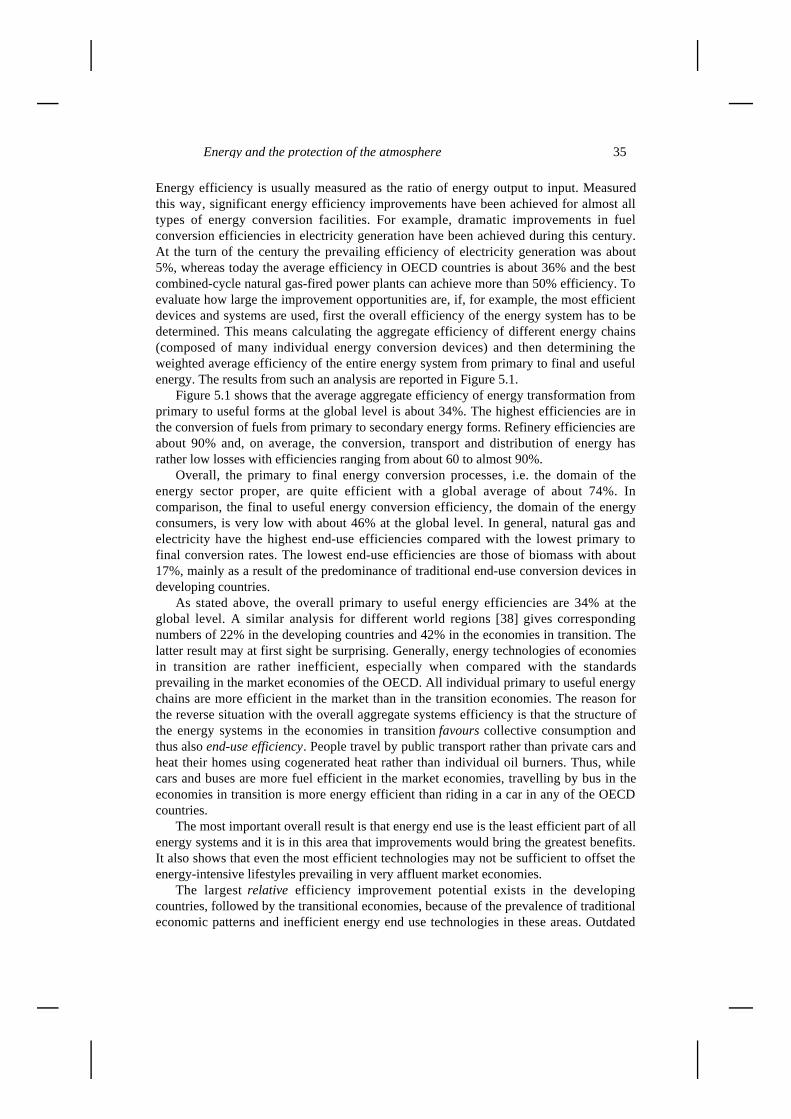
Figure 5.1 Global energy efficiency in 1990 (a), top, and efficiencies obtainable through the application of best available technologies (b), bottom; conversion efficiencies as percentages of primary energy
Source: Nakicenovic et al., [38]
Energy and the protection of the atmosphere 35
Energy efficiency is usually measured as the ratio of energy output to input. Measuredthis way, significant energy efficiency improvements have been achieved for almost alltypes of energy conversion facilities. For example, dramatic improvements in fuelconversion efficiencies in electricity generation have been achieved during this century.At the turn of the century the prevailing efficiency of electricity generation was about5%, whereas today the average efficiency in OECD countries is about 36% and the bestcombined-cycle natural gas-fired power plants can achieve more than 50% efficiency. Toevaluate how large the improvement opportunities are, if, for example, the most efficientdevices and systems are used, first the overall efficiency of the energy system has to bedetermined. This means calculating the aggregate efficiency of different energy chains(composed of many individual energy conversion devices) and then determining theweighted average efficiency of the entire energy system from primary to final and usefulenergy. The results from such an analysis are reported in Figure 5.1.
Figure 5.1 shows that the average aggregate efficiency of energy transformation fromprimary to useful forms at the global level is about 34%. The highest efficiencies are inthe conversion of fuels from primary to secondary energy forms. Refinery efficiencies areabout 90% and, on average, the conversion, transport and distribution of energy hasrather low losses with efficiencies ranging from about 60 to almost 90%.
Overall, the primary to final energy conversion processes, i.e. the domain of theenergy sector proper, are quite efficient with a global average of about 74%. Incomparison, the final to useful energy conversion efficiency, the domain of the energyconsumers, is very low with about 46% at the global level. In general, natural gas andelectricity have the highest end-use efficiencies compared with the lowest primary tofinal conversion rates. The lowest end-use efficiencies are those of biomass with about17%, mainly as a result of the predominance of traditional end-use conversion devices indeveloping countries.
As stated above, the overall primary to useful energy efficiencies are 34% at theglobal level. A similar analysis for different world regions [38] gives correspondingnumbers of 22% in the developing countries and 42% in the economies in transition. Thelatter result may at first sight be surprising. Generally, energy technologies of economiesin transition are rather inefficient, especially when compared with the standardsprevailing in the market economies of the OECD. All individual primary to useful energychains are more efficient in the market than in the transition economies. The reason forthe reverse situation with the overall aggregate systems efficiency is that the structure ofthe energy systems in the economies in transition favours collective consumption andthus also end-use efficiency. People travel by public transport rather than private cars andheat their homes using cogenerated heat rather than individual oil burners. Thus, whilecars and buses are more fuel efficient in the market economies, travelling by bus in theeconomies in transition is more energy efficient than riding in a car in any of the OECDcountries.
The most important overall result is that energy end use is the least efficient part of allenergy systems and it is in this area that improvements would bring the greatest benefits.It also shows that even the most efficient technologies may not be sufficient to offset theenergy-intensive lifestyles prevailing in very affluent market economies.
The largest relative efficiency improvement potential exists in the developingcountries, followed by the transitional economies, because of the prevalence of traditionaleconomic patterns and inefficient energy end use technologies in these areas. Outdated
36 N. Nakicenovic and A. Grübler
technological vintages and, more generally, chronic capital shortages, limit thereplacement of obsolete technologies and investment into new, more energy-efficientones. The largest absolute efficiency improvement potential remains in the industrializedcountries of the OECD, despite their generally more modern and energy efficient capitalstock. This is simply because the absolute level of energy use in the OECD countriesaccounts for 4.4 Gtoe or half of global primary energy use. The application of today’sefficiency levels of the market economies of the OECD to provide useful energy for therest of the world would reduce the global primary energy requirements by 17%, from 9 to7.5 Gtoe, and would also lead to a similar reduction in carbon dioxide emissions.
An instantaneous (hypothetical) replacement of the current global energy system bythe best and most energy efficient technologies available would result in an overallprimary to useful energy efficiency improvement of 60%, i.e., from 34% to 55% (Figure5.1). In other words, total primary energy requirements in this hypothetical scenariowould decrease from about 9 to about 5.5 Gtoe and, assuming no structural changes inthe energy system, global carbon emissions would also be reduced correspondingly, from6 to 3.6 GtC.
This assessment of the current to near-term energy efficiency improvement potentialis corroborated by other studies [22]. This impressive efficiency improvement potentialis, however, merely a technical potential. It ignores costs, the time it might take beforenew more energy-efficient technologies can be introduced, as well as the numerousinstitutional and social changes that would be necessary for their implementation.Considering these and, in particular, financial constraints, the technical potential reducesto a realizable efficiency improvement potential in the range of between ten to 30% ofcurrent energy use worldwide and is of a similar magnitude over reference baselinescenarios over the next two to three decades. This represents the economic potential ofenergy efficiency improvements: reductions in energy use that can be achieved at noadditional cost and, in most cases, at significant cost savings to society (but notnecessarily to individual consumers).
The energy efficiency improvement potentials identified above represent current tonear-term potentials. They are, however, inadequate as an assessment of the ultimateenergy efficiency potential. A more appropriate measure for such an assessment is todetermine the theoretical minimum energy requirements for a given task, as defined bythe second law of thermodynamics (so-called exergy analysis). The distinction betweenenergy and exergy efficiency is important because it allows the determination of theultimate potential of efficiency improvements. The second law of thermodynamicsdefines a quantity called available work or exergy. It can be used instead of energy todefine an alternative efficiency measure: the ratio of the theoretical minimum amount ofavailable work or exergy needed to perform a particular task to actual available work orexergy consumed by a particular device or a system to perform the same task.
A number of studies have analysed the efficiency of current energy systems usingsecond-law or exergy analysis. All indicate that primary to service efficiencies are as lowas a few percent. AIP [39] and later Oliver et al. [40] were among the first to give adetailed assessment of end-use exergy efficiencies, including service efficiencies. Ayres[41] calculated an overall primary exergy to service efficiency of 2.5% for the USA.Other estimates for individual countries range up to 15 to 23% [22]. Estimates of globaland regional primary-to-service exergy efficiencies vary from ten to as low as a fewpercent [42,38].
Energy and the protection of the atmosphere 37
The results indicate that the theoretical potential for efficiency improvements is verylarge, ranging between a factor of five to 20. Current energy systems are nowhere closeto the minimum energy requirements suggested by the second law of thermodynamics.This means that the current and future demand for energy services could be satisfied withas little as five to 20% of current energy use. These estimates do not involve changes ofenergy tasks or lifestyles. Allowing for such changes would make the efficiencyimprovement potential even higher. For example, such a change would be the satisfactionof mobility needs by public transport or by walking instead of a private car. Such ananalysis indicates thermodynamically defined efficiency improvement potentials. Theactual realization of these potentials depends on numerous factors and constraints, amongothers, technology development, transfer and diffusion, capital availability andappropriate economic and institutional incentives, including removal of barriers anddistortionary subsidies. However, what can already be achieved with current best practicetechnologies and devices available on the market remains significant. The realization ofthis potential, however, presupposes the availability of financing and the existence of theappropriate incentives.
5.2 Fuel switching and substitution
Fuel switching is an option that involves structural shifts from emissions-intensive fossilfuels to cleaner ones. For instance, switching from coal to natural gas reduces carbondioxide emissions and, at the same time, reduces particulates and sulphur dioxideemissions that constitute important local and regional air pollutants. About 43% ofcurrent energy-related carbon dioxide emissions originate from coal, about 39% from oiland 18% from natural gas [22]. Per unit energy, the carbon dioxide emissions of naturalgas are only half as large as those of coal and three-quarters those of oil. Fuel switching,e.g., from coal to gas in electricity generation, therefore represents a considerableemission reduction potential. Past structural changes in energy supply, from coaldominated energy systems towards oil and, more recently, natural gas, have resulted in acontinuous ‘decarbonization’ of the energy system. The global carbon dioxide emissionsdecreased per unit of primary energy used in the world as a consequence of structuralchanges in the energy system (cf. Section 3 above).
The ultimate potential of emission reduction via fuel substitution is difficult todetermine. Regional resource availability, trade possibilities, price differentials andgeopolitical considerations may limit fuel substitution possibilities, e.g., of domesticallyproduced coal by imported natural gas. The near term potential of fuel substitution israther limited because the development of alternative energy supply sources, conversionfacilities, end-use devices and the corresponding changes in infrastructures all takeconsiderable time.
Conversely, over longer time periods, the emission reduction potentials increasesubstantially. Illustrative scenarios, e.g., the ‘methane economy’ scenario developed byAusubel et al. [43] indicate that duel substitution, in particular favouring natural gas andin conjunction with the enhanced penetration of zero-carbon options such as nuclear orrenewables, could reduce emissions substantially compared to coal intensive ‘business asusual’ scenarios. These findings are corroborated by the IIASA-WEC long-term energyscenarios [12,35]. Carbon emissions by the end of the 21st century of a scenario relyingon natural gas as a transitional fuel in conjunction with significant market penetration of
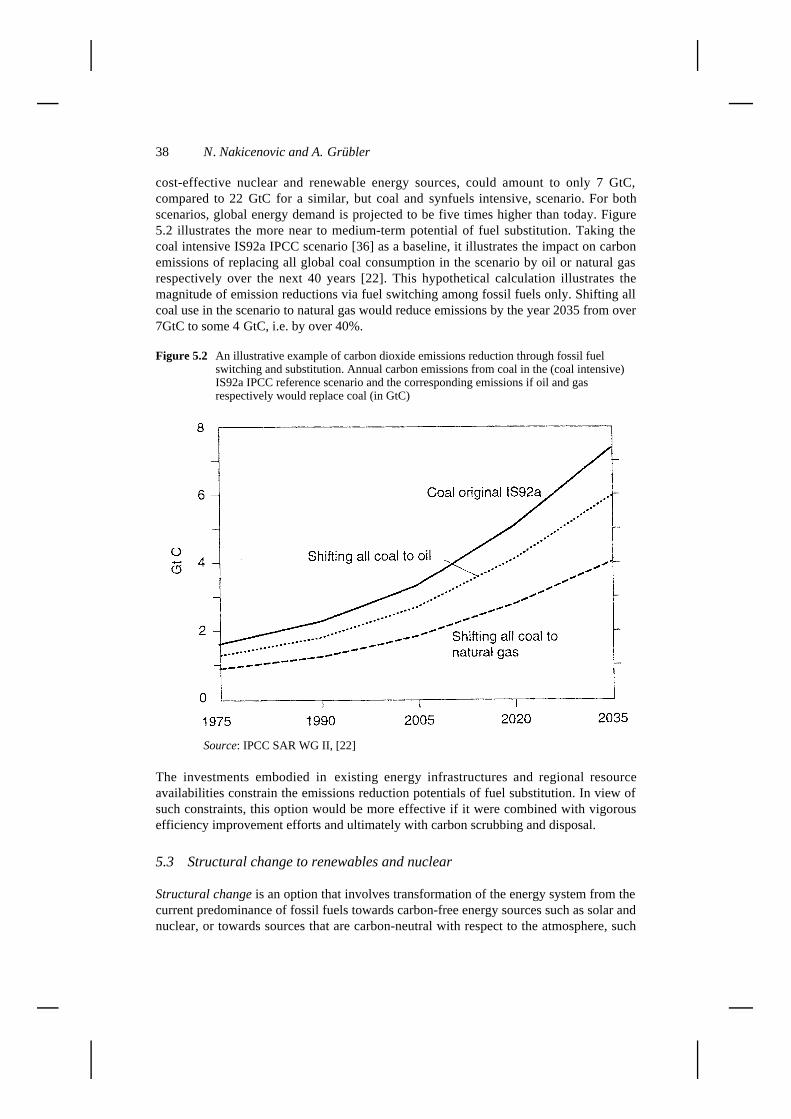
38 N. Nakicenovic and A. Grübler
cost-effective nuclear and renewable energy sources, could amount to only 7 GtC,compared to 22 GtC for a similar, but coal and synfuels intensive, scenario. For bothscenarios, global energy demand is projected to be five times higher than today. Figure5.2 illustrates the more near to medium-term potential of fuel substitution. Taking thecoal intensive IS92a IPCC scenario [36] as a baseline, it illustrates the impact on carbonemissions of replacing all global coal consumption in the scenario by oil or natural gasrespectively over the next 40 years [22]. This hypothetical calculation illustrates themagnitude of emission reductions via fuel switching among fossil fuels only. Shifting allcoal use in the scenario to natural gas would reduce emissions by the year 2035 from over7GtC to some 4 GtC, i.e. by over 40%.
Figure 5.2 An illustrative example of carbon dioxide emissions reduction through fossil fuel switching and substitution. Annual carbon emissions from coal in the (coal intensive) IS92a IPCC reference scenario and the corresponding emissions if oil and gas respectively would replace coal (in GtC)
Source: IPCC SAR WG II, [22]
The investments embodied in existing energy infrastructures and regional resourceavailabilities constrain the emissions reduction potentials of fuel substitution. In view ofsuch constraints, this option would be more effective if it were combined with vigorousefficiency improvement efforts and ultimately with carbon scrubbing and disposal.
5.3 Structural change to renewables and nuclear
Structural change is an option that involves transformation of the energy system from thecurrent predominance of fossil fuels towards carbon-free energy sources such as solar andnuclear, or towards sources that are carbon-neutral with respect to the atmosphere, such

Energy and the protection of the atmosphere 39
as the sustainable use of biomass [44]. In the latter case, the atmospheric carbon dioxidereleased during combustion is absorbed during regrowth, hence its characterization as acarbon-neutral energy source.
The emissions reduction potentials of carbon-free and neutral energy sources is largeindeed and in the long run may exceed that of efficiency improvements. Studies indicatethat over very long time scales (of one century) it would be possible to restructure theglobal energy system entirely away from the use of fossil fuels, especially whencombined with vigorous conservation and energy efficiency improvement efforts[45,12,22]. In practice many factors limit the mitigation potential of a structural change tocarbon-free and carbon-neutral energy sources such as high costs, availability oftechnology and capital and other resource constraints. For example, competing land usesbetween agriculture and ‘energy plantations’ can limit the global mitigation potential ofbiomass.
One of the most systematic analyses of the long-term potentials of renewables andnuclear energy was carried out for the World Energy Council’s 1995 Congress in Tokyo[12]. In contrast to other studies that usually focus on one single energy demand scenario,a range of demand scenarios was explored with respect to alternative energy supplyoptions. The study also considered international trade, technology availability and costs,as well as other possible constraints for the penetration of renewable and nuclear energy.Hence the resulting supply potentials identified represent a detailed techno-economicassessment rather than a mere illustration of technical or theoretical supply potentials.
Figure 5.3 Minimum and maximum annual contribution of renewables, biomass and nuclear to global energy supply, from IIASA-WEC scenarios (in Gtoe) [12,35]
Source: IIASA–WEC, [12,35]
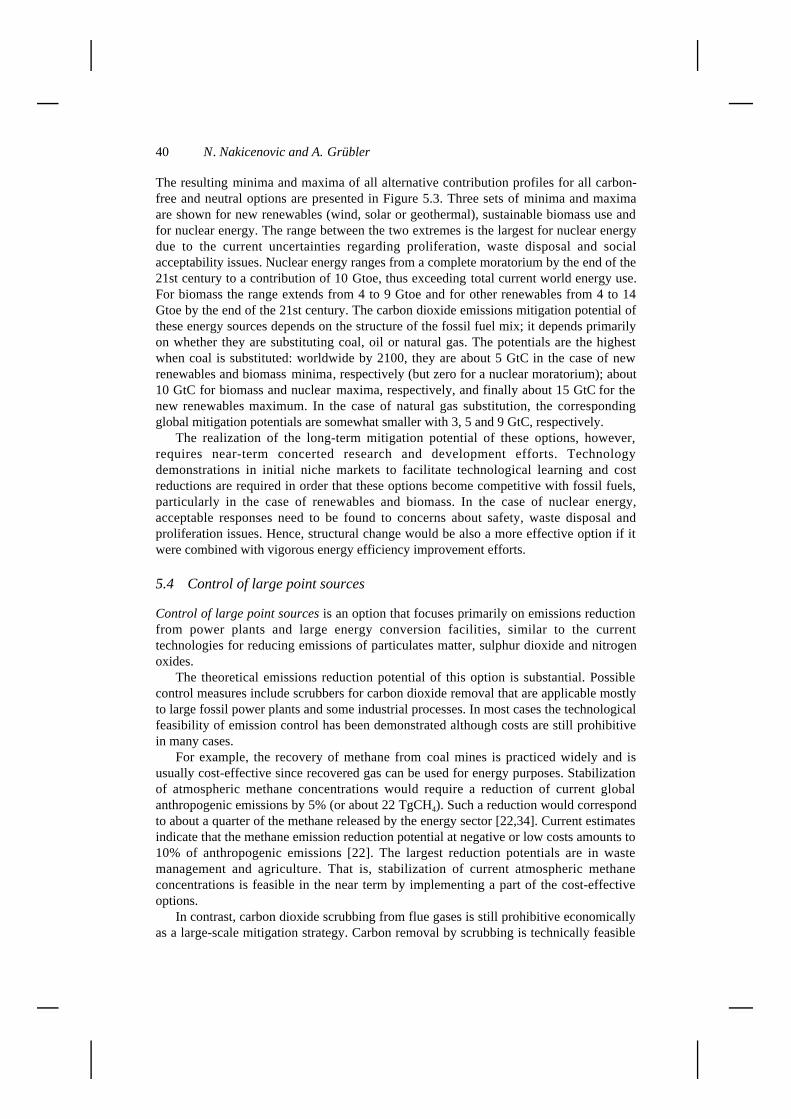
40 N. Nakicenovic and A. Grübler
The resulting minima and maxima of all alternative contribution profiles for all carbon-free and neutral options are presented in Figure 5.3. Three sets of minima and maximaare shown for new renewables (wind, solar or geothermal), sustainable biomass use andfor nuclear energy. The range between the two extremes is the largest for nuclear energydue to the current uncertainties regarding proliferation, waste disposal and socialacceptability issues. Nuclear energy ranges from a complete moratorium by the end of the21st century to a contribution of 10 Gtoe, thus exceeding total current world energy use.For biomass the range extends from 4 to 9 Gtoe and for other renewables from 4 to 14Gtoe by the end of the 21st century. The carbon dioxide emissions mitigation potential ofthese energy sources depends on the structure of the fossil fuel mix; it depends primarilyon whether they are substituting coal, oil or natural gas. The potentials are the highestwhen coal is substituted: worldwide by 2100, they are about 5 GtC in the case of newrenewables and biomass minima, respectively (but zero for a nuclear moratorium); about10 GtC for biomass and nuclear maxima, respectively, and finally about 15 GtC for thenew renewables maximum. In the case of natural gas substitution, the correspondingglobal mitigation potentials are somewhat smaller with 3, 5 and 9 GtC, respectively.
The realization of the long-term mitigation potential of these options, however,requires near-term concerted research and development efforts. Technologydemonstrations in initial niche markets to facilitate technological learning and costreductions are required in order that these options become competitive with fossil fuels,particularly in the case of renewables and biomass. In the case of nuclear energy,acceptable responses need to be found to concerns about safety, waste disposal andproliferation issues. Hence, structural change would be also a more effective option if itwere combined with vigorous energy efficiency improvement efforts.
5.4 Control of large point sources
Control of large point sources is an option that focuses primarily on emissions reductionfrom power plants and large energy conversion facilities, similar to the currenttechnologies for reducing emissions of particulates matter, sulphur dioxide and nitrogenoxides.
The theoretical emissions reduction potential of this option is substantial. Possiblecontrol measures include scrubbers for carbon dioxide removal that are applicable mostlyto large fossil power plants and some industrial processes. In most cases the technologicalfeasibility of emission control has been demonstrated although costs are still prohibitivein many cases.
For example, the recovery of methane from coal mines is practiced widely and isusually cost-effective since recovered gas can be used for energy purposes. Stabilizationof atmospheric methane concentrations would require a reduction of current globalanthropogenic emissions by 5% (or about 22 TgCH4). Such a reduction would correspondto about a quarter of the methane released by the energy sector [22,34]. Current estimatesindicate that the methane emission reduction potential at negative or low costs amounts to10% of anthropogenic emissions [22]. The largest reduction potentials are in wastemanagement and agriculture. That is, stabilization of current atmospheric methaneconcentrations is feasible in the near term by implementing a part of the cost-effectiveoptions.
In contrast, carbon dioxide scrubbing from flue gases is still prohibitive economicallyas a large-scale mitigation strategy. Carbon removal by scrubbing is technically feasible
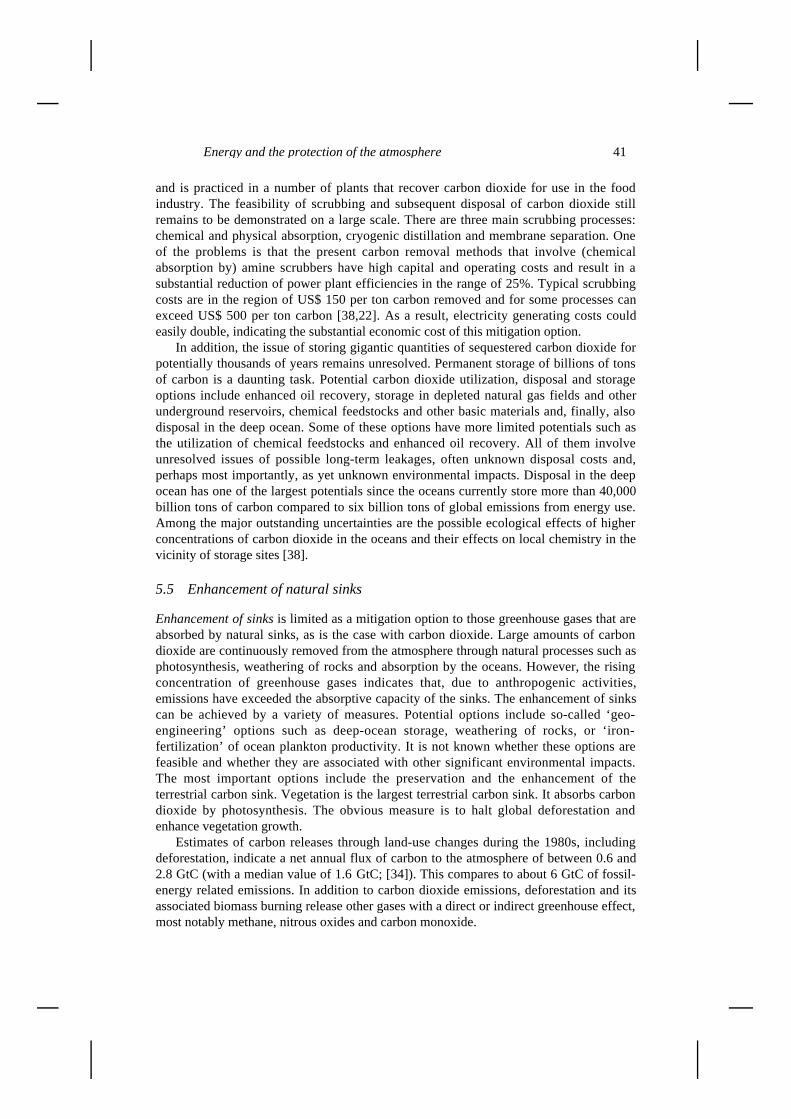
Energy and the protection of the atmosphere 41
and is practiced in a number of plants that recover carbon dioxide for use in the foodindustry. The feasibility of scrubbing and subsequent disposal of carbon dioxide stillremains to be demonstrated on a large scale. There are three main scrubbing processes:chemical and physical absorption, cryogenic distillation and membrane separation. Oneof the problems is that the present carbon removal methods that involve (chemicalabsorption by) amine scrubbers have high capital and operating costs and result in asubstantial reduction of power plant efficiencies in the range of 25%. Typical scrubbingcosts are in the region of US$ 150 per ton carbon removed and for some processes canexceed US$ 500 per ton carbon [38,22]. As a result, electricity generating costs couldeasily double, indicating the substantial economic cost of this mitigation option.
In addition, the issue of storing gigantic quantities of sequestered carbon dioxide forpotentially thousands of years remains unresolved. Permanent storage of billions of tonsof carbon is a daunting task. Potential carbon dioxide utilization, disposal and storageoptions include enhanced oil recovery, storage in depleted natural gas fields and otherunderground reservoirs, chemical feedstocks and other basic materials and, finally, alsodisposal in the deep ocean. Some of these options have more limited potentials such asthe utilization of chemical feedstocks and enhanced oil recovery. All of them involveunresolved issues of possible long-term leakages, often unknown disposal costs and,perhaps most importantly, as yet unknown environmental impacts. Disposal in the deepocean has one of the largest potentials since the oceans currently store more than 40,000billion tons of carbon compared to six billion tons of global emissions from energy use.Among the major outstanding uncertainties are the possible ecological effects of higherconcentrations of carbon dioxide in the oceans and their effects on local chemistry in thevicinity of storage sites [38].
5.5 Enhancement of natural sinks
Enhancement of sinks is limited as a mitigation option to those greenhouse gases that areabsorbed by natural sinks, as is the case with carbon dioxide. Large amounts of carbondioxide are continuously removed from the atmosphere through natural processes such asphotosynthesis, weathering of rocks and absorption by the oceans. However, the risingconcentration of greenhouse gases indicates that, due to anthropogenic activities,emissions have exceeded the absorptive capacity of the sinks. The enhancement of sinkscan be achieved by a variety of measures. Potential options include so-called ‘geo-engineering’ options such as deep-ocean storage, weathering of rocks, or ‘iron-fertilization’ of ocean plankton productivity. It is not known whether these options arefeasible and whether they are associated with other significant environmental impacts.The most important options include the preservation and the enhancement of theterrestrial carbon sink. Vegetation is the largest terrestrial carbon sink. It absorbs carbondioxide by photosynthesis. The obvious measure is to halt global deforestation andenhance vegetation growth.
Estimates of carbon releases through land-use changes during the 1980s, includingdeforestation, indicate a net annual flux of carbon to the atmosphere of between 0.6 and2.8 GtC (with a median value of 1.6 GtC; [34]). This compares to about 6 GtC of fossil-energy related emissions. In addition to carbon dioxide emissions, deforestation and itsassociated biomass burning release other gases with a direct or indirect greenhouse effect,most notably methane, nitrous oxides and carbon monoxide.
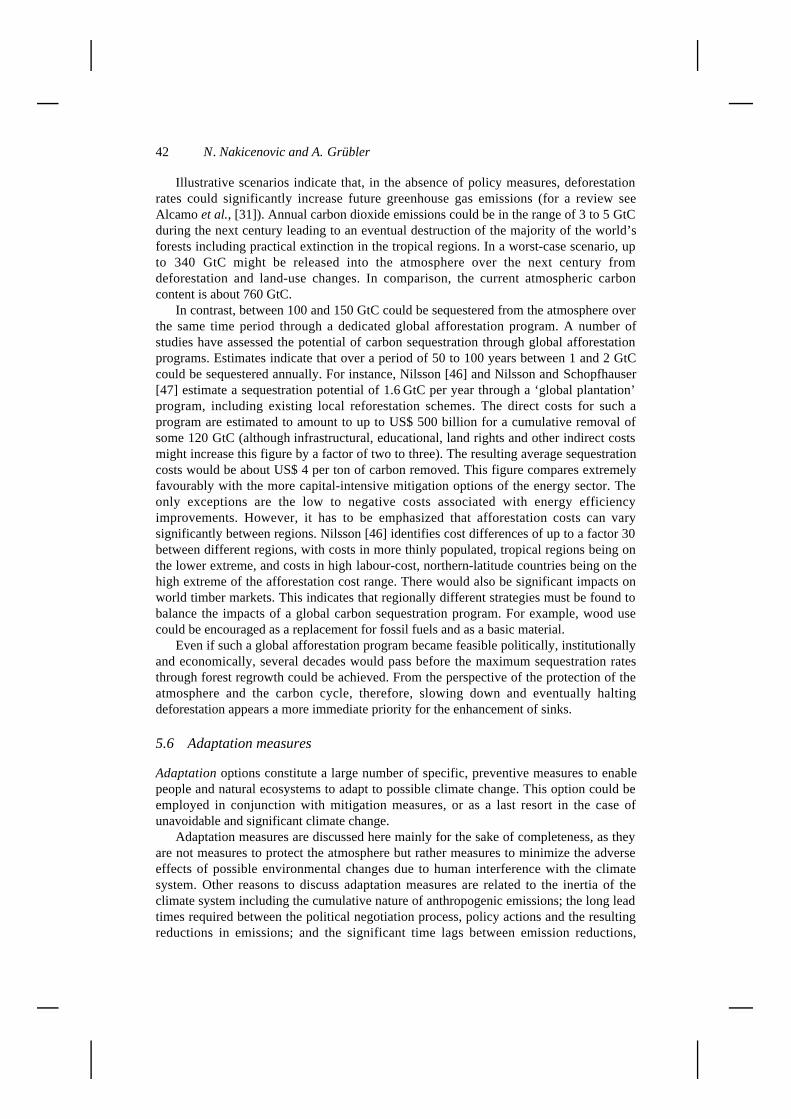
42 N. Nakicenovic and A. Grübler
Illustrative scenarios indicate that, in the absence of policy measures, deforestationrates could significantly increase future greenhouse gas emissions (for a review seeAlcamo et al., [31]). Annual carbon dioxide emissions could be in the range of 3 to 5 GtCduring the next century leading to an eventual destruction of the majority of the world’sforests including practical extinction in the tropical regions. In a worst-case scenario, upto 340 GtC might be released into the atmosphere over the next century fromdeforestation and land-use changes. In comparison, the current atmospheric carboncontent is about 760 GtC.
In contrast, between 100 and 150 GtC could be sequestered from the atmosphere overthe same time period through a dedicated global afforestation program. A number ofstudies have assessed the potential of carbon sequestration through global afforestationprograms. Estimates indicate that over a period of 50 to 100 years between 1 and 2 GtCcould be sequestered annually. For instance, Nilsson [46] and Nilsson and Schopfhauser[47] estimate a sequestration potential of 1.6 GtC per year through a ‘global plantation’program, including existing local reforestation schemes. The direct costs for such aprogram are estimated to amount to up to US$ 500 billion for a cumulative removal ofsome 120 GtC (although infrastructural, educational, land rights and other indirect costsmight increase this figure by a factor of two to three). The resulting average sequestrationcosts would be about US$ 4 per ton of carbon removed. This figure compares extremelyfavourably with the more capital-intensive mitigation options of the energy sector. Theonly exceptions are the low to negative costs associated with energy efficiencyimprovements. However, it has to be emphasized that afforestation costs can varysignificantly between regions. Nilsson [46] identifies cost differences of up to a factor 30between different regions, with costs in more thinly populated, tropical regions being onthe lower extreme, and costs in high labour-cost, northern-latitude countries being on thehigh extreme of the afforestation cost range. There would also be significant impacts onworld timber markets. This indicates that regionally different strategies must be found tobalance the impacts of a global carbon sequestration program. For example, wood usecould be encouraged as a replacement for fossil fuels and as a basic material.
Even if such a global afforestation program became feasible politically, institutionallyand economically, several decades would pass before the maximum sequestration ratesthrough forest regrowth could be achieved. From the perspective of the protection of theatmosphere and the carbon cycle, therefore, slowing down and eventually haltingdeforestation appears a more immediate priority for the enhancement of sinks.
5.6 Adaptation measures
Adaptation options constitute a large number of specific, preventive measures to enablepeople and natural ecosystems to adapt to possible climate change. This option could beemployed in conjunction with mitigation measures, or as a last resort in the case ofunavoidable and significant climate change.
Adaptation measures are discussed here mainly for the sake of completeness, as theyare not measures to protect the atmosphere but rather measures to minimize the adverseeffects of possible environmental changes due to human interference with the climatesystem. Other reasons to discuss adaptation measures are related to the inertia of theclimate system including the cumulative nature of anthropogenic emissions; the long leadtimes required between the political negotiation process, policy actions and the resultingreductions in emissions; and the significant time lags between emission reductions,
Energy and the protection of the atmosphere 43
stabilization of atmospheric concentrations and eventual climate stabilization. All told,even in the most ambitious policy scenarios some climate change appears inevitable as alegacy of our past, current and medium-term reliance on fossil fuels and the longresponse time of the climate system.
In some studies, adaptation is economically more attractive than (massive) mitigation.People and most ecosystems have a natural capacity to adapt to changes in climate. Fornatural ecosystems, adaptation to environmental changes occurs naturally (e.g.,coniferous trees migrate northwards under a warming climate), albeit at very slow rates.Therefore, perhaps more important than absolute changes in climate are the rates bywhich climate change occurs, whether it occurs gradually, allowing natural ecosystems toadapt, or whether changes are sudden and abrupt. The possibilities of human interventionto facilitate, or to speed up natural adaptation can be considered limited, apart from somegeneric measures such as the preservation of vegetation migration corridors. This is theprincipal reason why recent climate impact research identifies natural ecosystems asbeing the most vulnerable to man-induced climate changes.
The adaptation potential of socioeconomic systems can be considered to bepractically unlimited within the range of environmental and climate change anticipatedover the next century. After all, human civilization exists under a much wider variation ofclimate regimes than projected by even the most drastic future climate change scenario.However, adaptation requires the availability of sufficient resources, know-how and time.Appropriate research and development has to be put in place and financed in advance topermit adaptation. Some adaptation measures would simply involve better informationand management practices such as early warning systems for extreme climate events, orbetter information concerning preventive measures to counter greater climate variability.Others would entail potentially significant changes in practices such as differentagricultural crops or air and sea routes. These could have disruptive impacts, for exampleon food markets. Finally, some adaptation may entail considerable costs, such as theprotection of low lying coastal areas from sea level rise, relocation of infrastructures, orconstruction of large enclosed areas for human protection (like superdomes and shoppingmalls).
Summarized below are examples of different types of adaptation measures foragricultural production. As a first, easy step low-cost adaptation measures include:changes in crop varieties, such as towards more drought resistant species: changes inmanagement practices of agricultural production, for example, different planting dates:and changes in cultivars to completely different crops. A second step would entailsubstantial adaptations, possibly requiring resources beyond an individual farmer’smeans. This includes, for instance, additional irrigation, a more intensive application ofadditional (nitrogen) fertilizer and, ultimately, entire shifts in crop production zones.
The impacts of some of these different types of adaptation measures on worldagriculture could be significant. Based on representative, though highly uncertain,regional climate change scenarios, losses in world agricultural output are estimated torange between 0.3 to 4.4% for an equivalent doubling of carbon dioxide concentrationsand assuming intermediate climate sensitivity [48,49]. Assuming easy, low-costadaptations would be available, the adverse impacts are reduced to between a 0.2% gainin agricultural production to a 3.5% loss of agricultural output. For the full range of allconceivable adaptation measures, the impacts range from a gain of 0.8% to a loss of 1.6%of agricultural GDP. Thus, the available model estimates indicate that, at the global level,

44 N. Nakicenovic and A. Grübler
adverse impacts of climate change on agriculture could be entirely averted throughadaptation.
However, this is only true for the global aggregate. Regional differences are persistentand significant. Especially noteworthy are the results that suggest that impacts onagriculture will generally be positive in the northern hemisphere and negative in thedeveloping countries independent of the level of adaptation assumed (see also Section 5.7below). In any case, impacts are systematically more adverse, the lower adaptation levelsare assumed in the crop modelling exercises. Agricultural impacts in the southernhemisphere are much more severe because of the anticipated larger variations inprecipitation patterns, the higher dependence of developing economies on agriculture, aswell as the possible limitations of implementing adaptation measures due to capital andinstitutional constraints.
Even if the direct costs of adaptation measures in agriculture might be low, theynevertheless require preparatory action. Appropriate research and development (e.g., indrought resistant crops and changed farming practices) need to be put in place andfinanced sufficiently in advance.
In contrast, the adaptation measures involving the (re)construction of infrastructures,such as for coastal zone protection or relocation of traffic routes, are extremely capitalintensive and provide an additional argument in favour of precautionary mitigationmeasures. Again, significant differences in the capability to adapt exist between thedeveloped and the developing countries. Ceteris paribus, monetary impacts can beexpected to be greater in the industrialized countries because of the much larger capitalstock affected. Conversely, adaptation capabilities in terms of technological andinstitutional know-how and especially capital availability are much greater in theindustrialized countries.
This points to the need to consider carefully the differences in impacts, and themitigation and adaptation potentials, among different world regions and countries asdiscussed in the next section. It has to be emphasized, however, that significant scientificuncertainties exist with respect to regional climate change impacts and these are unlikelyto become resolved in the near-term future. Thus policy-makers have to face theseuncertainties especially at the sub-regional and national level.
5.7 Special circumstances in different world regions
There are large disparities in the capacity to mitigate and adapt to environmental changesfrom energy production and use among different regions and countries. Recognizing thecommon, but differentiated responsibilities, as well as the different social and economicpriorities and capabilities to respond to the challenge of global environmental change, theFCCC differentiates among three groups of countries: the industrialized countries of theOECD, the Organization for Economic Cooperation and Development (Annex IIcountries); the Industrialized countries undergoing a process of economic reform and‘transition to a market economy’ (FCCC Annex I countries in addition to Annex II); andfinally the remaining (mostly) developing countries. Despite significant differencesamong individual countries, the following section attempts to summarize some specificsfor each of these three regional groupings in terms of impacts of global environmentalchange and challenges for sustainable energy development.

Energy and the protection of the atmosphere 45
5.7.1 The OCED countries
Most of the countries in the OECD region are characterized by mature and highlydeveloped economies with high levels of income, energy consumption and energy-relatedgreenhouse gas emissions. As a region they share the highest responsibility for historicaland current energy use and greenhouse gas emissions (cf. Section 3.7). They also havethe highest near to medium-term emissions reduction potentials, the highest financial andtechnological mitigation and adaptation capabilities, and generally also the lowestvulnerability to environmental impacts both as a result of their high-income levels andhigh capabilities for adaptation.
5.7.2 Countries in transition to a market economy
The countries in the transition process to a market economy consist primarily of theformally centrally planned economies of Central and Eastern Europe and the formerSoviet Union. Although highly industrialized, the transition economies are characterizedby a number of unique features.
The transition process is disruptive and is taking longer than initially anticipated.Between 1990 and 1994, the combined economic output of the economies in transitionfell by some 40% [15], an unparalleled drop in peacetime. It is larger than that during theGreat Depression of the 1930s. As a consequence, primary energy demand fell by some25% over the same time period and energy-related carbon dioxide emissions by some30% [21]. Recent scenarios indicate that it may take two to three decades before energyuse and emission levels return to their pre-restructuring levels [12,35].
This means that these countries are probably well below any current or near-termcommitments for stabilization of emissions as formulated within the FCCC. Additionally,other urgent social and economic priorities, as well as severe capital constraints, have ledto low policy priority for any specific and additional mitigation or adaptation measures. Achronic shortage of capital is compounded by significant financing requirements for thereplacement of obsolete energy infrastructures and equipment, estimated to amount up to10% of the current economic output in the region [50]. At the same time, the process ofeconomic restructuring opens further opportunities for efficiency improvements andstructural changes in the energy sector that could reconcile the pressing near-term needsto overcome the effects of the economic depression with the more longer-term objectivesof sustainable energy development.
The current (uncertain) estimates of possible impacts of climate change in theseregions indicate that they would not all be adverse. For instance, impacts on agriculturewould generally be favourable due to the extended growing seasons and higherprecipitation [22]. However, significant adverse impacts of climate change are anticipatedfor most natural ecosystems not managed by man, in particular for boreal forests. Borealforests are vulnerable because they are more affected by temperature changes than forestsin other latitudinal zones and because warming is expected to be high at high latitudes. Itis possible that northern tree lines might migrate into regions currently occupied bytundra [22].
Another, scientifically more speculative, impact could be methane releases frompermafrost areas, mainly in tundra soils and in the form of methane clathrates. Currentestimates of methane releases from melting ground ice in Siberia put emissions betweentwo and ten TgCH4 per year, corresponding to 0.5 to 3% of current anthropogenic

46 N. Nakicenovic and A. Grübler
emissions [22]. Increasing methane release rates could have a significant additionalwarming impact because of the large quantities of methane captured in permafrost areasand methane’s high radiative forcing. At present, however, information on the depthdistribution of methane clathrates is too sparse to enable an assessment of potentialmethane release rates under a warmer climate.
5.7.3 Developing countries
Developing countries face a triple challenge. First, their historical and currentcontribution to energy-related global environmental stresses is low (Section 3.7) but isexpected to increase in the future with the required social and economic development.This, however, will take several decades. According to the IPCC IS92 scenarios [36], theshare of developing countries in energy-related carbon dioxide emissions would surpassthe 50% mark between the years 2035 to 2045 and reach shares between 64% and 71% ofglobal emissions by the end of the 21st century. The recent IIASA-WEC scenarios[12,35] explore a wider and more representative range of possible scenarios fordeveloping countries. In the absence of drastic policy measures, the developing countries’share in global energy-related carbon dioxide emissions would surpass 50% by between2025 and 2030 and reach between 59% and 84% by the end of the 21st century. Thus,more than five decades would pass before the developing countries would have a similarshare in atmospheric concentration increases as the industrialized countries have today;the difference is that they would have more than 80% of the global population by thattime. Thus, historical and current inequalities with respect to emissions and contributionsto atmospheric concentration increases will continue to persist for many decades to come.
The second dilemma deals with the much higher vulnerability of developing countriesto possible climate changes. Although absolute monetary estimates of damages areaffected by a wide range of uncertainty, there is a broad agreement among differentstudies that damage from climate change accounts for a significantly higher proportion ofeconomic activities in developing countries than in industrialized ones [22]. Even thoughclimate change is generally projected to be much lower in southern than in northernlatitudes, these countries have a greater reliance on climate sensitive activities such asagriculture. Currently, agriculture accounts for about 21% of total economic output indeveloping countries compared to only 4% in industrialized countries (OECD andtransition economy countries). Larger climate change impacts are also expected indeveloping countries due to multiple environmental and other stresses including poverty,population growth, pollution, desertification, industrial and infrastructural development,etc.
The third dilemma is that the adaptation possibilities of developing countries are alsomore limited because of low national incomes that result in low research anddevelopment budgets, severe capital scarcities and limited institutional capacities to dealwith climate change.
As an illustration, one important category of climate change impacts, namelyagricultural production and food availability, is briefly summarized here. It is arecognized objective of the FCCC to assure that food production is not threatened.Impacts on agriculture are twofold. First, are changes in crop yields due to changes inclimate variables like temperature and precipitation and possible carbon dioxidefertilization effects. Second, changes in crop production patterns would result in changesin agricultural prices, which would affect food exporters and importers differently. For

Energy and the protection of the atmosphere 47
instance, food-importing countries could suffer economic losses due to higher worldprices even in scenarios where domestic food production would increase under achanging climate. The scale of impacts is, of course, not only related to the biophysicalvulnerability of national agricultural systems, but also to the lack of excess productioncapacities in most developing countries today.
Table 5.1 summarizes the range of economic impacts on agriculture for an equivalentdoubling of carbon dioxide concentration. The range (negative values denote losses,positive denote gains) reflects the uncertainty of regional climate changes as projected bythree different climate scenarios. Three different levels of impacts are differentiated.Impacts assuming no carbon dioxide fertilization effects and no adaptation measures,with fertilization and without adaptations, and finally with fertilization and adaptationcombined. Obviously, combining fertilization effects and adaptation, damage is reducedsignificantly at the global as well as the regional level. However, the most significantresult is that the estimated damage is systematically greater in developing countriesacross all scenarios. Damage is highest in the poorest countries of income levels belowUS$ 500 per capita. Even in the most optimistic scenario of Table 5.1, losses inagriculture in the poorest developing countries are more than twice as large as in theOECD countries.
Table 5.1 Estimated economic effects of climate change on agriculture in billion US$
Developing countries
by income level
No Co2 fertiliz
No adaptation
CO2 fertiliz.
No adaptation
CO2 fertiliz.
+ adaptation
< $500/capita –57 – –121 –2 – –20 ~0 – –15
$500–2000/capita –26 – –48 –2 – –15 ~0 – –11
>$2000/capita –7 – –4 –1 – ~0 ~0 – –1
REFsa –13 – –57 +2 – –11 +2 – –5
OECDb –13 – –18 +3 – –15 +6 – –7
World –116 – –248 ±0 – –61 +7 – –39
Source: IPCC SAR WG II, [22]aFCCC Annex I countries undergoing the process of transition to a market economybFCCC Annex II countries
This illustrates the ‘trilemma’ of developing countries. These countries bear the lowestresponsibility for human interference with the atmosphere but are the most vulnerable toclimate changes and they have the lowest capabilities and available resources foradaptation. Consequently, impacts and damages of climate change tend to be largest inthe developing world, particularly in the lowest income countries.
6 Policy instruments to control anthropogenic impacts
The previous section gave an overview of numerous mitigation and adaptation options forthe protection of the atmosphere. Usually these options are discussed from theperspective of possible technological barriers and attractors for their implementation,

48 N. Nakicenovic and A. Grübler
including availability, performance, costs and environmental compatibility. This sectionon policy instruments focuses on non-technical barriers and impediments, as well as onthe non-technical attractors and incentives that have to be dealt with as a prerequisite forthe implementation of mitigation and adaptation options. The policy instruments include,among others, market, regulatory and institutional measures.
6.1 Policies for sustainable energy development
A generic policy instrument to be mentioned first are measures that raise both public andprivate awareness, as well as helping to reduce the significant scientific and policyuncertainties involved, especially when dealing with long-term sustainable developmentcriteria and environmental issues. Research, both domestic and through internationalcooperation, can help to improve knowledge but even improved knowledge does not leadautomatically to better policy decisions if the information is confined within a smallscientific or technocratic elite. Therefore, public awareness is critical, to promote afavourable social context and acceptance for the implementation of the numerousmeasures necessary to move societies on environmentally sustainable developmentpathways.
No single mitigation option is likely to become the unique and universally adoptedsolution if drastic reductions of emissions from industrial, energy and consumptionactivities are required. All options must be evaluated in their different regional, nationalor sectoral contexts and on the basis of full life-cycle analyses. The combination ofseveral mitigation options along improved and new technology chains, plus associatedsynergies, will be needed to achieve substantial emission reductions. These combinationsmay be region or sector specific but could also involve generic new technology chainsand synergisms such as a stronger reliance on carbon-free energy carriers in the energysector.
Considerable additional benefits are attached to those options that tackle greenhousegas emissions and also mitigate other adverse local and regional environmental problems.This point is stressed not merely because of its technical and financial cost-benefitimplications but also because it clearly implies a holistic approach to environmentalproblems that encompasses local and regional as well as potential global concerns. Thisholistic approach towards simultaneous consideration of social and economicdevelopment needs including a comprehensive environmental perspective from the localto the global scale is at the heart of sustainable development.
Likewise, no single policy measure or instrument will be sufficient for the timelydevelopment, adoption and diffusion of mitigation options. Pervasive and simultaneousmultinational adoption would reduce their differential consequences. Specialconsideration must be given to policies that foster the adoption of mitigation technologieswhich enhance economic development without undermining global environmentalsustainability. Policy instruments that enable increasing supplies of high quality energyservices, growth of per capita income and living standards should receive the highestpriority in developing countries. In the industrialized countries with high per capitaenergy consumption levels and incomes, policies are called upon that reduce emissionswithout causing a loss of useful energy services.
Energy and the protection of the atmosphere 49
6.2 Policies for energy efficiency and decarbonization
To achieve these seemingly conflicting objectives of providing better, cleaner, higherquality and more energy services (especially in the developing countries) while avoidingharmful environmental side effects, high priority must be given to efficiencyimprovements. Such improvements, even using existing plant and equipment, aresubstantial and can be achieved relatively quickly. The adoption of the currently bestavailable technologies and practices can achieve even more. Section 5 discussed thepotential for energy efficiency improvement of some 50% through the implementation ofcurrently available, best performing technologies worldwide. Considering furthertechnological development, the efficiency improvement potential in the long term wouldbe even more substantial [22,42].
Efficiency improvements are particularly attractive as a target for policy instruments.They generate multiple benefits: lower resource consumption, reduced environmentalimpacts and lower system costs. Productivity growth of all factor inputs, includingenergy, is therefore a prerequisite for sustainable economic development. Another classof options that promise the generation of multiple benefits is the decarbonization of theenergy system. Decarbonization involves shifts to low-carbon and carbon-free energysources and carriers: the lower the carbon content of fuels, the lower the environmentalimpacts are on local air quality, as well as carbon dioxide emissions.
An energy system centred on the energy carriers electricity and hydrogen is virtuallyemission free at the point of energy end use and can be made emission free also at thepoint of energy production and conversion. Increased reliance on natural gas (whereavailable), pre or post-conversion carbon removal from fossil sources and carbon-freesources such as renewables and nuclear energy would individually and collectivelycontribute to the decarbonization of the energy system. The possible implementationinstruments for energy efficiency improvements and decarbonization fall into at least fourcategories: global and international, regional and national, sector specific and technology(chain) specific.
6.3 Market and non-market policy instruments
The following generic policy instruments are applicable to the four categories specifiedabove. The broadest division is in market and non-market instruments. Marketinstruments include taxes, fees, tax exemptions, subsidies (including accelerateddepreciation provisions), tradeable permits, ‘polluter pays’ principles and theinternalization of environmental externalities. Non-market instruments includeinformation, advertizements, education, standards and legal and institutional regulations,bans and controls. Most of these market and non-market instruments may work in bothdirections, removing or establishing barriers, or promoting or hampering progress.
In the short run, the most promising area for the application of market and non-market instruments are the energy end-use sectors. The same also applies for the controlof chlorofluorocarbons. To a large extent, energy end-use conversion accounts for thehighest inefficiencies within the energy system (see Section 5). Because of the hugenumber of economic agents involved and the difficulty in developing equitable economicincentives, non-market instruments, such as building codes, vehicle standards, or stackemission regulations, have been successfully employed by many countries. Since the

50 N. Nakicenovic and A. Grübler
efficiency improvements in the end-use sector are the key for meeting the sustainabledevelopment objective, policy instruments need increasingly to focus on this sector.
Recently, a hybrid of policy instruments encompassing non-market and marketelements has gained momentum. Integrated resource planning (IRP) and demand sidemanagement (DSM) are instruments imposed on utilities by regulatory institutions withthe objective of shifting the focus of utility businesses from selling, for example, justkWhs to selling energy services. Here, utilities have begun to provide economicincentives to their customers for load shifting and replacing inefficient end-use devices.Furthermore, selling energy services instead of energy carriers puts utilities in a betterposition to market their previously worthless by-products such as waste heat.Consequently, DSM and IRP enhance the prospect for the development of combined heatand power (CHP) and district heat energy systems, furthering substantial efficiency gains.
Greenhouse gas emissions and the possibility of climate change are globalphenomena, therefore it is self-evident that international policy implementation isrequired, quite apart from the competitiveness issue already mentioned. The FrameworkConvention on Climate Change provides provisions for such measures, e.g., jointimplementation schemes. The specific details for implementing these schemes stillrequire careful negotiations, especially the provisions for possible crediting of emissionreductions.
The assessment above has indicated that many technological options are availablethat could promote social and economic development, efficiency improvements and areduction of environmental impacts. Thus, there is no scarcity in human ingenuity thatcan be exploited to move onto the path of sustainable development. The main questionsconcern the policy instruments required to promote, for example, technology capacitybuilding and transfer, efficiency improvements and decarbonization at unprecedentedlevels. It has to be emphasized that in many instances new policy initiatives can build onexisting trends towards more efficient stewardship of resources. There, the task ahead forpolicy may be less daunting if indeed only a significant acceleration of desirablestructural changes in our economies and energy systems is required, as opposed to radicaldepartures from longer-term tendencies.
New institutional arrangements, including both market and non-market instrumentsneed to be introduced at the global level. Instruments for the promotion of sustainabledevelopment and for a major reduction of adverse environmental impacts would have toreach beyond voluntary compliance or reliance upon market forces alone. The deal hereis not so much one of market failure, i.e., wrong or misleading market signals, but with asituation of market exclusion. In numerous cases, important issues such as externalitieshave been excluded from any consideration in the market place. Again, it is unlikely thatthese instruments would be justified or implemented solely to respond to individualenvironmental challenges, e.g., for the purpose of countering the danger of climatechange. Clearly, policy instruments need first of all to be linked to local and regionaldevelopment priorities such as the improvement of energy services, as well as theimprovement of local air quality and other adverse impacts of energy supply and use.Some of these instruments require monitoring the progress of policy implementation andmeasures to ensure compliance. For example, the creation of new cartels that impedeaccess to environmentally benign technologies must be avoided.

Energy and the protection of the atmosphere 51
6.4 Regional and national policy instruments
Policy instruments also need to account for regional differences in the levels of humandevelopment and the resulting social and development imperatives, levels of resourceendowments, and economic and technological vintage structures. For example,implementation instruments in regions with large hydro, wind, biomass or natural gasresources would be different from those in regions with small energy resourceendowments. Another example is the development of generic technologies; for example,if deep-ocean carbon dioxide disposal turns out to be environmentally acceptable, it isprimarily of interest to some coastal regions. Likewise, the option of carbon dioxidereinjection into depleted gas fields is only feasible in gas-producing regions. Anotherpromising option is a strong reliance on biomass. However, adequate land availability canbecome a limiting factor. For most renewable sources of energy, including modernbiomass, development can also have adverse local environmental impacts which maycreate other limitations. For example, a stronger reliance on biomass might require thedevelopment of 400 to 600 million hectares of sustainable and socially acceptable energycrop plantations [12], harmonized with other agricultural activities such as foodproduction for a global population of, say, ten billion people.
Until the 1980s, regulation was the dominant environmental policy instrument at thenational and regional levels. Recently, economic and market-oriented approaches havegained momentum compared with non-market instruments. The application of marketinstruments at the macroeconomic level is intended to establish undistorted pricingmechanisms and competitiveness. In the energy sector alone, removal of distortionaryfuel price subsidies is estimated to lead to substantial efficiency gains of up to 18% ofemissions [6]. Many of these measures may also be needed to establish an equal-levelplaying field. In economies with emerging new sectors, macroeconomic measures havebeen applied to provide temporary protection.
6.5 Policy instruments for adequate financing
Neither the establishment of level playing fields nor temporary protection can overcomeone major economic barrier, especially in the developing countries: namely, the chroniclack of capital. Even if a project has lower life-cycle costs and emissions but higherupfront capital requirements compared with its alternatives, it simply may not attract thenecessary financing. In addition, energy and environmental measures compete for limitedcapital with many other development needs. Developing countries face many urgentproblems such as the eradication of poverty, famine, malnutrition, substandard housing,locally contaminated water and air, etc. All compete for scarce resources. However, tomeet the rising demand for energy and to assure minimum environmental protection atthe local and regional level, capital requirements are expected to increase dramatically inthe future. For instance, energy sector financing requirements in the developing countriesover the next three decades are estimated to range between US(1990)$ 3,000 and 9,000billion, depending on the growth in energy demand, the structure of energy supply and,most notably, capital availability [51,50]. For comparison, the estimated costs ofimplementing the Agenda 21 Program are estimated to amount to US$ 20 billion for theperiod 1993–2000 [1] to be supplied by grant or concessional terms.
Even in the industrialized countries, where financing for capital-intensive projects iseasier to obtain, there are major barriers to efficiency improvements and energy sector
52 N. Nakicenovic and A. Grübler
restructuring and decarbonization at the national level. Often, higher returns can beobtained in areas other than the energy sector. The promotion of flexible, small scale butmass-produced supply and conversion plants and equipment would help resolve some ofthe financing difficulties by reducing the risk, uncertainty and upfront capitalrequirements.
6.6 Policy instruments for enhancing knowledge and skills
A special problem is the variation of general technology-related knowledge, experienceand skills among regions and countries. For example, the developing countries’endowment of know-how and know-why required to induce the development, import andadoption of new technologies often lags behind that of developed countries. There is aneed for reliable, impartial information on available technologies, including detaileddescriptions. Much of the information about mitigation options and implementationinstruments is tailored to the needs and situations in the developed countries and hence oflimited use in the developing countries. Informational needs are, however, only the firststep. Evaluations and technology assessments of how different options fit into diverselocal situations and development needs are important requirements. Hence, local capacitybuilding is essential. Additional non-market barriers include institutional and legalframeworks, procedural requirements, language barriers and the provision of spare partsand maintenance.
Technology appropriateness is also an important issue in this context and must bespecifically addressed by both donors and recipients and through joint development. Itwill be necessary to account for distinct differences in the innovation needs between theindustrialized and developing countries. Highly efficient, capital intensive technologyoptions involving minimal labour may be the preferred solution in the industrializedworld. For developing countries, the priorities may well be for labour-intensive, lowcapital and medium efficiency technology to pave the way toward sustainable economicdevelopment.
Therefore, complex and capital intensive technologies should first be implemented inthe industrialized countries that have both higher research and development and financialresources to cope with the inevitable risks involved in the innovation process. Theindustrialized countries also need to provide for initial niche markets for newenvironmentally benign technologies in order that learning curve effects and associatedcost reductions are exploited to a maximum before technologies can diffuse to thedeveloping countries. Existing international financial instruments for economicdevelopment are seriously out of tune with the innovation needs in the developingcountries. Here, policy should encourage and support indigenous innovation impulses andenhanced local capabilities for assessment and adaptation of technologies to best fit to thespecific local and national development and environmental priorities.
Provisions of safety and health measures in the workplace have been integrated intothe legal and institutional frameworks of modern societies. In short, they are part of thesocial contract. The implementation of mitigation options at the regional and nationallevels also requires their inclusion in the social contract. A collective implementation ofmitigation policy instruments is required; this is not a question of single technologyoptions. This is a socio-cultural process as well as one of technology and economy.
Energy and the protection of the atmosphere 53
6.7 Sector and technology specific policy instruments
Policy instruments affecting the entire energy system include emission and energytaxation or regulatory provisions and standards. With the exception of fossil-fuelledelectricity generation, the energy supply sector accounts for a smaller share of totalenergy-related greenhouse gas emissions than the energy end-use sectors. Therefore,carbon taxes levied at the point of emissions would be collected primarily at the level ofend-use and thus only indirectly affect the non-electric energy supply sector. A finalimportant generic aspect of regulatory measures is that they must restrict themselves toestablishing more comprehensive costing principles by internalizing externalities andfocus on performance and environmental standards rather than prescribing particulartechnologies.
Most innovations spread from centres where the initial adoption occurs. Establishingspecial ecozones might help catalyze and accelerate sustainable development and thepromotion of environmentally friendly technologies. Policy should support the creationof fertile socio-economic conditions. Likewise, broad market instruments are required tocreate a conducive environment for accelerated innovation and research anddevelopment.
The fourth category of implementation instruments is technology-specific and thusvery heterogeneous. It involves the promotion and development of individualtechnologies and their combinations into entire technology chains. The most importantinstruments in this category involve the removal of non-technical barriers to theinnovation and adoption of new technologies and the creation of new attractors fordevelopment and diffusion.
In addition to promoting the research and development of the physical aspects oftechnology, policy instruments should also include paper and software-embodiedtechnology. Manuals, operating procedures and programs are all an integral part ofenhancing local skills and know-how. Skills and know-how in turn have to be acquiredthrough formal education, training programs and ‘learning by doing’. The humanembodiment of technological knowledge is perhaps the most important aspect of thisfourth category. Not only does it determine the internal capabilities for appropriatingeconomic and social gains from technologies, but it also determines the capacity forfurther innovation and the adaptation of new technologies and practices [52]. Capacitybuilding and the development of human resources should be a high priority in anytechnology development and transfer program, especially at the technology-specificlevel.
Another critical aspect is the transfer of technology and know-how from thelaboratory and development stage to commercialization and subsequent diffusion. Policyinstruments include tax exemptions, subsidies with sunset clauses, rewards for technicalexcellence, end-user subsidies, promotion of integrated resource planning and, wherenecessary, temporary protective measures. More importantly, the policy instrumentsshould remove barriers to innovation such as protective subsidies for mature technologiesand other market imperfections. Research and development policy should make availablesufficiently earmarked and stable funding for the development of technologies with longlead times. This condition is of particular importance when the development of a wholeset of new technologies is involved. Obviously, related efforts must be greatest whereresources are largest, i.e., in the industrialized countries.

54 N. Nakicenovic and A. Grübler
In the case of a transition to completely new production and energy systems andtechnologies, sometimes called technological leap-frogging, it is important to takeaccount of additional social costs for new infrastructures and supporting systems. Forexample, a potential barrier might be the need to maintain both the old and the newsystems during the transition period leading to additional social costs and perhaps alsounsatisfactory services. Considering such and other possible barriers, it is important forthe government or some appropriate public body to promote the new systems and removethe hidden barriers until they reach commercialization.
Once a new technology reaches commercialization, a new set of instruments isrequired to promote flexibility and cost reductions along the learning curve. In the case ofmodular and flexible technologies, e.g., wind turbines, gas turbines and fuel cells, costreductions through ‘learning by doing’ and ‘learning by using’ can indeed by significant.In other cases, such as the production of large amounts of biomass, the learning curveeffects could be more limited, especially in arid areas with little experience of highintensity agriculture.
New problems, however, may emerge with increasing scales of production. Examplesin energy supply are particularly numerous as far as adverse environmental impacts areconcerned. Each generation of technology has a tendency to solve old problems and yetcreate new ones [53]. Exceptional care and anticipatory measures will have to be taken ifthe policy instruments introduced for improving the human condition and for protectingthe environment are to avoid the creation of new unanticipated problems and concerns.
Acknowledgements
We gratefully acknowledge support from the Division of Sustainable Development,United Nations, New York which made this paper possible. We thank Arungu Olende forhis encouragement and numerous contributions. We also wish to thank Hans-HolgerRogner for his contributions to Section 5 (policy instruments) and Susan Riley for herediting of the manuscript.
References and Notes
1 UNCED (United Nations Conference on Environment and Development) (1992) The GlobalPartnership for Environment and Development A Guide to Agenda 21, 92-1-100481-0,UNCED, Geneva, Switzerland.
2 WHO (World Health Organization) (1994) Urban Air Pollution in Megacities of the World,Blackwell Publishers, Oxford, UK (1994 reprint).
3 Smith, K.R. (1993) ‘Fuel combustion, air pollution exposure and health: the situation indeveloping countries’, Annual Review of Energy and the Environment, Vol. 18, pp.529–566.
4 WEC (World Energy Council) (1995a) Local and Regional Energy-Related EnvironmentalIssues, WEC, London, UK.
5 Bolin, B. (1995) ‘The possibility of climate change’, Special Conference Address, 16th WorldEnergy Congress, Tokyo, Japan.
6 IPCC (Intergovernmental Panel on Climate Change), SAR (Second Assessment Report),(1995) Synthesis of Scientific-technical Information Relevant to Interpreting Article 2 of theFramework Convention on Climate Change, IPCC, Geneva, Switzerland.
Energy and the protection of the atmosphere 55
7 UN (United NATIONS) (1987) Protocol on Substances that Deplete the Ozone Layer, 16September, reprinted in International Legal Materials, Vol. 26, pp.1550ff.
8 Maghrebi, A. (1995) ‘Rural energy in developing countries’, background paper, 16th WorldEnergy Congress, Tokyo, Japan.
9 UN ECE (United Nations Economic Commission for Europe) (1979) Geneva Convention onLong-range Transboundary Air Pollution 13 November 1979, UN Doc. ECE/HLM.1/R.1,reprinted in International Legal Materials, Vol. 18, pp.1442.ff.
10 FCCC (United Nations Framework Convention on Climate Change) (1992) FCCC ConventionText, UNEP/WMO Information Unit on Climate Change (IUCC), Geneva, Switzerland.
11 Smil, V. (1994) Energy in World History, Westview Press, Boulder, USA.
12 IIASA-WEC (International Institute for Applied systems Analysis and World EnergyCouncil), (1995) Global Energy Perspectives to 2050 and Beyond, WEC, London, UK.
13 Hall, D.O. (1991) ‘Biomass energy’, Energy Policy, October, pp.711–736.
14 IEA (International Energy Agency), (1994a) Energy Statistics and Balances of OECD andNon-OECD Countries 1971–1992, OECD, Paris, France.
15 World Bank (1995) World Tables, John Hopkins University Press, Baltimore, USA.
16 Nakicenovic, N. (1984) Growth to Limits: Long Waves and the Dynamics of Technology,International Institute for Applied Systems Analysis, Laxenburg, Austria.
17 Maddison, A. (1989) The World Economy in the 20th Century, Development Centre Studies,Organization for Economic Cooperation and Development, OECD, Paris, France.
18 IEA (International Energy Agency), (1994b) Energy in Developing Countries: A SectorialAnalysis, OECD, Paris, France.
19 World Bank (1992) World Development Report 1992: Development and the Environment,Oxford University Press, London, UK.
20 Davis, G. (1990) ‘Energy for planet earth’, Scientific American, special issue, September, Vol.263, No. 3., pp.55–62.
21 BP (British Petroleum) (1995 and earlier volumes) BP Statistical Review of World Energy, BP,London, UK.
22 IPCC (Intergovernmental Panel on Climate Change), SAR (Second Assessment Report) WG II(Working Group II), (1995) Draft Document WG II/3rd/Doc.3 IPCC, Geneva, Switzerland.
23 Grübler, A. (1993) ‘The transportation sector: growing demand and emissions’, Pacific andAsian Journal of Energy, Vol. 3, No. 2, pp.179–199.
24 WEC (World Energy Council) (1993) Energy for Tomorrow’s World – The Realities, the RealOptions and the Agenda for Achievements, Kogan Page, London, UK.
25 Grübler, A. and Nakicenovic, N. (1992) International Burden Sharing in Greenhouse, GasReduction, Environment Working Paper No. 55, World Bank Environment Department,Washington, D.C., USA.
26 Fujii, Y. (1990) An Assessment of the Responsibility for the Increase in CO2 Concentrationand Inter-Generational Carbon Accounts, WP–90–55, International Institute for AppliedSystems Analysis (IIASA), Laxenburg, Austria.
27 Nakicenovic, N. (1987) ‘Technological substitution and long waves in the USA’, in T. Vasko(ed.), The Long-Wave Debate, pp.76–104, Springer-Verlag, Berlin, Germany.
28 Martin, J.M. (1988) ‘L’intensité énergétique de l’activité economique dans les paysindustrialisés: les evolutions de très longue periode liverent-elles des enseignements utiles?’,Economies et Societés, Vol. 4., pp.9–27.
29 TERI (Tata Energy Research Institute) (1994) TERI Energy Data Directory Yearbook, PaulsPress, New Delhi, India.
30 Reddy, A.K.N. and Goldemberg, J. (1990) ‘Energy for the developing world’, ScientificAmerican, Special Issue, September, Vol. 263, No. 3, pp.110–118.
56 N. Nakicenovic and A. Grübler
31 Alcamo, J., Bouwman, A., Edmonds, J., Grübler, A., Morita, T. and Sugandhy, A. (1995) ‘Anevaluation of the IPCC IS92 emission scenarios’, Climate Change 1994, pp.247–304,Intergovernmental Panel on Climate Change, Cambridge University Press, Cambridge, UK.
32 Nakicenovic, N. (1993) Decarbonization Doing More With Less, WP-93-076, InternationalInstitute for Applied Systems Analysis (IIASA), Laxenburg, Austria.
33 IPCC (Intergovernmental Panel on Climate Change), (1994) Climate Change 1994,Cambridge University Press, Cambridge, UK. (published in 1995).
34 IPCC (Intergovernmental Panel on Climate Change), SAR (Second Assessment Report) WG I(Working Group I), (1995) Scientific Assessment of Climate Change, Cambridge UniversityPress, Cambridge, UK.
35 Nakicenovic, N., Grübler, A. and McDonald, A. (Eds.) (1998) Global Energy Perspectives,Cambridge University Press, Cambridge, UK.
36 Pepper, W., Legett, J., Swart, R. Wasson, J., Edmonds, J. and Mintzer, I. (1992) EmissionScenarios for the IPCC, an Update: Assumptions, Methodology and Results, IPCC, Geneva,Switzerland.
37 The two scenarios developed differ with respect to the role of nuclear energy, but have thesame carbon emission levels.
38 Nakicenovic, N., Grübler, A., Inaba, A., Messner, S., Nilsson, S., Nishimura, Y., Rogner,H.H., Schäfer, A., Schrattenholzer, L., Strubegger, M., Swisher, J., Victor, D. and Wilson, D.(1993) ‘Long-term strategies for mitigating global warming’, Energy, Vol. 18, No. 5,pp.401–609.
39 AIP (American Institute of Physics) (1975) Efficient Use of Energy, Conference ProceedingsNo. 25, AIP, New York, USA.
40 Olivier, D. and Miall, H. (1983) Energy Efficient Futures: Opening the Solar Option, EarthResources Research Limited, London, UK.
41 Ayres, R.U. (1988) Energy Inefficiency in the US Economy: A New Case for Conservation,Carnegie-Mellon University, Pittsburgh, USA.
42 Gilli, P.V., Nakicenovic, N. and Kurz, R. (1995) ‘First and second law efficiencies of theglobal and regional energy systems’, in Proceedings of the 16th World Energy CongressDivision and Rational Energy End-use Technologies, PS/SRD, Vol. 3, No. 1, pp.229–248,WEC, London, UK.
43 Ausubel, J.H., Grübler, A. and Nakicenovic, N. (1988) ‘Carbon dioxide emissions in amethane economy’, Climate Change, Vol. 12, pp.245–263.
44 It should be noted that under current conditions both nuclear and solar energy options alsoentail carbon dioxide emissions, simply because fossil energy is required for the fabrication ofthe materials embodied in plant and equipment and for construction and operation of theseenergy facilities. Full fuel-cycle analysis is needed to determine the exact amount of emissionsof these otherwise genuinely emission free energy sources, but all available analysis suggestssignificant net emission gains for these options. For biomass, the situation is somewhatdifferent as emissions are inevitably released during combustion. In the case of carbon dioxidethese can be neutral if the biomass is harvested on a sustainable basis. Other emissions, e.g.,carbon monoxide or methane released during combustion can be reduced through theutilization of appropriate combustion technologies, such as the gasification of biomass inconjunction with combined-cycle gas turbines for electricity generation (IGCC, or integratedgasification combined cycle technology).
45 Lazarus, M.L., Greber, L., Hall, J., Bartels, C., Bernow, S., Hansen, E., Raskin, P. and vonHippel, D. (1993) Towards a Fossil Free Energy Future: The Next Energy Transition, ATechnical Analysis for Greenpeace International, Stockholm Environmental Institute, BostonCenter, Boston, USA.
46 Nilsson, S. (1993) ‘Carbon sequestering potential by global afforestation’, Energy – TheInternational Journal, Vol.18, No. 5, pp.506–519.

Energy and the protection of the atmosphere 57
47 Nilsson, S. and Schoplfhauser, W. (1995) ‘The carbon sequestration potential of a globalafforestation program’, Climate Change, Vol. 30, pp.267–293.
48 Fischer, G., Frohberg, K., Parry, M.L. and Rosenzweig, C. (1994) ‘Climate change and worldfood supply, demand and trade. Who benefits, who loses?’, Global Environmental Change,Vol. 4, No. 1, pp.7–23.
49 Rosenzweig, C. and Parry, M.L. (1994) ‘Potential impacts of climate change on world foodsupply’, Nature, Vol. 367, pp.133–138.
50 Nakicenovic, N. and Rogner, H.H. (1995) Global Financing Needs for Long-term EnergyPerspectives, WP-95-101, International Institute for Applied Systems Analysis (IIASA),Laxenburg, Austria.
51 WEC (World Energy Council) (1995b) Financing Energy Development: The Challenges andRequirements of Developing Countries, WEC, London, UK.
52 Grübler, A. (1998) Technology and Global change, Cambridge University Press, Cambridge,UK.
53 Gray, P.E. (1989) ‘The paradox of technological development’, in J.H. Ausubel and H.E.Sladovich (Eds.) Technology and Environment, pp.192–204, National Academy Press,Washington, D.C., USA.