Embed Size (px)
Citation preview
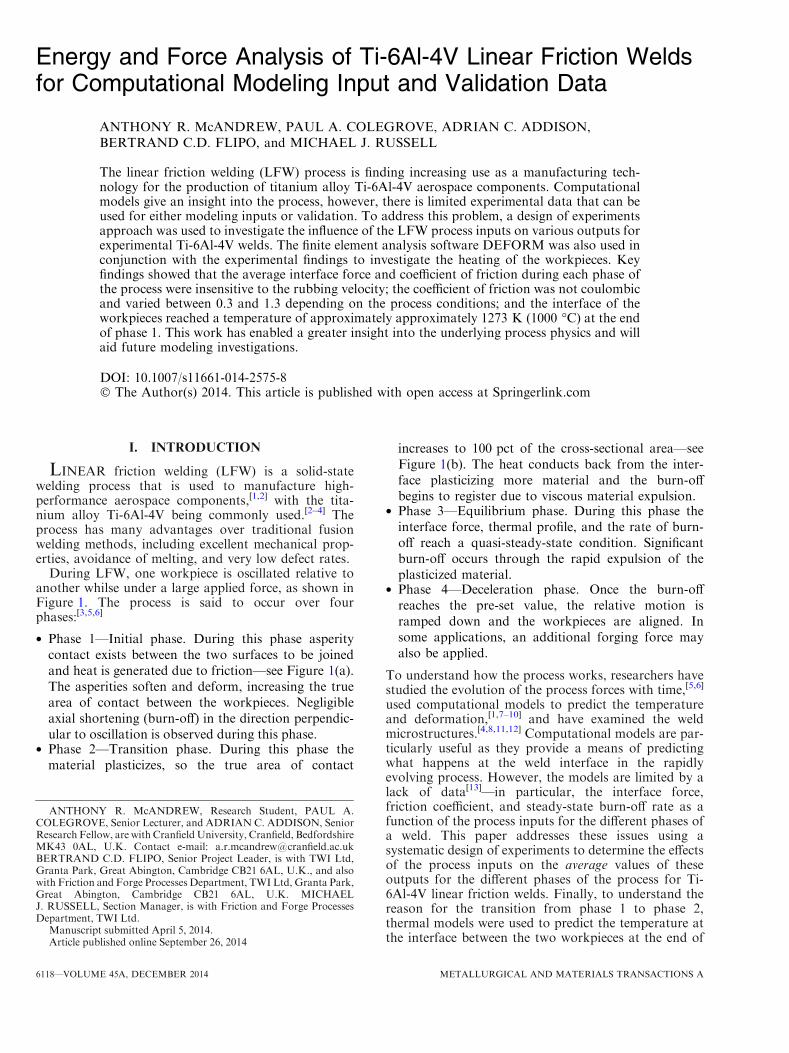
Energy and Force Analysis of Ti-6Al-4V Linear Friction Weldsfor Computational Modeling Input and Validation Data
ANTHONY R. McANDREW, PAUL A. COLEGROVE, ADRIAN C. ADDISON,BERTRAND C.D. FLIPO, and MICHAEL J. RUSSELL
The linear friction welding (LFW) process is finding increasing use as a manufacturing tech-nology for the production of titanium alloy Ti-6Al-4V aerospace components. Computationalmodels give an insight into the process, however, there is limited experimental data that can beused for either modeling inputs or validation. To address this problem, a design of experimentsapproach was used to investigate the influence of the LFW process inputs on various outputs forexperimental Ti-6Al-4V welds. The finite element analysis software DEFORM was also used inconjunction with the experimental findings to investigate the heating of the workpieces. Keyfindings showed that the average interface force and coefficient of friction during each phase ofthe process were insensitive to the rubbing velocity; the coefficient of friction was not coulombicand varied between 0.3 and 1.3 depending on the process conditions; and the interface of theworkpieces reached a temperature of approximately approximately 1273 K (1000 �C) at the endof phase 1. This work has enabled a greater insight into the underlying process physics and willaid future modeling investigations.
DOI: 10.1007/s11661-014-2575-8� The Author(s) 2014. This article is published with open access at Springerlink.com
I. INTRODUCTION
LINEAR friction welding (LFW) is a solid-statewelding process that is used to manufacture high-performance aerospace components,[1,2] with the tita-nium alloy Ti-6Al-4V being commonly used.[2–4] Theprocess has many advantages over traditional fusionwelding methods, including excellent mechanical prop-erties, avoidance of melting, and very low defect rates.
During LFW, one workpiece is oscillated relative toanother whilse under a large applied force, as shown inFigure 1. The process is said to occur over fourphases:[3,5,6]
� Phase 1—Initial phase. During this phase asperitycontact exists between the two surfaces to be joinedand heat is generated due to friction—see Figure 1(a).The asperities soften and deform, increasing the truearea of contact between the workpieces. Negligibleaxial shortening (burn-off) in the direction perpendic-ular to oscillation is observed during this phase.
� Phase 2—Transition phase. During this phase thematerial plasticizes, so the true area of contact
increases to 100 pct of the cross-sectional area—seeFigure 1(b). The heat conducts back from the inter-face plasticizing more material and the burn-offbegins to register due to viscous material expulsion.
� Phase 3—Equilibrium phase. During this phase theinterface force, thermal profile, and the rate of burn-off reach a quasi-steady-state condition. Significantburn-off occurs through the rapid expulsion of theplasticized material.
� Phase 4—Deceleration phase. Once the burn-offreaches the pre-set value, the relative motion isramped down and the workpieces are aligned. Insome applications, an additional forging force mayalso be applied.
To understand how the process works, researchers havestudied the evolution of the process forces with time,[5,6]
used computational models to predict the temperatureand deformation,[1,7–10] and have examined the weldmicrostructures.[4,8,11,12] Computational models are par-ticularly useful as they provide a means of predictingwhat happens at the weld interface in the rapidlyevolving process. However, the models are limited by alack of data[13]—in particular, the interface force,friction coefficient, and steady-state burn-off rate as afunction of the process inputs for the different phases ofa weld. This paper addresses these issues using asystematic design of experiments to determine the effectsof the process inputs on the average values of theseoutputs for the different phases of the process for Ti-6Al-4V linear friction welds. Finally, to understand thereason for the transition from phase 1 to phase 2,thermal models were used to predict the temperature atthe interface between the two workpieces at the end of
ANTHONY R. McANDREW, Research Student, PAUL A.COLEGROVE, Senior Lecturer, and ADRIAN C. ADDISON, SeniorResearch Fellow, are with CranfieldUniversity, Cranfield, BedfordshireMK43 0AL, U.K. Contact e-mail: [email protected] C.D. FLIPO, Senior Project Leader, is with TWI Ltd,Granta Park, Great Abington, Cambridge CB21 6AL, U.K., and alsowith Friction and Forge Processes Department, TWI Ltd, Granta Park,Great Abington, Cambridge CB21 6AL, U.K. MICHAELJ. RUSSELL, Section Manager, is with Friction and Forge ProcessesDepartment, TWI Ltd.
Manuscript submitted April 5, 2014.Article published online September 26, 2014
6118—VOLUME 45A, DECEMBER 2014 METALLURGICAL AND MATERIALS TRANSACTIONS A

phase 1. These values were then related to the materialflow behavior.
II. METHODOLOGY
A. Experimental
The experiments used workpieces with dimensions of40 9 20 9 60 mm3 with oscillation taking place in the40-mm length direction, as shown in Figure 2(a). TheTi-6Al-4V parent material had a bimodal alpha-betamicrostructure, as shown in Figure 2(b). Prior to weld-ing, the workpieces were cleaned with acetone.Design Expert V.7, a design of experiments (DOE)
software package, was used to identify a range ofexperiments for a regression model. To keep the numberof experiments low, the inputs that had the largest effecton the outputs were investigated: amplitude, A, fre-quency, f, applied force, Fa, and the burn-off, Bo.
[2,4]
Fig. 2—Experimental details showing: (a) workpiece dimensions and movement, (b) bimodal alpha–beta microstructure, (c) workpiece preparedfor thermocouples (dimensions in millimeters), and (d) FW34 process input operating window.
Fig. 1—Key stages of the linear friction welding process: (a) asperityinteraction and (b) plasticized interface.
METALLURGICAL AND MATERIALS TRANSACTIONS A VOLUME 45A, DECEMBER 2014—6119
Although the amplitude and frequency were consideredas two individual process inputs in this paper, they aresometimes combined into a single input term called theaverage rubbing velocity, vr, which Addison[14] defines as:
vr ¼ 4 � A � f: ½1�
The experiments were completed using the FW34LFW machine at TWI, Cambridge. The operatingwindow for the combination of frequency, amplitude,and applied force that can be used with this machine isillustrated in Figure 2(d). The final input, the burn-off,was adjusted between 1 and 3 mm because previousstudies[2,4] indicated that this critically affected whetherthe interface oxides were removed. These inputs wereentered into the DOE software to generate a range ofexperimental conditions for a D-optimal regressionanalysis. The forging force in phase 4 remained thesame as the applied force previously used. The remain-ing process inputs: ramp up time, oscillation decay time,and forging time were kept constant and had values of0.1, 0.1, and 10 seconds, respectively.
The experimental design was specified to includeenough experiments to account for a quadratic rela-tionship between the inputs and outputs, since thisbehavior has been observed in the literature.[4,14] Someof the experiments were repeated to test the variancegiving 25 experimental conditions for the DOE analysis,which are listed (welds 1 to 25) in Table I. In addition,four experiments were completed using thermocouples(welds 26 to 29). To insert the k-type thermocouples,several workpieces had four 1.2 mm diameter holesdrilled through them perpendicularly to the oscillationdirection and parallel to the direction of the appliedforce at the positions shown in Figure 2(c). To positionthe thermocouples at distances of 0.3, 1, 2.5, and4.5 mm from the weld interface, a plug was placed intothe holes at the interface end of the workpiece. Thethermocouple wire was inserted through the oppositeend until it made contact with the plug, the thermocou-ples where then fixed into position using an epoxy resin.
Metallographic specimens were produced from theexperiments (welds 1 to 25) in Table I. The welds weresectioned 45 deg to the direction of oscillation andparallel to the applied force. The sectioned samples wereplaced into a hot resin, and then ground down using thefollowing grit silicon carbide papers: 240, 1200, 2500,and 4000. After grinding, the sectioned samples werepolished using colloidal silica polish on a micro-clothand etched using hydrofluoric acid. The metallographicsamples were viewed under a refractive microscope todetermine the microstructure of the weld interface andto see if any surface impurities could be observed.
B. Analysis of the Force and Displacement History
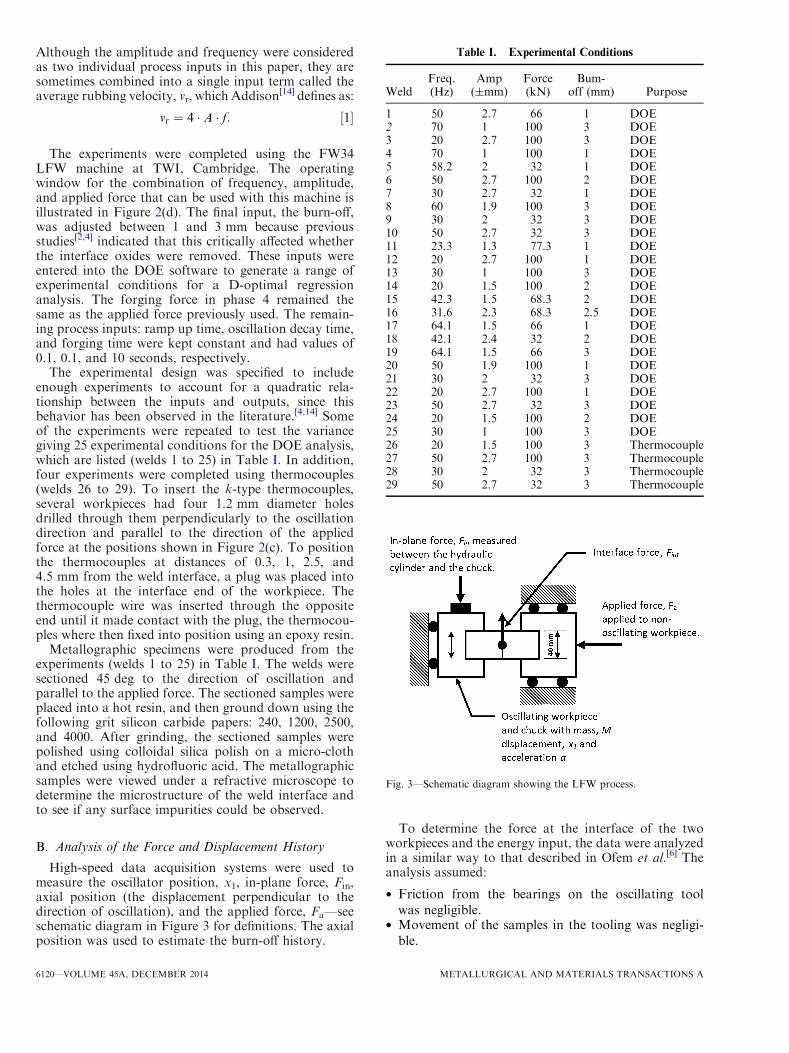
High-speed data acquisition systems were used tomeasure the oscillator position, x1, in-plane force, Fin,axial position (the displacement perpendicular to thedirection of oscillation), and the applied force, Fa—seeschematic diagram in Figure 3 for definitions. The axialposition was used to estimate the burn-off history.
To determine the force at the interface of the twoworkpieces and the energy input, the data were analyzedin a similar way to that described in Ofem et al.[6] Theanalysis assumed:
� Friction from the bearings on the oscillating toolwas negligible.
� Movement of the samples in the tooling was negligi-ble.
Table I. Experimental Conditions
WeldFreq.(Hz)
Amp(±mm)
Force(kN)
Bum-off (mm) Purpose
1 50 2.7 66 1 DOE2 70 1 100 3 DOE3 20 2.7 100 3 DOE4 70 1 100 1 DOE5 58.2 2 32 1 DOE6 50 2.7 100 2 DOE7 30 2.7 32 1 DOE8 60 1.9 100 3 DOE9 30 2 32 3 DOE10 50 2.7 32 3 DOE11 23.3 1.3 77.3 1 DOE12 20 2.7 100 1 DOE13 30 1 100 3 DOE14 20 1.5 100 2 DOE15 42.3 1.5 68.3 2 DOE16 31.6 2.3 68.3 2.5 DOE17 64.1 1.5 66 1 DOE18 42.1 2.4 32 2 DOE19 64.1 1.5 66 3 DOE20 50 1.9 100 1 DOE21 30 2 32 3 DOE22 20 2.7 100 1 DOE23 50 2.7 32 3 DOE24 20 1.5 100 2 DOE25 30 1 100 3 DOE26 20 1.5 100 3 Thermocouple27 50 2.7 100 3 Thermocouple28 30 2 32 3 Thermocouple29 50 2.7 32 3 Thermocouple
Fig. 3—Schematic diagram showing the LFW process.
6120—VOLUME 45A, DECEMBER 2014 METALLURGICAL AND MATERIALS TRANSACTIONS A
From the schematic diagram in Figure 3, the instrumen-tation between the oscillating chuck and hydrauliccylinder records the in-plane force, Fin. This does notrepresent the force at the weld interface, Fint, due to theeffects ofmomentumacting on theworkpiece and tooling.Summing the forces on the chuck in the vertical directionenables the weld interface force, Fint, to be determined
Fint ¼ Fin �M � a; ½2�
where M is the mass of the chuck and workpiece(approximately 280 kg) and a is the acceleration. Theforce convention is shown in Figure 3. Note that whileFin is positive downwards, Fint is positive upwards.
The acceleration may be calculated using numericaldifferentiation or if sinusoidal displacement is assumedthe acceleration may be calculated from
a ¼ d2x
dt2¼ �Ax2 sinðxtÞdt ¼ �x1x2 ¼ �x1ð2pfÞ2; ½3�
where t is the time, x is the angular frequency, and x1 isthe displacement. Equation [3] is less susceptible to noisewhen compared to the numerical differentiation meth-od.[6] Since the motion of the workpieces in theseexperiments was sinusoidal, Eq. [3] was used for theanalyses presented in this paper.
The average interface force generated over a phase,Fpa, was divided by the applied force to determine theaverage dynamic friction coefficient l:
l ¼ Fpa
Fa: ½4�
The total energy inputted to the weld interface, Ex,may then be estimated by integrating the power withrespect to time
Ex ¼ZT
0
Fintvdt; ½5�
where T is the total duration of the weld and v is thevelocity.
To determine the average power input for one of thephases, the energy input for that phase was divided bythe phase duration. Finally, the burn-off rate duringphase 3 was determined by calculating the gradient ofthe line where the burn-off reached steady state.
C. Regression Analysis
An ‘‘analysis of variance’’ (ANOVA) was conductedusing Design Expert V.7. This identified which inputsand input interactions were statistically important formathematically modeling the process outputs of interest.The statistically insignificant factors were then removedfrom the equations. Several statistical criteria wereconsidered when reducing the factors. These are listedbelow, and the reader is referred to the cited text forfurther explanation:[15]
� R-squared (R2): The percentage of variation in thedata explained by the regression model.
� Adjusted R-squared (Adj R2): As for R2 but ad-justed for the number of factors in the model.
� Predicted R-squared (Prd R2): A measure of the per-centage of variation for new data explained by themodel.
� Adequate precision (Ad. Pr): This is the signal tonoise ratio and compares the range of the predictedvalues at the design points to the average predictionerror.
� P-Values (P–V): This helps the user determiningwhich input factors are of significance. The smallerthe value, the better with values equal to or lowerthan 0.05 being statistically significant. The overallvalue for the equation describes how significant it is.
D. Thermal Modeling
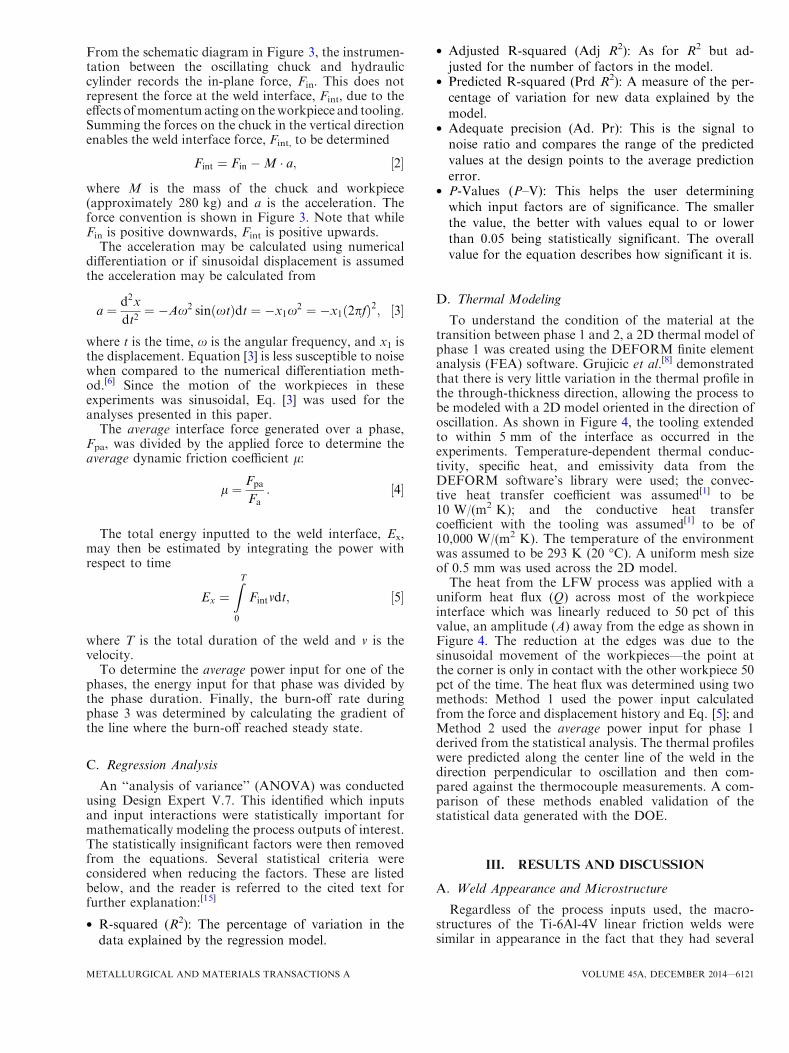
To understand the condition of the material at thetransition between phase 1 and 2, a 2D thermal model ofphase 1 was created using the DEFORM finite elementanalysis (FEA) software. Grujicic et al.[8] demonstratedthat there is very little variation in the thermal profile inthe through-thickness direction, allowing the process tobe modeled with a 2D model oriented in the direction ofoscillation. As shown in Figure 4, the tooling extendedto within 5 mm of the interface as occurred in theexperiments. Temperature-dependent thermal conduc-tivity, specific heat, and emissivity data from theDEFORM software’s library were used; the convec-tive heat transfer coefficient was assumed[1] to be10 W/(m2 K); and the conductive heat transfercoefficient with the tooling was assumed[1] to be of10,000 W/(m2 K). The temperature of the environmentwas assumed to be 293 K (20 �C). A uniform mesh sizeof 0.5 mm was used across the 2D model.The heat from the LFW process was applied with a
uniform heat flux (Q) across most of the workpieceinterface which was linearly reduced to 50 pct of thisvalue, an amplitude (A) away from the edge as shown inFigure 4. The reduction at the edges was due to thesinusoidal movement of the workpieces—the point atthe corner is only in contact with the other workpiece 50pct of the time. The heat flux was determined using twomethods: Method 1 used the power input calculatedfrom the force and displacement history and Eq. [5]; andMethod 2 used the average power input for phase 1derived from the statistical analysis. The thermal profileswere predicted along the center line of the weld in thedirection perpendicular to oscillation and then com-pared against the thermocouple measurements. A com-parison of these methods enabled validation of thestatistical data generated with the DOE.
III. RESULTS AND DISCUSSION
A. Weld Appearance and Microstructure
Regardless of the process inputs used, the macro-structures of the Ti-6Al-4V linear friction welds weresimilar in appearance in the fact that they had several
METALLURGICAL AND MATERIALS TRANSACTIONS A VOLUME 45A, DECEMBER 2014—6121
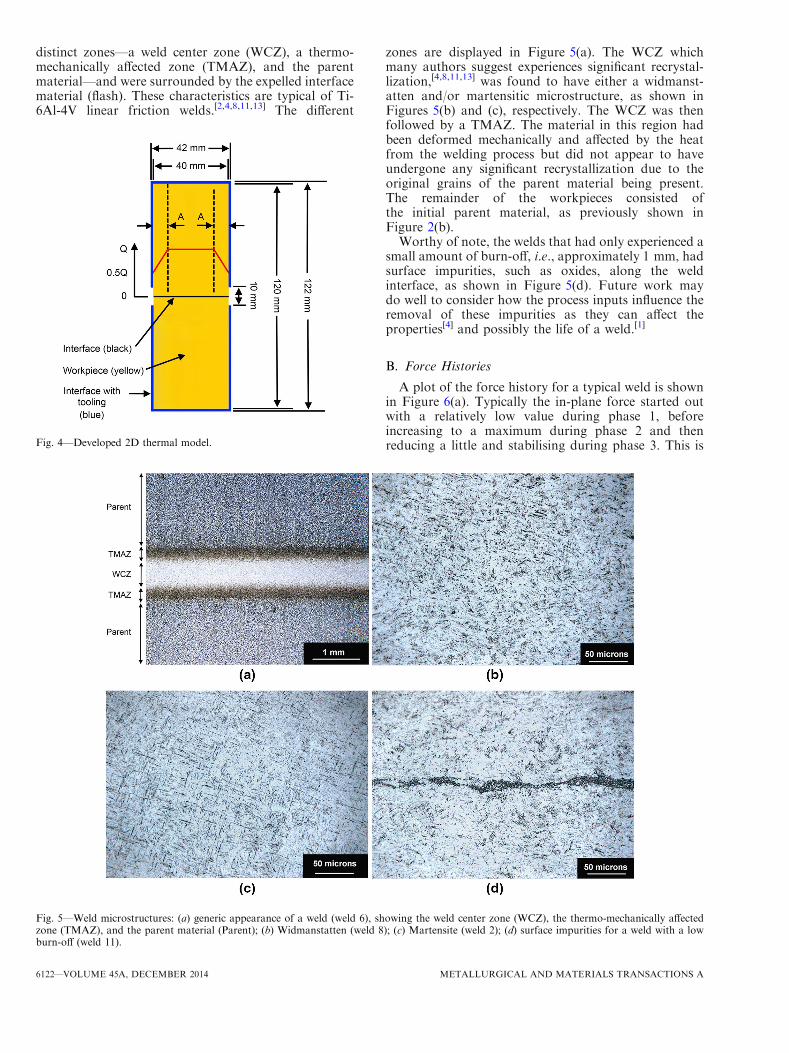
distinct zones—a weld center zone (WCZ), a thermo-mechanically affected zone (TMAZ), and the parentmaterial—and were surrounded by the expelled interfacematerial (flash). These characteristics are typical of Ti-6Al-4V linear friction welds.[2,4,8,11,13] The different
zones are displayed in Figure 5(a). The WCZ whichmany authors suggest experiences significant recrystal-lization,[4,8,11,13] was found to have either a widmanst-atten and/or martensitic microstructure, as shown inFigures 5(b) and (c), respectively. The WCZ was thenfollowed by a TMAZ. The material in this region hadbeen deformed mechanically and affected by the heatfrom the welding process but did not appear to haveundergone any significant recrystallization due to theoriginal grains of the parent material being present.The remainder of the workpieces consisted ofthe initial parent material, as previously shown inFigure 2(b).Worthy of note, the welds that had only experienced a
small amount of burn-off, i.e., approximately 1 mm, hadsurface impurities, such as oxides, along the weldinterface, as shown in Figure 5(d). Future work maydo well to consider how the process inputs influence theremoval of these impurities as they can affect theproperties[4] and possibly the life of a weld.[1]
B. Force Histories
A plot of the force history for a typical weld is shownin Figure 6(a). Typically the in-plane force started outwith a relatively low value during phase 1, beforeincreasing to a maximum during phase 2 and thenreducing a little and stabilising during phase 3. This isFig. 4—Developed 2D thermal model.
Fig. 5—Weld microstructures: (a) generic appearance of a weld (weld 6), showing the weld center zone (WCZ), the thermo-mechanically affectedzone (TMAZ), and the parent material (Parent); (b) Widmanstatten (weld 8); (c) Martensite (weld 2); (d) surface impurities for a weld with a lowburn-off (weld 11).
6122—VOLUME 45A, DECEMBER 2014 METALLURGICAL AND MATERIALS TRANSACTIONS A
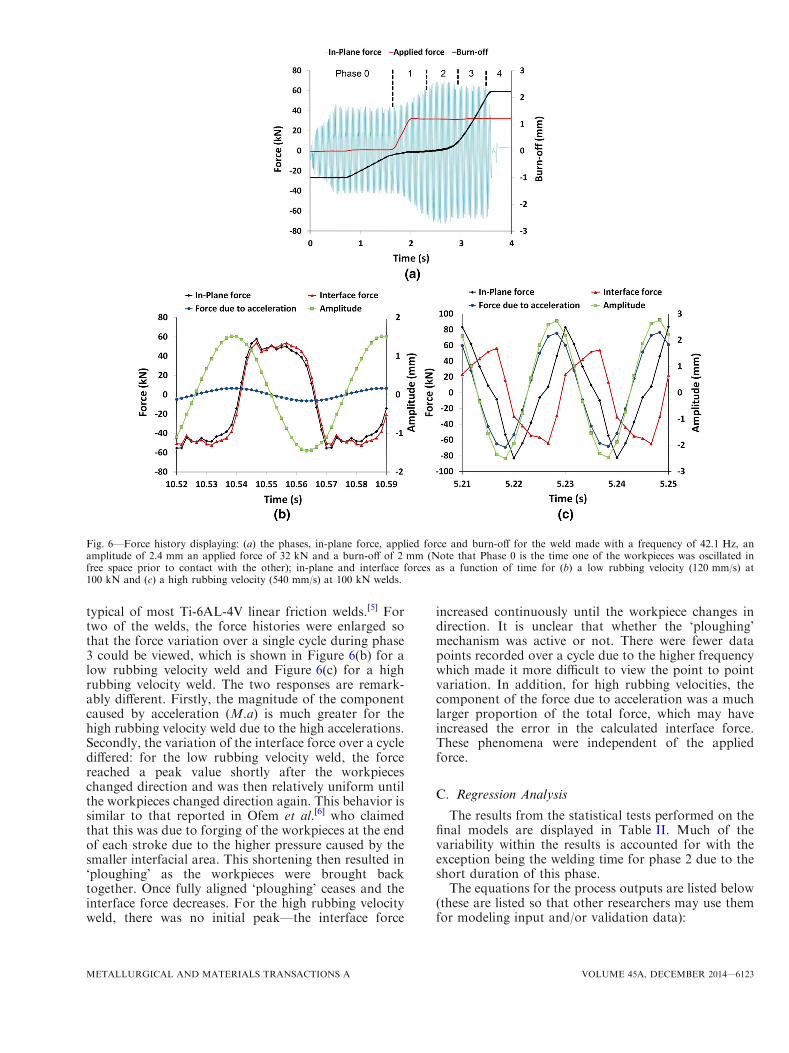
typical of most Ti-6AL-4V linear friction welds.[5] Fortwo of the welds, the force histories were enlarged sothat the force variation over a single cycle during phase3 could be viewed, which is shown in Figure 6(b) for alow rubbing velocity weld and Figure 6(c) for a highrubbing velocity weld. The two responses are remark-ably different. Firstly, the magnitude of the componentcaused by acceleration (M.a) is much greater for thehigh rubbing velocity weld due to the high accelerations.Secondly, the variation of the interface force over a cyclediffered: for the low rubbing velocity weld, the forcereached a peak value shortly after the workpieceschanged direction and was then relatively uniform untilthe workpieces changed direction again. This behavior issimilar to that reported in Ofem et al.[6] who claimedthat this was due to forging of the workpieces at the endof each stroke due to the higher pressure caused by thesmaller interfacial area. This shortening then resulted in‘ploughing’ as the workpieces were brought backtogether. Once fully aligned ‘ploughing’ ceases and theinterface force decreases. For the high rubbing velocityweld, there was no initial peak—the interface force
increased continuously until the workpiece changes indirection. It is unclear that whether the ‘ploughing’mechanism was active or not. There were fewer datapoints recorded over a cycle due to the higher frequencywhich made it more difficult to view the point to pointvariation. In addition, for high rubbing velocities, thecomponent of the force due to acceleration was a muchlarger proportion of the total force, which may haveincreased the error in the calculated interface force.These phenomena were independent of the appliedforce.
C. Regression Analysis
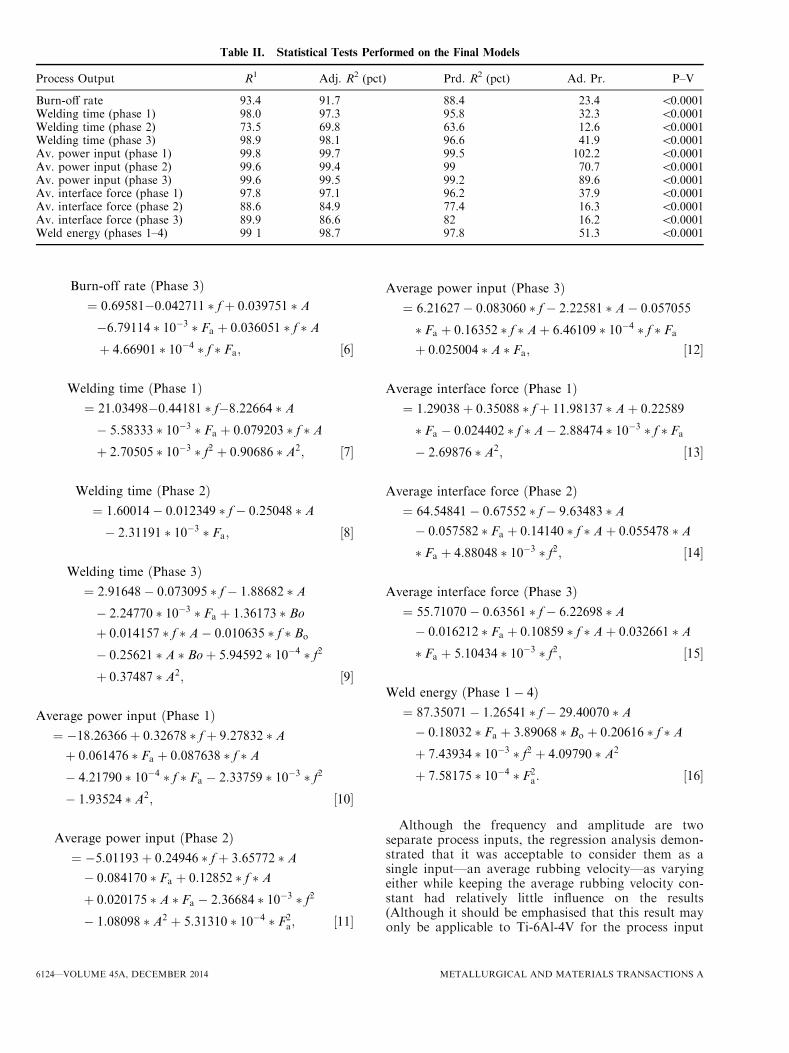
The results from the statistical tests performed on thefinal models are displayed in Table II. Much of thevariability within the results is accounted for with theexception being the welding time for phase 2 due to theshort duration of this phase.The equations for the process outputs are listed below
(these are listed so that other researchers may use themfor modeling input and/or validation data):
Fig. 6—Force history displaying: (a) the phases, in-plane force, applied force and burn-off for the weld made with a frequency of 42.1 Hz, anamplitude of 2.4 mm an applied force of 32 kN and a burn-off of 2 mm (Note that Phase 0 is the time one of the workpieces was oscillated infree space prior to contact with the other); in-plane and interface forces as a function of time for (b) a low rubbing velocity (120 mm/s) at100 kN and (c) a high rubbing velocity (540 mm/s) at 100 kN welds.
METALLURGICAL AND MATERIALS TRANSACTIONS A VOLUME 45A, DECEMBER 2014—6123
Burn-off rate Phase 3ð Þ¼ 0:69581�0:042711 � fþ 0:039751 � A�6:79114 � 10�3 � Fa þ 0:036051 � f � Aþ 4:66901 � 10�4 � f � Fa; ½6�
Welding time Phase 1ð Þ¼ 21:03498�0:44181 � f�8:22664 � A� 5:58333 � 10�3 � Fa þ 0:079203 � f � Aþ 2:70505 � 10�3 � f2 þ 0:90686 � A2; ½7�
Welding time Phase 2ð Þ¼ 1:60014� 0:012349 � f� 0:25048 � A� 2:31191 � 10�3 � Fa; ½8�
Welding time Phase 3ð Þ¼ 2:91648� 0:073095 � f� 1:88682 � A� 2:24770 � 10�3 � Fa þ 1:36173 � Boþ 0:014157 � f � A� 0:010635 � f � Bo
� 0:25621 � A � Boþ 5:94592 � 10�4 � f2
þ 0:37487 � A2; ½9�
Average power input Phase 1ð Þ¼ �18:26366þ 0:32678 � fþ 9:27832 � Aþ 0:061476 � Fa þ 0:087638 � f � A� 4:21790 � 10�4 � f � Fa � 2:33759 � 10�3 � f2
� 1:93524 � A2; ½10�
Average power input Phase 2ð Þ¼ �5:01193þ 0:24946 � fþ 3:65772 � A� 0:084170 � Fa þ 0:12852 � f � Aþ 0:020175 � A � Fa � 2:36684 � 10�3 � f2
� 1:08098 � A2 þ 5:31310 � 10�4 � F2a; ½11�
Average power input Phase 3ð Þ¼ 6:21627 � 0:083060 � f� 2:22581 � A� 0:057055
� Fa þ 0:16352 � f � Aþ 6:46109 � 10�4 � f � Fa
þ 0:025004 � A � Fa; ½12�
Average interface force Phase 1ð Þ¼ 1:29038 þ 0:35088 � fþ 11:98137 � Aþ 0:22589
� Fa � 0:024402 � f � A� 2:88474 � 10�3 � f � Fa
� 2:69876 � A2; ½13�
Average interface force Phase 2ð Þ¼ 64:54841 � 0:67552 � f� 9:63483 � A� 0:057582 � Fa þ 0:14140 � f � Aþ 0:055478 � A� Fa þ 4:88048 � 10�3 � f2; ½14�
Average interface force Phase 3ð Þ¼ 55:71070 � 0:63561 � f� 6:22698 � A� 0:016212 � Fa þ 0:10859 � f � Aþ 0:032661 � A� Fa þ 5:10434 � 10�3 � f2; ½15�
Weld energy Phase 1� 4ð Þ¼ 87:35071 � 1:26541 � f� 29:40070 � A� 0:18032 � Fa þ 3:89068 � Bo þ 0:20616 � f � Aþ 7:43934 � 10�3 � f2 þ 4:09790 � A2
þ 7:58175 � 10�4 � F2a: ½16�
Although the frequency and amplitude are twoseparate process inputs, the regression analysis demon-strated that it was acceptable to consider them as asingle input—an average rubbing velocity—as varyingeither while keeping the average rubbing velocity con-stant had relatively little influence on the results(Although it should be emphasised that this result mayonly be applicable to Ti-6Al-4V for the process input
Table II. Statistical Tests Performed on the Final Models
Process Output R1 Adj. R2 (pct) Prd. R2 (pct) Ad. Pr. P–V
Burn-off rate 93.4 91.7 88.4 23.4 <0.0001Welding time (phase 1) 98.0 97.3 95.8 32.3 <0.0001Welding time (phase 2) 73.5 69.8 63.6 12.6 <0.0001Welding time (phase 3) 98.9 98.1 96.6 41.9 <0.0001Av. power input (phase 1) 99.8 99.7 99.5 102.2 <0.0001Av. power input (phase 2) 99.6 99.4 99 70.7 <0.0001Av. power input (phase 3) 99.6 99.5 99.2 89.6 <0.0001Av. interface force (phase 1) 97.8 97.1 96.2 37.9 <0.0001Av. interface force (phase 2) 88.6 84.9 77.4 16.3 <0.0001Av. interface force (phase 3) 89.9 86.6 82 16.2 <0.0001Weld energy (phases 1–4) 99 1 98.7 97.8 51.3 <0.0001
6124—VOLUME 45A, DECEMBER 2014 METALLURGICAL AND MATERIALS TRANSACTIONS A
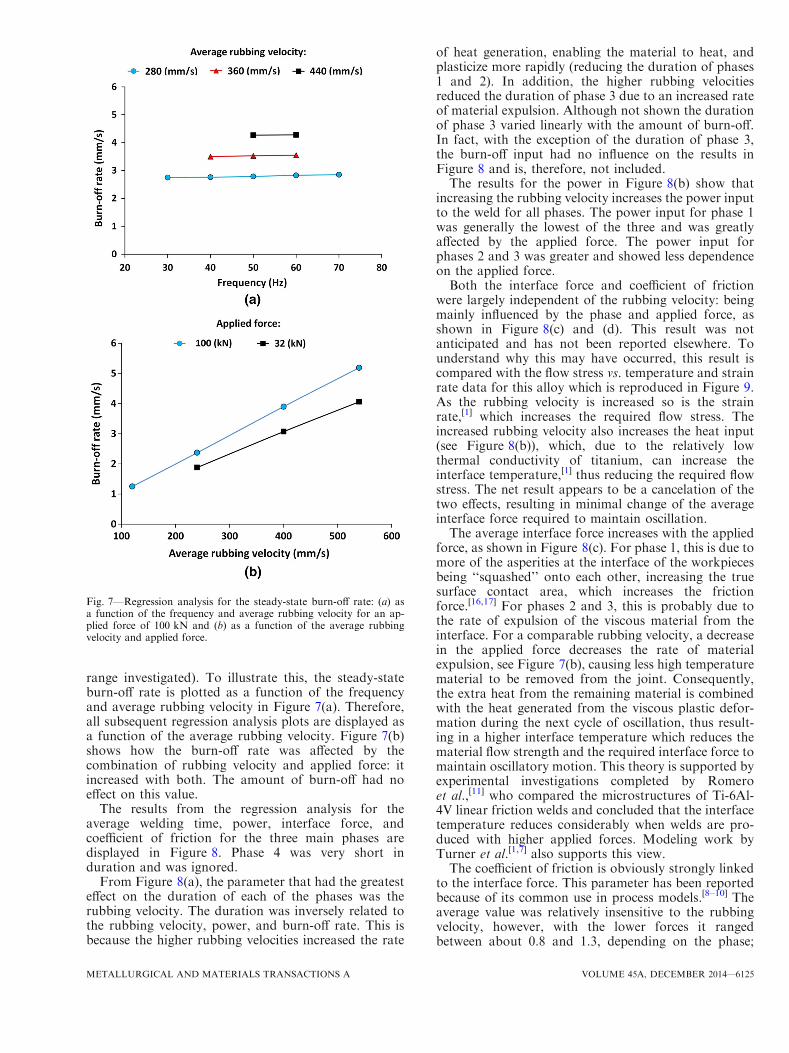
range investigated). To illustrate this, the steady-stateburn-off rate is plotted as a function of the frequencyand average rubbing velocity in Figure 7(a). Therefore,all subsequent regression analysis plots are displayed asa function of the average rubbing velocity. Figure 7(b)shows how the burn-off rate was affected by thecombination of rubbing velocity and applied force: itincreased with both. The amount of burn-off had noeffect on this value.
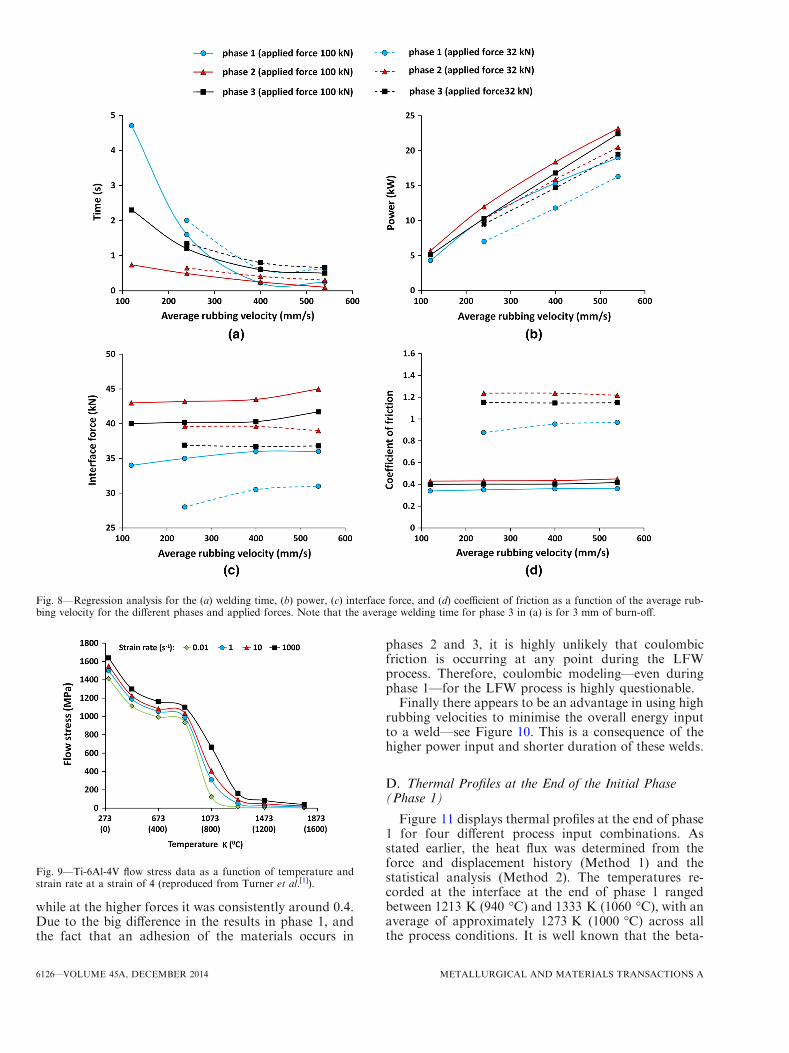
The results from the regression analysis for theaverage welding time, power, interface force, andcoefficient of friction for the three main phases aredisplayed in Figure 8. Phase 4 was very short induration and was ignored.
From Figure 8(a), the parameter that had the greatesteffect on the duration of each of the phases was therubbing velocity. The duration was inversely related tothe rubbing velocity, power, and burn-off rate. This isbecause the higher rubbing velocities increased the rate
of heat generation, enabling the material to heat, andplasticize more rapidly (reducing the duration of phases1 and 2). In addition, the higher rubbing velocitiesreduced the duration of phase 3 due to an increased rateof material expulsion. Although not shown the durationof phase 3 varied linearly with the amount of burn-off.In fact, with the exception of the duration of phase 3,the burn-off input had no influence on the results inFigure 8 and is, therefore, not included.The results for the power in Figure 8(b) show that
increasing the rubbing velocity increases the power inputto the weld for all phases. The power input for phase 1was generally the lowest of the three and was greatlyaffected by the applied force. The power input forphases 2 and 3 was greater and showed less dependenceon the applied force.Both the interface force and coefficient of friction
were largely independent of the rubbing velocity: beingmainly influenced by the phase and applied force, asshown in Figure 8(c) and (d). This result was notanticipated and has not been reported elsewhere. Tounderstand why this may have occurred, this result iscompared with the flow stress vs. temperature and strainrate data for this alloy which is reproduced in Figure 9.As the rubbing velocity is increased so is the strainrate,[1] which increases the required flow stress. Theincreased rubbing velocity also increases the heat input(see Figure 8(b)), which, due to the relatively lowthermal conductivity of titanium, can increase theinterface temperature,[1] thus reducing the required flowstress. The net result appears to be a cancelation of thetwo effects, resulting in minimal change of the averageinterface force required to maintain oscillation.The average interface force increases with the applied
force, as shown in Figure 8(c). For phase 1, this is due tomore of the asperities at the interface of the workpiecesbeing ‘‘squashed’’ onto each other, increasing the truesurface contact area, which increases the frictionforce.[16,17] For phases 2 and 3, this is probably due tothe rate of expulsion of the viscous material from theinterface. For a comparable rubbing velocity, a decreasein the applied force decreases the rate of materialexpulsion, see Figure 7(b), causing less high temperaturematerial to be removed from the joint. Consequently,the extra heat from the remaining material is combinedwith the heat generated from the viscous plastic defor-mation during the next cycle of oscillation, thus result-ing in a higher interface temperature which reduces thematerial flow strength and the required interface force tomaintain oscillatory motion. This theory is supported byexperimental investigations completed by Romeroet al.,[11] who compared the microstructures of Ti-6Al-4V linear friction welds and concluded that the interfacetemperature reduces considerably when welds are pro-duced with higher applied forces. Modeling work byTurner et al.[1,7] also supports this view.The coefficient of friction is obviously strongly linked
to the interface force. This parameter has been reportedbecause of its common use in process models.[8–10] Theaverage value was relatively insensitive to the rubbingvelocity, however, with the lower forces it rangedbetween about 0.8 and 1.3, depending on the phase;
Fig. 7—Regression analysis for the steady-state burn-off rate: (a) asa function of the frequency and average rubbing velocity for an ap-plied force of 100 kN and (b) as a function of the average rubbingvelocity and applied force.
METALLURGICAL AND MATERIALS TRANSACTIONS A VOLUME 45A, DECEMBER 2014—6125
while at the higher forces it was consistently around 0.4.Due to the big difference in the results in phase 1, andthe fact that an adhesion of the materials occurs in
phases 2 and 3, it is highly unlikely that coulombicfriction is occurring at any point during the LFWprocess. Therefore, coulombic modeling—even duringphase 1—for the LFW process is highly questionable.Finally there appears to be an advantage in using high
rubbing velocities to minimise the overall energy inputto a weld—see Figure 10. This is a consequence of thehigher power input and shorter duration of these welds.
D. Thermal Profiles at the End of the Initial Phase(Phase 1)
Figure 11 displays thermal profiles at the end of phase1 for four different process input combinations. Asstated earlier, the heat flux was determined from theforce and displacement history (Method 1) and thestatistical analysis (Method 2). The temperatures re-corded at the interface at the end of phase 1 rangedbetween 1213 K (940 �C) and 1333 K (1060 �C), with anaverage of approximately 1273 K (1000 �C) across allthe process conditions. It is well known that the beta-
Fig. 8—Regression analysis for the (a) welding time, (b) power, (c) interface force, and (d) coefficient of friction as a function of the average rub-bing velocity for the different phases and applied forces. Note that the average welding time for phase 3 in (a) is for 3 mm of burn-off.
Fig. 9—Ti-6Al-4V flow stress data as a function of temperature andstrain rate at a strain of 4 (reproduced from Turner et al.[1]).
6126—VOLUME 45A, DECEMBER 2014 METALLURGICAL AND MATERIALS TRANSACTIONS A
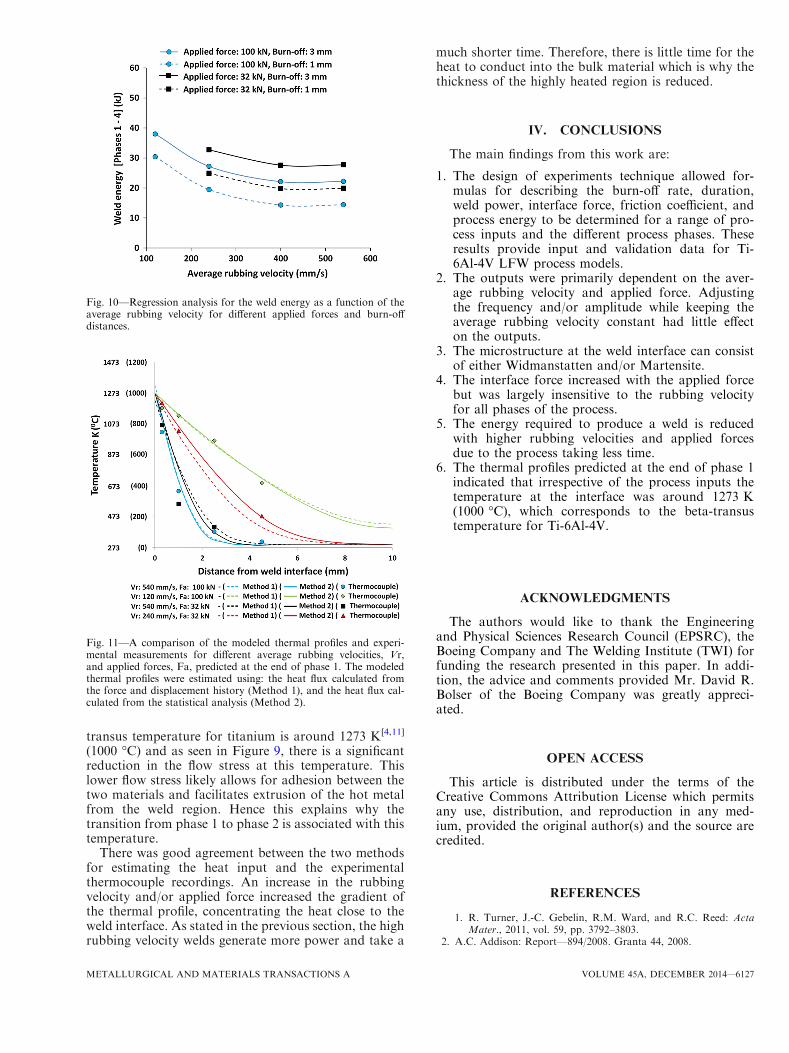
transus temperature for titanium is around 1273 K[4,11]
(1000 �C) and as seen in Figure 9, there is a significantreduction in the flow stress at this temperature. Thislower flow stress likely allows for adhesion between thetwo materials and facilitates extrusion of the hot metalfrom the weld region. Hence this explains why thetransition from phase 1 to phase 2 is associated with thistemperature.
There was good agreement between the two methodsfor estimating the heat input and the experimentalthermocouple recordings. An increase in the rubbingvelocity and/or applied force increased the gradient ofthe thermal profile, concentrating the heat close to theweld interface. As stated in the previous section, the highrubbing velocity welds generate more power and take a
much shorter time. Therefore, there is little time for theheat to conduct into the bulk material which is why thethickness of the highly heated region is reduced.
IV. CONCLUSIONS
The main findings from this work are:
1. The design of experiments technique allowed for-mulas for describing the burn-off rate, duration,weld power, interface force, friction coefficient, andprocess energy to be determined for a range of pro-cess inputs and the different process phases. Theseresults provide input and validation data for Ti-6Al-4V LFW process models.
2. The outputs were primarily dependent on the aver-age rubbing velocity and applied force. Adjustingthe frequency and/or amplitude while keeping theaverage rubbing velocity constant had little effecton the outputs.
3. The microstructure at the weld interface can consistof either Widmanstatten and/or Martensite.
4. The interface force increased with the applied forcebut was largely insensitive to the rubbing velocityfor all phases of the process.
5. The energy required to produce a weld is reducedwith higher rubbing velocities and applied forcesdue to the process taking less time.
6. The thermal profiles predicted at the end of phase 1indicated that irrespective of the process inputs thetemperature at the interface was around 1273 K(1000 �C), which corresponds to the beta-transustemperature for Ti-6Al-4V.
ACKNOWLEDGMENTS
The authors would like to thank the Engineeringand Physical Sciences Research Council (EPSRC), theBoeing Company and The Welding Institute (TWI) forfunding the research presented in this paper. In addi-tion, the advice and comments provided Mr. David R.Bolser of the Boeing Company was greatly appreci-ated.
OPEN ACCESS
This article is distributed under the terms of theCreative Commons Attribution License which permitsany use, distribution, and reproduction in any med-ium, provided the original author(s) and the source arecredited.
REFERENCES
1. R. Turner, J.-C. Gebelin, R.M. Ward, and R.C. Reed: ActaMater., 2011, vol. 59, pp. 3792–3803.
2. A.C. Addison: Report—894/2008. Granta 44, 2008.
Fig. 10—Regression analysis for the weld energy as a function of theaverage rubbing velocity for different applied forces and burn-offdistances.
Fig. 11—A comparison of the modeled thermal profiles and experi-mental measurements for different average rubbing velocities, Vr,and applied forces, Fa, predicted at the end of phase 1. The modeledthermal profiles were estimated using: the heat flux calculated fromthe force and displacement history (Method 1), and the heat flux cal-culated from the statistical analysis (Method 2).
METALLURGICAL AND MATERIALS TRANSACTIONS A VOLUME 45A, DECEMBER 2014—6127

3. A. Vairis and M. Frost: Mater. Sci. Eng. A, 1999, vol. 271,pp. 477–84.
4. P. Wanjara and M. Jahazi: Metall. Mater. Trans. A, 2005,vol. 36A, pp. 2149–64.
5. A. Vairis and M. Frost: Wear, 1998, vol. 217, pp. 117–31.6. U.U. Ofem, P.A. Colegrove, A. Addison, and M.J. Russell: Sci.
Technol. Weld. Join., 2010, vol. 15, pp. 479–85.7. R. Turner, R.M. Ward, R. March, and R.C. Reed: Metall. Mater.
Trans. B, 2011, vol. 43B, pp. 186–97.8. M. Grujicic, G. Arakere, B. Pandurangan, C.F. Yen, and B.A.
Cheeseman: J. Mater. Eng. Perform., 2011, vol. 21, pp. 2011–23.9. J. Tao, T. Zhang, P. Liu, J. Li, and Y. Mang: Mater. Sci. Forum,
2008, vols. 575–578, pp. 811–15.10. A. Vairis and M. Frost:Mater. Sci. Eng. A, 2000, vol. 292, pp. 8–17.
11. J. Romero, M.M. Attallah, M. Preuss, M. Karadge, and S.E.Bray: Acta Mater., 2009, vol. 57, pp. 5582–92.
12. A. Chamanfar, M. Jahazi, J. Gholipour, P. Wanjara, and S. Yue:Metall. Mater. Trans. A, 2013, vol. 44A, pp. 4230–38.
13. I. Bhamji, M. Preuss, P.L. Threadgill, and A.C. Addison: Mater.Sci. Technol., 2011, vol. 27, pp. 2–12.
14. A.C Addison: TWI Industrial Members Report—961/2010. Main44, 2010.
15. D.C. Montgomery: Design and Analysis of Experiments, Wiley,Hoboken, 2000, pp. 60–125.
16. B. Bhushan: Introduction to Tribology. Wiley, New York, 2002, 99,199, 560.
17. F.P. Bowden and D. Tabor: The Friction and Lubrication of Solids,Oxford University Press, New York, 1950, p. 10.
6128—VOLUME 45A, DECEMBER 2014 METALLURGICAL AND MATERIALS TRANSACTIONS A