Embed Size (px)
Citation preview

Appendix 1
The force that through the green fuse drives the flower Drives my green age; that blasts the roots of trees Is my destroyer. And I am dumb to tell the crooked rose My youth is bent by the same wintry fever.
The force that drives the water through the rocks Drives my red blood; that dries the mouthing streams Turns mine to wax. And I am dumb to mouth unto my veins How at the mountain spring the same mouth sucks.
Dylan Thomas, Collected Poems (1952)
In these opening stanzas from Dylan Thomas’s famous poem, the poet proclaims the essential unity of the forces that propel animate and inanimate objects alike, from their beginnings to their ultimate decay. Scientists call this force energy. Energy transformations play a key role in all the physical and chemical processes that occur in living systems. But energy alone is insufficient to drive the growth and development of organisms. Protein catalysts called enzymes are required to ensure that the rates of biochemical reactions are rapid enough to support life. In this chapter we will examine basic concepts about energy, the way in which cells transform energy to perform useful work (bioener-getics), and the structure and function of enzymes.
energy and
enzymes
© 2015 Sinauer Associates, Inc. This material cannot be copied, reprouced, manufactured or disseminated in any form without express written permission from the publisher.
A1–2 Appendix 1
energy Flow through Living SystemsThe flow of matter through individual organisms and bio-logical communities is part of everyday experience; the flow of energy is not, even though it is central to the very existence of living things. What makes concepts such as energy, work, and order so elusive is their insubstantial nature: We find it far easier to visualize the dance of atoms and molecules than the forces and fluxes that determine the direction and extent of natural processes. The branch of physical science that deals with such matters is thermo-dynamics, an abstract and demanding discipline that most biologists are content to skim over lightly. Yet bioenergetics is so shot through with concepts and quantitative relation-ships derived from thermodynamics that it is scarcely pos-sible to discuss the subject without frequent reference to free energy, potential, entropy, and the second law.
The purpose of this chapter is to collect and explain, as simply as possible, the fundamental thermodynamic concepts and relationships that recur throughout this book. Readers who prefer a more extensive treatment of the subject should consult either the introductory texts by Klotz (1967) and by Nicholls and Ferguson (1992) or the advanced texts by Morowitz (1978) and by Edsall and Gutfreund (1983).
Thermodynamics evolved during the nineteenth cen-tury out of efforts to understand how a steam engine works and why heat is produced when one bores a can-non. The very name “thermodynamics,” and much of the language of this science, recall these historical roots, but it would be more appropriate to speak of energetics, for the principles involved are universal. Living plants, like all other natural phenomena, are constrained by the laws of thermodynamics. By the same token, thermodynamics supplies an indispensable framework for the quantitative description of biological vitality.
energy and WorkLet us begin with the meanings of “energy” and “work.” Energy is defined in elementary physics, as in daily life, as the capacity to do work. The meaning of work is harder to come by and more narrow. Work, in the mechanical sense,
is the displacement of any body against an opposing force. The work done is the product of the force and the distance displaced, as expressed in the following equation:*
W = f ∆ (A1.1)
Mechanical work appears in chemistry because when-ever the final volume of a reaction mixture exceeds the initial volume, work must be done against the pressure of the atmosphere; conversely, the atmosphere performs work when a system contracts. This work is calculated by the expression P∆V (where P stands for pressure and V for volume), a term that appears frequently in thermo-dynamic formulas. In biology, work is employed in a broader sense to describe displacement against any of the forces that liv-ing things encounter or generate: mechanical, electric, osmotic, or even chemical potential.
A familiar mechanical illustration may help clarify the relationship of energy to work. The spring in FiGURe A1.1 can be extended if force is applied to it over a particular distance—that is, if work is done on the spring. This work can be recovered by an appropriate arrangement of pul-leys and used to lift a weight onto the table. The extended spring can thus be said to possess energy that is numeri-cally equal to the work it can do on the weight (neglecting friction). The weight on the table, in turn, can be said to possess energy by virtue of its position in Earth’s gravita-tional field, which can be utilized to do other work, such as turning a crank. The weight thus illustrates the concept of potential energy, a capacity to do work that arises from the position of an object in a field of force, and the sequence as a whole illustrates the conversion of one kind of energy into another, or energy transduction.
The First Law: The total energy is always conserved
It is common experience that mechanical devices involve both the performance of work and the production or absorption of heat. We are at liberty to vary the amount of
Plant Physiology 5/E Taiz/ZeigerSinauer AssociatesMorales StudioFigure Appendix 01.01 Date 02-22-10
(A) (B) (C)
FiGURe A1.1 Energy and work in a mechanical sys-tem. (A) A weight resting on the floor is attached to a spring via a string. (B) Pulling on the spring places
the spring under tension. (C) The potential energy stored in the extended spring performs the work of raising the weight when the spring contracts.
* We may note in passing that the dimensions of work are complex—ml2t–2—where m denotes mass, l distance, and t time, and that work is a scalar quantity, that is, the product of two vectorial terms.
© 2015 Sinauer Associates, Inc. This material cannot be copied, reprouced, manufactured or disseminated in any form without express written permission from the publisher.

eneRGy And enzymeS A1–3
work done by the spring, up to a particular maximum, by using different weights, and the amount of heat produced will also vary. But much experimental work has shown that, under ideal circumstances, the sum of the work done and of the heat evolved is constant and depends only on the initial and final extensions of the spring. We can thus envisage a property, the internal energy of the spring, with the characteristic described by the following equation:
∆U = ∆Q + ∆W (A1.2)
Here Q is the amount of heat absorbed by the system, and W is the amount of work done on the system.* In Figure A1.1 the work is mechanical, but it could just as well be electrical, chemical, or any other kind of work. Thus ∆U is the net amount of energy put into the system, either as heat or as work; conversely, both the performance of work and the evolution of heat entail a decrease in the internal energy. We cannot specify an absolute value for the energy content; only changes in internal energy can be measured. Note that Equation A1.2 assumes that heat and work are equivalent; its purpose is to stress that, under ideal circum-stances, ∆U depends only on the initial and final states of the system, not on how heat and work are partitioned.
Equation A1.2 is a statement of the first law of thermo-dynamics, which is the principle of energy conservation. If a particular system exchanges no energy with its sur-roundings, its energy content remains constant; if energy is exchanged, the change in internal energy will be given by the difference between the energy gained from the sur-roundings and that lost to the surroundings. The change in internal energy depends only on the initial and final states of the system, not on the pathway or mechanism of energy exchange. Energy and work are interconvert-ible; even heat is a measure of the kinetic energy of the molecular constituents of the system. To put it as simply as possible, Equation A1.2 states that no machine, including the chemical machines that we recognize as living, can do work without an energy source.
An example of the application of the first law to a bio-logical phenomenon is the energy budget of a leaf. Leaves absorb energy from their surroundings in two ways: as direct incident irradiation from the sun and as infrared irradiation from the surroundings. Some of the energy absorbed by the leaf is radiated back to the surroundings as infrared irradiation and heat, while a fraction of the absorbed energy is stored, as either photosynthetic prod-ucts or leaf temperature changes. Thus we can write the following equation:
Total energy absorbed by leaf = energy emitted from leaf + energy stored by leaf
Note that although the energy absorbed by the leaf has been transformed, the total energy remains the same, in accordance with the first law.
The change in the internal energy of a system represents the maximum work it can do
We must qualify the equivalence of energy and work by invoking “ideal conditions”—that is, by requiring that the process be carried out reversibly. The meaning of “revers-ible” in thermodynamics is a special one: The term describes conditions under which the opposing forces are so nearly balanced that an infinitesimal change in one or the other would reverse the direction of the process.* Under these circumstances the process yields the maximum possible amount of work. Reversibility in this sense does not often hold in nature, as in the example of the leaf. Ideal condi-tions differ so little from a state of equilibrium that any process or reaction would require infinite time and would therefore not take place at all. Nonetheless, the concept of thermodynamic reversibility is useful: If we measure the change in internal energy that a process entails, we have an upper limit to the work that it can do; for any real process the maximum work will be less.
In the study of plant biology we encounter several sources of energy—notably light and chemical transfor-mations—as well as a variety of work functions, includ-ing mechanical, osmotic, electrical, and chemical work. The meaning of the first law in biology stems from the certainty, painstakingly achieved by nineteenth-century physicists, that the various kinds of energy and work are measurable, equivalent, and, within limits, interconvert-ible. Energy is to biology what money is to economics: the means by which living things purchase useful goods and services.
Each type of energy is characterized by a capacity factor and a potential factor
The amount of work that can be done by a system, whether mechanical or chemical, is a function of the size of the sys-tem. Work can always be defined as the product of two factors—force and distance, for example. One is a potential or intensity factor, which is independent of the size of the system; the other is a capacity factor and is directly propor-tional to the size (Table A1.1).
In biochemistry, energy and work have traditionally been expressed in calories; 1 calorie is the amount of heat required to raise the temperature of 1 g of water by 1ºC, * Equation A1.2 is more commonly encountered in the form
∆U = ∆Q – ∆W, which results from the convention that Q is the amount of heat absorbed by the system from the surroundings and W is the amount of work done by the system on the surroundings. This convention affects the sign of W but does not alter the meaning of the equation.
*In biochemistry, reversibility has a different meaning: Usually the term refers to a reaction whose pathway can be reversed, often with an input of energy.
© 2015 Sinauer Associates, Inc. This material cannot be copied, reprouced, manufactured or disseminated in any form without express written permission from the publisher.
A1–4 Appendix i
specifically, from 15.0 to 16.0°C . In principle, one can carry out the same process by doing the work mechanically with a paddle; such experiments led to the establishment of the mechanical equivalent of heat as 4.186 joules per calorie (J cal–1).* We will also have occasion to use the equivalent electrical units, based on the volt: A volt is the potential dif-ference between two points when 1 J of work is involved in the transfer of a coulomb of charge from one point to another. (A coulomb is the amount of charge carried by a current of 1 ampere [A] flowing for 1 s. Transfer of 1 mole [mol] of charge across a potential of 1 volt [V] involves 96,500 J of energy or work.) The difference between energy and work is often a matter of the sign. Work must be done to bring a positive charge closer to another positive charge, but the charges thereby acquire potential energy, which in turn can do work.
The direction of Spontaneous processesLeft to themselves, events in the real world take a predict-able course. The apple falls from the branch. A mixture of hydrogen and oxygen gases is converted into water. The fly trapped in a bottle is doomed to perish, the pyramids to crumble into sand; things fall apart. But there is nothing in the principle of energy conservation that forbids the apple to return to its branch with absorption of heat from the surroundings or that prevents water from dissociating into its constituent elements in a like manner. The search for the reason that neither of these things ever happens led to pro-found philosophical insights and generated useful quanti-tative statements about the energetics of chemical reactions and the amount of work that can be done by them. Since living things are in many respects chemical machines, we must examine these matters in some detail.
The Second Law: The total entropy always increases
From daily experience with weights falling and warm bodies growing cold, one might expect spontaneous pro-cesses to proceed in the direction that lowers the internal energy—that is, the direction in which ∆U is negative. But there are too many exceptions for this to be a general rule. The melting of ice is one exception: An ice cube placed in water at 1°C will melt, yet measurements show that liquid water (at any temperature above 0°C) is in a state of higher energy than ice; evidently, some spontaneous processes are accompanied by an increase in internal energy. Our melting ice cube does not violate the first law, for heat is
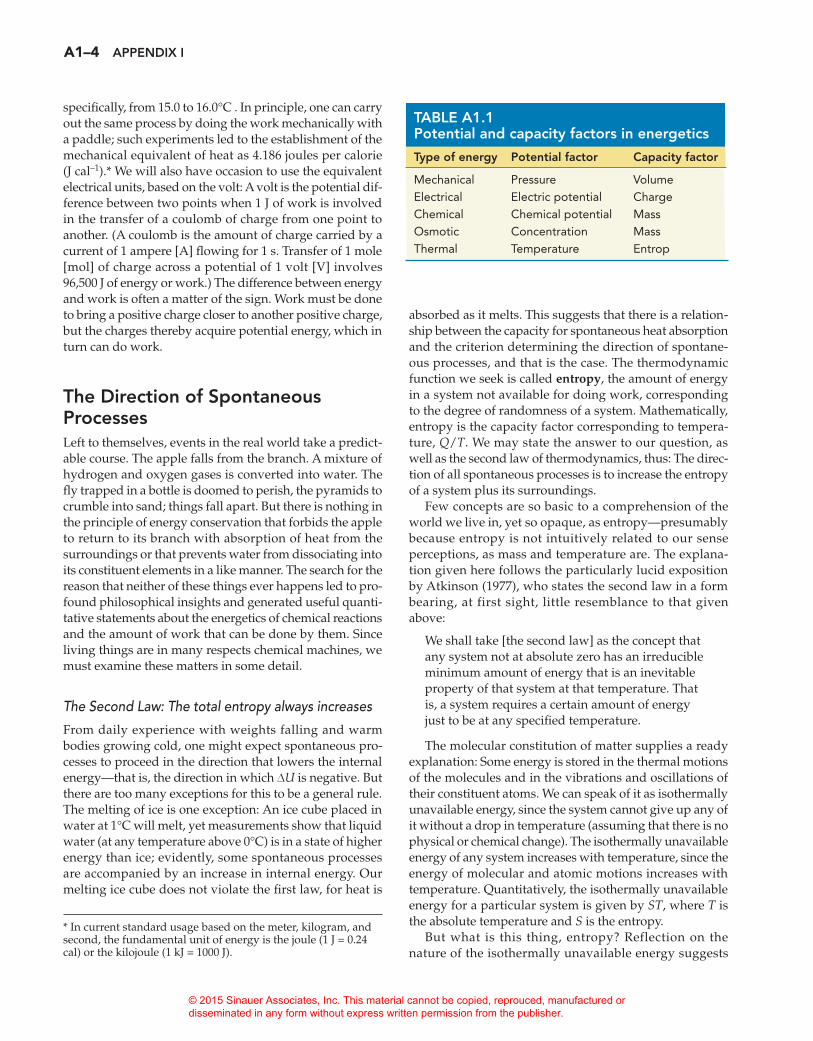
TABLe A1.1potential and capacity factors in energetics
Type of energy potential factor Capacity factor
Mechanical Pressure VolumeElectrical Electric potential ChargeChemical Chemical potential MassOsmotic Concentration MassThermal Temperature Entrop
* In current standard usage based on the meter, kilogram, and second, the fundamental unit of energy is the joule (1 J = 0.24 cal) or the kilojoule (1 kJ = 1000 J).
absorbed as it melts. This suggests that there is a relation-ship between the capacity for spontaneous heat absorption and the criterion determining the direction of spontane-ous processes, and that is the case. The thermodynamic function we seek is called entropy, the amount of energy in a system not available for doing work, corresponding to the degree of randomness of a system. Mathematically, entropy is the capacity factor corresponding to tempera-ture, Q/T. We may state the answer to our question, as well as the second law of thermodynamics, thus: The direc-tion of all spontaneous processes is to increase the entropy of a system plus its surroundings.
Few concepts are so basic to a comprehension of the world we live in, yet so opaque, as entropy—presumably because entropy is not intuitively related to our sense perceptions, as mass and temperature are. The explana-tion given here follows the particularly lucid exposition by Atkinson (1977), who states the second law in a form bearing, at first sight, little resemblance to that given above:
We shall take [the second law] as the concept that any system not at absolute zero has an irreducible minimum amount of energy that is an inevitable property of that system at that temperature. That is, a system requires a certain amount of energy just to be at any specified temperature.
The molecular constitution of matter supplies a ready explanation: Some energy is stored in the thermal motions of the molecules and in the vibrations and oscillations of their constituent atoms. We can speak of it as isothermally unavailable energy, since the system cannot give up any of it without a drop in temperature (assuming that there is no physical or chemical change). The isothermally unavailable energy of any system increases with temperature, since the energy of molecular and atomic motions increases with temperature. Quantitatively, the isothermally unavailable energy for a particular system is given by ST, where T is the absolute temperature and S is the entropy.
But what is this thing, entropy? Reflection on the nature of the isothermally unavailable energy suggests
© 2015 Sinauer Associates, Inc. This material cannot be copied, reprouced, manufactured or disseminated in any form without express written permission from the publisher.
eneRGy And enzymeS A1–5
that, for any particular temperature, the amount of such energy will be greater the more atoms and molecules are free to move and to vibrate—that is, the more chaotic is the system. By contrast, the orderly array of atoms in a crystal, with a place for each and each in its place, corre-sponds to a state of low entropy. At absolute zero, when all motion ceases, the entropy of a pure substance is like-wise zero; this statement is sometimes called the third law of thermodynamics.
A large molecule, a protein for example, within which many kinds of motion can take place, will have consider-able amounts of energy stored in this fashion—more than would, say, an amino acid molecule. But the entropy of the protein molecule will be less than that of the constituent amino acids into which it can dissociate, because of the constraints placed on the motions of those amino acids as long as they are part of the larger structure. Any process leading to the release of these constraints increases free-dom of movement, and hence entropy.
This is the universal tendency of spontaneous pro-cesses as expressed in the second law; it is why the costly enzymes stored in the refrigerator tend to decay and why ice melts into water. The increase in entropy as ice melts into water is “paid for” by the absorption of heat from the surroundings. As long as the net change in entropy of the system plus its surroundings is positive, the process can take place spontaneously. That does not necessarily mean that the process will take place: The rate is usually determined by kinetic factors separate from the entropy change. All the second law mandates is that the fate of the pyramids is to crumble into sand, while the sand will never reassemble itself into a pyra-mid; the law does not tell how quickly this must come about.
A process is spontaneous if ∆S for the system and its surroundings is positive
There is nothing mystical about entropy; it is a thermody-namic quantity like any other, measurable by experiment and expressed in entropy units. One method of quantify-ing it is through the heat capacity of a system, the amount of energy required to raise the temperature by 1°C. In some cases the entropy can even be calculated from theoretical principles, though only for simple molecules. For our purposes, what matters is the sign of the entropy change, ∆S: A process can take place spontaneously when ∆S for the system and its surroundings is positive; a process for which ∆S is negative cannot take place spontaneously, but the opposite process can; and for a system at equilibrium, the entropy of the system plus its surroundings is maximal and ∆S is zero.
“Equilibrium” is another of those familiar words that is easier to use than to define. Its everyday meaning implies
that the forces acting on a system are equally balanced, such that there is no net tendency to change; this is the sense in which the term “equilibrium” will be used here. A mixture of chemicals may be in the midst of rapid inter-conversion, but if the rates of the forward reaction and the backward reaction are equal, there will be no net change in composition, and equilibrium will prevail.
The second law has been stated in many versions. One version forbids perpetual-motion machines: Because energy is, by the second law, perpetually degraded into heat and rendered isothermally unavailable (∆S > 0), con-tinued motion requires an input of energy from the outside. The most celebrated yet perplexing version of the second law was provided by R. J. Clausius (1879): “The energy of the universe is constant; the entropy of the universe tends towards a maximum.”
How can entropy increase forever, created out of noth-ing? The root of the difficulty is verbal, as Klotz (1967) neatly explains. Had Clausius defined entropy with the opposite sign (corresponding to order rather than to chaos), its universal tendency would be to diminish; it would then be obvious that spontaneous changes proceed in the direc-tion that decreases the capacity for further spontaneous change. Solutes diffuse from a region of higher concen-tration to one of lower concentration; heat flows from a warm body to a cold one. Sometimes these changes can be reversed by an outside agent to reduce the entropy of the system under consideration, but then that external agent must change in such a way as to reduce its own capacity for further change. In sum, “entropy is an index of exhaus-tion; the more a system has lost its capacity for spontane-ous change, the more this capacity has been exhausted, the greater is the entropy” (Klotz 1967). Conversely, the farther a system is from equilibrium, the greater is its capacity for change and the less its entropy. Living things fall into the latter category: A cell is the epitome of a state that is remote from equilibrium.
Free energy and Chemical potentialMany energy transactions that take place in living organ-isms are chemical; we therefore need a quantitative expression for the amount of work a chemical reaction can do. For this purpose, relationships that involve the entropy change in the system plus its surroundings are unsuitable. We need a function that does not depend on the surroundings but that, like ∆S, attains a minimum under conditions of equilibrium and so can serve both as a criterion of the feasibility of a reaction and as a mea-sure of the energy available from it for the performance of work. The function universally employed for this pur-pose is free energy, abbreviated G in honor of the nine-teenth-century physical chemist J. Willard Gibbs, who first introduced it.
© 2015 Sinauer Associates, Inc. This material cannot be copied, reprouced, manufactured or disseminated in any form without express written permission from the publisher.

A1–6 Appendix i
∆G is negative for a spontaneous process at constant temperature and pressureEarlier we spoke of the isothermally unavailable energy, ST. Free energy is defined as the energy that is available under isothermal conditions, and by the following relationship:
∆H = ∆G + T∆S (A1.3)
The term H, enthalpy or heat content, is not quite equiva-lent to U, the internal energy (see Equation A1.2). To be exact, ∆H is a measure of the total energy change, includ-ing work that may result from changes in volume dur-ing the reaction, whereas ∆U excludes this work. (We will return to the concept of enthalpy a little later.) However, in the biological context we are usually concerned with reac-tions in solution, for which volume changes are negligible. For most purposes, then,
∆U ≅∆G + T∆S (A1.4)
and
∆G ≅∆U – T∆S (A1.5)
What makes this a useful relationship is the demonstration that for all spontaneous processes at constant temperature and pressure, ∆G is negative. The change in free energy is thus a criterion of feasibility. Any chemical reaction that proceeds with a negative ∆G can take place spontaneously; a process for which ∆G is positive cannot take place, but the reaction can go in the opposite direction; and a reaction for which ∆G is zero is at equilibrium, and no net change will occur. For a given temperature and pressure, ∆G depends only on the composition of the reaction mixture; hence the alterna-tive term “chemical potential” is particularly apt. Again, nothing is said about rate, only about direction. Whether a reaction having a given ∆G will proceed, and at what rate, is determined by kinetic rather than thermodynamic factors.
There is a close and simple relationship between the change in free energy of a chemical reaction and the work that the reaction can do. Provided the reaction is carried out reversibly,
∆G = ∆Wmax (A1.6)
That is, for a reaction taking place at constant temperature and pressure, –∆G is a measure of the maximum work the process can perform. More precisely, –∆G is the maximum work possible, exclusive of pressure–volume work, and thus is a quantity of great importance in bioenergetics. Any process going toward equilibrium can, in principle, do work. We can therefore describe processes for which ∆G is negative as “energy-releasing,” or exergonic. Con-versely, for any process moving away from equilibrium, ∆G is positive, and we speak of an “energy-consuming,” or endergonic, reaction. Of course, an endergonic reaction cannot occur: All real processes go toward equilibrium, with a negative ∆G. The concept of endergonic reactions
is nevertheless a useful abstraction, for many biological reactions appear to move away from equilibrium. A prime example is the synthesis of ATP during oxidative phos-phorylation, whose apparent ∆G is as high as 67 kJ mol–1 (16 kcal mol–1). Clearly, the cell must do work to render the reaction exergonic overall. The occurrence of an ender-gonic process in nature thus implies that it is coupled to a second, exergonic process. Much of cellular and molecular bioenergetics is concerned with the mechanisms by which energy coupling is effected.
The standard free-energy change, ∆G0, is the change in free energy when the concentration of reactants and products is 1 M
Changes in free energy can be measured experimentally by calorimetric methods. They have been tabulated in two forms: as the free energy of formation of a compound from its elements, and as ∆G for a particular reaction. It is of the utmost importance to remember that, by convention, the numerical values refer to a particular set of conditions. The standard free-energy change, ∆G0, refers to conditions such that all reactants and products are present at a concentration of 1 M; in biochemistry it is more convenient to employ ∆G0′, which is defined in the same way except that the pH is taken to be 7. The conditions obtained in the real world are likely to be very different from these, particularly with respect to the concentrations of the participants. To take a familiar example, ∆G0′ for the hydrolysis of ATP is about –33 kJ mol–1 (–8 kcal mol–1). In the cytoplasm, however, the actual nucleotide concentrations are approximately 3 mM ATP, 1 mM ADP, and 10 mM Pi. As we will see, changes in free energy depend strongly on concentrations, and ∆G for ATP hydrolysis under physiological conditions thus is much more negative than ∆G0′, about –50 to –65 kJ mol–1 (–12 to –15 kcal mol–1). Thus, whereas values of ∆G0′ for many reactions are easily accessible, they must not be used uncritically as guides to what happens in cells.
The value of ∆G is a function of the displacement of the reaction from equilibrium
The preceding discussion of free energy shows that there must be a relationship between ∆G and the equilibrium constant of a reaction: At equilibrium, ∆G is zero, and the farther a reaction is from equilibrium, the larger ∆G is and the more work the reaction can do. The quantitative state-ment of this relationship is
∆G0 = –RT ln K = –2.3RT log K (A1.7)
where R is the gas constant, T the absolute temperature, and K the equilibrium constant of the reaction. This equation is one of the most useful links between thermodynamics and biochemistry and has a host of applications. For example, the equation is easily modified to allow computation of the
© 2015 Sinauer Associates, Inc. This material cannot be copied, reprouced, manufactured or disseminated in any form without express written permission from the publisher.
eneRGy And enzymeS A1–7
change in free energy for concentrations other than the stan-dard ones. For the reactions shown in the equation
A B C+D+ ↔ (A1.8)
the actual change in free energy, ∆G, is given by the equation
Δ ΔG G RT= +0 C D
[A][B]ln [ ][ ]
(A1.9)
where the terms in brackets refer to the concentrations at the time of the reaction. Strictly speaking, one should use activities, but these are usually not known for cellular con-ditions, so concentrations must do.
Equation A1.9 can be rewritten to make its import a little plainer. Let q stand for the mass:action ratio, [C][D]/[A][B]. Substitution of Equation A1.7 into Equation A1.9, followed by rearrangement, then yields the following equation:
ΔG RT
Kq
= −2 3. log (A1.10)
In other words, the value of ∆G is a function of the dis-placement of the reaction from equilibrium. In order to displace a system from equilibrium, work must be done on it and ∆G must be positive. Conversely, a system dis-placed from equilibrium can do work on another system, provided that the kinetic parameters allow the reaction to proceed and a mechanism exists that couples the two systems. Quantitatively, a reaction mixture at 25°C whose composition is one order of magnitude away from equilib-rium (log K/q = 1) corresponds to a free-energy change of 5.7 kJ mol–1 (1.36 kcal mol–1). The value of ∆G is negative if the actual mass:action ratio is less than the equilibrium ratio and positive if the mass:action ratio is greater.
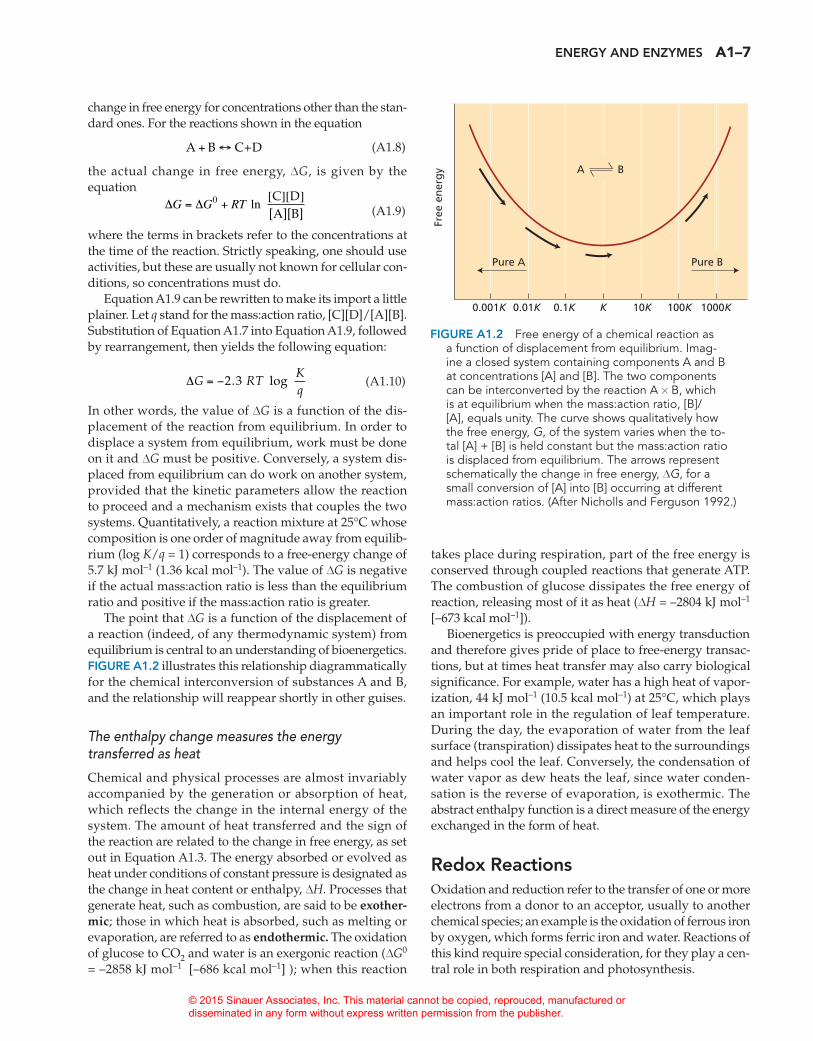
The point that ∆G is a function of the displacement of a reaction (indeed, of any thermodynamic system) from equilibrium is central to an understanding of bioenergetics. FiGURe A1.2 illustrates this relationship diagrammatically for the chemical interconversion of substances A and B, and the relationship will reappear shortly in other guises.
The enthalpy change measures the energy transferred as heat
Chemical and physical processes are almost invariably accompanied by the generation or absorption of heat, which reflects the change in the internal energy of the system. The amount of heat transferred and the sign of the reaction are related to the change in free energy, as set out in Equation A1.3. The energy absorbed or evolved as heat under conditions of constant pressure is designated as the change in heat content or enthalpy, ∆H. Processes that generate heat, such as combustion, are said to be exother-mic; those in which heat is absorbed, such as melting or evaporation, are referred to as endothermic. The oxidation of glucose to CO2 and water is an exergonic reaction (∆G0 = –2858 kJ mol–1 [–686 kcal mol–1] ); when this reaction
takes place during respiration, part of the free energy is conserved through coupled reactions that generate ATP. The combustion of glucose dissipates the free energy of reaction, releasing most of it as heat (∆H = –2804 kJ mol–1 [–673 kcal mol–1]).
Bioenergetics is preoccupied with energy transduction and therefore gives pride of place to free-energy transac-tions, but at times heat transfer may also carry biological significance. For example, water has a high heat of vapor-ization, 44 kJ mol–1 (10.5 kcal mol–1) at 25°C, which plays an important role in the regulation of leaf temperature. During the day, the evaporation of water from the leaf surface (transpiration) dissipates heat to the surroundings and helps cool the leaf. Conversely, the condensation of water vapor as dew heats the leaf, since water conden-sation is the reverse of evaporation, is exothermic. The abstract enthalpy function is a direct measure of the energy exchanged in the form of heat.
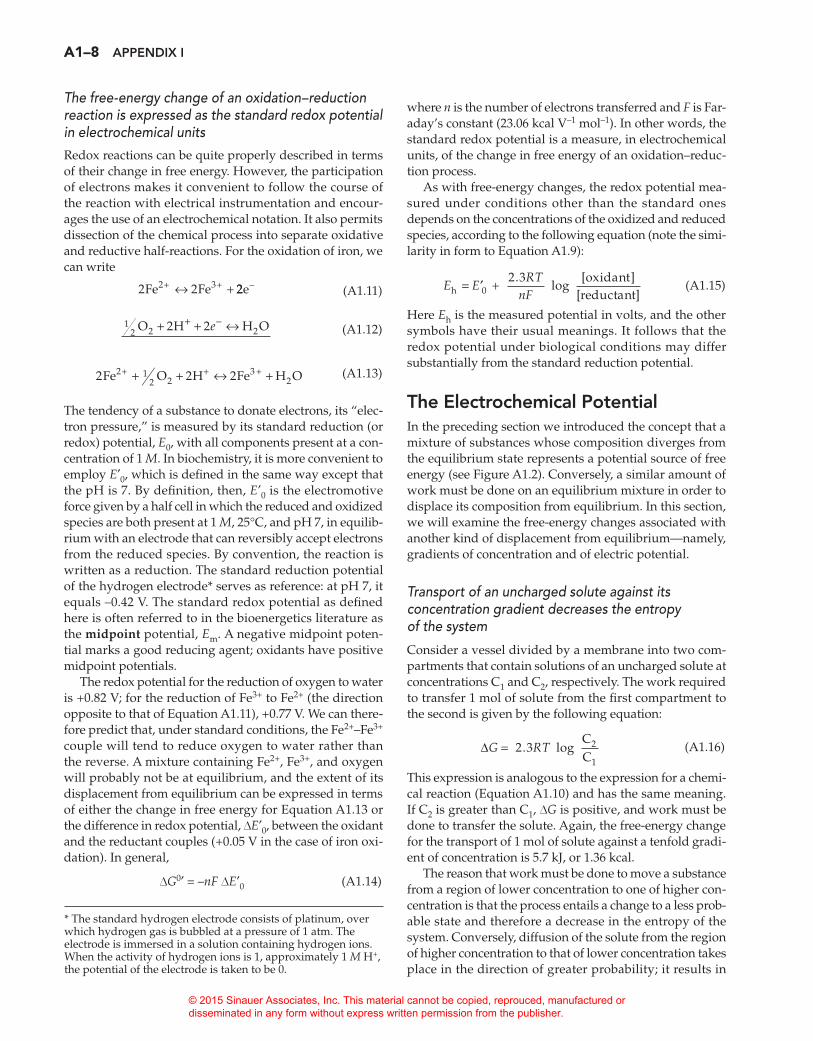
Redox ReactionsOxidation and reduction refer to the transfer of one or more electrons from a donor to an acceptor, usually to another chemical species; an example is the oxidation of ferrous iron by oxygen, which forms ferric iron and water. Reactions of this kind require special consideration, for they play a cen-tral role in both respiration and photosynthesis.
Plant Physiology 5/E Taiz/ZeigerSinauer AssociatesMorales StudioFigure Appendix 01.02 Date 02-22-10
A
Pure A Pure B
B
Free
en
erg
y
0.1K K 10K 100K 1000K0.01K0.001K
FiGURe A1.2 Free energy of a chemical reaction as a function of displacement from equilibrium. Imag-ine a closed system containing components A and B at concentrations [A] and [B]. The two components can be interconverted by the reaction A × B, which is at equilibrium when the mass:action ratio, [B]/[A], equals unity. The curve shows qualitatively how the free energy, G, of the system varies when the to-tal [A] + [B] is held constant but the mass:action ratio is displaced from equilibrium. The arrows represent schematically the change in free energy, ∆G, for a small conversion of [A] into [B] occurring at different mass:action ratios. (After Nicholls and Ferguson 1992.)
© 2015 Sinauer Associates, Inc. This material cannot be copied, reprouced, manufactured or disseminated in any form without express written permission from the publisher.
A1–8 Appendix i
The free-energy change of an oxidation–reduction reaction is expressed as the standard redox potential in electrochemical units
Redox reactions can be quite properly described in terms of their change in free energy. However, the participation of electrons makes it convenient to follow the course of the reaction with electrical instrumentation and encour-ages the use of an electrochemical notation. It also permits dissection of the chemical process into separate oxidative and reductive half-reactions. For the oxidation of iron, we can write
Fe Fe2+ 3+2 2↔ + 22e– (A1.11)
1
2 22 2O H H O2+ –+ + ↔e
(A1.12)
2Fe O H Fe H O2+
2+ 3 ++ + ↔ +1
2 22 2
(A1.13)
The tendency of a substance to donate electrons, its “elec-tron pressure,” is measured by its standard reduction (or redox) potential, E0, with all components present at a con-centration of 1 M. In biochemistry, it is more convenient to employ E′0, which is defined in the same way except that the pH is 7. By definition, then, E′0 is the electromotive force given by a half cell in which the reduced and oxidized species are both present at 1 M, 25°C, and pH 7, in equilib-rium with an electrode that can reversibly accept electrons from the reduced species. By convention, the reaction is written as a reduction. The standard reduction potential of the hydrogen electrode* serves as reference: at pH 7, it equals –0.42 V. The standard redox potential as defined here is often referred to in the bioenergetics literature as the midpoint potential, Em. A negative midpoint poten-tial marks a good reducing agent; oxidants have positive midpoint potentials.
The redox potential for the reduction of oxygen to water is +0.82 V; for the reduction of Fe3+ to Fe2+ (the direction opposite to that of Equation A1.11), +0.77 V. We can there-fore predict that, under standard conditions, the Fe2+–Fe3+ couple will tend to reduce oxygen to water rather than the reverse. A mixture containing Fe2+, Fe3+, and oxygen will probably not be at equilibrium, and the extent of its displacement from equilibrium can be expressed in terms of either the change in free energy for Equation A1.13 or the difference in redox potential, ∆E′0, between the oxidant and the reductant couples (+0.05 V in the case of iron oxi-dation). In general,
∆G0′ = –nF ∆E′0 (A1.14)
where n is the number of electrons transferred and F is Far-aday’s constant (23.06 kcal V–1 mol–1). In other words, the standard redox potential is a measure, in electrochemical units, of the change in free energy of an oxidation–reduc-tion process.
As with free-energy changes, the redox potential mea-sured under conditions other than the standard ones depends on the concentrations of the oxidized and reduced species, according to the following equation (note the simi-larity in form to Equation A1.9):
E E
RTnFh
oxidant[reductant]
= ′ +02 3.
log[ ]
(A1.15)
Here Eh is the measured potential in volts, and the other symbols have their usual meanings. It follows that the redox potential under biological conditions may differ substantially from the standard reduction potential.
The electrochemical potentialIn the preceding section we introduced the concept that a mixture of substances whose composition diverges from the equilibrium state represents a potential source of free energy (see Figure A1.2). Conversely, a similar amount of work must be done on an equilibrium mixture in order to displace its composition from equilibrium. In this section, we will examine the free-energy changes associated with another kind of displacement from equilibrium—namely, gradients of concentration and of electric potential.
Transport of an uncharged solute against its concentration gradient decreases the entropy of the system
Consider a vessel divided by a membrane into two com-partments that contain solutions of an uncharged solute at concentrations C1 and C2, respectively. The work required to transfer 1 mol of solute from the first compartment to the second is given by the following equation:
∆G RT=
CC
2
12 3. log (A1.16)
This expression is analogous to the expression for a chemi-cal reaction (Equation A1.10) and has the same meaning. If C2 is greater than C1, ∆G is positive, and work must be done to transfer the solute. Again, the free-energy change for the transport of 1 mol of solute against a tenfold gradi-ent of concentration is 5.7 kJ, or 1.36 kcal.
The reason that work must be done to move a substance from a region of lower concentration to one of higher con-centration is that the process entails a change to a less prob-able state and therefore a decrease in the entropy of the system. Conversely, diffusion of the solute from the region of higher concentration to that of lower concentration takes place in the direction of greater probability; it results in
* The standard hydrogen electrode consists of platinum, over which hydrogen gas is bubbled at a pressure of 1 atm. The electrode is immersed in a solution containing hydrogen ions. When the activity of hydrogen ions is 1, approximately 1 M H+, the potential of the electrode is taken to be 0.
© 2015 Sinauer Associates, Inc. This material cannot be copied, reprouced, manufactured or disseminated in any form without express written permission from the publisher.

eneRGy And enzymeS A1–9
an increase in the entropy of the system and can proceed spontaneously. The sign of ∆G becomes negative, and the process can do the amount of work specified by Equation A1.16, provided a mechanism exists that couples the exer-gonic diffusion process to the work function.
The membrane potential is the work that must be done to move an ion from one side of the membrane to the other
Matters become a little more complex if the solute in ques-tion bears an electric charge. Transfer of positively charged solute from compartment 1 to compartment 2 will then cause a difference in charge to develop across the membrane, the second compartment becoming electropositive relative to the first. Since like charges repel one another, the work done by the agent that moves the solute from compartment 1 to compartment 2 is a function of the charge difference; more precisely, it depends on the difference in electric potential across the membrane. This difference, called membrane potential for short, will appear again in later pages.
The membrane potential, ∆E,* is defined as the work that must be done by an agent to move a test charge from one side of the membrane to the other. When 1 J of work must be done to move 1 coulomb of charge, the potential difference is said to be 1 V. The absolute electric potential of any sin-gle phase cannot be measured, but the potential difference between two phases can be. By convention, the membrane potential is always given in reference to the movement of a positive charge. It states the intracellular potential relative to the extracellular one, which is defined as zero.The work that must be done to move 1 mol of an ion against a membrane potential of ∆E volts is given by the following equation:
∆G = zF ∆E (A1.17)
where z is the valence of the ion and F is Faraday’s con-stant. The value of ∆G for the transfer of cations into a positive compartment is positive and so calls for work. Conversely, the value of ∆G is negative when cations move into the negative compartment, so work can be done. The electric potential is negative across the plasma membrane of the great majority of cells; therefore cations tend to leak in but have to be “pumped” out.
The electrochemical-potential difference, ∆µ~,
includes both concentration and electric potentials
In general, ions moving across a membrane are subject to gradients of both concentration and electric potential. Con-
sider, for example, the situation depicted in FiGURe A1.3, which corresponds to a major event in energy transduction during photosynthesis. A cation of valence z moves from compartment 1 to compartment 2, against both a concen-tration gradient (C2 > C1) and a gradient of membrane elec-tric potential (compartment 2 is electropositive relative to compartment 1). The free-energy change involved in this transfer is given by the following equation:
∆ ∆G zF E RT= +
CC
2
12 3. log
(A1.18)
∆G is positive, and the transfer can proceed only if coupled to a source of energy, in this instance the absorption of light. As a result of this transfer, cations in compartment 2 can be said to be at a higher electrochemical potential than the same ions in compartment 1.
The electrochemical potential for a particular ion is designated µ~ion. Ions tend to flow from a region of high electrochemical potential to one of low potential and in so doing can in principle do work. The maximum amount of this work, neglecting friction, is given by the change in free energy of the ions that flow from compartment 2 to com-partment 1 (see Equation A1.6) and is numerically equal to the electrochemical-potential difference, ∆µ~ion. This prin-ciple underlies much of biological energy transduction.
The electrochemical-potential difference, ∆µ~ion, is prop-erly expressed in kilojoules per mole or kilocalories per mole. However, it is frequently convenient to express the driving force for ion movement in electrical terms, with the dimensions of volts or millivolts. To convert ∆µ~ion into mil-livolts (mV), divide all the terms in Equation A1.18 by F:
∆ ∆
˜ .log
m ion 2
1
CCF
z ERT
F= +
2 3 (A1.19)
Plant Physiology 5/E Taiz/ZeigerSinauer AssociatesMorales StudioFigure Appendix 03.03 Date 02-22-10
21
++
+
––
–
+
+
+
+ +
++
+++
++ +
+++
+
++
++
++
FiGURe A1.3 Transport against an electrochemical-potential gradient. The agent that moves the charged solute (from compartment 1 to compartment 2) must do work to overcome both the electrochemical-po-tential gradient and the concentration gradient. As a result, cations in compartment 2 have been raised to a higher electrochemical potential than those in com-partment 1. Neutralizing anions have been omitted.
* Many texts use the term ∆Y for the membrane potential difference. However, to avoid confusion with the use of ∆Y to indicate water potential (see Chapter 3), the term ∆E is used here and throughout the text.
© 2015 Sinauer Associates, Inc. This material cannot be copied, reprouced, manufactured or disseminated in any form without express written permission from the publisher.

A1–10 Appendix i
An important case in point is the proton motive force, which is considered at length in Chapter 6.
Equations A1.18 and A1.19 have proved to be of cen-tral importance in bioenergetics. First, they measure the amount of energy that must be expended on the active transport of ions and metabolites, a major function of bio-logical membranes. Second, since the free energy of chemi-cal reactions is often transduced into other forms via the intermediate generation of electrochemical-potential gra-dients, these gradients play a major role in descriptions of biological energy coupling. It should be emphasized that the electrical and concentration terms may be either added, as in Equation A1.18, or subtracted, and that the applica-tion of the equations to particular cases requires careful attention to the sign of the gradients. We should also note that free-energy changes in chemical reactions (see Equa-tion A1.10) are scalar, whereas transport reactions have direction; this is a subtle but critical aspect of the biological role of ion gradients.
Ion distribution at equilibrium is an important special case of the general electrochemical equation (Equation A1.18). FiGURe A1.4 shows a membrane-bound vesicle (compartment 2) that contains a high concentration of the salt K2SO4, surrounded by a medium (compartment 1) containing a lower concentration of the same salt; the membrane is impermeable to anions but allows the free passage of cations. Potassium ions will therefore tend to diffuse out of the vesicle into the solution, whereas the sul-fate anions are retained. Diffusion of the cations generates a membrane potential, with the vesicle interior negative, which restrains further diffusion. At equilibrium, ∆G and ∆µ~K+ equal zero (by definition). Equation A1.18 can then be arranged to give the following equation:
CC
2
1∆E
RTzF
= −2 3.log (A1.20)
where C2 and C1 are the concentrations of K+ ions in the two compartments; z, the valence, is unity; and ∆E is the membrane potential in equilibrium with the potassium concentration gradient.
This is one form of the celebrated Nernst equation. It states that at equilibrium, a permeant ion will be so distrib-uted across the membrane that the chemical driving force (outward in this instance) will be balanced by the electric driving force (inward). For a univalent cation at 25°C, each tenfold increase in concentration factor corresponds to a membrane potential of 59 mV; for a divalent ion the value is 29.5 mV.
The preceding discussion of the energetic and electrical consequences of ion translocation illustrates a point that must be clearly understood—namely, that an electric poten-tial across a membrane may arise by two distinct mecha-nisms. The first mechanism, illustrated in Figure A1.4, is the diffusion of charged particles down a preexisting concentra-tion gradient, an exergonic process. A potential generated
by such a process is described as a diffusion potential or as a Donnan potential. (Donnan potential is defined as the diffusion potential that occurs in the limiting case where the counterion is completely impermeant or fixed, as in Figure A1.4.) Many ions are unequally distributed across biologi-cal membranes and differ widely in their rates of diffusion across the barrier; therefore diffusion potentials always con-tribute to the observed membrane potential. But in most bio-logical systems the measured electric potential differs from the value that would be expected on the basis of passive ion diffusion. In these cases one must invoke electrogenic ion pumps, transport systems that carry out the exergonic pro-cess indicated in Figure A1.3 at the expense of an external energy source. Transport systems of this kind transduce the free energy of a chemical reaction into the electrochemical potential of an ion gradient and play a leading role in bio-logical energy coupling.
enzymes: The Catalysts of LifeProteins constitute about 30% of the total dry weight of typical plant cells. If we exclude inert materials, such as the cell wall and starch, which can account for up to 90% of the dry weight of some cells, proteins and amino acids represent about 60 to 70% of the dry weight of the living cell. As we saw in Chapter 1, cytoskeletal structures such as microtubules and microfilaments are composed of pro-tein. Proteins can also occur as storage forms, particularly in seeds. But the major function of proteins in metabolism is to serve as enzymes, biological catalysts that greatly increase the rates of biochemical reactions, making life possible. Enzymes participate in these reactions but are not themselves fundamentally changed in the process (Mathews and Van Holde 1996).
Plant Physiology 5/E Taiz/ZeigerSinauer AssociatesMorales StudioFigure Appendix 03.04 Date 02-22-10
21
–––
+++
+
+
++
+
+
+
++
+
++
++
++
+++
++
+
+
FiGURe A1.4 Generation of an electric potential by ion diffusion. Compartment 2 has a higher salt concentra-tion than compartment 1 (anions are not shown). If the membrane is permeable to the cations but not to the anions, the cations will tend to diffuse out of com-partment 2 into compartment 1, generating a mem-brane potential in which compartment 2 is negative.
© 2015 Sinauer Associates, Inc. This material cannot be copied, reprouced, manufactured or disseminated in any form without express written permission from the publisher.

eneRGy And enzymeS A1–11
Enzymes have been called the “agents of life”—a very apt term, since they control almost all life processes. A typical cell has several thousand different enzymes, which carry out a wide variety of actions. The most important fea-tures of enzymes are their specificity, which permits them to distinguish among very similar molecules, and their cata-lytic efficiency, which is far greater than that of ordinary catalysts. The stereospecificity of enzymes is remarkable, allowing them to distinguish not only between enantiom-ers (mirror-image stereoisomers), for example, but between apparently identical atoms or groups of atoms (Creighton 1983).
This ability to discriminate between similar molecules results from the fact that the first step in enzyme catalysis is the formation of a tightly bound, noncovalent complex between the enzyme and the substrate(s): the enzyme–substrate complex. Enzyme-catalyzed reactions exhibit unusual kinetic properties that are also related to the formation of these very specific complexes. Another dis-tinguishing feature of enzymes is that they are subject to various kinds of regulatory control, ranging from subtle effects on the catalytic activity by effector molecules (inhib-itors or activators) to regulation of enzyme synthesis and destruction by the control of gene expression and protein turnover.
Enzymes are unique in the large rate enhancements they bring about, orders of magnitude greater than those effected by other catalysts. Typical orders of rate enhance-ments of enzyme-catalyzed reactions over the correspond-ing uncatalyzed reactions are 108 to 1012. Many enzymes will convert about a thousand molecules of substrate to product in 1 s. Some will convert as many as a million!
Unlike most other catalysts, enzymes function at ambi-ent temperature and atmospheric pressure and usually in a narrow pH range near neutrality (there are excep-tions; for instance, vacuolar proteases and ribonucleases are most active at pH 4 to 5). A few enzymes are able to function under extremely harsh conditions; examples are pepsin, the protein-degrading enzyme of the stomach, which has a pH optimum around 2.0, and the hydroge-nase of the hyperthermophilic (“extreme heat–loving”) archaebacterium Pyrococcus furiosus, which oxidizes H2 at a temperature optimum greater than 95°C (Bryant and Adams 1989). The presence of such remarkably heat-stable enzymes enables Pyrococcus to grow optimally at 100°C.
Enzymes are usually named after their substrates by the addition of the suffix “-ase”—for example, α-amylase, malate dehydrogenase, β-glucosidase, phosphoenolpyru-vate carboxylase, horseradish peroxidase. Many thou-sands of enzymes have already been discovered, and new ones are being found all the time. Each enzyme has been named in a systematic fashion, on the basis of the reaction it catalyzes, by the International Union of Biochemistry. In addition, many enzymes have common, or trivial, names.
Thus the common name rubisco refers to d-ribulose-1,5-bisphosphate carboxylase/oxygenase (EC 4.1.1.39*).
The versatility of enzymes reflects their properties as proteins. The nature of proteins permits both the exquisite recognition by an enzyme of its substrate and the catalytic apparatus necessary to carry out diverse and rapid chemi-cal reactions (Stryer 1995).
Proteins are chains of amino acids joined by peptide bonds
Proteins are composed of long chains of amino acids (FiG-URe A1.5) linked by amide bonds, known as peptide bonds (FiGURe A1.6). The 20 different amino acid side chains endow proteins with a large variety of groups that have different chemical and physical properties, including hydrophilic (polar, water-loving) and hydrophobic (non-polar, water-avoiding) groups, charged and neutral polar groups, and acidic and basic groups. This diversity, in con-junction with the relative flexibility of the peptide bond, allows for the tremendous variation in protein properties, ranging from the rigidity and inertness of structural pro-teins to the reactivity of hormones, catalysts, and receptors. The three-dimensional aspect of protein structure provides for precise discrimination in the recognition of ligands, the molecules that interact with proteins, as shown by the ability of enzymes to recognize their substrates and of anti-bodies to recognize antigens, for example.
All molecules of a particular protein have the same sequence of amino acid residues, determined by the sequence of nucleotides in the gene that codes for that pro-tein. Although the protein is synthesized as a linear chain on the ribosome, upon release it folds spontaneously into a specific three-dimensional shape, the native state. The chain of amino acids is called a polypeptide. The three-dimensional arrangement of the atoms in the molecule is referred to as the conformation. Changes in conformation do not involve breaking of covalent bonds. Denaturation involves the loss of this unique three-dimensional shape and results in the loss of catalytic activity.
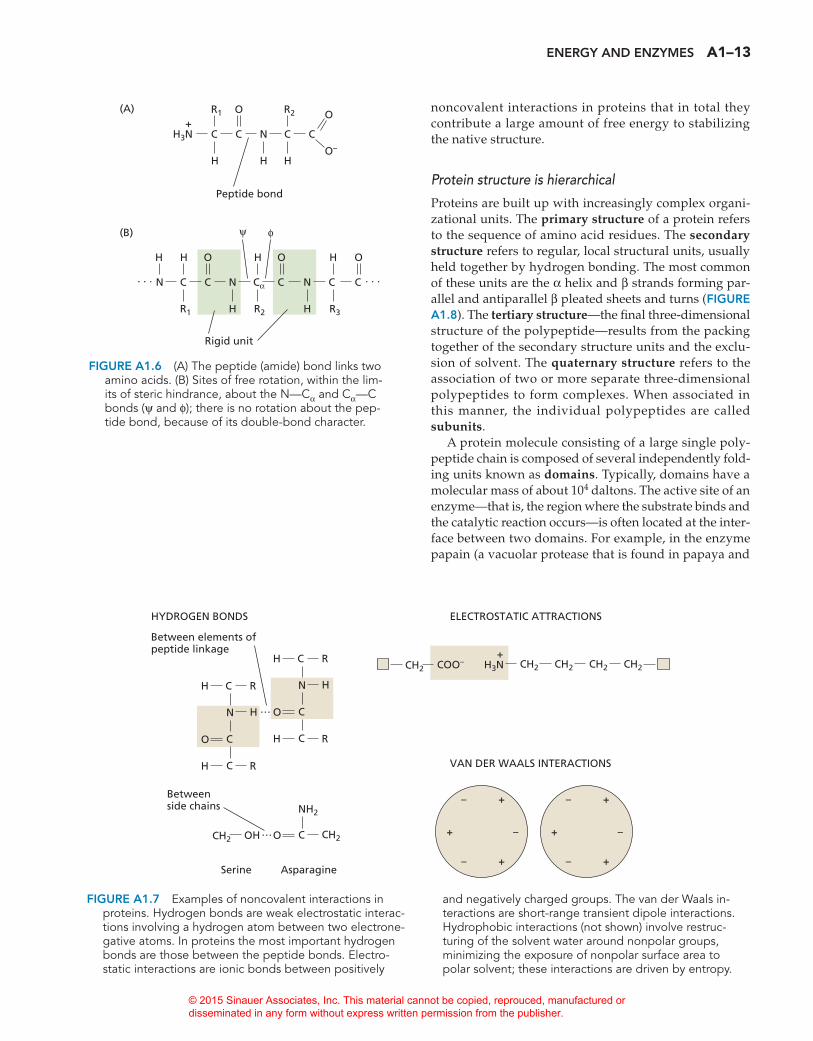
The forces that are responsible for the shape of a pro-tein molecule are noncovalent (FiGURe A1.7). These noncovalent interactions include hydrogen bonds; elec-trostatic interactions (also known as ionic bonds or salt bridges); van der Waals interactions (dispersion forces), which are transient dipoles between spatially close atoms; and hydrophobic “bonds”—the tendency of nonpolar groups to avoid contact with water and thus to associate with themselves. In addition, covalent disulfide bonds are found in many proteins. Although each of these types of noncovalent interaction is weak, there are so many
* The Enzyme Commission (EC) number indicates the class (4 = lyase) and subclasses (4.1 = carbon–carbon cleavage; 4.1.1 = cleavage of C—COO– bond).
© 2015 Sinauer Associates, Inc. This material cannot be copied, reprouced, manufactured or disseminated in any form without express written permission from the publisher.

A1–12 Appendix i
Plant Physiology 5/E Taiz/ZeigerSinauer AssociatesMorales StudioFigure Appendix 03.05 Date 02-22-10
C H
CH3
C H
CH
CH3H3C
C H
CH2
CH
CH3H3C
C H
C CH3H
CH2
CH3
CH2
C H
CH2
C H
NH
CH2
C H
CH2
CH3
S CH2
C H
SH
C H
H
CH
CH2
CH2H2C
CH2
C H CH2
C H
C
C H
COO-
C
C H
OH OH
CH3
H
H
HCH2
CH2N O O
CH2N
C H
OH
CH2
:NH
CH
HC
:N
H
CH2
C H
CH2
C H
CH2
CH2
CH2
CH2
CH2
CNH3
NH
NH2
H2N
CH2
C H CH2
C H
CH2
-COO
-COO
-COO
-COO
-COO
-COO
C
CH2
C
-COO
-COO
-COO
-COO
-COO
-COO
-COO
-COO
-COO-COO-COO
-COO
-COO-COO
-COO
H3N+
H3N+
H3N+
+
+
H3N+
H3N+
H3N+
H3N+
H3N+
H3N+
H3N+
H3N+
H3N+
H3N+
H3N+
H3N+
H3N+
H3N+
H3N+
H3N+
H2N+
Alanine [A](Ala)
Glycine [G](Gly)
Cysteine [C](Cys)
Methionine [M](Met)
Tryptophan [W](Trp)
Phenylalanine [F](Phe)
Proline [P](Pro)
Tyrosine [Y](Tyr)
Threonine [T](Thr)
Serine [S](Ser)
Glutamine [Q](Gln)
Asparagine [N](Asn)
Hydrophilic (polar) R groups
Neutral R groups
Hydrophobic (nonpolar) R groups
Glutamate [E](Glu)
Aspartate [D](Asp)
Histidine [H](His)
Arginine [R](Arg)
Lysine [K](Lys)
Acidic R groupsBasic R groups
Valine [V](Val)
Leucine [L](Leu)
Isoleucine [I](Ile)
FiGURe A1.5 The structures, names, single-letter codes (in square brackets), three-letter abbreviations, and classification of the amino acids.
© 2015 Sinauer Associates, Inc. This material cannot be copied, reprouced, manufactured or disseminated in any form without express written permission from the publisher.
eneRGy And enzymeS A1–13
noncovalent interactions in proteins that in total they contribute a large amount of free energy to stabilizing the native structure.
Protein structure is hierarchical
Proteins are built up with increasingly complex organi-zational units. The primary structure of a protein refers to the sequence of amino acid residues. The secondary structure refers to regular, local structural units, usually held together by hydrogen bonding. The most common of these units are the α helix and β strands forming par-allel and antiparallel β pleated sheets and turns (FiGURe A1.8). The tertiary structure—the final three-dimensional structure of the polypeptide—results from the packing together of the secondary structure units and the exclu-sion of solvent. The quaternary structure refers to the association of two or more separate three-dimensional polypeptides to form complexes. When associated in this manner, the individual polypeptides are called subunits.
A protein molecule consisting of a large single poly-peptide chain is composed of several independently fold-ing units known as domains. Typically, domains have a molecular mass of about 104 daltons. The active site of an enzyme—that is, the region where the substrate binds and the catalytic reaction occurs—is often located at the inter-face between two domains. For example, in the enzyme papain (a vacuolar protease that is found in papaya and
Plant Physiology 5/E Taiz/ZeigerSinauer AssociatesMorales StudioFigure Appendix 03.06 Date 02-22-10
H3N
R1 O O
O–
+R2
C
H H H
C N C C
N
H O HH O
C
R1 H R2
C N
H
NCα
H
R3
CC
O
C
φψ
. . . . . .
Rigid unit
Peptide bond
(A)
(B)
FiGURe A1.6 (A) The peptide (amide) bond links two amino acids. (B) Sites of free rotation, within the lim-its of steric hindrance, about the N—Cα and Cα—C bonds (ψ and φ); there is no rotation about the pep-tide bond, because of its double-bond character.
Plant Physiology 5/E Taiz/ZeigerSinauer AssociatesMorales StudioFigure Appendix 03.07 Date 02-22-10
–
–
+
+
+
–
–
–
+
+
+
–
VAN DER WAALS INTERACTIONS
ELECTROSTATIC ATTRACTIONSHYDROGEN BONDS
N
C
C
H
O
C R
H R
NH2
CH2
H
N
C
C
H
O
C R
H R
H
COCH2 OH
Between elements of peptide linkage
Betweenside chains
Serine Asparagine
CH2 CH2 CH2 CH2H3NCH2 COO–+
FiGURe A1.7 Examples of noncovalent interactions in proteins. Hydrogen bonds are weak electrostatic interac-tions involving a hydrogen atom between two electrone-gative atoms. In proteins the most important hydrogen bonds are those between the peptide bonds. Electro-static interactions are ionic bonds between positively
and negatively charged groups. The van der Waals in-teractions are short-range transient dipole interactions. Hydrophobic interactions (not shown) involve restruc-turing of the solvent water around nonpolar groups, minimizing the exposure of nonpolar surface area to polar solvent; these interactions are driven by entropy.
© 2015 Sinauer Associates, Inc. This material cannot be copied, reprouced, manufactured or disseminated in any form without express written permission from the publisher.

A1–14 Appendix i
Enzymes are highly specific protein catalysts
All enzymes are proteins, although recently some small ribonucleic acids and protein–RNA complexes have been found to exhibit enzymelike behavior in the processing of RNA. Proteins have molecular masses ranging from 104 to 106 daltons, and they may be a single folded poly-peptide chain (subunit, or protomer) or oligomers of sev-eral subunits (oligomers are usually dimers or tetram-
Plant Physiology 5/E Taiz/ZeigerSinauer AssociatesMorales StudioFigure Appendix 01.08 Date 03-10-10
C
C
C
C
N
N
H
H
H
H
O
R
RH
H
N
N CC
C O
O H
N
C
C
C
O
C
H
N
H
N
C
O
H
N
C
C
O
C
H
N
C
O
C
CO
CCO
HN
H
NC
C
O
H
NC
C
O
CCO
HN
CC
CN
N
C
H
O
C
C
H
O
CC
CN
N
C
H
O
C
C
H
O
CC
CN
N
C
H
O
C
C
H
O
CC
CN
N
C
H
O
C
C
H
O
NC
O
H
H
N
O
C
NC
O
H
H
N
O
C
NC
O
H
H
N
O
C
NC C
C
O
H
H
N
O
C
(A) Primary structure
(B) Secondary structure (α helix) (R groups not shown)
(C) Secondary structure (β pleated sheet) (R groups not shown)
(D) Tertiary structure (E) Quaternary structure
FiGURe A1.8 Hierarchy of protein structure. (A) Primary structure: peptide bond. (B and C) Secondary struc-ture: α helix (B) and antiparallelβpleated sheet (C). (D) Tertiary structure: α helices,βpleated sheets, and random coils. (E) Quaternary structure: four subunits.
is representative of a large class of plant thiol proteases), the active site lies at the junction of two domains (FiG-URe A1.9). Helices, turns, andβsheets contribute to the unique three-dimensional shape of this enzyme.
Determinations of the conformation of proteins have revealed that there are families of proteins that have com-mon three-dimensional folds, as well as common patterns of supersecondary structure, such as β-α-β.
© 2015 Sinauer Associates, Inc. This material cannot be copied, reprouced, manufactured or disseminated in any form without express written permission from the publisher.

eneRGy And enzymeS A1–15
ers). Normally, enzymes have only one type of catalytic activity associated with the same protein; isoenzymes, or isozymes, are enzymes with similar catalytic function that have different structures and catalytic parameters and are encoded by different genes. For example, various different isozymes have been found for peroxidase, an enzyme in plant cell walls that is involved in the synthesis of lignin. An isozyme of peroxidase has also been localized in vac-uoles. Isozymes may exhibit tissue specificity and show developmental regulation.
Enzymes frequently contain a nonprotein prosthetic group or cofactor that is necessary for biological activity. The association of a cofactor with an enzyme depends on the three-dimensional structure of the protein. Once bound to the enzyme, the cofactor contributes to the specificity of catalysis. Typical examples of cofactors are metal ions (e.g., zinc, iron, molybdenum), heme groups or iron–sulfur clus-ters (especially in oxidation–reduction enzymes), and coen-zymes (e.g., nicotinamide adenine dinucleotide [NAD+/NADH], flavin adenine dinucleotide [FAD/FADH2], flavin mononucleotide [FMN], and pyridoxal phosphate [PLP]). Coenzymes are usually vitamins or are derived from vita-mins and act as carriers. For example, NAD+ and FAD carry hydrogens and electrons in redox reactions, biotin carries CO2, and tetrahydrofolate carries one-carbon fragments. Peroxidase has both heme and Ca2+ prosthetic groups and is glycosylated; that is, it contains carbohydrates covalently added to asparagine, serine, or threonine side chains. Such proteins are called glycoproteins.
A particular enzyme will catalyze only one type of chemical reaction for only one class of molecule—in some cases, for only one particular compound. Enzymes are also
very stereospecific and produce no by-products. For exam-ple, β-glucosidase catalyzes the hydrolysis of β-glucosides, compounds formed by a glycosidic bond to d-glucose. The substrate must have the correct anomeric configuration: it must be β-, not α-. Furthermore, it must have the glu-cose structure; no other carbohydrates, such as xylose or mannose, can act as substrates for β-glucosidase. Finally, the substrate must have the correct stereochemistry, in this case the d absolute configuration. Rubisco (d-ribulose-1,5-bisphosphate carboxylase/oxygenase) catalyzes the addi-tion of carbon dioxide to d-ribulose 1,5-bisphosphate to form two molecules of 3-phospho-d-glycerate, the initial step in the C3 photosynthetic carbon reduction cycle, and is the world’s most abundant enzyme. Rubisco has very strict specificity for the carbohydrate substrate, but it also catalyzes an oxygenase reaction in which O2 replaces CO2, as is discussed further in Chapter 8.
Enzymes lower the free-energy barrier between substrates and products
Catalysts speed the rate of a reaction by lowering the energy barrier between substrates (reactants) and prod-ucts and are not themselves used up in the reaction, but are regenerated. Thus a catalyst increases the rate of a reaction but does not affect the equilibrium ratio of reactants and products, because the rates of the reaction in both direc-tions are increased to the same extent. It is important to realize that enzymes cannot make a nonspontaneous (ener-getically uphill) reaction occur. However, many energeti-cally unfavorable reactions in cells proceed because they are coupled to an energetically more favorable reaction usually involving ATP hydrolysis (FiGURe A1.10).
Plant Physiology 5/E Taiz/ZeigerSinauer AssociatesMorales StudioFigure Appendix 01.09 Date 02-22-10
Active-sitecleft
Domain 1 Domain 2Domain 1
FiGURe A1.9 The backbone structure of papain, showing the two domains and the active-site cleft between them.
Plant Physiology 5/E Taiz/ZeigerSinauer AssociatesMorales StudioFigure Appendix 01.10 Date 03-10-10
A + B C ΔG = +4.0 kcal mol–1
ATP + H2O ADP + Pi + H+ ΔG = –7.3 kcal mol–1
A + ATP A-P + ADP
A-P + B + H2O C + H+ + Pi
A + B + ATP + H2O C + ADP + Pi + H+ ΔG = –3.3 kcal mol–1
A + B + ATP + H2O C + ADP + Pi + H+
FiGURe A1.10 Coupling of the hydrolysis of ATP to drive an energetically unfavorable reaction. The reaction A + B → C is thermodynamically unfavorable, whereas the hydrolysis of ATP to form ADP and inorganic phos-phate (Pi) is thermodynamically very favorable (it has a large negative ∆G). Through appropriate intermedi-ates, such as A–P, the two reactions are coupled, yield-ing an overall reaction that is the sum of the individual reactions and has a favorable free-energy change.
© 2015 Sinauer Associates, Inc. This material cannot be copied, reprouced, manufactured or disseminated in any form without express written permission from the publisher.

A1–16 Appendix i
Enzymes act as catalysts because they lower the free energy of activation for a reaction. They do this by a com-bination of raising the ground state ∆G of the substrate and lowering the ∆G of the transition state of the reaction, thereby decreasing the barrier against the reaction (FiGURe A1.11). The presence of the enzyme leads to a new reaction pathway that is different from that of the uncatalyzed reaction.
Catalysis occurs at the active site
The active site of an enzyme molecule is usually a cleft or pocket on or near the surface of the enzyme that takes up only a small fraction of the enzyme surface. It is convenient to consider the active site as consisting of two components: the binding site for the substrate (which attracts and posi-tions the substrate) and the catalytic groups (the reactive side chains of amino acids or cofactors, which carry out the bond-breaking and bond-forming reactions involved).
Binding of substrate at the active site initially involves noncovalent interactions between the substrate and either side chains or peptide bonds of the protein. The rest of the protein structure provides a means of positioning the sub-strate and catalytic groups, flexibility for conformational changes, and regulatory control. The shape and polarity of the binding site account for much of the specificity of enzymes, and there is complementarity between the shape and the polarity of the substrate and those of the active site. In some cases, binding of the substrate induces a confor-mational change in the active site of the enzyme. Confor-mational change is particularly common where there are two substrates. Binding of the first substrate sets up a con-formational change of the enzyme that results in formation of the binding site for the second substrate. Hexokinase is a good example of an enzyme that exhibits this type of conformational change (FiGURe A1.12). Plant Physiology 5/E Taiz/ZeigerSinauer AssociatesMorales StudioFigure A01.11 Date 03-10-10
Substrate
Product
Free energyof activation
Enzyme catalyzed
Uncatalyzed
Transition state
Free
en
erg
y
Progress of reaction
FiGURe A1.11 Free-energy curves for the same reac-tion, either uncatalyzed or enzyme catalyzed. As a cata-lyst, an enzyme lowers the free energy of activation of the transition state between substrates and prod-ucts compared with the uncatalyzed reaction. It does this by forming various complexes and intermediates, such as enzyme–substrate and enzyme–product com-plexes. The ground state free energy of the enzyme–substrate complex in the enzyme-catalyzed reaction may be higher than that of the substrate in the uncata-lyzed reaction, and the transition state free energy of the enzyme-bound substrate will be signficantly less than that in the corresponding uncatalyzed reaction.
Plant Physiology 5/E Taiz/ZeigerSinauer AssociatesMorales StudioFigure A01.12 Date 03-10-10
D-Glucose
Active site
(A) (B)
FiGURe A1.12 Conformational change in hexokinase, in-duced by the first substrate of the enzyme, d-glucose. (A) Before glucose binding. (B) After glucose binding. The binding of glucose to hexokinase induces a confor-mational change in which the two major domains come together to close the cleft that contains the active site.
This change sets up the binding site for the second sub-strate, ATP. In this manner the enzyme prevents the un-productive hydrolysis of ATP by shielding the substrates from the aqueous solvent. The overall reaction is the phosphorylation of glucose and the formation of ADP.
© 2015 Sinauer Associates, Inc. This material cannot be copied, reprouced, manufactured or disseminated in any form without express written permission from the publisher.

eneRGy And enzymeS A1–17
The catalytic groups are usually the amino acid side chains and/or cofactors that can function as catalysts. Com-mon examples of catalytic groups are acids (—COOH from the side chains of aspartic acid or glutamic acid, imidazole from the side chain of histidine), bases (—NH2 from lysine, imidazole from histidine, —S– from cysteine), nucleophiles (imidazole from histidine, —S– from cysteine, —OH from serine), and electrophiles (often metal ions, such as Zn2+). The acidic catalytic groups function by donating a proton, the basic ones by accepting a proton. Nucleophilic catalytic groups form a transient covalent bond to the substrate.
The decisive factor in catalysis is the direct interaction between the enzyme and the substrate. In many cases, there is an intermediate that contains a covalent bond between the enzyme and the substrate. Although the details of the catalytic mechanism differ from one type of enzyme to another, a limited number of features are involved in all enzyme catalysis. These features include acid–base cataly-sis, electrophilic or nucleophilic catalysis, and ground state distortion through electrostatic or mechanical strains on the substrate.
A simple kinetic equation describes an enzyme-catalyzed reaction
Enzyme-catalyzed systems often exhibit a special form of kinetics, called Michaelis–Menten kinetics, which are characterized by a hyperbolic relationship between reac-tion velocity, v, and substrate concentration, [S] (FiGURe A1.13). This type of plot is known as a saturation plot because when the enzyme becomes saturated with sub-strate (i.e., each enzyme molecule has a substrate molecule associated with it), the rate becomes independent of sub-strate concentration. Saturation kinetics implies that an equilibrium process precedes the rate-limiting step:
E S ES E Pfast slow+ ← → → +where E represents the enzyme, S the substrate, P the prod-uct, and ES the enzyme–substrate complex. Thus, as the substrate concentration is increased, a point will be reached at which all the enzyme molecules are in the form of the ES complex, and the enzyme is saturated with substrate. Since the rate of the reaction depends on the concentration of ES, the rate will not increase further, because there can be no higher concentration of ES.
When an enzyme is mixed with a large excess of sub-strate, there will be an initial very short time period (usually milliseconds) during which the concentrations of enzyme–substrate complexes and intermediates build up to certain levels; this is known as the pre–steady-state period. Once the intermediate levels have been built up, they remain rel-atively constant until the substrate is depleted; this period is known as the steady state.
Normally enzyme kinetic values are measured under steady-state conditions, and such conditions usually pre-
Plant Physiology 5/E Taiz/ZeigerSinauer AssociatesMorales StudioFigure A01.13 Date 03-10-10
1/2Vmax
Vmax
v = Vmax [S]
Km + [S]
Km
Substrate concentration [S]
Init
ial v
elo
city
(v)
FiGURe A1.13 Plot of initial velocity, v, versus sub-strate concentration, [S], for an enzyme-catalyzed re-action. The curve is hyperbolic. The maximal rate, Vmax, occurs when all the enzyme molecules are fully occupied by substrate. The value of Km, defined as the substrate concentration at 1/2Vmax, is a reflec-tion of the affinity of the enzyme for the substrate. The smaller the value of Km, the tighter the binding.
vail in the cell. For many enzyme-catalyzed reactions the kinetics under steady-state conditions can be described by a simple expression known as the Michaelis–Menten equation:
SS
m
vVK
=+
max[ ][ ] (A1.21)
where v is the observed rate or velocity (in units such as moles per liter per second), Vmax is the maximum veloc-ity (at infinite substrate concentration), and Km (usually measured in units of molarity) is a constant that is charac-teristic of the particular enzyme–substrate system and is related to the association constant of the enzyme for the substrate (see Figure A1.13). Km represents the concen-tration of substrate required to half-saturate the enzyme and thus is the substrate concentration at Vmax/2. In many cellular systems the usual substrate concentration is in the vicinity of Km. The smaller the value of Km, the more strongly the enzyme binds the substrate. Typical values for Km are in the range of 10–6 to 10–3 M.
We can readily obtain the parameters Vmax and Km by fitting experimental data to the Michaelis–Menten equa-tion, either by computerized curve fitting or by a linear-ized form of the equation. An example of a linearized form of the equation is the Lineweaver–Burk double-reciprocal plot shown in FiGURe A1.14A. When divided by the con-centration of enzyme, the value of Vmax gives the turnover number, the number of molecules of substrate converted
© 2015 Sinauer Associates, Inc. This material cannot be copied, reprouced, manufactured or disseminated in any form without express written permission from the publisher.

A1–18 Appendix i
to product per unit of time per molecule of enzyme. Typi-cal turnover number values range from 102 to 103 s–1.
Enzymes are subject to various kinds of inhibition
Any agent that decreases the velocity of an enzyme-cata-lyzed reaction is called an inhibitor. Inhibitors may exert their effects in many different ways. Generally, if inhibition is irreversible the compound is called an inactivator. Other agents can increase the efficiency of an enzyme; they are called activators. Inhibitors and activators are very impor-tant in the cellular regulation of enzymes. Many agricul-turally important insecticides and herbicides are enzyme inhibitors. The study of enzyme inhibition can provide useful information about kinetic mechanisms, the nature of enzyme–substrate intermediates and complexes, the chemical mechanism of catalytic action, and the regulation and control of metabolic enzymes. In addition, the study of inhibitors of potential target enzymes is essential to the rational design of herbicides.
Inhibitors can be classified as reversible or irrevers-ible. Irreversible inhibitors form covalent bonds with an enzyme or they denature it. For example, iodoacetate (ICH2COOH) irreversibly inhibits thiol proteases such as papain by alkylating the active-site —SH group. One class of irreversible inhibitors is called affinity labels, or active site–directed modifying agents, because their structure directs them to the active site. An example is tosyl-lysine chloromethyl ketone (TLCK), which irreversibly inacti-vates papain. The tosyl-lysine part of the inhibitor resem-bles the substrate structure and so binds in the active site. The chloromethyl ketone part of the bound inhibitor reacts with the active-site histidine side chain. Such compounds
are very useful in mechanistic studies of enzymes, but they have limited practical use as herbicides because of their chemical reactivity, which can be harmful to the plant.
Reversible inhibitors form weak, noncovalent bonds with the enzyme, and their effects may be competitive, noncompetitive, or mixed. For example, the widely used broad-spectrum herbicide glyphosate (Roundup®) works by competitively inhibiting a key enzyme in the biosyn-thesis of aromatic amino acids, 5-enolpyruvylshikimate-3-phosphate (EPSP) synthase. Resistance to glyphosate has recently been achieved by genetic engineering of plants so that they are capable of overproducing EPSP synthase (Donahue et al. 1995).
CompeTiTive inhiBiTion Competitive inhibition is the simplest and most common form of reversible inhibition. It usually arises from binding of the inhibitor to the active site with an affinity similar to or stronger than that of the substrate. Thus the effective concentration of the enzyme is decreased by the presence of the inhibitor, and the catalytic reaction will be slower than if the inhibitor were absent. Competitive inhibition is usually based on the fact that the structure of the inhibitor resembles that of the substrate; hence the strong affinity of the inhibitor for the active site. Competitive inhibition may also occur in allosteric enzymes, where the inhibitor binds to a distant site on the enzyme, causing a conformational change that alters the active site and prevents normal substrate binding. Such a binding site is called an allosteric site. In this case, the competition between substrate and inhibitor is indirect.
Competitive inhibition results in an apparent increase in Km and has no effect on Vmax (FiGURe A1.14B). By mea-suring the apparent Km as a function of inhibitor concen-tration, one can calculate Ki, the inhibitor constant, which reflects the affinity of the enzyme for the inhibitor.
nonCompeTiTive inhiBiTion In noncompetitive inhibi-tion, the inhibitor does not compete with the substrate for binding to the active site. Instead, it may bind to another site on the protein and obstruct the substrate’s access to the active site, thereby changing the catalytic properties of the
Plant Physiology 5/E Taiz/ZeigerSinauer AssociatesMorales StudioFigure Appendix 01.14 Date 02-22-10 4-28-16
x-Intercept = –
y-Intercept =
1
Km 1
Vmax
Km
Vmax
1/v 1/v 1/v
Slope =
Uninhibited
Inhibited
1/[S] 1/[S] 1/[S]
(A) Uninhibited enzyme-catalyzed reaction (B) Competitive inhibition (C) Noncompetitive inhibition
Uninhibited
Inhibited
FiGURe A1.14 Lineweaver–Burk double-reciprocal plots. A plot of 1/v versus 1/[S] yields a straight line. (A) Un-inhibited enzyme-catalyzed reaction showing the cal-culation of Km from the x-intercept and of Vmax from the y-intercept. (B) The effect of a competitive inhibitor on the parameters Km and Vmax. The apparent Km is in-creased, but the Vmax is unchanged. (C) A noncompeti-tive inhibitor reduces Vmax but has no effect on Km.
© 2015 Sinauer Associates, Inc. This material cannot be copied, reprouced, manufactured or disseminated in any form without express written permission from the publisher.

eneRGy And enzymeS A1–19
enzyme, or it may bind to the enzyme–substrate complex and thus alter catalysis. Noncompetitive inhibition is fre-quently observed in the regulation of metabolic enzymes. The diagnostic property of this type of inhibition is that Km is unaffected, whereas Vmax decreases in the presence of increasing amounts of inhibitor (FiGURe A1.14C).
mixed inhiBiTion Mixed inhibition is characterized by effects on both Vmax (which decreases) and Km (which increases). Mixed inhibition is very common and results from the formation of a complex consisting of the enzyme, the substrate, and the inhibitor that does not break down to products.
pH and temperature affect the rate of enzyme-catalyzed reactions
Enzyme catalysis is very sensitive to pH. This sensitivity is easily understood when one considers that the essential catalytic groups are usually ionizable ones (imidazole, car-boxyl, amino) and that they are catalytically active in only one of their ionization states. For example, imidazole act-ing as a base will be functional only at pH values above 7. Plots of the rates of enzyme-catalyzed reactions versus pH are usually bell-shaped, corresponding to two sigmoidal
curves, one for an ionizable group acting as an acid and the other for the group acting as a base (FiGURe A1.15A). Although the effects of pH on enzyme catalysis usually reflect the ionization of the catalytic group, they may also reflect a pH-dependent conformational change in the pro-tein that leads to loss of activity as a result of disruption of the active site.
The temperature dependence of most chemical reactions also applies to enzyme-catalyzed reactions. Thus, most enzyme-catalyzed reactions show an exponential increase in rate with increasing temperature. However, because the enzymes are proteins, another major factor comes in to play—namely, denaturation. After a certain temperature is reached, enzymes show a very rapid decrease in activity as a result of the onset of denaturation (FiGURe A1.15B). The temperature at which denaturation begins, and hence at which catalytic activity is lost, varies with the particular protein as well as the environmental conditions, such as pH. Frequently, denaturation begins at about 40 to 50°C and is complete over a range of about 10°C.
Cooperative systems increase the sensitivity to substrates and are usually allosteric
Cells control the concentrations of most metabolites very closely. To keep such tight control, the enzymes that control metabolite interconversion must be very sensitive. From the plot of velocity versus substrate concentration (see Figure A1.13), we can see that the velocity of an enzyme-catalyzed reaction increases with increasing substrate con-centration up to Vmax. However, we can calculate from the Michaelis–Menten equation (Equation A1.21) that raising the velocity of an enzyme-catalyzed reaction from 0.1 Vmax to 0.9 Vmax requires an enormous (81-fold) increase in the substrate concentration:
0.1SS
, 0.9SS
0.1 = 0.9[S] , 0.9 S
maxm
maxm
m m
VV
K
V
K=
+= ′
+ ′= ′
max max[ ]
[ ]
[ ]
[ ]
. [ ]
V
K K 0 1
SS
SS
0 10 9
0 90 1
0 10 9
2
.
...
[ ][ ]
[ ][ ]
.
.
= ×′
′=
== 0 010 81
.
.
Plant Physiology 5/E Taiz/ZeigerSinauer AssociatesMorales StudioFigure A01.15 Date 03-10-10
6543 7 8 9
3020100 40 50 60
Init
ial v
elo
city
Init
ial v
elo
city
pH
Temperature (°C)
(A)
(B)
FiGURe A1.15 pH and temperature curves for typical enzyme reactions. (A) Many enzyme-catalyzed reactions show bell-shaped profiles of rate versus pH. The inflec-tion point on each shoulder corresponds to the pKa of an ionizing group (that is, the pH at which the ionizing group is 50% dissociated) in the active site. (B) Tem-perature causes an exponential increase in the reaction rate until the optimum is reached. Beyond the optimum, thermal denaturation dramatically decreases the rate.
© 2015 Sinauer Associates, Inc. This material cannot be copied, reprouced, manufactured or disseminated in any form without express written permission from the publisher.
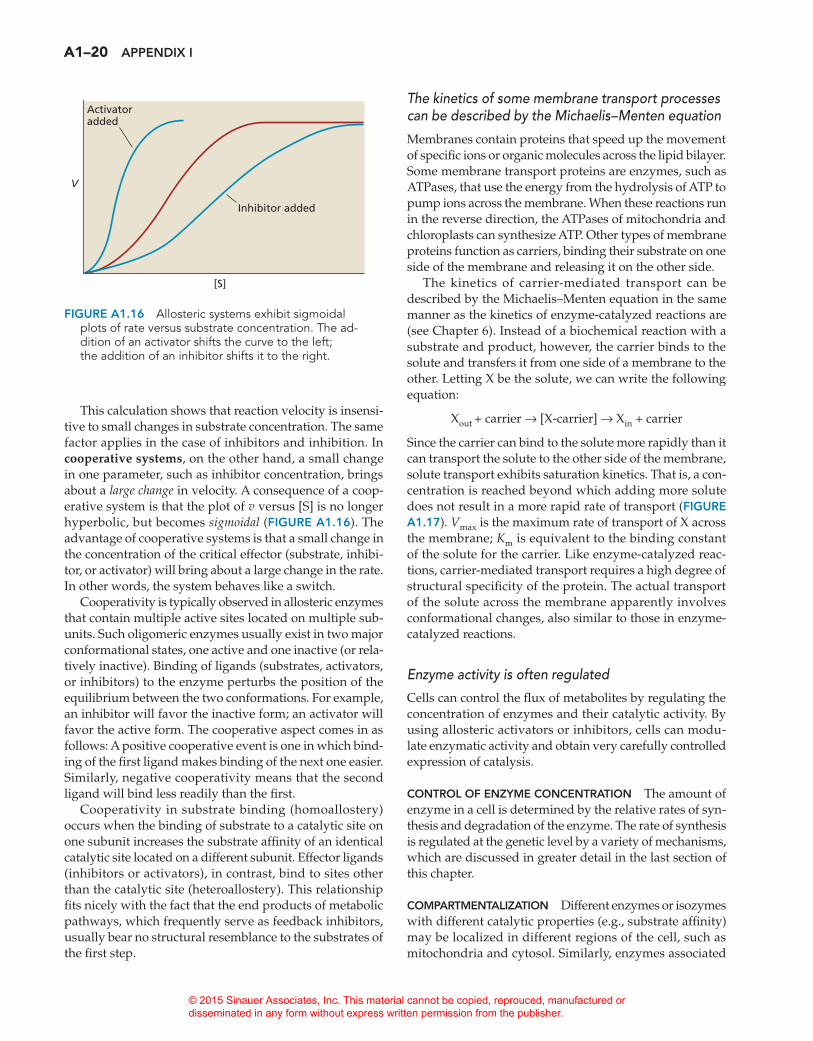
A1–20 Appendix i
The kinetics of some membrane transport processes can be described by the Michaelis–Menten equation
Membranes contain proteins that speed up the movement of specific ions or organic molecules across the lipid bilayer. Some membrane transport proteins are enzymes, such as ATPases, that use the energy from the hydrolysis of ATP to pump ions across the membrane. When these reactions run in the reverse direction, the ATPases of mitochondria and chloroplasts can synthesize ATP. Other types of membrane proteins function as carriers, binding their substrate on one side of the membrane and releasing it on the other side.
The kinetics of carrier-mediated transport can be described by the Michaelis–Menten equation in the same manner as the kinetics of enzyme-catalyzed reactions are (see Chapter 6). Instead of a biochemical reaction with a substrate and product, however, the carrier binds to the solute and transfers it from one side of a membrane to the other. Letting X be the solute, we can write the following equation:
Xout + carrier → [X-carrier] → Xin + carrier
Since the carrier can bind to the solute more rapidly than it can transport the solute to the other side of the membrane, solute transport exhibits saturation kinetics. That is, a con-centration is reached beyond which adding more solute does not result in a more rapid rate of transport (FiGURe A1.17). Vmax is the maximum rate of transport of X across the membrane; Km is equivalent to the binding constant of the solute for the carrier. Like enzyme-catalyzed reac-tions, carrier-mediated transport requires a high degree of structural specificity of the protein. The actual transport of the solute across the membrane apparently involves conformational changes, also similar to those in enzyme-catalyzed reactions.
Enzyme activity is often regulated
Cells can control the flux of metabolites by regulating the concentration of enzymes and their catalytic activity. By using allosteric activators or inhibitors, cells can modu-late enzymatic activity and obtain very carefully controlled expression of catalysis.
ConTRoL oF enzyme ConCenTRATion The amount of enzyme in a cell is determined by the relative rates of syn-thesis and degradation of the enzyme. The rate of synthesis is regulated at the genetic level by a variety of mechanisms, which are discussed in greater detail in the last section of this chapter.
CompARTmenTALizATion Different enzymes or isozymes with different catalytic properties (e.g., substrate affinity) may be localized in different regions of the cell, such as mitochondria and cytosol. Similarly, enzymes associated
Plant Physiology 5/E Taiz/ZeigerSinauer AssociatesMorales StudioFigure A01.16 Date 03-10-10
V
[S]
Inhibitor added
Activatoradded
FiGURe A1.16 Allosteric systems exhibit sigmoidal plots of rate versus substrate concentration. The ad-dition of an activator shifts the curve to the left; the addition of an inhibitor shifts it to the right.
This calculation shows that reaction velocity is insensi-tive to small changes in substrate concentration. The same factor applies in the case of inhibitors and inhibition. In cooperative systems, on the other hand, a small change in one parameter, such as inhibitor concentration, brings about a large change in velocity. A consequence of a coop-erative system is that the plot of v versus [S] is no longer hyperbolic, but becomes sigmoidal (FiGURe A1.16). The advantage of cooperative systems is that a small change in the concentration of the critical effector (substrate, inhibi-tor, or activator) will bring about a large change in the rate. In other words, the system behaves like a switch.
Cooperativity is typically observed in allosteric enzymes that contain multiple active sites located on multiple sub-units. Such oligomeric enzymes usually exist in two major conformational states, one active and one inactive (or rela-tively inactive). Binding of ligands (substrates, activators, or inhibitors) to the enzyme perturbs the position of the equilibrium between the two conformations. For example, an inhibitor will favor the inactive form; an activator will favor the active form. The cooperative aspect comes in as follows: A positive cooperative event is one in which bind-ing of the first ligand makes binding of the next one easier. Similarly, negative cooperativity means that the second ligand will bind less readily than the first.
Cooperativity in substrate binding (homoallostery) occurs when the binding of substrate to a catalytic site on one subunit increases the substrate affinity of an identical catalytic site located on a different subunit. Effector ligands (inhibitors or activators), in contrast, bind to sites other than the catalytic site (heteroallostery). This relationship fits nicely with the fact that the end products of metabolic pathways, which frequently serve as feedback inhibitors, usually bear no structural resemblance to the substrates of the first step.
© 2015 Sinauer Associates, Inc. This material cannot be copied, reprouced, manufactured or disseminated in any form without express written permission from the publisher.

eneRGy And enzymeS A1–21
with special tasks are often compartmentalized; for exam-ple, the enzymes involved in photosynthesis are found in chloroplasts. Vacuoles contain many hydrolytic enzymes, such as proteases, ribonucleases, glycosidases, and phos-phatases, as well as peroxidases. The cell walls contain gly-cosidases and peroxidases. The mitochondria are the main location of the enzymes involved in oxidative phosphory-lation and energy metabolism, including the enzymes of the tricarboxylic acid (TCA) cycle.
CovALenT modiFiCATion Control by covalent modifi-cation of enzymes is common and usually involves their phosphorylation or adenylylation*, such that the phos-phorylated form, for example, is active and the nonphos-phorylated form is inactive. These control mechanisms are normally energy dependent and usually involve ATP.
Proteases are normally synthesized as inactive precur-sors known as zymogens or proenzymes. For example, papain is synthesized as an inactive precursor called pro-papain and becomes activated later by cleavage (hydroly-sis) of a peptide bond. This type of covalent modification avoids premature proteolytic degradation of cellular con-stituents by the newly synthesized enzyme.
FeedBACk inhiBiTion Consider a typical metabolic path-way with two or more end products such as that shown in FiGURe A1.18. Control of the system requires that if the end products build up too much, their rate of formation is decreased. Similarly, if too much reactant A builds up, the rate of conversion of A to products should be increased. The process is usually regulated by control of the flux at the first step of the pathway and at each branch point. The final products, G and J, which might bear no resemblance to the substrate A, inhibit the enzymes at A ∅ B and at the branch point.
By having two enzymes at A ∅ B, each inhibited by one of the end metabolites but not by the other, it is possible to exert finer control than with just one enzyme. The first step in a metabolic pathway is usually called the committed step. At this step enzymes are subject to major control.
Fructose 2,6-bisphosphate plays a central role in the regulation of carbon metabolism in plants. It functions as an activator in glycolysis (the breakdown of sugars to gen-erate energy) and an inhibitor in gluconeogenesis (the syn-thesis of sugars). Fructose 2,6-bisphosphate is synthesized from fructose 6-phosphate in a reaction requiring ATP and catalyzed by the enzyme fructose-6-phosphate 2-kinase. It is degraded in the reverse reaction catalyzed by fructose-2,6-bisphosphatase, which releases inorganic phosphate (Pi). Both of these enzymes are subject to metabolic control by fructose 2,6-bisphosphate, as well as ATP, Pi, fructose 6-phosphate, dihydroxyacetone phosphate, and 3-phos-phoglycerate. The role of fructose 2,6-bisphosphate in plant metabolism is discussed further in Chapters 8 and 12 .
Plant Physiology 5/E Taiz/ZeigerSinauer AssociatesMorales StudioFigure A01.17 Date 03-10-10
m
max
max
Tran
spo
rt v
elo
city
External concentration of solute
K
V
V
2
FiGURe A1.17 The kinetics of carrier-mediated trans-port of a solute across a membrane are analo-gous to those of enzyme-catalyzed reactions. Thus, plots of transport velocity versus solute concentra-tion are hyperbolic, becoming asymptotic to the maximal velocity at high solute concentration.
Plant Physiology 5/E Taiz/ZeigerSinauer AssociatesMorales StudioFigure A01.18 Date 03-10-10
A B C D
E F G
H I J
FiGURe A1.18 Feedback inhibition in a hypothetical metabolic pathway. The letters (A–J) represent metabo-lites, and each arrow represents an enzyme-catalyzed reaction. The boldface arrow for the first reaction indi-cates that two different enzymes with different inhibi-tor susceptibilities are involved. Dashed lines indicate metabolites that inhibit particular enzymes. The first step in the metabolic pathway and the branch points are particularly important sites for feedback control.
* Although some texts refer to the conjugation of a compound with adenylic acid (AMP) as “adenylation,” the chemically correct term is “adenylylation.”
© 2015 Sinauer Associates, Inc. This material cannot be copied, reprouced, manufactured or disseminated in any form without express written permission from the publisher.
A1–22 Appendix i
ReFeRenCeSAtkinson, D. E. (1977) Cellular Energy Metabolism and Its
Regulation. Academic Press, New York. Clausius, R. (1879) The Mechanical Theory of Heat. Tr. by
Walter R. Browne. Macmillan, London. Creighton, T. E. (1983) Proteins: Structures and Molecular
Principles. W. H. Freeman, New York. Donahue, R. A., Davis, T. D., Michler, C. H.,
Riemenschneider, D. E., Carter, D. R., Marquardt, P. E., Sankhla, N., Sahkhla, D., Haissig, B. E., and Isebrands, J. G. (1995) Growth, photosynthesis, and herbicide tolerance of genetically modified hybrid poplar. Can. J. For. Res. 24: 2377–2383.
Edsall, J. T., and Gutfreund, H. (1983) Biothermodynamics: The Study of Biochemical Processes at Equilibrium. Wiley, New York.
Klotz, I. M. (1967) Energy Changes in Biochemical Reactions. Academic Press, New York.
Mathews, C. K., and Van Holde, K. E. (1996) Biochemistry, 2nd ed. Benjamin/Cummings, Menlo Park, CA.
Morowitz, H. J. (1978) Foundations of Bioenergetics. Academic Press, New York.
Nicholls, D. G., and Ferguson, S. J. (1992) Bioenergetics 2. Academic Press, San Diego.
Stryer, L. (1995) Biochemistry, 4th ed. W. H. Freeman, New York.
© 2015 Sinauer Associates, Inc. This material cannot be copied, reprouced, manufactured or disseminated in any form without express written permission from the publisher.