Embed Size (px)
Citation preview

Energy Access and Energy Security in Asia and the Pacific
Benjamin K. Sovacool
No. 383 | December 2013
ADB Economics Working Paper Series
Energy Access and Energy Security in Asia and the PacificThis working paper explores energy access, energy poverty, and energy development as energy security concerns confronting the Asia and the Pacific region. The first part defines energy poverty and then provides calculations estimating its prevalence in Asia and around the world. The second part analyzes energy access as an energy security concern, focusing on poverty and economic security, household health, gender and education, and the most recent results from the International Energy Agency’s Energy Development Index. The third part assesses financing for Sustainable Energy for All initiative and universal energy access, introduces the pro-poor public–private partnership model, and summarizes some successful cases of its implementation. The final part provides five policy recommendations such as selecting appropriate technology, promoting community participation, and coupling energy services with income generation, among others.
About the Asian Development BankADB’s vision is an Asia and Pacific region free of poverty. Its mission is to help its developing member countries reduce poverty and improve the quality of life of their people. Despite the region’s many successes, it remains home to two-thirds of the world’s poor: 1.7 billion people who live on less than $2 a day, with 828 million struggling on less than $1.25 a day. ADB is committed to reducing poverty through inclusive economic growth, environmentally sustainable growth, and regional integration. Based in Manila, ADB is owned by 67 members, including 48 from the region. Its main instruments for helping its developing member countries are policy dialogue, loans, equity investments, guarantees, grants, and technical assistance.
Asian Development Bank6 ADB Avenue, Mandaluyong City1550 Metro Manila, Philippineswww.adb.org/economics
Printed on recycled paper Printed in the Philippines

ADB Economics Working Paper Series
Energy Access and Energy Security in Asia and the Pacific Benjamin K. Sovacool
No. 383 December 2013
Professor of Business and Social Sciences, Aarhus University, Director of the Center for Energy Technologies, AU-Herning, Denmark, and Associate Professor of Law at Vermont Law School, United States.

Asian Development Bank 6 ADB Avenue, Mandaluyong City 1550 Metro Manila, Philippines www.adb.org © 2013 by Asian Development Bank December 2013 ISSN 1655-5252 Publication Stock No. WPS 136155 The views expressed in this paper are those of the author and do not necessarily reflect the views and policies of the Asian Development Bank (ADB) or its Board of Governors or the governments they represent. ADB does not guarantee the accuracy of the data included in this publication and accepts no responsibility for any consequence of their use. By making any designation of or reference to a particular territory or geographic area, or by using the term “country” in this document, ADB does not intend to make any judgments as to the legal or other status of any territory or area. Note: In this publication, “$” refers to US dollars.
The ADB Economics Working Paper Series is a forum for stimulating discussion and eliciting feedback on ongoing and recently completed research and policy studies undertaken by the Asian Development Bank (ADB) staff, consultants, or resource persons. The series deals with
key economic and development problems, particularly those facing the Asia and Pacific region; as well as conceptual, analytical, or methodological issues relating to project/program economic analysis, and statistical data and measurement. The series aims to enhance the
knowledge on Asia’s development and policy challenges; strengthen analytical rigor and quality of ADB’s country partnership strategies, and its subregional and country operations; and improve the quality and availability of statistical data and development indicators for monitoring
development effectiveness.
The ADB Economics Working Paper Series is a quick-disseminating, informal publication
whose titles could subsequently be revised for publication as articles in professional journals or chapters in books. The series is maintained by the Economics and Research Department.
Printed on recycled paper

CONTENTS
ABSTRACT v
I. INTRODUCTION 1 II. DEFINING ENERGY POVERTY AND ACCESS 1
A. The Energy Ladder 1 B. Measuring Energy Poverty 3 C. Energy Access as an Energy Security Concern 7 D. The Energy Development Index 12
III. FINANCING SUSTAINABLE ENERGY FOR ALL 13
A. Projections for Financing Required to Achieve Universal Energy Access 13 B. The Pro-Poor Public Private Partnership Model 14 C. Household Needs and Off-Grid Programs 16 D. Rural Electrification 17 E. Policy Recommendations 18
REFERENCES 22


ABSTRACT
Lack of access to electricity and modern cooking fuels constitutes energy poverty. Access to modern energy requires improved technologies and financing instruments and sources. The pro-poor public–private partnership model is one useful vehicle for raising capital to finance projects. Five factors appear to be necessary in combination for programs and partnerships to successfully promote energy access and eradicate energy poverty: selecting appropriate technology, promoting community participation, emphasizing maintenance and service, coupling service with incomes, and building local capacity. Keywords: energy access, energy and development, energy poverty, indoor air pollution JEL Classification: K32, L38, N75


I. INTRODUCTION
This paper explores energy access, energy poverty, and energy development as energy security concerns confronting Asia and the Pacific. Improved access to energy services is arguably the key defining characteristic of economic development. Lack of access and energy poverty contribute to hunger with women and children spending long hours gathering fuels rather than earning incomes. The health consequences are dire with indoor air pollution associated with traditional energy use responsible for more deaths each year than those from malaria and tuberculosis.1 Environmentally, energy poverty forces its victims to harvest more polluting and less energy-dense fuels such as woody biomass or charcoal often causing land degradation, deforestation, and the contamination of soil and water resources. Such depletion instigates conflicts over land, decreases food supply, diminishes sources of traditional medicine, and accelerates malnutrition, all of which involve various dimensions of energy security.
II. DEFINING ENERGY POVERTY AND ACCESS
A. The Energy Ladder As there is no simple definition of poverty, conceptualizing “energy poverty” is a somewhat arduous process. Recent work, including the United Nations Development Programme (UNDP) Human Development Report 2010, noted that poverty is not a static or fixed state but rather a multidimensional concept encompassing caloric intake, life expectancy, housing quality, literacy, access to energy, and a variety of other factors.2 Poverty is frequently expressed from an income perspective as earning less than $2 per day adjusted for purchasing power parity. Under this definition, a shocking 40% of the global population is poor.3
Sticking with the UNDP’s multidimensional notion of poverty, its non-income dimensions
such as health, education, and living conditions can be just as important as sources of employment or wages. Within this list of non-income dimensions, two energy indicators are found: electricity (having no electricity constitutes poverty) and cooking fuels (relying on wood, charcoal, and/or dung for cooking constitutes poverty). This conception of energy poverty has been confirmed by the International Energy Agency (IEA) and other multilateral organizations which state that energy poverty is comprised of lack of access to electricity and reliance on traditional biomass fuels for cooking.4
Thus, UNDP explicitly defines energy poverty as the, “…inability to cook with modern
cooking fuels and the lack of a bare minimum of electric lighting for reading or for other household and productive activities at sunset.”5 The Asian Development Bank (ADB) takes a slightly broader approach to defining energy poverty and says that it is, “the absence of sufficient choice in accessing adequate, affordable, reliable, high-quality, safe and environmentally benign energy services to support economic and human development.”6
1 Holdren and Smith (2000). 2 United Nations Development Programme (2010a). 3 D’Agostino (2010). 4 International Energy Agency, United Nations Development Programme, United Nations Industrial Development
Organization (2010); Jones (2010). 5 Gaye (2007). 6 Masud, Sharan, and Lohani (2007).

2 І ADB Economics Working Paper Series No. 383
The most common concept illustrating energy poverty involves the “energy ladder.” One study defines the energy ladder as, “…the percentage of population among the spectrum running from simple biomass fuels (dung, crop residues, wood, and charcoal) to fossil fuels (kerosene, natural gas, and coal direct use) to electricity.”7 The idea implies that the primary types of energy used in rural areas or developing countries can be arranged on a “ladder” with the “simplest” or most “traditional” fuels and sources such as animal power, candles, and wood at the bottom with the more “advanced” or “modern” fuels such as electricity or refined gasoline at the top. The ladder is often described in terms of efficiencies with the more efficient fuels or sources moving higher up. For example, kerosene is 3 to 5 times more efficient than wood for cooking, and liquefied petroleum gas is 5 to 10 times more efficient than crop residues and dung.8 Table 1 depicts the energy ladder as discussed in a variety of academic studies.9
Table 1: The Energy Ladder
Developing Countries
Developed Countries Sector Energy Service
Low-Income Households
Middle-Income Households
High-Income Households
Household Cooking Wood (includes wood chips, straw, shrubs, grasses, and bark); charcoal; agricultural residues; and dung
Wood, residues, dung, kerosene, and biogas
Wood, kerosene, biogas, liquefied petroleum gas, natural gas, electricity, coal
Electricity, natural gas
Lighting Candles and kerosene (sometimes none)
Candles, kerosene, paraffin, and gasoline
Kerosene, electricity, and gasoline
Electricity
Space heating Wood, residues, and dung (often none)
Wood, residues, and dung Wood, residues, dung, coal, and electricity
Oil, natural gas, or electricity
Other appliances None Electricity, batteries, and storage cells
Electricity Electricity
Agriculture Tilling or plowing Hand Animal Animal, gasoline, and diesel (tractors and small power tillers)
Gasoline and diesel
Irrigation Hand Animal Diesel and electricity Electricity Post-harvest
processing Hand Animal Diesel and electricity Electricity
Industry Milling and mechanical
Hand Hand and animal Hand, animal, diesel, and electricity
Electricity
Process heat Wood and residues Coal, charcoal, wood, and residues
Coal, charcoal, kerosene, wood, residues, and electricity
Coke, napthene, electricity
Primary Technologies
Cookstoves, three stone fires, lanterns
Improved cookstoves, biogas systems, solar lanterns, incandescent and compact fluorescent light bulbs
Improved cookstoves, biogas systems, liquefied petroleum gas, gas and electric stoves, compact fluorescent light bulbs, light emitting diodes
Source: Author
The Advisory Group on Energy and Climate Change—an intergovernmental body
composed of representatives from businesses, the United Nations, and research institutes—divided energy access into incremental categories. The first category is basic human needs met
7 Holdren and Smith (2000). 8 Barnes and Floor (1996) 9 See International Energy Agency, United Nations Development Programme, United Nations Industrial
Development Organization (2010); Jones (2010); Legros et al (2009); Cook et al (2005); International Energy Agency (2004); and Barnes and Floor (1996).

Energy Access and Energy Security in Asia and the Pacific І 3
with both electricity consumption of 50–100 kilowatt-hours (kWh) per person per year and 50–100 kilograms (kg) of oil equivalent or modern fuel per person per year (or the ownership of an improved cookstove). Second are productive uses such as access to mechanical energy for agriculture or irrigation, commercial energy, or liquid transport fuels. Consumption here rises to 500–1,000 kWh per year plus 150 kg of oil equivalent. Third is modern needs which include the use of domestic appliances, cooling and space heating, hot and cold water, and private transportation which in aggregate result in the consumption of about 2,000 kWh per year and 250–450 kg of oil equivalent. Table 2 illustrates this sequential ordering quite clearly.10
Table 2: Energy Services and Access Levels
Level Electricity Use Kilowatt Hour per Person per Year Solid Fuel Use Transport
Kilograms of Oil Equivalent per
Person per Year Basic Human Needs
Lighting, health, education, and communication
50 to 100 Cooking and heating
Walking or bicycling 50 to 100
Productive Uses Agriculture, water pumping for irrigation, fertilizer, mechanized tilling, processing
500 to 1,000 Minimal Mass transit, motorcycle, or scooter
150
Modern Society Needs
Domestic appliances, cooling, heating
2,000 Minimal Private transportation
250 to 450
Source: UNDP (2010b)
B. Measuring Energy Poverty Notwithstanding these complexities, IEA, the World Health Organization (WHO), and various United Nations organizations have done a remarkable job compiling statistics on energy poverty both in terms of those without access to electricity as well as those dependent on traditional fuels.
According to the most recent data available as of 2009, 1.4 billion people lack access to
electricity—85% of them in rural areas—and almost 2.7 billion people remain reliant on woody biomass fuels for cooking. The numbers are broken down in Table 3. An additional 1 billion people have access only to unreliable or intermittent electricity networks.11 Put another way, the poorest 75% of the global population still use only 10% of global energy.12
10 United Nations Development Programme (2010b). 11 Ibid., p. 7 12 Bazilian et al. (2011).

4 І ADB Economics Working Paper Series No. 383
Table 3: Number and Share of Population without Access to Modern Energy Services, 2009
Without Access to Electricity Dependent on Traditional Solid
Fuels for Cooking
Population
(million)Share of Total Population (%)
Population (million)
Share of Total Population (%)
Africa 587 58 657 65 Nigeria 76 49 104 67 Ethiopia 69 83 77 93 Congo 59 89 62 94 Tanzania 38 86 41 94 Kenya 33 84 33 83 Other Sub-Saharan Africa 310 68 335 74 North Africa 2 1 4 3 Asia 675 19 1,921 54 India 289 25 836 72 Bangladesh 96 59 143 88 Indonesia 82 36 124 54 Pakistan 64 38 122 72 Myanmar 44 87 48 95 Rest of developing Asia 102 6 648 36 Latin America 31 7 85 19Middle East 21 11 0 0Developing Countries 1,314 25 2,662 51World 1,417 19 2,662 39
Source: IEA, UNDP, and UNIDO (2010)
In Asia specifically, energy access oscillates noticeably. The People’s Republic of China
(PRC) alone accounts for about 30% of the electricity generated for the entire region, and five countries—Australia, the PRC, India, Japan, and the Republic of Korea—account for 77% of electricity generated. When broken down into per capita figures, houses in Australia or New Zealand consume 100 times more electricity than those in Bangladesh and Myanmar.13 Table 4 breaks down electrification numbers for more than 100 countries around the globe.
Table 4: Global National, Rural, and Urban Electrification Numbers
Economy % Population with Electricity Access (most recently available data)National Rural Urban
Afghanistan 14.4 12.0 22.0 Algeria 99.3 98.0 100.0 Angola 26.2 10.7 38.0 Antigua and Barbuda 95.0 95.0 95.0 Argentina 97.2 70.0 99.6 Bahamas 94.0 Bahrain 99.4 95.0 100.0 Bangladesh 41.0 28.0 76.0 Barbados 100.0 100.0 100.0 Belize 91.7 68.0 95.4 Benin 24.8 8.5 48.0 Bhutan 68.5 56.1 97.4 Bolivia 77.5 38.0 98.2
13 United Nations Economic and Social Commission for Asia and the Pacific (2010).

Energy Access and Energy Security in Asia and the Pacific І 5
Table 4: (cont.)
Economy % Population with Electricity Access (most recently available data)National Rural Urban
Botswana 45.4 12.0 68.0 Brazil 97.8 88.0 99.5 Brunei Darussalam 99.7 98.6 100.0 Burkina Faso 10.0 6.3 25.0 Burundi 2.8 0.1 25.6 Cambodia 24.0 12.5 66.0 Cameroon 29.4 9.0 45.0 Cape Verde 70.4 44.9 87.5 Central African Republic 5.1 0.3 14.7 Chad 3.5 0.3 16.4 Chile 98.5 95.0 99.0 People’s Republic of China 99.4 99.0 100.0 Colombia 93.6 76.0 99.6 Comoros 40.1 Congo 30.0 15.0 39.5 Congo (DR) 11.1 25.0 4.0 Cook Islands 99.0 Costa Rica 99.1 98.0 99.8 Cote d’Ivoire 47.3 18.0 78.0 Cuba 97.0 87.8 100.0 Djibouti 49.7 10.2 56.9 Dominica 99.0 96.3 100.0 Dominican Republic 95.9 90.4 98.4 Ecuador 92.2 78.0 99.6 Egypt 99.4 99.1 100.0 El Salvador 86.4 70.0 97.1 Equatorial Guinea 27.0 6.2 71.2 Eritrea 32.0 5.0 86.0 Ethiopia 15.3 2.0 80.0 Fiji 60.0 Gabon 36.7 18.0 40.0 Gambia 8.3 2.8 45.9 Ghana 54.0 23.0 85.0 Grenada 99.5 99.1 100.0 Guatemala 80.5 68.0 93.7 Guinea 20.2 2.8 63.8 Guinea-Bissau 11.5 <1.0 30.7 Guyana 77.5 75.7 81.6 Haiti 38.5 11.7 68.9 Honduras 70.3 45.0 97.9 Hong Kong, China 100.0 100.0 100.0 India 64.5 52.5 93.1 Indonesia 64.5 32.0 94.0 Iran 98.4 95.0 100.0 Iraq 85.0 57.0 99.0 Jamaica 92.0 83.4 99.5 Jordan 99.9 100.0 99.5 Kenya 15.0 5.0 51.3 Kiribati 60.0 Korea, Democratic People’s Republic
26.0 10.0 36.0

6 І ADB Economics Working Paper Series No. 383
Table 4: (cont.)
Economy % Population with Electricity Access (most recently available data)
National Rural UrbanKorea, Republic of 100.0 100.0 100.0 Kuwait 100.0 100.0 100.0 Lao People’s Democratic Republic 55.0 42.0 84.0 Lebanon 99.9 99.3 100.0 Lesotho 16.0 6.0 44.0 Liberia 3.3 1.0 7.0 Libya 99.8 99.0 100.0 Madagascar 19.0 5.0 53.0 Malawi 9.0 5.3 25.0 Malaysia 99.4 98.0 100.0 Maldives 100.0 100.0 100.0 Mali 17.4 3.7 48.7 Marshall Islands 74.5 32.3 92.1 Mauritania 30.1 2.0 47.0 Mauritius 99.4 99.0 100.0 Mexico 98.5 96.1 99.7 Micronesia 54.0 Mongolia 67.0 36.0 90.0 Morocco 97.0 96.0 98.0 Mozambique 11.7 6.3 21.0 Myanmar 13.0 10.0 19.0 Namibia 34.0 13.0 70.0 Nauru 99.9 99.9 Nepal 43.6 34.0 89.7 Nicaragua 72.1 42.0 95.0 Niger 9.3 1.5 47.2 Nigeria 46.8 26.0 69.0 Niue 99.0 Occupied Palestinian Territories 99.7 99.4 99.8 Oman 98.0 93.0 99.9 Pakistan 57.6 46.0 78.0 Palau 99.5 98.4 100.0 Panama 88.1 72.0 94.0 Papua New Guinea 10.0 5.0 42.8 Paraguay 94.5 88.0 98.8 Peru 76.9 28.0 96.4 Philippines 86.0 65.0 97.0 Qatar 98.7 70.0 100.0 Rwanda 4.8 1.3 25.1 Saint Kitts and Nevis 87.0 Saint Lucia 99.0 98.5 100.0 St Vincent and Grenadines 99.0 97.5 100.0 Samoa 97.0 Sao Tome and Principe 48.5 33.7 61.6 Saudi Arabia 99.0 95.0 100.0 Senegal 42.0 18.0 74.7 Seychelles 96.0 Sierra Leone 5.1 0.1 12.7 Singapore 100.0 100.0 100.0 Solomon Islands 14.4 5.1 70.6

Energy Access and Energy Security in Asia and the Pacific І 7
Table 4: (cont.)
Economy % Population with Electricity Access (most recently available data)National Rural Urban
South Africa 75.0 55.0 88.0 Sri Lanka 76.6 75.0 85.8 Sudan 31.4 19.0 47.5 Suriname 78.6 Swaziland 29.7 20.2 65.2 Syrian Arab Republic 92.7 84.0 100.0 Tanzania 11.5 2.0 39.0 Thailand 99.3 99.0 100.0 Timor-Leste 22.0 10.5 52.0 Togo 20.0 4.0 42.0 Tonga 92.3 90.7 97.7 Trinidad and Tobago 99.0 99.0 99.9 Tunisia 99.5 98.5 100.0 Turkey 100.0 100.0 100.0 Tuvalu 98.0 95.0 100.0 Uganda 9.0 4.0 42.5 United Arab Emirates 100.0 100.0 100.0 Uruguay 99.5 82.4 99.4 Vanuatu 19.0 7.0 61.0 Venezuela 99.0 85.0 100.0 Viet Nam 89.0 85.0 99.6 Yemen 38.2 22.0 75.0 Zambia 18.8 3.3 47.0 Zimbabwe 41.5 19.0 79.0
Source: Sovacool (2011)
C. Energy Access as an Energy Security Concern Energy poverty and deprivation result in four major, interrelated, negative energy security consequences: poverty, death, gender inequality, and environmental degradation.
1. Poverty and Economic Security
Poverty and energy deprivation go hand-in-hand with energy expenses, accounting for a significant proportion of household incomes in many developing countries. Generally, 20%–30% of annual income in poor households is directly expended on energy fuels, and an additional 20%–40% is expended on indirect costs associated with collecting and using that energy such as healthcare costs, injuries, or loss of time. As a result, the poor pay on average eight times more for the same unit of energy than other income groups.14 In extreme cases, some of the poorest households directly spend 80% of their incomes obtaining cooking fuels.15 For example, one study looking at Asia noted that the poor typically pay more for energy needs yet receive poorer quality energy services due to inefficient and more polluting technologies with higher upfront costs as Figure 1 illustrates.16
14 Hussain (2011). 15 Masud, Sharan, and Lohani (2007). 16 Modi et al. (2006); WHO (2006).

8 І ADB Economics Working Paper Series No. 383
Figure 1: Energy Access according to Poorest and Richest Quintiles in Selected Countries
PRC = People’s Republic of China. Sources: Modi et al. (2005) and WHO (2006)
Table 5: Gross Domestic Product per capita and Energy Consumption and Poverty in Selected Countries, 2002
Country
Gross Domestic Product per
capita
Electricity Consumption per
capita (kilowatt hour)
Commercial Energy Consumption per capita (kilogram of oil equivalent)
Population below the National
Poverty Line (%)United States 36,006 13,241 7,725 – Japan 31,407 8,203 3,730 – Rep. of Korea 10,006 6,632 3,284 – Brazil 2,593 2,122 717 17.4 People’s Rep of China 989 1,139 561 4.6 South Africa 2,299 4,313 2,649 – India 487 561 318 28.6 Ghana 304 404 120 39.5 Uganda 236 66 26 44.0 Kenya 393 140 96 52.0 Senegal 503 151 128 33.4 Malawi 177 76 27 65.3 Chad 240 12 5 64.0 Ethiopia 90 30 29 44.2 Mali 296 34 18 63.8 Niger 190 41 33 63.0
– = not available.” Source: Modi et al. (2006)
0
20
40
60
80
100
Bangladesh Brazil Cote d'Iviore
PRC Ethiopia Ghana India Jamaica Mexico Nicaragua Nepal Pakistan Panama Russian Federation
South Africa
Viet Nam
Perc
enta
ge d
epen
dent
on
trad
itio
nal
fuel
s
Poorest quintile
Richest quintile

Energy Access and Energy Security in Asia and the Pacific І 9
As Table 5 also shows, the relationship between energy consumption and quality of life is almost monotonic with the countries with the highest gross domestic products (GDPs) also with the greatest access to energy. Conversely, lack of electricity limits the productive hours of the day for business owners and heads of households and also inhibits the types of business opportunities available.17
2. Household Health Crisscrossing numerous household domains including maternal health, infant mortality, and disease epidemics, energy poverty has serious and growing public health concerns related to indoor air pollution (IAP), physical injury during fuelwood collection, and lack of refrigeration and medical care in areas that lack electricity. By far the most severe of these is IAP. Most families without access to modern forms of energy cook and combust fuels directly inside their homes. Burning firewood, dung, and charcoal is physiologically damaging as it is like living within a giant smoking cigarette. Nearly 75% of people living in rural areas and 45% of the entire global population rely on wood and solid fuels for cooking,18 yet as WHO explains:
The inefficient burning of solid fuels on an open fire or traditional stove indoors creates a dangerous cocktail of not only hundreds of pollutants, primarily carbon monoxide and small particles, but also nitrogen oxides, benzene, butadiene, formaldehyde, polyaromatic hydrocarbons, and many other health-damaging chemicals.19 There is a damaging spatial and temporal dimension to such pollution. Spatially, it is
concentrated indoors in small rooms and kitchens so that many homes have exposure levels to harmful pollutants 60 times greater than the rate acceptable outdoors in city centers in North America and Europe.20 Temporally, the pollution from stoves is released at precisely the time when people are present cooking, eating, or sleeping, with a typical woman spending 3–7 hours a day in the kitchen.21
Even when homes have chimneys and cleaner burning stoves (and most do not),
combustion from solid fuels can result in acute respiratory infections, tuberculosis, chronic respiratory diseases, lung cancer, cardiovascular disease, asthma, low birth weights, diseases of the eye, and adverse pregnancy outcomes and can cause outdoor pollution in dense urban slums that can make air unfit to breathe and water undrinkable.22 Table 6 shows the most common, well established health impacts of IAP.23
Strikingly, IAP ranks fourth on the global burden of disease risk factors at almost 5%
following high blood pressure (almost 8%), tobacco smoking and secondhand smoke (about 7%), and alcohol use (about 6%).24 It far outranks physical inactivity and obesity, drug use, and unsafe sex. In India and all of South Asia, cookstove smoke is the highest risk factor outranking smoking tobacco and high blood pressure. It ranks second in Sub-Saharan Africa, third in Southeast Asia, and fifth in East Asia. Air pollution from conventional cookstoves is therefore
17 Modi et al. (2006), p. 19. 18 Legros et al. (2009). 19 World Health Organization (2006). 20 Ibid. 21 Masud, Sharan, and Lohani (2007). 22 Jin et al. (2006). 23 World Health Organization (2006). 24 Lim et al. (2006).
10 І ADB Economics Working Paper Series No. 383
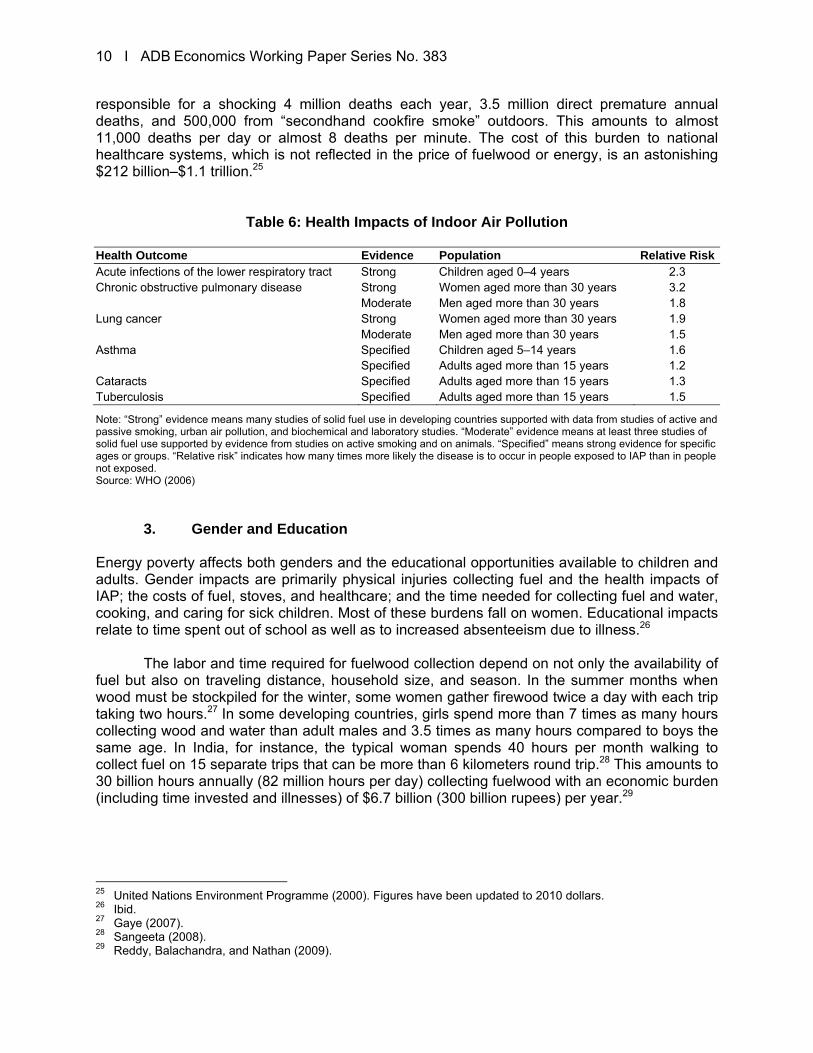
responsible for a shocking 4 million deaths each year, 3.5 million direct premature annual deaths, and 500,000 from “secondhand cookfire smoke” outdoors. This amounts to almost 11,000 deaths per day or almost 8 deaths per minute. The cost of this burden to national healthcare systems, which is not reflected in the price of fuelwood or energy, is an astonishing $212 billion–$1.1 trillion.25
Table 6: Health Impacts of Indoor Air Pollution
Health Outcome Evidence Population Relative RiskAcute infections of the lower respiratory tract Strong Children aged 0–4 years 2.3 Chronic obstructive pulmonary disease Strong Women aged more than 30 years 3.2
Moderate Men aged more than 30 years 1.8 Lung cancer Strong Women aged more than 30 years 1.9
Moderate Men aged more than 30 years 1.5 Asthma Specified Children aged 5–14 years 1.6
Specified Adults aged more than 15 years 1.2 Cataracts Specified Adults aged more than 15 years 1.3 Tuberculosis Specified Adults aged more than 15 years 1.5
Note: “Strong” evidence means many studies of solid fuel use in developing countries supported with data from studies of active and passive smoking, urban air pollution, and biochemical and laboratory studies. “Moderate” evidence means at least three studies of solid fuel use supported by evidence from studies on active smoking and on animals. “Specified” means strong evidence for specific ages or groups. “Relative risk” indicates how many times more likely the disease is to occur in people exposed to IAP than in people not exposed. Source: WHO (2006)
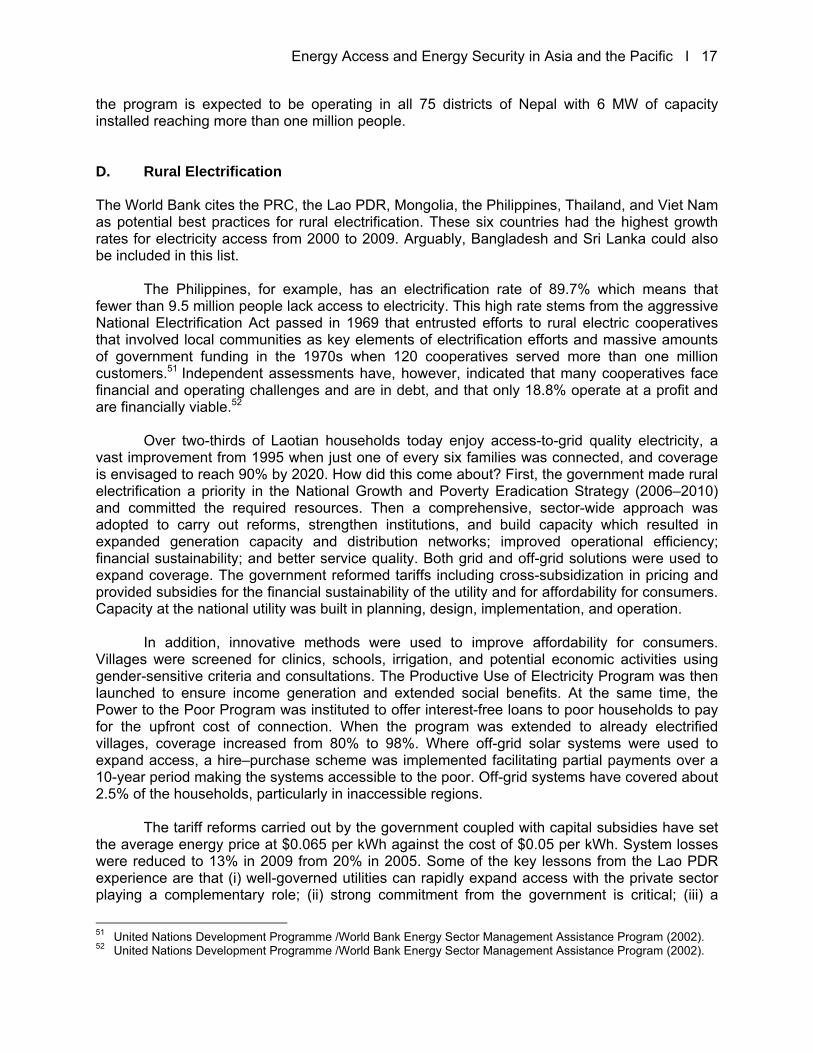
3. Gender and Education
Energy poverty affects both genders and the educational opportunities available to children and adults. Gender impacts are primarily physical injuries collecting fuel and the health impacts of IAP; the costs of fuel, stoves, and healthcare; and the time needed for collecting fuel and water, cooking, and caring for sick children. Most of these burdens fall on women. Educational impacts relate to time spent out of school as well as to increased absenteeism due to illness.26
The labor and time required for fuelwood collection depend on not only the availability of
fuel but also on traveling distance, household size, and season. In the summer months when wood must be stockpiled for the winter, some women gather firewood twice a day with each trip taking two hours.27 In some developing countries, girls spend more than 7 times as many hours collecting wood and water than adult males and 3.5 times as many hours compared to boys the same age. In India, for instance, the typical woman spends 40 hours per month walking to collect fuel on 15 separate trips that can be more than 6 kilometers round trip.28 This amounts to 30 billion hours annually (82 million hours per day) collecting fuelwood with an economic burden (including time invested and illnesses) of $6.7 billion (300 billion rupees) per year.29
25 United Nations Environment Programme (2000). Figures have been updated to 2010 dollars. 26 Ibid. 27 Gaye (2007). 28 Sangeeta (2008). 29 Reddy, Balachandra, and Nathan (2009).

Energy Access and Energy Security in Asia and the Pacific І 11
In addition, current energy production entails occupational hazards that almost uniquely affect women as they suffer frequent falls, backaches, bone fractures, eye problems, headaches, rheumatism, anemia, and miscarriages from carrying weights of 40–50 kg which is nearly equal to their body weights. The energy needs of rural women can be further marginalized if men control community forests, plantations, or woodlots and if there are other “high value” wood demands on the community that displace their foraging grounds for fuel.30
The educational impacts of energy poverty include absenteeism and increased illness.
Numerous medical studies have documented a strong connection between the effects of IAP and acute respiratory infections in children which is the principal cause of absence from school in many countries. Modern energy access can therefore improve both education and gender equality as shown in Table 7 which depicts a variety of ways it can enhance the status of women by saving time and improving health.
Table 7: Benefits of Modern Energy Services for Women
BenefitsEnergy Source Practical Productive StrategicElectricity Pumping water, reduced need to
haul and carry mills for grinding, improved conditions at home through lighting
Increased possibility of activities during evening hours, refrigeration for food production and sale, power for specialized enterprises and small businesses
Safer streets, participation in evening classes, access to radio, television, and the Internet
Biomass (improved cookstoves)
Improved health, less time and effort gathering fuelwood, more time for childcare
More time for productive activities, lower cost of space and process heating
Improved management of natural forests
Mechanical Milling and grinding, transport and portering of water and crops
Increased variety of enterprises Access to commercial, social, and political opportunities
Source: Masud, Sharan, and Lohani (2007) For instance, one study in the Philippines noted that the odds of being illiterate are far
greater for people without electric lighting.31 Energy services can also enable schools to recruit and retain better qualified teachers.32 Lighting from solar and microhydro technologies can extend the time children have to study at night and can also equip schools with computers and the Internet.
4. Deforestation and Climate Change
The environmental impacts of energy poverty include deforestation and changes in land use as well as greenhouse gas (GHG) emissions and black carbon. Because billions of people rely on biomass for cooking and heating, about 2 million tons of it is burned every day.33 Where wood is scarce or the population is dense, reforestation does not match the demand for fuel resulting in deforestation, desertification, and land degradation. Even when trees are not felled, collecting dung, branches, shrubs, roots, twigs, leaves, and bark can deplete forest ecosystems and soils of much needed nutrients.34 When wood supplies are scarce, people often switch to burning 30 Murphy (2001). 31 Porcaro and Takada (2005). 32 Ibid. 33 World Health Organization (2006). 34 Alam, Islam, and Huq (2000); Islam and Weil (2000).

12 І ADB Economics Working Paper Series No. 383
crops which threatens food security, and the deforestation and erosion caused by harvesting reduce the fertility of surrounding fields. One recent assessment attributed 6% of global deforestation to fuelwood collection.35
In Bangladesh for example, trees and bamboo meet about 48% of all domestic energy
requirements followed by agricultural residues at 36% and dung at 13%.36 The destruction of forests to satisfy energy needs has reduced homestead forest cover to 8% of its original area37 and natural forests by 50% in a single generation.38 Similarly, about 4% of standing forests in the PRC are used for fuelwood and roughly 13% of cultivated land is used to grow fuelwood.39
Apart from environmental damage, fuelwood-driven deforestation increases the burden
on collectors and farmers and increases fuel prices. As stockpiles are depleted, women and children must travel longer distances to collect fuel which requires more time and energy, and fuel collection often interferes with farming and other rural livelihoods that rely on trees for income.40 Deforestation also causes significant price increases for fuelwood. As deforestation in Bangladesh has accelerated, the demand for wood has outpaced supply causing the price to increase from $0.35 per bundle in 1980 to $1.27 per bundle in 1991 and $1.69 per bundle in 2007, which is nearly 50% of the typical rural annual household budget.41
Burning solid fuels in open fires and traditional stoves has significant effects on global
warming due to the release of methane and carbon dioxide.42 Relying on biomass fuels and coal for cooking and heating is responsible for about 10% to 15% of global energy use making it a substantial source of GHG emissions.43 One study projected that by 2050 the smoke from wood fires will release about 7 billion tons of GHGs into the atmosphere.44
D. The Energy Development Index The IEA energy development index is composed of four indicators each of which “captures a specific aspect of potential energy poverty:”
Per capita commercial energy consumption which serves as an indicator of overall
economic development;
Per capita electricity consumption in the residential sector which serves as an indicator of the reliability of and consumer’s ability to pay for electricity services;
Share of modern fuels in total residential sector energy use which serves as an indicator of the level of access to clean cooking facilities;
Share of population with access to electricity.45
35 Velumail (2011). 36 Miah, Rashid, and Shin (2009). 37 Ibid. 38 Peios (2004). 39 Chan (2000). 40 van der Horst and Hovorka (2008). 41 Biswas, Bryce, and Diesendorf (2001). 42 Legros et al. (2009). 43 World Health Organization (2006). 44 Gaye (2007). 45 International Energy Agency (2011a).

Energy Access and Energy Security in Asia and the Pacific І 13
The latest results from the index suggest that energy poverty will remain a pertinent global issue over the next 30 years. Five of the “bottom 30 countries” are in Asia: Cambodia, the Lao People’s Democratic Republic (Lao PDR), Myanmar, Nepal, and Papua New Guinea. When projecting the future in the World Energy Outlook 2012, IEA estimated that almost 1 billion people will still be without electricity by 2030 and that 2.6 billion people will still be without clean cooking facilities.46 In 2030, the number of people without clean cooking technologies in India will amount to twice the population of the United States (US), and overall the IEA forecast is that 39% of people in Asia and the Pacific will lack access to modern cooking.
III. FINANCING SUSTAINABLE ENERGY FOR ALL
Although the technologies for providing sustainable energy for all (SE4ALL)—electricity networks, diesel generators, improved cookstoves, microhydro dams, solar home systems, small-scale wind turbines, biogas digesters—are well understood, they need financial and institutional support to succeed. Achieving modern energy access requires technologies, financing instruments, and financing sources.47 A. Projections for Financing Required to Achieve Universal Energy Access In assessing the costs involved in universally extending access to energy services, IEA estimated in 2009 that $9.1 billion was invested globally and that in the absence of any new policies or directions, the amount would rise to about $14 billion each year from 2010 to 2030. Most of this will be for extending national grids to urban areas. This level of investment—$280 billion over 20 years—may sound significant, but it will still leave about 1 billion people without electricity by 2030. Shockingly, with this investment, the number of people without clean cooking facilities will stay the same at 2.7 billion due to population growth. IEA also estimated that about $76 billion would be required to achieve universal access to clean cooking fuels by 2030 (an average of $3.8 billion per year) and almost $1 trillion would be needed for universal access to energy and electricity (an average of $50 billion per year). That means the level of investment in 2009 must increase rapidly by a factor of five, but as of 2012, only 3% of the total needed had been committed.
To reach these targets, IEA found that there is a role for numerous technologies and for
both renewables and fossil fuels. Extending grids is the most suitable option for all urban areas and for around 30% of rural areas, but it is not a cost-effective option in more remote rural areas. Therefore, the remaining 70% of rural areas will have to be connected either with mini-grids (65% of this share) or with small, stand-alone, off-grid solutions (35%). Globally, it is estimated that to ensure universal electricity access by 2030, out of a total generation requirement of 952 terawatt hours, 60% (572 terawatt hours) will be provisioned via mini-grid and isolated off-grid technology (Table 8). More interestingly, developing Asia accounts for almost two-thirds of the total additional investment required for clean cooking facilities, primarily ($26 billion) for biogas systems principally in the PRC and India.
46 International Energy Agency (2012). 47 International Energy Agency (2011b).

14 І ADB Economics Working Paper Series No. 383
Table 8: Generation Requirements for Universal Electricity Access, 2030 (terawatt hours)
On-Grid Mini-Grid Isolated Off-Grid TotalAfrica 196 187 80 463 Developing Asia 173 206 88 468 People’s Republic of China 1 1 0 2 India 85 112 48 245 Other Asian Countries 87 94 40 221 Latin America 6 3 1 10 Developing Countries* 379 3,993 171 949 World 380 400 172 952
Note: * Includes countries in the Middle East. Source: IEA 2011b
Using different timeframes, and methodologies, the International Institute for Applied
Systems Analysis Global Energy Assessment projects the need for $36 billion to $41 billion per year to achieve universal access to electricity and clean cooking, $259 billion to $406 billion to promote renewables, and an additional $258 billion to $365 billion per year to achieve energy efficiency improvements.48 These estimates are summarized in Table 4.9. Table 9: Annual Investments Required to Achieve Sustainable Energy for All Objectives
($ billion in 2005)
Present (2010) 2010–2030
Annual Energy Investments in…
Innovation RD&D
Markets Formation
Present Investment
Annual Investment Required to Meet SE4All
Goals Efficiency >>8 ~5 300 258–365 Renewables >12 ~20 200 259–406 Access <1 <1 ~9 36–41
All Energy Infrastructure
>50 <150 1,250 1,260–1,680
~ = refers to approximate estimates. RD&D = research, development, and demonstration, SE4ALL = sustainable energy for all. Source: IIASA
B. The Pro-Poor Public–Private Partnership Model The pro-poor public–private partnership (5P) model is one useful vehicle for raising capital to finance energy access projects. Public–private partnerships have been widely used as a mechanism for engaging the private sector to deliver the infrastructure requirements of a state or of a quasi-government body. The underlying logic for establishing such partnerships is that both the public and the private sectors have unique characteristics that give them advantages in specific aspects of service or project delivery. These partnerships are characterized by sharing investments, responsibilities, risks, and rewards among partners.
48 Riahi et al. (2012).

Energy Access and Energy Security in Asia and the Pacific І 15
Drawing on and expanding this logic, the 5P model has evolved to explicitly target poor communities that are often ignored by traditional public–private partnerships since supplying the poor can involve substantial business risks. As Figure 2 illustrates, the 5P model views the poor not only as consumers that receive benefits but also as partners in business ventures. It lies between profit-oriented public–private partnerships and socially oriented grants and expands beyond the private sector to include development banks, equipment manufacturers, rural energy service companies, philanthropic organizations, community-based organizations, cooperatives, and households themselves. Each of these groups plays a different role: private sector participants can meet their corporate social responsibility obligations, utilities and energy companies can fulfill their obligations to deliver basic services, and communities and members of civil society can expand access to basic services. As United Nations Development Programme defines it, a 5P is one that, “…increases access of the poor to basic services by promoting inclusive partnerships between local government, businesses, community groups, nongovernment organizations, faith-based organizations, and others.”49
Figure 2: The Pro-Poor Public–Private Partnership Model
PPP = public–private partnership. Source: Author.
The 5P model differs from an ordinary public–private partnership in three ways.
It is participatory and involves a broad number of institutions instead of only one or two
(government or government plus donor).
The priority is social and economic development to help the poor, not necessarily to make a profit contrary to how most corporations and electric utilities operate.
49 United Nations Development Programme (2011).
Commercial
Non commercial
Grants
Empowerment
Profit oriented
Cost recovery
Market driven tariffs
Social and non-profit enterprises
5P Approach
Normal PPPs
Results oriented Philanthropy driven
Community participationAwareness and educationSocial development
Hybrid

16 І ADB Economics Working Paper Series No. 383
It is inherently cooperative rather than competitive and attempts to get partners to work together. One example of the 5P approach is the Cinta Mekar microhydro project in West Java,
Indonesia. The 120 kilowatt facility was built by a partnership of public, private, and community organizations, and the energy has been used to electrify village homes and produce revenue through exports to the national grid. Profits from the project are split equally between a private company, Hidropiranti Inti Bakti Swadaya, and the community itself represented by a village cooperative. Each month the hydro scheme generates about $3,300 of gross income that is then channeled back to its investors.50
C. Household Needs and Off-Grid Programs Other types of public–private partnerships have attempted to expand energy access for household needs and through off-grid technologies. In 2006 and 2007, Indonesia created the Liquefied Petroleum Gas (LPG) Conversion Program as a substitute for kerosene in Indonesian households. It appointed the Ministry of Energy and Mineral Resources to lead the program and Pertamina, the state-owned oil and natural gas utility, as the sole program executor. Its initial goal was to convert 42 million households and micro-businesses nationally over 4 years. Under the program, every eligible household was given a 3-kg LPG canister, a coupon to fill that canister once for free, a single-burner stove, a hose, and a regulator. Pertamina conducted market assessments and built pressurized LPG terminals and filling stations to ensure reliability. In less than 3 years, Pertamina had distributed initial packages to more than 44 million households and small and medium-sized enterprises. Pertamina withdrew 5.3 million kiloliters of kerosene in 2009 and replaced it with 1.85 million tons of LPG, and Indonesia was able to save $3 billion in decreased kerosene subsidies as of May 2010.
In Nepal, The UNDP Rural Energy Development Program offers an excellent example of
how to rapidly diffuse microhydro facilities ranging from 10 to 100 kilowatts (kW) with an average plant size of 25–30 kW. Program implementation was decentralized to local governments where district development committees and village development committees formed microhydro functional groups. The Alternative Energy Promotion Center, an autonomous body established in 1996 under the Ministry of Science and Technology, assumed overall management. The intended benefit was to provide customers currently dependent on kerosene and other fuels for lighting with reliable electricity. A secondary benefit came from promoting end-use activities such as cereal milling, rice husking, and mustard seed processing as well as replacing manual implements for carpentry with electrical machines and tools, though to prevent deforestation, project financing could not be used for sawmills. The program required communities wishing to build microhydro facilities to donate land for the construction of canals, penstocks, power houses, and distribution lines. Furthermore, villagers were required to contribute labor for related civil works.
As a result of these efforts, microhydro system coverage grew from only a few thousand
homes in 25 districts in 2003 to 40 out of 51 target districts and 40,000 households in 2007 and more than 50,000 homes as of November 2010. The number of microhydro projects also jumped from 29 in 2003 to 280 in mid-2010. As of December 2007, a total of more than 90 projects with 1.5 megawatts (MW) of capacity had been completed providing access to 16,914 households meeting the original project goals almost 18 months ahead of schedule. By 2012,
50 Tumiwa, Rambitan, and Tanujaya (2009).
Energy Access and Energy Security in Asia and the Pacific І 17
the program is expected to be operating in all 75 districts of Nepal with 6 MW of capacity installed reaching more than one million people.
D. Rural Electrification The World Bank cites the PRC, the Lao PDR, Mongolia, the Philippines, Thailand, and Viet Nam as potential best practices for rural electrification. These six countries had the highest growth rates for electricity access from 2000 to 2009. Arguably, Bangladesh and Sri Lanka could also be included in this list.
The Philippines, for example, has an electrification rate of 89.7% which means that
fewer than 9.5 million people lack access to electricity. This high rate stems from the aggressive National Electrification Act passed in 1969 that entrusted efforts to rural electric cooperatives that involved local communities as key elements of electrification efforts and massive amounts of government funding in the 1970s when 120 cooperatives served more than one million customers.51 Independent assessments have, however, indicated that many cooperatives face financial and operating challenges and are in debt, and that only 18.8% operate at a profit and are financially viable.52
Over two-thirds of Laotian households today enjoy access-to-grid quality electricity, a
vast improvement from 1995 when just one of every six families was connected, and coverage is envisaged to reach 90% by 2020. How did this come about? First, the government made rural electrification a priority in the National Growth and Poverty Eradication Strategy (2006–2010) and committed the required resources. Then a comprehensive, sector-wide approach was adopted to carry out reforms, strengthen institutions, and build capacity which resulted in expanded generation capacity and distribution networks; improved operational efficiency; financial sustainability; and better service quality. Both grid and off-grid solutions were used to expand coverage. The government reformed tariffs including cross-subsidization in pricing and provided subsidies for the financial sustainability of the utility and for affordability for consumers. Capacity at the national utility was built in planning, design, implementation, and operation.
In addition, innovative methods were used to improve affordability for consumers.
Villages were screened for clinics, schools, irrigation, and potential economic activities using gender-sensitive criteria and consultations. The Productive Use of Electricity Program was then launched to ensure income generation and extended social benefits. At the same time, the Power to the Poor Program was instituted to offer interest-free loans to poor households to pay for the upfront cost of connection. When the program was extended to already electrified villages, coverage increased from 80% to 98%. Where off-grid solar systems were used to expand access, a hire–purchase scheme was implemented facilitating partial payments over a 10-year period making the systems accessible to the poor. Off-grid systems have covered about 2.5% of the households, particularly in inaccessible regions.
The tariff reforms carried out by the government coupled with capital subsidies have set
the average energy price at $0.065 per kWh against the cost of $0.05 per kWh. System losses were reduced to 13% in 2009 from 20% in 2005. Some of the key lessons from the Lao PDR experience are that (i) well-governed utilities can rapidly expand access with the private sector playing a complementary role; (ii) strong commitment from the government is critical; (iii) a
51 United Nations Development Programme /World Bank Energy Sector Management Assistance Program (2002). 52 United Nations Development Programme /World Bank Energy Sector Management Assistance Program (2002).

18 І ADB Economics Working Paper Series No. 383
combination of pricing and incentive mechanisms is necessary for financial sustainability and consumer affordability; (iv) strong commitment and capacity are a requisite for program managers; and (v) innovative, customized solutions are often required to reach the poor.
Even though they did not make the World Bank list, Bangladesh and Sri Lanka are also
interesting cases. In 1971, 3% of the total population of Bangladesh had access to electricity; today, approximately 53% has access. This success story is the result of a rural electrification program started in 1978 that created 70 rural cooperatives through which more than 50 million people are served.
At the end of the protracted civil war, Sri Lanka overwhelmingly re-elected President
Mahinda Rajapaksa handing him a strong mandate to heal the country, rebuild the economy, and accelerate development. This has included an aggressive national electrification effort that has already connected more than 90% of households to the grid with an ambitious target of universal access to electricity between 2012 and 2015.
E. Policy Recommendations Based on the experiences in these case studies as well as those summarized by other research from the National University of Singapore53 and UNDP, at least five factors appear to be necessary in combination for programs and partnerships to successfully promote energy access and eradicate energy poverty.
1. Select Appropriate Technology Successful programs frequently start small with pilot projects or with feasibility studies before initiating full-scale projects and scaling up to greater production or distribution volumes. They almost always choose appropriate technologies matched in quality and scale to the energy service desired. They set technical standards so only high-quality systems enter the marketplace, and they often possess culturally sensitive dissemination programs.
Feasibility studies and piloting are useful ways to identify market segments and
determine if enough demand exists for renewable energy systems. Successful programs also have an orientation towards energy services matched in quality to end uses rather than technological deployment; they recognize technology not as an end itself but as a gateway to a particular energy service. The point is that different classes of people will put energy to use in different ways. In their work on energy poverty, Pachauri and Spreng (2008) identified numerous groups of people:
tribal people and leaders; rural unemployed; landless peasants; traditional merchants and craft makers; peasants with small farms; the urban poor; servants; and blue-collar employees.54
53 See Sovacool and Drupady (2012). 54 Pachauri and Spreng (2008).
Energy Access and Energy Security in Asia and the Pacific І 19
For these various groups, the services that energy delivers are far more important than the carrier itself. What matters is the relative importance users attach to it.55 A successful renewable energy project not only considers the appropriateness of the technology diffused for the needs of the target communities but also anticipates how these needs will change and grow over time and facilitates the transition to larger wattages or different technologies. As Amory Lovins mused many decades ago, “People do not want electricity or oil, nor such economic abstractions as ‘residential services’ but rather comfortable rooms, light, vehicular motion, food, tables, and other real things.”56
Furthermore, programs that work tend to promote or harmonize rigorous technical
standards to ensure renewable energy technologies perform as expected. This underscores the reliability component of energy access, and it also serves as a meaningful form of consumer protection. As one village leader told the author:
People will pay for energy services, just not for unreliability or unpredictability; they won’t pay for electricity that is on when they don’t need it or off when they do need it. Nor will they pay for electricity that has such erratic fluctuations in voltage that it fries appliances—that’s what they don’t want to pay for. But reliable, efficient service—yes, they want that. Thus, successful programs strengthened technology in tandem with institutions and
community awareness. 2. Promote Community Participation
Effective programs actively promote community ownership; in-kind contributions of labor, time, and other resources; and participatory decision making and planning. They tend to target minority groups in rural areas (such as female heads of households or children). They do not “give away” renewable energy technologies or over-subsidize technology or research. In essence, these attributes ensure that households become involved in projects and that key stakeholders remain active.
Most of the successful case studies had local communities pay for renewable energy
systems themselves and also saw local households or village leaders operate the technology. The projects had very high payback rates with more than 90%–99% of households repaying loans on time. Having local communities pay for renewable energy projects with their own funds means they expressed interest in and took responsibility for how the projects performed. They became not only passive consumers but active participants. As one respondent explained, “Classically, energy planners have seen the access question as one involving ‘givers’ and ‘takers’: the utility giving electricity or donors giving technology and the consumers taking it. This completely places the energy provider and consumer into a false dichotomy, one that successful programs break.”
Contributions do not necessarily have to be financial. Communities and households can
donate time (digging a canal), land (free property for the project site), or resources (wood for distribution poles). As the World Bank has noted, “Participation of local communities, investors, and consumers in the design and delivery of energy services is essential.”57
55 Van Der Vleuten, Stam, and Van Der Plas (2007). 56 Lovins (1976). 57 World Bank (1996).

20 І ADB Economics Working Paper Series No. 383
3. Emphasize Maintenance and After-Sales Service Successful programs strongly emphasize after-sales service and maintenance ensuring that technologies are cared for by rural populations or technicians. This can occur on the supply side through product guarantees, warranties, and assurances to buyback systems if communities are connected to the grid or on the demand side through training and free maintenance.
Once Grameen Shakti technicians in Bangladesh sell and install a solar home system,
for example, they do not leave it up to the consumer to care for it. Grameen Shakti runs a buyback program in which clients can return their systems at a reduced price to the organization, and it gives free maintenance and training to all existing clients so that they can care and maintain their systems by themselves. They teach each user how to properly maintain the system and conduct minor repairs and also offer a free warranty for the first few years of operation. They view the needs of households and customers as “never ending” and train hundreds of technicians each year in renewable energy maintenance and the manufacturing of selected components.
The Renewable Energy Development Project in the PRC explicitly devolved
maintenance authority to dealers. The Rural Electrification Project in the Lao PDR ensured that maintenance and battery replacement were formal parts of each program with responsibility clearly delegated to private sector participants. The Rural Energy for Access Project in Mongolia gave financial support for after-sales service call centers and the establishment of warranties. It created new centers to help herders maintain their systems, provide advice on battery charging, distribute spare parts, and honor warranties. The Renewable Energy Development Project in Nepal and the Energy Services Delivery Project in Sri Lanka utilized funds to hold microhydro maintenance training sessions. In Nepal, a small amount of every electricity tariff goes into a mandatory maintenance fund. In Sri Lanka, the project supported the creation of 80 permanent service and distribution centers with $5 million committed from the private sector.58
4. Couple Energy Services with Incomes
More effective programs couple and cultivate energy services with income generation and employment; they don’t just wait for it to happen. They also sometimes offer scholarships and university training.
Grameen Shakti in Bangladesh offers a scholarship competition for the children of solar
home system owners. It sponsors technical degrees in engineering and related fields for employees who commit to staying with the organization long term and has also done an excellent job linking its products and services to other local businesses and integrating its technologies with other programs. As one example, it connects the use of biogas units in homes and shops with the livestock, poultry, agriculture, and fishery industries. Clients wishing to own their own biogas unit can also purchase livestock, and clients who do not wish to use the fertilizer created as a byproduct from biogas units can sell it to local farmers, aquaculturists, and poultry ranchers. Similar links have been made in promoting Grameen Shakti solar panels, mobile telephones, compact fluorescent lamps, and light-emitting diode devices.
58 These details are all summarized in Sovacool and Drupady (2012); Sovacool and Dworkin (2012); Sovacool
(2012a and 2012b).

Energy Access and Energy Security in Asia and the Pacific І 21
The Renewable Energy Development Project in the PRC offered nomadic herders tips on how they could use solar electricity not only for lighting but also to separate milk and cheese, charge mobile phones, and refrigerate yoghurt. In the Lao PDR, services put to use by solar panels have increased the business of restaurants, hotels, teahouses, and shops. In Mongolia, improved access to cellular telephony from the Rural Energy for Access Project has enabled herders to get better commodity prices for cashmere, meat, livestock, cheese, milk, yoghurt, and curd. In Nepal, the Renewable Energy Development Project has linked microhydro energy and the promotion of non-lighting uses of electricity including agro-processing, poultry farming, carpentry workshops, bakeries, ice making, lift irrigation, and water supply. In Sri Lanka, the Energy Services Delivery Project motivated many homeowners to begin new enterprises such as selling baked goods and vegetables and existing shop owners to extend their operating hours after dusk.
The key lesson here is that successful programs did not just supply energy or electricity
presuming people would know how to use it. They instead taught them how to put that energy to productive use. In essence, these projects succeeded because they promoted the types of economic activities that go hand-in-hand with modern energy enabling communities to form strong livelihood groups, to process agricultural commodities and crops, and to sustain small businesses and enterprises such as bars and restaurants.59
5. Build Local Capacity
Effective programs undertake capacity building, including strengthening the technical or managerial capacity of private and public firms, and educating villagers and communities about productive energy uses. Planners can neglect to build capacity because they think that their institutions already have sufficient expertise, because they choose to focus on the simpler act of deploying technology instead of the more difficult act of building human institutions, or in rare cases because of bias and corruption. Effective interventions have built private sector capacity through basic research grants; manufacturing and production loans; and efforts to standardize, certify, and test technology. Programs train staff at rural electricity companies, cooperatives, and manufacturers in setting tariffs, metering, billing, managing revenue, accounting, and auditing as well as in formulating business plans and advertising and marketing. Other private sector support can include staff recruitment and education, establishing rural outlets, and expanding inventory.
Public sector capacity can be strengthened by recruiting new staff, devising
electrification and renewable energy deployment master plans, operating databases and new computer systems, and conducting feasibility studies and resource assessments. Assistance can enhance the ability to monitor and evaluate projects, to report results, arrange bulk purchases, and create or upgrade government research and testing laboratories. Community programs can educate households about energy and income generation.
In short, successful programs all undertook some degree of capacity building. Variants
of this lesson include strengthening the technical or managerial capacity of domestic firms and institutions; outsourcing to international consultants when capacity is lacking; awarding research grants to manufacturers; improving the business practices of participating organizations; and emphasizing commercial viability and the ultimate goal of self-sustaining local markets for renewable energy and off-grid technology.60
59 Jooijman-van Dijk and Clancy (2010). 60 Magradze, Miller, and Simpson (2007).

REFERENCES Alam, M. S., K. K. Islam, and A. M. Z. Huq. 2000. Simulation of Rural Household Fuel
Consumption in Bangladesh. Energy 24(8):743–752. Barnes, Douglas F. and Willem M. Floor. 1996. Rural Energy in Developing Countries: A
Challenge for Economic Development. Annual Review of Energy and Environment 21:497–530.
Bazilian, Morgan, Ambuj Sagar, Reid Detchon, and Kandeh Yumkella. 2010. More Heat and
Light. Energy Policy 38: 5409–5412. Bazilian, Morgan, Patrick Nussbaumer, Giorgio Gualberti, Erik Haites, Michael Levi, Judy
Siegel, Daniel M. Kammen, and Joergen Fenhann. 2010 Informing the Financing of Universal Energy Access: An Assessment of Current Financial Flows. Electricity Journal 24(7): 57–82.
Biswas, Wahidul K., Paul Bryce, and Mark Diesendorf. 2001. Model for Empowering Rural Poor
through Renewable Energy Technologies in Bangladesh. Environmental Science & Policy 4(6): 333–344.
Chan, Melissa. 2000. Air Pollution from Cookstoves: Energy Alternatives and Policy in Rural
[People’s Republic of] China. Pittsburg, PA: Carnegie Mellon University. Cook, Cynthia, Tyrrell Duncan, Somchai Jitsuchon, Anil Sharma, and Wu Guobao. 2005.
Assessing the Impact of Transport and Energy Infrastructure on Poverty Reduction. Manila: Asian Development Bank.
D’Agostino, Anthony. 2010. Energy Insecurity for ASEAN’s BoP: The Un-electrified 160 Million.
Presentation to the Energy Studies Institute-Ministry of Defence Workshop. Singapore. 5 October.
Gaye, Amie. 2007. Access to Energy and Human Development. United Nations Development
Programme (UNDP) Human Development Report Office Occasional Paper. In Human Development Report 2007/2008. New York: UNDP.
Holdren, John P., and Kirk R. Smith. 2000. Energy, the Environment, and Health. In Tord
Kjellstrom, David Streets, and Xiadong Wang, eds. World Energy Assessment: Energy and the Challenge of Sustainability. New York: United Nations Development Programme. pp. 61–110.
Hussain, Feisal. 2011. Challenges and Opportunities for Investments in Rural Energy.
Presentation to the United Nations Economic and Social Commission for Asia and the Pacific (UNESCAP) and International Fund for Agricultural Development (IFAD) inception workshop Leveraging Pro-Poor Public–Private-Partnerships (5Ps) for Rural Development. Bangkok, Thailand. 26 September.
International Energy Agency. 2004. World Energy Outlook 2004. Paris: Organisation for
Economic Co-operation and Development (OECD). ———. 2011a. The Energy Development Index

Energy Access and Energy Security in Asia and the Pacific І 23
http://www.worldenergyoutlook.org/resources/energydevelopment/measuringenergyanddevelopment/
———. 2011b. Energy for All: Financing Access for the Poor. Paris: OECD. ———. 2012. World Energy Outlook 2012. Paris: OECD. International Energy Agency (IEA), United Nations Development Programme (UNDP), United
Nations Industrial Development Organization (UNIDO). 2010. Energy Poverty: How to Make Modern Energy Access Universal? Paris: OECD.
International Institute for Applied Systems Analysis (IIASA). 2012. Global Energy Assessment.
Cambridge: Cambridge University Press. Islam, K. R., and R. R. Weil. 2000. Land Use Effects on Soil Quality in a Tropical Forest
Ecosystem of Bangladesh. Agriculture, Ecosystems and Environment 79(1): 9–16. Jin, Yinlong, Xiao Ma, Xining Chen, Yibin Cheng, Enis Baris, and Majid Ezzati. 2006. Exposure
to Indoor Air Pollution from Household Energy Use in Rural [People’s Republic of] China: The Interactions of Technology, Behavior, and Knowledge in Health Risk Management. Social Science & Medicine 62(12): 3161–3176.
Jones, Richard. 2010. Energy Poverty: How to make modern energy access universal? Special
early excerpt of the World Energy Outlook 2010 for the United Nations General Assembly on the Millennium Development Goals. Paris: International Energy Agency/OECD.
Jooijman-van Dijk, A. L., and J. Clancy. 2010. Impacts of Electricity Access to Rural Enterprises
in Bolivia, Tanzania, and Viet Nam. Energy for Sustainable Development 14(1): 14–21. Legros, Gwénaëlle, Ines Havet, Nigel Bruce, Sophie Bonjour, Kamal Rijal, Minoru Takada, and
Carlos Dora. 2009. The Energy Access Situation in Developing Countries: A Review Focusing on the Least Developed Countries and Sub-Saharan Africa. New York: World Health Organization and United Nations Development Programme.
Lim S. S., T. Vos, A. D. Flaxman, G. Danaei, K. Shibuya, H. Adair-Rohani, M. Amann, H. R.
Anderson, K. G. Andrews, M. Aryee, C. Atkinson, L. J. Bacchus, A. N. Bahalim, K. Balakrishnan, J. Balmes, S. Barker-Collo, A. Baxter, M. L. Bell, J. D. Blore, F. Blyth, C. Bonner, G. Borges, R. Bourne, M. Boussinesq, M. Brauer, P. Brooks, N. G. Bruce, B. Brunekreef, C. Bryan-Hancock, C. Bucello, R. Buchbinder, F. Bull, R. T. Burnett, T. E. Byers, B. Calabria, J. Carapetis, E. Carnahan, Z. Chafe, F. Charlson, H. Chen, J. S. Chen, A. T. Cheng, J. C. Child, A. Cohen, K. E. Colson, B. C. Cowie, S. Darby, S. Darling, A. Davis, L. Degenhardt, F. Dentener, D. C. Des Jarlais, K. Devries, M. Dherani, E. L. Ding, E. R. Dorsey, T. Driscoll, K. Edmond, S. E. Ali, R. E. Engell, P. J. Erwin, S. Fahimi, G. Falder, F. Farzadfar, A. Ferrari, M. M. Finucane, S. Flaxman, F. G. Fowkes, G. Freedman, M. K. Freeman, E. Gakidou, S. Ghosh, E. Giovannucci, G. Gmel, K. Graham, R. Grainger, B. Grant, D. Gunnell, H. R. Gutierrez, W. Hall, H. W. Hoek, A. Hogan, H. D. Hosgood III, D. Hoy, H. Hu, B. J. Hubbell, S. J. Hutchings, S. E. Ibeanusi, G. L. Jacklyn, R. Jasrasaria, J. B. Jonas, H. Kan, J. A. Kanis, N. Kassebaum, N. Kawakami, Y. H. Khang, S. Khatibzadeh, J. P. Khoo, C. Kok, F. Laden, R. Lalloo, Q. Lan, T. Lathlean, J. L. Leasher, J. Leigh, Y. Li, J. K. Lin, S. E. Lipshultz, S. London, R.

24 І ADB Economics Working Paper Series No. 383
Lozano, Y. Lu, J. Mak, R. Malekzadeh, L. Mallinger, W. Marcenes, L. March, R. Marks, R. Martin, P. McGale, J. McGrath, S. Mehta, G. A. Mensah, T. R. Merriman, R. Micha, C. Michaud, V. Mishra, K. Mohd Hanafiah, A. A. Mokdad, L. Morawska, D. Mozaffarian, T. Murphy, M. Naghavi, B. Neal, P. K. Nelson, J. M. Nolla, R. Norman, C. Olives, S. B. Omer, J. Orchard, R. Osborne, B. Ostro, A. Page, K. D. Pandey, C. D. Parry, E. Passmore, J. Patra, N. Pearce, P. M. Pelizzari, M. Petzold, M. R. Phillips, D. Pope, C. A. Pope III, J. Powles, M. Rao, H. Razavi, E. A. Rehfuess, J. T. Rehm, B. Ritz, F. P. Rivara, T. Roberts, C. Robinson, J. A. Rodriguez-Portales, I. Romieu, R. Room, L. C. Rosenfeld, A. Roy, L. Rushton, J. A. Salomon, U. Sampson, L. Sanchez-Riera, E. Sanman, A. Sapkota, S. Seedat, P. Shi, K. Shield, R. Shivakoti, G. M. Singh, D. A Sleet, E. Smith, K. R. Smith, N. J. Stapelberg, K. Steenland, H. Stöckl, L. J. Stovner, K. Straif, L. Straney, G. D. Thurston, J. H. Tran, R. Van Dingenen, A. van Donkelaar, J. L. Veerman, L. Vijayakumar, R. Weintraub, M. M. Weissman, R. A. White, H. Whiteford, S. T. Wiersma, J. D, Wilkinson, H. C. Williams, W. Williams, N. Wilson, A. D. Woolf, P. Yip, J. M. Zielinski, A. D. Lopez, C. J. Murray, M. Ezzati, M. A. AlMazroa, Z. A. Memish. 2012. A Comparative Risk Assessment of Burden of Disease and Injury Attributable to 67 Risk Factors and Risk Factor Clusters in 21 Regions, 1990–2010: A Systematic Analysis for the Global Burden of Disease Study 2010. Lancet 380:2224–2260.
Lovins, A. B. 1976. Energy Strategy: The Road not Taken. Foreign Affairs 55(1): 65. Magradze, Natalia, Alan Miller, and Heather Simpson. 2007. Selling Solar: Lessons from More
Than a Decade of Experience. Washington, DC: Global Environment Facility/International Finance Corporation.
Masud, Jamil, Diwesh Sharan, and Bindu N. Lohani. 2007. Energy for All: Addressing the
Energy, Environment, and Poverty Nexus in Asia. Manila: Asian Development Bank. Miah, Danesh, Harun Al Rashid, and Man Yong Shin. 2009. Wood Fuel Use in the Traditional
Cooking Stoves in the Rural Floodplain Areas of Bangladesh: A Socio-Environmental Perspective. Biomass and Bioenergy 33(1): 70–78.
Modi, Vijay, Susan McDade, Dominique Lallement, and Jamal Saghir. 2005. Energy Services
for the Millennium Development Goals. Washington, DC and New York: World Bank Energy Sector Management Assistance Program and United Nations Development Programme.
Murphy, James T. 2001. Making the Energy Transition in Rural East Africa: Is Leapfrogging an
Alternative? Technological Forecasting & Social Change 6: 173–193. National University of Singapore, Lee Kuan Yu School of Public Policy. 2011. Energy
Governance Case Studies. http://issuu.com/nuslkyschool/docs Pachauri, Shonali, and Daniel Spreng. 2008. Some Remarks on the Choice and Use of
Indicators of Development. Presentation to the Clean Cooking Fuels and Technologies Workshop. Istanbul. 16–17 June.
Peios, Joanna. 2004. Fighting Deforestation in Bangladesh. Geographical 76(3):14. Porcaro, Jem, and Minoru Takada. 2005. Achieving the Millennium Development Goals: The
Role of Energy Services. New York: United Nations Development Programme.

Energy Access and Energy Security in Asia and the Pacific І 25
Reddy, Sudhakara B., P. Balachandra, and Hippu Salk Kristle Nathan. 2009. Universalization of Access to Modern Energy Services in Indian Households—Economic and Policy Analysis. Energy Policy 37(11): 4645–4657.
Riahi, K., F. Dentener, D. Gielen, A. Grubler, J. Jewell, Z. Klimont, V. Krey, D. McCollum, S.
Pachauri, S. Rao, B. van Ruijven, D. P. van Vuuren, and C. Wilson. 2012. Energy Pathways for Sustainable Development. In The Global Energy Assessment: Toward a More Sustainable Future. Laxenburg, Austria: International Institute for Applied Systems Analysis (IIASA) and Cambridge University Press.
Sangeeta, K. 2008. Energy Access and its implication for women: A case study of Himachal
Pradesh, India. Presentation to the 31st International Association for Energy Economics (IAEE) International Conference Pre-Conference Workshop on Clean Cooking Fuels. Istanbul. 16–17 June.
Sovacool, B. K. 2011. Developing Public-Private Renewable Energy Partnerships to Expand
Energy Access. Bangkok: United Nations Economic and Social Commission for the Asia Pacific (UNESCAP).
———. 2012a. Deploying Off-Grid Technology to Eradicate Energy Poverty. Science
338(6103): pp. 47–48. ———. 2012b. Design Principles for Renewable Energy Programs in Developing Countries.
Energy & Environmental Science. 5 (11): 9157–9162. Sovacool, B. K. and I. M. Drupady. 2012. Energy Access, Poverty, and Development: The
Governance of Small-Scale Renewable Energy in Developing Asia. New York: Ashgate. Sovacool, B. K. and M. Dworkin. 2012. Overcoming the Global Injustices of Energy Poverty.
Environment. 54 (5): 14–28. Tumiwa, Fabby, Henriette Imelda Rambitan, and Olivia Tanujaya. 2009. Cinta Mekar Micro-
Hydro Power Plant: Giving Power to the People. Jakarta: Institute for Essential Services Reform.
United Nations Development Programme (UNDP). 2010a. Human Development Report 2010.
New York: UNDP. ———. 2010b. Energy for a Sustainable Future: The Secretary-General’s Advisory Group on
Energy and Climate Change Summary Report and Recommendations. New York: UNDP.
———. 2011. Public Private Partnerships for Service Delivery. Johannesburg, South Africa:
UNDP Capacity Development Group. United Nations Development Programme/World Bank Energy Sector Management Assistance
Program. 2002. Rural Electrification and Development in the Philippines: Measuring the Social and Economic Benefits. Washington, DC: World Bank.
United Nations Economic and Social Commission for Asia and the Pacific (UNESCAP). 2010.
Lighting up Lives: Pro-Poor Public Private Partnerships. Bangkok, Thailand: UNESCAP.

26 І ADB Economics Working Paper Series No. 383
United Nations Environment Programme (UNEP). 2000. Natural Selection: Evolving Choices for Renewable Energy Technology and Policy. New York: UNEP.
van der Horst, Greg Hiemstra and Alice J. Hovorka. 2008. Reassessing the energy ladder:
Household energy use in Maun, Botswana. Energy Policy. 36(9): 3333–3344. Van Der Vleuten, F., N. Stam, and R. Van Der Plas. 2007. Putting Solar Home System
Programs into Perspective: What Lessons Are Relevant? Energy Policy 35:1439–1451. Velumail, Thiyagarajan. 2011. Regional Context for Improving Access to Energy: Energy for
Creating and Sustaining Livelihoods. Presentation to the United Nations Economic and Social Commission for Asia and the Pacific (UNESCAP) and International Fund for Agricultural Development (IFAD) inception workshop Leveraging Pro-Poor Public-Private-Partnerships for Rural Development. Bangkok, Thailand. 26 September.
World Bank. 1996. Rural Energy and Development for Two Billion People. Washington, DC:
World Bank. World Health Organization (WHO). 2006. Fuel for Life: Household Energy and Health. Geneva:
WHO.

Energy Access and Energy Security in Asia and the Pacific
Benjamin K. Sovacool
No. 383 | December 2013
ADB Economics Working Paper Series
Energy Access and Energy Security in Asia and the PacificThis working paper explores energy access, energy poverty, and energy development as energy security concerns confronting the Asia and the Pacific region.
About the Asian Development BankADB’s vision is an Asia and Pacific region free of poverty. Its mission is to help its developing member countries reduce poverty and improve the quality of life of their people. Despite the region’s many successes, it remains home to two-thirds of the world’s poor: 1.7 billion people who live on less than $2 a day, with 828 million struggling on less than $1.25 a day. ADB is committed to reducing poverty through inclusive economic growth, environmentally sustainable growth, and regional integration. Based in Manila, ADB is owned by 67 members, including 48 from the region. Its main instruments for helping its developing member countries are policy dialogue, loans, equity investments, guarantees, grants, and technical assistance.
Asian Development Bank6 ADB Avenue, Mandaluyong City1550 Metro Manila, Philippineswww.adb.org/economics
Printed on recycled paper Printed in the Philippines