Embed Size (px)
Citation preview

J. exp. Biol. (1981), 94, 189-202 l 8 cJVith 5 figures
Urinted in Great Britain
ENERGETICS OF COCKROACH LOCOMOTION
BY CLYDE F. HERREID II, ROBERT J. FULL AND DAVID A. PRAWEL
Department of Biological Sciences, State University of New York at Buffalo,Buffalo, N.Y. 14260
(Received 25 November 1980)
SUMMARY
Cockroaches, Gromphadorhina portentosa, were run at different speeds for20 min on a miniature treadmill enclosed in a lucite respirometer whileoxygen consumption (J£),) was continuously monitored. The data collectedon these 5 g insects are remarkably similar to those obtained on vertebrates.
VOi rises rapidly with the onset of exercise; the ti on-response was about1 min with steady-state reached within 4 min at the fastest speed, 0-12 km/h.Recovery was rapid; the t± off-response was 4-6 min, with total recoveryachieved in less than 1 h. The tracheal system appears to be a highly efficientmode of O2 conductance in contrast to the crustacean method of deliveryinvolving gills and circulation.
l o (ml O2/g.h) at steady-state running varies directly with velocity (V).The regression equation at 24 °C is VOl = 0-45+4-92F. The F-intercept,at zero velocity, is 2-4 times the actual resting I^2 rate of 0-19 ml O2/g.h.Temperature does not change the slope of the regression line but shifts it upor down in accordance with a simple Q1Q effect. Incline running producesno changes compared to level running.
The minimum cost of transport, the lowest P~U2 necessary to transport agiven mass a specific distance, is high in cockroaches (4-92 ml O2/g.km)and comparable to that expected for a small quadrupedal or bipedal pedes-trian vertebrate.
INTRODUCTION
Studies on comparative locomotion of terrestrial animals have been growing byleaps and bounds. Special interest has been devoted to the field of pedestrian ener-getics since the landmark papers of Tucker (1970), Taylor, Schmidt-Nielsen & Raab(1970) and Schmidt-Nielsen (1972). In spite of recent attention to running vertebratesincluding mammals, reptiles and birds (Taylor, 1973; Fedak & Seeherman, 1979),remarkably little information is available for the great majority of animals in theworld, the invertebrates. Three papers are exceptions to the generalization: studieson the land crab, Cardisoma guanhumi (Herreid, Lee & Shah, 1979), three species ofants, Formica fusca, F. rufa and Camponotus herculeanus (Jensen & Holm-Jensen,1980), and the pulmonate slug, Ariolimax columbianus (Denny, 1980).
The studies on ants, crabs, and slugs indicate that metabolic rate as measured byoxygen consumption (VOl) or carbon dioxide production (^O2) is linearly related to
velocity of running. This is also true for vertebrate locomotion on land (Taylor7 EXB 94

190 C. F. HERREID, R. J. FULL AND D. A. PRAWEL
et al. 1970). Unfortunately, the potential usefulness of the above generalization jmarred by the fact that in none of the invertebrate studies was it possible to collecdata comparable to the steady-state running which is considered essential in vertebrateexperiments. In the case of the ants, animals were run for given periods of time andthe total CO2 produced during the exercise bout was used to calculate l{ iH (Jensen& Holm-Jensen, 1980). This procedure assumes that there is little delay in reachinga steady-state aerobic condition. However, without a continuous measurement ofj£O2, this assumption can not be verified. Nevertheless, the assumption is probablyvalid in view of the rapid response to flight demands seen in l ,2 measured for insectssuch as Drosophila (Chadwick & Gilmour, 1940). In the case of crabs and slugs wherecontinuous monitoring of VOt was possible, it was clear that neither animal attaineda steady-state. Hence, both Herreid et al. (1979) and Denny (1980) calculated theaerobic cost of running by integrating the total area under the V^ curve during andafter running to estimate aerobic cost. The inclusion of O2 debt in these calculationsdoes not seem justified when there is no evidence that the recovery O2 is a measureof energy expenditure during running. Certainly in vertebrates this position is nolonger considered valid (Brooks et al. 1971a, b; Brooks, Brauner & Cassens, 1973;Segal & Brooks, 1979; Hagberg, Mullin & Nagle, 1980).
Lack of steady-state running has forced the authors of the invertebrate experimentsto calculate a value called net cost of transport to compare with data on the minimumcost of transport determined for vertebrates (Taylor et al. 1970). These cost estimatesare reputed to be the metabolic cost required to transport a gram of animal over a1 km distance. Slugs appear to use 12 times more energy to travel a given distancethan similar-sized mammals (Denny, 1980), whereas ants and crabs are comparableto the latter (Herreid et al. 1979; Jensen & Holm-Jensen, 1980). These results mustbe viewed cautiously in view of the way VOl or l£.Oj was determined especially when0 2 debt is involved. Moreover, net cost of transport, even when calculated understeady-state conditions, is not synonymous with minimum cost of transport (cf.Taylor, 1973) and the difference between the two values rises in small animals withrelatively high metabolic rates. Also, it should be noted that small animals do notapproach the speeds necessary to attain the theoretical minimum cost of transportvalues (cf. Taylor et al. 1970).
In order to broaden our understanding of terrestrial locomotion in general, and toeliminate some of the problems plaguing earlier studies on invertebrates, we haveturned to the study of cockroaches. These animals are highly specialized for terrestriallocomotion and some, such as the case of our experimental animal, Gromphadorhinaportentosa, have lost their wings altogether. Moreover, cockroaches as representativesof the Insecta have open circulation systems, tracheal respiration, and are six-legged- a dramatic contrast to vertebrates. They seem ideal animals in which to studycomparative terrestrial locomotion, in the hope of demonstrating general principlesthat may apply to other taxa. In this paper we present data on the metabolic rate ofcockroaches running freely on a treadmill. We have measured steady-state locomotionat three different temperatures and have collected data on level and incline running.In addition, we have calculated the minimum cost of transport for comparison withvertebrates.

Cockroach locomotion energetics 191
MATERIALS AND METHODS
Animals
The experimental animals were adult male hissing cockroaches, Gromphadorhinaportentosa Schaum, weighing between 3-4 and 6-5 g. Females were not includedbecause reproduction and concomitant hormonal changes can influence metabolicrate. The animals were raised in a communal cage in an environmental chambermaintained at 25 °C, relative humidity of 75 % and given food in the form of driedpuppy chow and water ad libitum. Once experiments began, the roaches were keptindividually in small plastic containers with food and water.
Apparatus
All experiments were conducted within an airtight lucite respirometer enclosing anaxle-driven latex treadmill belt. The later was powered by a DC gear motor locatedoutside of the chamber and controlled by a veriac capable of a speed range of 0-8-30cm/sec. A switch was built into the system which allowed us to reverse the treadmillin cases where roaches turned around in the chamber. Inflow and outflow gas portsallowed for constant unidirectional circulation of fresh air into the respirometer. Roomair was continuously drawn through the 125 ml working section of the respirometerat a rate of 56 ml/min. After passing through a drierite filter to remove water vapour,gas leaving the respirometer was drawn into one sensor cell and flow meter of anS-3A Applied Electrochemistry Oxygen Analyzer which was electrically interfacedwith a Linear Instruments Model 282 Integrating Chart Recorder. As a reference gas,room air was directly passed at the same rate through a drying filter and into a secondsensor cell of the analyser. Thus, we were able to measure differences between thepercentage O2 of the room air and the gas leaving the respirometer. This value multi-plied by the flow rate gave us oxygen consumption (PQ2) of the roaches. Using thesevalues and the flow rate, we were able to calculate the instantaneous oxygen consump-tion VOl of the roaches corrected to conditions of STPD (see Bartholomew et al.(1981), for the method).
Protocol
Single-speed experiments. The purpose of these experiments was to determine theVOi of roaches running at different speeds on different days. Approximately tenanimals were tested at three speeds 0-03, 0-07 and 0-12 km/h, the latter being thehighest speed this species could maintain for the experimental period. Individualswere generally run at a single speed with a day of rest before being tested again. Theyhad previous experience with the treadmill during pilot studies and gave consistentperformances.
Experiments lasted approximately nomin. A roach was removed from its cage,weighed and placed into the respirometer. It rested in the chamber for 30 min duringwhich time J^2 was monitored. Typically, the V"Ot reached low, relatively constantrates within 25 min.
The rest period was followed by an exercise bout. The treadmill was turned on and
t|2 measured continuously for a 20 min exercise period. The animals generally ranell on the treadmill, maintaining their position well within the middle of the working
7-2

192 C. F. HERREID, R. J. FULL AND D. A. PRAWEL
section. Occasionally roaches became agitated, flipped over, or lodged against the bachof the chamber causing the experiments to be aborted.
After the exercise period was over and the treadmill was turned off, J^ continuedto be monitored for a recovery period of 60 min or until the O2 consumption haddeclined to a resting rate. Initial experiments were carried out at 23-610-6 °C (mean+ S.D.). In later experiments to determine the effect of temperature, we tested theroaches at 15, 25 and 35 + 1 °C in an environmental chamber.
Multiple-speed experiments. The purpose of these experiments was to determineJ ,2 of roaches as they were run sequentially at those different speeds during a singletest. The experiment began when a roach was weighed and placed into the treadmillrespirometer for a rest period of 30 min. The exercise bout lasted 15 min and con-sisted of three stages. The treadmill was first turned on to the lowest speed 0-03 km/hfor 5 min, then increased to 0-07 km/h for 5 min, and followed by 5 min at 0-12 km/h.Recovery was not monitored.
Incline experiments. In order to determine if the VOi wrould alter with the incline
of the treadmill, we followed the following experimental protocol. Roaches wererested 30 min. Then they were run for 20 min at 0-07 km/h as I^2 was monitored.During the first 5 min of the 20 min run the treadmill was level, followed by successive5 min periods at +5°, +150 and +250 incline. In other experiments the sameprocedure was followed for o°, — 50, —15° and —25° slopes. Any runs where theanimal visibly slipped on the treadmill were discarded.
RESULTS
The resting VOi of the cockroach, G. portentosa was determined by calculating theaverage of seven individuals for the 15 min just prior to exercise. At this time theanimals, having explored the chamber, were resting quietly, their only movementsbeing infrequent antennal cleaning manoeuvres. The resting J ,a was 0-19 ml O2 g.h±standard deviation of 0-05. There was no apparent trend with body mass; allanimals had similar ^ a . These data are comparable to other values collected forinsects (Keister & Buck, 1974). For example, Polacek & Kubista (i960) report a valueof 0-36 ml O2/g-h for the smaller roach, Periplaneta americana, and Bartholomew &Casey (1977) published values of 0-17 and 0-25 ml O2/g.h for two large tropicalbeetles, Strategus aloeus and Stenodontes molarium.
Once the treadmill was turned on, the cockroaches rapidly adjusted to its motionwith no obvious difficulty in most cases. When animals lagged back far enough totouch the rear of the treadmill chamber, they usually responded by moving forwardbriskly. During walking or running, roaches did not display any obvious shift in gait.This is consistent with the observations on P. americana which only changes gait atvery low velocities (Delcomyn, 1971). In G. portentosa the only apparent behaviouralchange occurred between resting and walking. At rest, a roach would lie with itsabdomen on the substrate, while during locomotion it raised its body as it walked onall six appendages in a typical tripod gait. At the end of the fast speed tests someindividuals showed evidence of fatigue. They occasionally stopped in their run,carried their body closer to the substrate, maintained their spiracles in a wide openposition and showed exaggerated abdominal breathing movements.

Cockroach locomotion energetics 193
-10 -5 15 0Time (min)
30
Fig. 1. Oxygen consumption (J^oa) of cockroaches running on a treadmill. The upper, middleand lower curves represent roaches running at speeds of o-12, 0-07 and 003 km/h respectively.Vertical bars represent 95 % confidence intervals.
At the end of the experiment most roaches abruptly stopped moving and assumedthe resting posture. Some individuals began extensive grooming routines, especiallyinvolving the antennae, but with little overall motion and apparent affect on the VOi.
Fig. 1 shows the rapid change of VOi once exercise was initiated. There were slightdifferences in the time to reach a steady rate of O2 consumption at the three differentvelocities. The time to reach one-half of the steady-state VOi value, t^, was about1 min at the two lower speeds and about 2 min at the fastest speed. Steady-state Xr
Oi
was achieved by 4 min even at the highest speed. The lag in the animals' VOs responseis known as the O2 deficit. Oxygen deficit is the difference between two values: (1) theactual gradual rise in Vo% which occurred as an animal began to run at a constantvelocity and (2) the abrupt rise in J^ which should occur if the steady-state POl
were reached instantly the moment the run began (e.g. Stainsby & Barclay, 1970).The steady-state J£>a during the test depended directly upon the intensity of
exercise: locomotion at 0-03 km/h was 0-58 ml O2/g.h; at 0-07 km/h was o-8i mlO2/g.h and at 0-12 km/h was 1-06 ml O2/g.h. When compared to the restingmetabolism, the exercise values are 3-1, 4-3, 5-6 times higher.
The VOt during recovery was a direct function of the intensity of exercise. The t^to recovery was about 4, 4, and 6 min for the slow, medium and fast velocity tests,respectively. Complete recovery was achieved within 15, 30 and 45 min after thecessation of exercise. When the recovery curves are plotted on a log scale, it appearsas if the low-speed data fit a simple exponential curve; the two higher speeds seem tobe described by a more complex curve of at least two phases: a fast exponential declinein 1<QS followed by a slower decrease. It is possible to compare the 'O2 debt' with theO2 deficit values determined earlier by measuring the area under their respective
^urves. The debt/deficit ratios for the three speeds are as follows: slow, 10-3;^tedium, 6-9; fast, 6*o.
194 C. F. HERREID, R. J. FULL AND D. A. PRAWEL
1-5
Multiple-speedexperiments ^<--
Single-speedexperiments
Resting
I I
002 004 006 008 010Velocity (km/h)
012 0 1 4
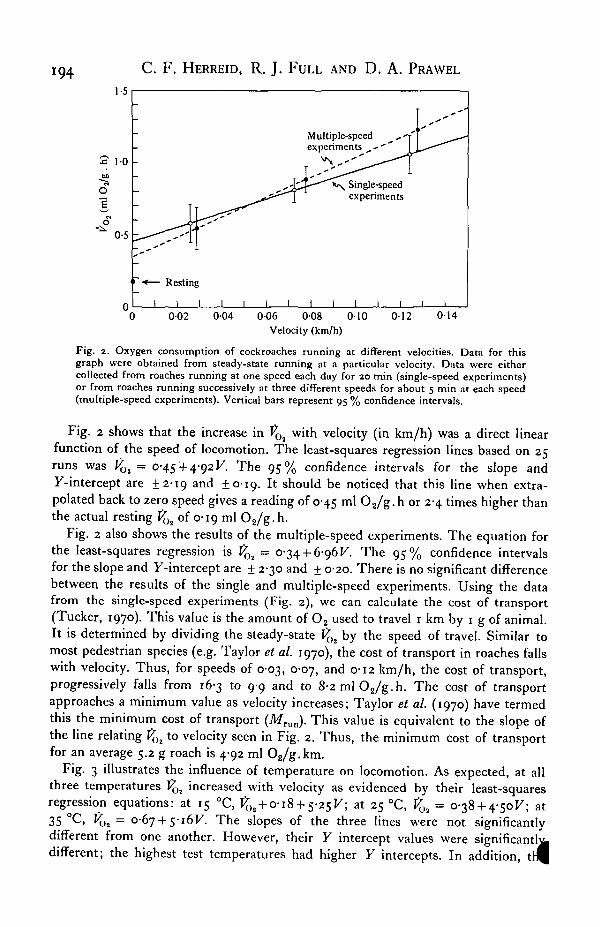
Fig. 2. Oxygen consumption of cockroaches running at different velocities. Data for thisgraph were obtained from steady-state running at a particular velocity. Data were eithercollected from roaches running at one speed each day for 20 min (single-speed experiments)or from roaches running successively at three different speeds for about 5 min at each speed(multiple-speed experiments). Vertical bars represent 95 % confidence intervals.
Fig. 2 shows that the increase in VOi with velocity (in km/h) was a direct linearfunction of the speed of locomotion. The least-squares regression lines based on 25runs was VOi = 0-45 4-4-92F. The 95% confidence intervals for the slope and7-intercept are ±2-19 and ±0-19. It should be noticed that this line when extra-polated back to zero speed gives a reading of 0-45 ml O2/g.h or 2-4 times higher thanthe actual resting VQt of 0-19 ml O2/g. h.
Fig. 2 also shows the results of the multiple-speed experiments. The equation forthe least-squares regression is VOi - 0-34 + 6-96^ The 95% confidence intervalsfor the slope and 7-intercept are + 2-30 and + 0-20. There is no significant differencebetween the results of the single and multiple-speed experiments. Using the datafrom the single-speed experiments (Fig. 2), we can calculate the cost of transport(Tucker, 1970). This value is the amount of O2 used to travel 1 km by 1 g of animal.It is determined by dividing the steady-state VOi by the speed of travel. Similar tomost pedestrian species (e.g. Taylor et at. 1970), the cost of transport in roaches fallswith velocity. Thus, for speeds of 0-03, 0-07, and 0-12 km/h, the cost of transport,progressively falls from 16-3 to 9-9 and to 8-2mlO2/g.h. The cost of transportapproaches a minimum value as velocity increases; Taylor et al. (1970) have termedthis the minimum cost of transport (Mrun). This value is equivalent to the slope ofthe line relating t{H to velocity seen in Fig. 2. Thus, the minimum cost of transportfor an average 5.2 g roach is 4-92 ml 02/g.km.
Fig. 3 illustrates the influence of temperature on locomotion. As expected, at allthree temperatures I^2 increased with velocity as evidenced by their least-squaresregression equations: at 15 °C, ^ 2 + o-i8 + S-25F; at 25 °C, J<[)2 = o-38 + 4-5oF; at35 °c> K)2 = 0-67 + 5-16^. The slopes of the three lines were not significantlydifferent from one another. However, their Y intercept values were significantldifferent; the highest test temperatures had higher Y intercepts. In addition, l

1-4
1-2
10
0-8
0-6'
0-4,
0-2,
-
-
-
«— Restingi i
Cockroach
T _ ^ ^
1 1 i i
locomotion
T
^ — • —
1 1 1
energetics
25°C_^--f-
l 1 l i i002 004 006 008
Velocity (km/h)010 012
Fig. 3. Effects of temperature on O2 consumption of running cockroaches. Vertical barsrepresent 95 % confidence intervals.
1-5
ion
(ml
O2
;um
pt
§ 0-5
O
-
•
• 1••
-
x
•••••
•1
I•
1
•
•
: •• •
•
•
•
Down-25° -15° -5° 0° +5° +15° +25° UpIncline angle
Fig. 4. Effects of incline running on O2 consumption of running cockroaches.
resting J^ values showed the typical poikilothermic response; VOl was a directfunction of temperature. The resting rates +S.D. in ml O2/g.h were as follows: at15 °C, 00910-04; at 25 °C, 0-17 + 006; at 35 °C, 0-37 + 0-06. The gio effect wasapproximately 2 across this temperature range.
Cockroaches running on inclines did not show any differences compared to loco-motion across a level surface (Fig. 4).

196 C F. HERREID, R. J. FULL AND D. A. PRAWEL
DISCUSSION
Oxygen consumption in response to running
The running response of cockroaches seems remarkably similar to that of highervertebrates. This is first evident from Figs. 1 and 2. There we note that the V^ ofroaches rapidly attained a steady-state level once running began. The cockroach t^on-response of about 1 min compares favourably with humans (Cerretelli et al. 1979)as well as flying locusts (Krogh & Weis-Fogh, 1951). The time lag from the onset ofexercise until a steady-state V(h is attained, referred to as an O2 deficit (Stainsby &Barclay, 1970), may depend upon several factors. It depends upon the O2 consump-tion, the efficiency of the O2 conductance system, the extent of the tissue and bloodsupplies of O2, the time to deplete the ATP and phosphagen supply of muscle, themagnitude of anaerobiosis, and the way that VQ, is linked to ATP hydrolysis. Inaddition, it depends upon the sensitivity, position and responsiveness of the sensoryreflex systems monitoring tissue gases and acid-base balance. Setting the latterproblem aside, if the O2 conductance system is efficient, the anaerobic contributionssmall, the stores of O2, ATP, and phosphogens limited, then we might expect the t^on-response to be brief. This is the case for both higher vertebrates and insects. Thelatter have a tracheal system whereby air is delivered directly to the muscle cellswithout the participation of a circulatory system. Krogh & Weis-Fogh (1951) andWeis-Fogh (1964, 1967) have shown that this system is remarkably adept at supplyingO2 even during flight which is energetically more demanding per unit time thanpedestrian locomotion. In contrast to this effective and rapid O2 conductance system,we note that the land crab, C. guanhumi, running at modest speeds, showed a slow t^on-response (2-4 min) as well as a long t± recovery (15-20 min) after exercise (Herreidet al. 1979). This animal appears to have a poorer O2 conductance system than thecockroach. In crabs, O2 must be exchanged across an enclosed gill system, into anopen circulation of low carrying capacity before it reaches the muscles. In addition,the O2 storage of the crab, although unknown, may be relatively high because 30 %of the body weight is haemolymph. Moreover, muscle phosphagen levels may be highand anaerobic contributions large in crustaceans (e.g. Beis & Newsholme, 1975;Phillips et al. 1977). In view of such differences, we should not be surprised at thedifferences in VOn response between the two types of arthropods.
The highest measured J^s of cockroaches running at the fastest speed (0-12 km/hwas approximately 6 times higher than the resting rate (Fig. 2). This metabolic scopeis similar to values recorded for most vertebrates and the land crab C. guanhumi(Young et al. 1959; Segrem & Hart, 1967; Wunder, 1970; Pasquis, Lacaisse &Dejours, 1970; Bennett, 1978; Lechner, 1979; Herreid et al. 1979). Nevertheless, thepeak metabolic scope of these species is considerably inferior to those of flying insectswhich often range from 25 to 150 times higher than their resting rates (see Polacek &Kubista, i960).
The explanation of these species differences lies in the enormous metabolic capacityof insect flight muscle. It is by far the most active tissue known (e.g. Weis-Fogh,1967). When flight muscle is quiescent, insects, regardless of their activity, arepoikilothermic with body temperatures (TB) approximating ambient temperatui(TA). However, once flight muscles begin to contract during preflight warm-up"

Cockroach locomotion energetics 197
•luring flight itself, TB is regulated at high levels and VOl is comparable to a homeo-therm (e.g. Heinrich, 1974). Consequently, the difference between the poikilothermicand homeothermic Vih rates leads to spectacular metabolic scopes. Running incockroaches clearly did not generate enough heat to produce unusual scopes nor wasthe TB raised in our experiments according to measurements made with implantedcopper-constantan thermocouples. We should note, however, that Bartholomew &Casey (1977) did find walking tropical beetles, Strategics aloeus and Stenodenetesmolarium, with elevated Tn. Nevertheless, this appeared to be caused by contractingflight muscle.
Recovery from locomotion
Recovery from locomotion in cockroaches seems similar to the pattern describedfor many higher vertebrates. Thus, the magnitude of the O2 debt is a direct functionof the intensity of exercise. This is seen if one integrates the area under the recoverycurve or considers the maximum time to achieve full recovery (i.e. resting J^2). Thispattern is consistent in animals as different as humans and crabs (Hagberg et al. 1980;Herreid et al. 1979). It is less evident when one examines the slight differences in t^off-response varying between 4 and 6 min.
The briefness of the t^ off values for cockroaches indicates that much of the O2
recovery is comparatively rapid. Although the t± off-response does not seem as rapidas in humans or dogs, which have values well under 1 min (e.g. Piiper & Spiller, 1970;Cerretelli et al. 1979; Hagberg et al. 1980), nor as long as the 20 min seen in that datafor kangaroo rats or crabs (Yousef et al. 1970; Herreid et al. 1979), it does seem defin-itely comparable to rats and lizards (Brooks et al. 19716; Moberly, 1968; Dmi'el &Rappeport, 1976; Gleeson, 1980). Regardless of the variations in t^ values amonganimals, almost all experiments reported within the literature indicate that X?Ot
recovery lasts for periods up to an hour in length. This is certainly true of the cock-roach data, as well as in the locust following flight (Krogh & Weis-Fogh, 1951). Thisis not the case for Drosophila, which had an almost immediate recovery (within 1 or 2min) after flight (Chadwick & Gilmour, 1940).
The cause for such differences in Oa recovery pattern is subject to considerabledebate. Within the literature on vertebrates, where the subject has received extensivediscussion, the recovery O2 ('O2 debt') has been traditionally divided into two parts.A fast component exists lasting 20-30 s, which is presumably due to replacement ofO2 within tissues and body fluids (including O2 depleted from respiratory pigmentsduring locomotion), and the additional O2 required to replenish ATP and phospha-gens such as creatine phosphate or arginine phosphate in the case of most inverte-brates. The slow component, lasting for periods over 1 h, has been traditionallyassumed to be due to the O2 required to convert lactic acid into glycogen. This viewseems no longer tenable for higher vertebrates at least (Brooks et al. 1971a, b, 1973;Segal & Brooks, 1979; Hagberg et al. 1980). Much of the lactic acid generated duringstrenuous exercise is not resynthesized into glycogen but directly oxidized afterexercise. Also it has become clear that as much as 70% of the recovery O2 is notdirectly due to the metabolic demands of locomotion. Rather, body temperatures are
Mlevated by locomotion and these persist long after the exercise bout causing X^Ol toWe increased by a Ql0 effect. Additionally, high TB reduces the phosphorylative

198 C. F. HERREID, R. J. FULL AND D. A. PRAWEL
efficiency (ADPiO ratio), requiring that much more O2 be consumed for aamount of ATP produced than at rest.
In view of the turmoil in the literature and our general ignorance about invertebratemetabolic mechanisms, we are dubious about the cause of 'O2 debt'. Certainly, lacticacid is generated in cockroaches such as Periplaneta orientalis and other arthropodsboth in hypoxia and exercise (Davis & Slater, 1928; Sacktor, 1974; Phillips et al. 1977).But no direct tie-in with O2 debt is evident. Moreover, lactate is not the only endproduct of anaerobic metabolism thus making the relationship woth O2 debt evenmore speculative.
PrOi versus velocity
Another point of similarity between vertebrate and cockroach performance isevident in Fig. 2; the rate of VOi increases linearily with the velocity of locomotion.This pattern is common in most pedestrian locomotion (Segrem & Hart, 1967;Yousef et al. 1970; Taylor et al. 1970; Taylor, 1977) but there are important excep-tions such as walking humans that show a curvilinear response (e.g. Margaria et al.1963) and kangaroos that show no increase or even a decrease with the velocity oflocomotion (Dawson & Taylor, 1973; Taylor, 1977). The possible reasons for thesepatterns are discussed by Taylor, 1977 and Cavagna, Heglund & Taylor, 1977.
When the line representing VQl v. velocity of locomotion in cockroaches is extra-polated to zero velocity, we note that the predicted J ,t at rest is 2-4 times higher thanthe actual resting rate (Fig. 2). This result is not unexpected for it is common amongvertebrates (Taylor et al. 1970; Taylor, 1977), although there are notable exceptionsincluding lions, dogs and elk calves (Chassin et al. 1976; Raab, Eng & Waschler, 1976;Cohen, Robbins & Davitt, 1978). The reason for the discrepancy between theF-intercept and the resting rate has received little attention. Among the numerouspossibilities, we can mention the following several: Schmidt-Nielsen (1972) proposedthat there is an undefined postural cost of locomotion which elevates the J^2. Thereis little evidence for this concept. More likely, the work of Margaria et al. 1963 onhuman walking and Hoyt & Taylor (1979) on pony locomotion suggests that whencareful measurements of slow locomotion are made, the VOl v. velocity curve is notlinear. Very slow speeds are relatively expensive to maintain, thus deflecting theF-intercept value upward. This elevation may occur because of the relative inefficiencyof moving at slow speeds, the irregular walking patterns produced by some animals,the 'excitement factor' generated by running (e.g. heart rate, Baudinette, 1978) orbecause of the increased Tn and decreased P/O ratio generated during exercise^Brooks et al. 1971a, b). Other possibilities exist and the problem awaits clarification.
Effect of temperature on locomotion
Temperature had a decided effect upon the energetics of cockroach locomotion. Athigher temperatures the cost of locomotion as expressed by VOl in ml O2/g.h at agiven velocity was elevated. However, the regression lines of Fig. 3, differ only bytheir F-intercept values. Since the slopes of the lines are similar at 15, 25 and 35 °C,there probably was no change in efficiency with temperature. The increased cost oflocomotion at higher temperatures is simply a function of the Q10 effect.

Cockroach locomotion energetics 199
temperatures affected both resting and exercise J^2 values to a comparable degree;^ io° rise in temperature doubled both rates. These results resemble the data for thecommon iguana, Iguana iguana, during treadmill studies (Moberly, 1968). Experi-ments with the lizard, Uromastix aegyptius across a temperature range of 35-42 °Cshowed a more complex picture. TB did not affect resting VQ2. Both slope and Yintercept values were equivalent at all TA; nevertheless, in this lizard there were someinteresting gait changes at high velocities that were correlated with temperature(Dmi'el & Rappeport, 1976).
Incline running
Cockroaches do not seem to use significant amounts of energy to run up or downinclines compared to a level surface (Fig. 4). Again, these data are consistent withinformation from vertebrate experiments. Taylor et al. (1972) found that mammalsas small as mice showed no significant increase in VOi with incline running. Theyreasoned that the cost of lifting a given weight a specific distance remains constant9-8 joules for 1 kg per vertical metre) regardless of the size of the animal. But sincethe total metabolic rate per gram and the cost of transport varied inversely with bodysize, the relative cost to raise a weight would be harder to detect in small animals.Using data from mice and chimpanzees Taylor, Caldwell & Rowntree (1972) foundthat both expended 14-8 J/kg running up an 150 incline for an efficiency of about60%. If we assume roaches are similar, we can calculate that running uphill shouldproduce a shift in the slope of ViH v. velocity curve from 4-92 for level running to5-12 for a 150 positive incline. This amounts to a minor 4% rise in ^ a . It is nosurprise that such a change was not detected with our experimental procedure.
Cost of transport
The minimum cost of transport (Mrun) is the minimum I^2 (or its energeticequivalent) used to move 1 g of an animal over a distance of 1 km (Taylor et al. 1970).Use of this value has permitted investigators to compare animals of radically differentsize, running velocities, and standard metabolic rates. As Taylor et al. (1970) havepointed out, large animals can approach a true Mrun: the cost of transport is high atlow speeds, but as the rate of locomotion increases the cost decreases until a minimumvalue is reached. Small mammals such as mice and rats never approach the necessaryvelocities to reach a true MTun. This is the case for cockroaches as well. The lowestrealized cost of locomotion of the cockroach was 8-2 ml 02/g.km. This is 1-7 timeshigher than the theoretical minimum cost of transport of 4-9 ml 02/g.km determinedfrom the slope of the VOt v. velocity line. In fact, the MTXin value would be achievedonly at velocities over 0-5 km/h or four times the actual maximum speed of theroaches.
In spite of the hypothetical nature of Mrun, it still has heuristic value to comparelocomotion among animals. Fig. 5 (upper line) shows the regression line representingMTun for mammals of different body weight (W) determined by Taylor et al. (1970).The empirical equation developed for the relationship was MTnn = 8-46W~°'i0.Small mammals have a higher MTun than large; the physical and physiological para-
ters producing this relationship have been recently discussed by Taylor et al.). When the minimum cost of transport data for cockroaches (Mrun = 4-92 ml
200 C. F. HERREID, R. J. FULL AND D. A. PRAWEL
Cost of locomotion
10'
| 10°
Cockroach
White mouse
LizardsKangaroo rat
• Land crabWhite rat
Quail
Ground squirrel *
10° 10' 102
Body mass (g)103
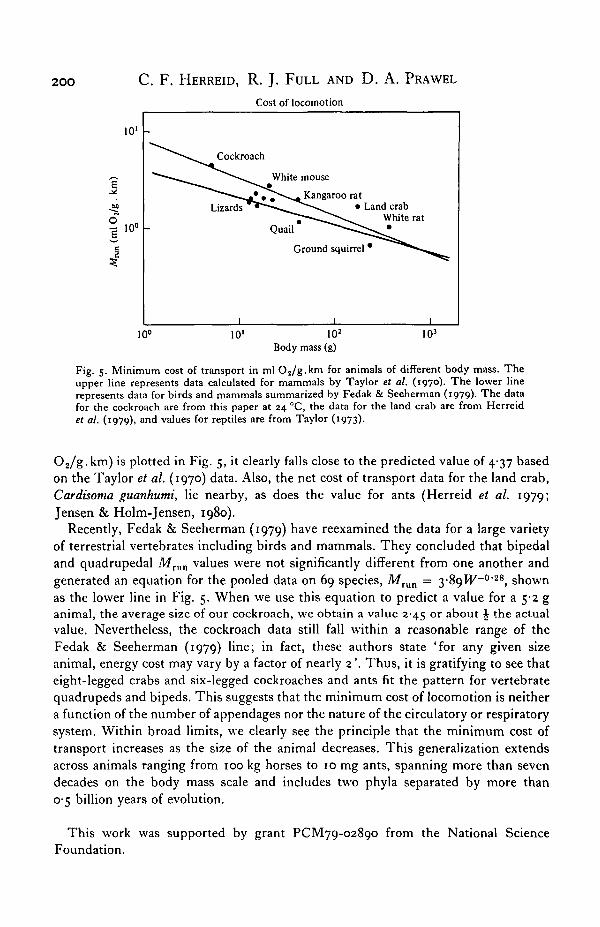
Fig. 5. Minimum cost of transport in ml O 2 / g . k m for animals of different body mass. Theupper line represents data calculated for mammals by Taylor et al. (1970). The lower linerepresents data for birds and mammals summarized by Fedak & Seeherman (1979). The datafor the cockroach are from this paper at 24 °C, the data for the land crab are from Herreidet al. (1979), and values for reptiles are from Taylor (1973).
02/g.km) is plotted in Fig. 5, it clearly falls close to the predicted value of 4-37 basedon the Taylor et al. (1970) data. Also, the net cost of transport data for the land crab,Cardisoma guanhumi, lie nearby, as does the value for ants (Herreid et al. 1979;Jensen & Holm-Jensen, 1980).
Recently, Fedak & Seeherman (1979) have reexamined the data for a large varietyof terrestrial vertebrates including birds and mammals. They concluded that bipedaland quadrupedal Mrun values were not significantly different from one another andgenerated an equation for the pooled data on 69 species, MTun = 3-89W~02g, shownas the lower line in Fig. 5. When we use this equation to predict a value for a 542 ganimal, the average size of our cockroach, we obtain a value 2-45 or about J the actualvalue. Nevertheless, the cockroach data still fall within a reasonable range of theFedak & Seeherman (1979) line; in fact, these authors state 'for any given sizeanimal, energy cost may vary by a factor of nearly 2'. Thus, it is gratifying to see thateight-legged crabs and six-legged cockroaches and ants fit the pattern for vertebratequadrupeds and bipeds. This suggests that the minimum cost of locomotion is neithera function of the number of appendages nor the nature of the circulatory or respiratorysystem. Within broad limits, we clearly see the principle that the minimum cost oftransport increases as the size of the animal decreases. This generalization extendsacross animals ranging from 100 kg horses to 10 mg ants, spanning more than sevendecades on the body mass scale and includes two phyla separated by more than0-5 billion years of evolution.
This work was supported by grant PCM79-02890 from the National ScienceFoundation.

Cockroach locomotion energetics 201
REFERENCES
BARTHOLOMEW, G. A., VLECK, D. & VLECK, C. M. (1981). Instantaneous measurement of oxygenconsumption during pre-flight warm-up and post-flight cooling in sphingid and saturniid moths.J. exp. Biol. 90, 17-32.
BARTHOLOMEW, G. & CASEY, T. (1977). Endothermy during terrestrial activity in large beetles. Science,N. Y. 195, 882-883.
BAUDINETTE, R. V. (1978). Scaling of heart rate during locomotion in mammals. J. comp. Physiol. XV],337-342.
BEIS, I. & NEWSHOLME, E. A. (1975). The contents of adenine nucleotides, phosphagens and someglycolytic intermediates in resting muscles from vertebrates and invertebrates. Biochem.J. 152, 23-32.
BENNETT, A. (1978). Activity metabolism of the lower vertebrates. A. Rev. Physiol. 40, 447-469.BROOKS, G. A., HITTELMAN, K. J., FAULKNER, J. A. & BEYER, R. E. (1971 a). Temperature, skeletal
muscle mitochondrial function, and oxygen debt. Am. J. Physiol. 220, 1053-1059.BROOKS, G. A., HITTELMAN, K. J., FAULKNER, J. A. & BEYER, R. E. (19716). Tissue temperatures and
whole animal oxygen consumption after exercise. Am. J. Physiol. 221, 427-431.BROOKS, G. A., BRAUNER, K. E. & CASSENS, R. G. (1973). Glycogen synthesis and metabolism of lactic
acid after exercise. Am. J. Physiol. 224, 1162—1166.CAVAGNA, G. A., HEGLUND, N. C. & TAYLOR, C. R. (1977). Mechanical work in terrestrial locomotion:
two basic mechanisms for minimizing energy expenditure. Am. J. Physiol. 233, R243-R264.CERRETELLI, R., PENDERGAST, D., PAGANELLI, W. C. & RENNIE, D. (1979). Effects of specific muscle
training on V02 on-response and early blood lactate. jf. appl. Physiol.: Resp. Environ. Exercise Physiol.47. 761-769.
CHASSIN, P. S., TAYLOR, C. R., HEGLUND, N. C. & SEEHERMAN, H. J. (1976). Locomotion in lions:energetic cost and maximum aerobic capacity. Physiol. Zool. 49, 1—10.
CHADWICK, L. E. & GlLMOUR, D. (1940). Respiration during flight in Drosophila repleta Wollaston: theoxygen consumption considered in relation to the wing rate. Physiol. Zool. 13, 398-410.
COHEN, Y., ROBBINS, C. T. & DAVITT, B. B. (1978). Oxygen utilization by elk calves during horizontaland vertical locomotion compared to other species. Comp. Biochem. Physiol. 61 A, 43-48.
DAVIS, J. B. & SLATER, W. K. (1928). The aerobic and anaerobic metabolism of the common cockroach(Periplaneta orientalis): III . Biochem. Jf. 22, 331—337.
DAWSON, T. & TAYLOR, C. R. (1973). Energy cost of locomotion in kangaroos. Nature, Lond. 246,3I3-3I4-
DENNY, M. (1980). Locomotion: The cost of gastropod crawling. Science, N.Y. 208, 1288-1290.DELCOMYN, F. (1971). The locomotion of the cockroach, Periplaneta americana. J. exp. Biol. 54,
443-452.DMI'EL, R. & RAPPEPORT, D. (1976). Effect of temperature on metabolism during running in the lizard
Uromastrix aegyptius. Physiol. Zool. 49, 77-84.FEDAK, M. A. & SEEHERMAN, H. J. (1979). Reappraisal of energetics of locomotion shows identical
cost in bipeds and quadrupeds including ostrich and horse. Nature, Lond. 282, 713-716.GLEESON, T. T. (1980). Metabolic recovery from exhaustive activity by a large lizard. J. appl. Physiol.
Resp. Environ. Exercise Physiol. 48, 589-694.HAGBERG, J. M., MULLIN, J. P. & NAGLE, F. J. (1980). Effect of work intensity and duration of re-
covery O2. J. appl. Physiol. 48, 540-544.HEINRICH, B. (1974). Thermoregulation in endothermic insects. Science, N.Y. 185, 747-756.HERREID, C. F., II, LEE, L. W. & SHAH, G. M. (1979). Respiration and heart rate in exercising land
crabs. Resp. Physiol. 36, 109-120.HOYT, D. F. & TAYLOR, C. R. (1979). Why do ponies use different gaits when running at different
speeds. Am. Zool. 19, 399.JENSEN, T. F. & HOLM-JENSEN, I. (1980). Energetic cost of running in workers of three ant species,
Formica fusca L., Formica rufa L., and Camponotus herculeanus L. (Hymenoptera, Formicidae). J.comp. Physiol. 137, 151-156.
KEISTER, M. & BUCK, J. (1974). Respiration: some exogenous and endogenous effects on rate of respira-tion. In The Physiology of Insecta, vol. vi (ed. M. Rockstein), pp. 470-509. N.Y.: Academic Press.
KROGH, A. & WEIS-FOGH, T. (1951). The respiratory exchange of the desert locust (Schistocercagregaria) before, during and after flight. J. exp. Biol. 28, 344-357.
LECHNER, A. (1979). The scaling of maximal oxygen consumption and pulonary dimensions in smallmammals. Resp. Physiol. 34, 29-44.
MARGARIA, R., CERRETELLI, P., AGHEMO, P. & SASSI, G. (1963). Energy cost of running.?, appl. Physiol.18, 367-370.
MOBERLY, W. R. (1968). The metabolic responses of the common iguana, Iguana iguana, to walkingk diving. Comp. Biochem. Physiol. 27, 21-32.

202 C. F. HERREID, R. J. FULL AND D. A. PRAWEL
PASQUIS, P., LACAISSE, A. & DEJOURS, P. (1970). Maximal oxygen uptake in four species of smaHmammals. Resp. Physiol. 9, 298-309. ^B
PHILLIPS, J. W., MCKINNEY, R. J. W., HIRD, F. J. R. & MACMILLAN, D. L. (1977). Lactic acid forma-tion in crustaceans and the liver function of the hindgut questioned. Comp, Biochem. Physiol. 56B,427-433-
PUPER, J. & SPILLER, P. (1970). Repayment of O2 debt and resynthesis of high-energy phosphates ingastrocnemius muscle of the dog. Jf. appl. Physiol. 28, 657-662.
POLACEK, I. & KUBISTA, V. (i960). Metabolism of the cockroach, Periplaneta americana, during flight.Physiologia Bohemoslovencia 9, 228-234.
RAAB, J. L., ENG, P. & WASCHLER, R. A. (1976). Metabolic cost of grade running in dogs. Jf. appl.Physiol. 41, 532-535.
SACKTOR, B. (1974). Biological oxidations and energetics in insect mitochondria. In The Physiology ofInsecta, vol. iv, 2nd ed. (ed. M. Rockstein), pp. 271-353. New York: Academic Press.
SCHMIDT-NIELSEN, K. (1972). Locomotion: Energy cost of swimming, flying and running. Science,N. Y. 177, 222-228.
SEGAL, S. S. & BROOKS, G. A. (1979). Effects of glycogen depletion and work load on postexercise Oaconsumption and blood lactate. J. appl. Physiol.: Resp. Environ. Exercise Physiol. 47, 514-521.
SEGREM, N. P. & HART, J. S. (1967). Oxygen supply and performance in Peromyscus. Metabolic andcirculatory responses to exercise. Can. J. Physiol. Pharmacol. 45, 531—541.
STAINSBY, W. N. & BARCLAY, J. K. (1970). Exercise metabolism: O2 deficit, steady level Os uptakeand O2 for recovery. Medicine fif Set. in Sports 2, 177-181.
TAYLOR, C. R., CALDWELL, S. L. & ROWNTREE, V. J. (1972). Running up and down hills: some conse-quences of size. Science, N.Y. 178, 1096-1097.
TAYLOR, C. R. (1973). Energy cost of animal locomotion. In Comparative Physiology (ed. L. Bolis,K. Schmidt-Nielsen and S. H. P. Maddrell), pp. 23-41. North-Holland.
TAYLOR, C. R. (1977). The energetics of terrestrial locomotion and body size in vertebrates. In ScaleEffects in Animal Locomotion (ed. T. J. Pedley), pp. 127-141. N.Y.: Academic Press.
TAYLOR, C. R., HEGLUND, N. C , MCMAHON, T. A. & LOONEY, T. R. (1980). Energetic cost of generat-ing muscular force during running. A comparison of large and small animals. Jf. exp. Biol. 86, 9-18.
TAYLOR, C. R., SCHMIDT-NIELSEN, K., RAAB, L. J. (1970). Scaling of energetic cost of running to bodysize in mammals. Am. jf. Physiol. 219, 1104—1107.
TUCKER, V. (1970). Energetic cost of locomotion in animals. Comp. Biochem. Physiol. 34, 841-846.WEIS-FOCH, T. (1964). Diffusion in insect wing muscle, the most active tissue known, Jf. exp. Biol.
41, 229-256.WEIS-FOGH, T. (1967). Respiration and tracheal ventilation in locusts and other flying insects. J. exp.
Biol. 47, 561-587.WUNDER, B. A. (1970). Energetics of running activity in Merriam's Chipmunk, Eutamias merriami.
Comp. Biochem. Physiol. 33, 821-836.YOUNG, D. R., MOSHER, R., ERVE, P. & SPECTOR, H. (1959). Energy metabolism and gas exchange
during treadmill running in dogs. Jf. appl. Physiol. 14, 834-838.YOUSEF, M. K., ROBERTSON, W. D., DILL, D. B. & JOHNSON, H. D. (1970). Energy expenditure of
running kangaroo rats, Dipodomys merriami. Comp. Biochem. Physiol. 36, 387-393.