Embed Size (px)
Citation preview
Abstract—The requirements of air conditioning systems in
the city of Piura have increased in recent years, since temperatures have reached higher levels than normal, especially in summer. In addition to the investment, the main issue of implementing conventional equipment is its high-energy consumption, which generates overloads in electrical systems, as well as a 60% increase in electricity costs. With this background in mind and to make the most of the level of solar irradiation, 5.5kW/m2 on average, it was aimed to evaluate solar cooling systems, which require less power to the electrical system or, at best, become independent of it, in addition to guiding renewable energy for human comfort. The case study focuses on a classroom in the Engineering Building at the Universidad de Piura, Peru. To improve the analysis, simulation software was used, called TRNSYS, to show the power variations in a couple of critical months. In this context, it also highlighted the fact of having a computational tool to optimize designs and reduce costs. Among the most important results for a photovoltaic system, it revealed that 20 panels of 130Wp were enough to independently cover the need for cooling in the classroom during the summer, with a 30% excess in the coverage factor; while in winter there were no issues because, despite the decrease in power generated, the number of air conditioner runtime hours also reduced. In the case of the absorption system, it could work during some months with 30-50% excess being absolutely independent.
Index Terms— Photovoltaic cooling system, absorption
cooling system, air conditioning system, TRNSYS.
I. INTRODUCTION
OLAR energy is one of the options that is being developed as an alternative to the energy from
fossil fuel combustion. Unlike the Nordic countries, the Peruvian territory has sun for most of the year. As in many countries, interest in the technical use of renewable energies, especially solar energy, began in Peru, in the 1970s, as a result of the so-called oil crisis [1]. According to the Solar Atlas of Peru, prepared by the Ministry of Energy and Mines, Peru has a high annual solar radiation, which is approximately 5.5 to 6.5 kWh/m2 in the mountains; 5.0 to 6.0 kWh/m2 on the coast and approximately 4.5 to 5.0 kWh/m2 in the jungle [2]. This means that solar energy
Manuscript received July 01, 2016; revised July 12, 2016. This work
was supported in part by Universidad de Piura, Peru. Kelly G. Regalado is with Universidad de Piura, Piura PERU (e-mail:
[email protected]). Carlos N. Quispe is with Universidad de Piura, Piura PERU (e-mail:
incident per unit area is, in principle, sufficient to meet the energy needs of various systems.
Over time these resource applications have diversified and are notable, considering that Piura is one of the cities with more solar radiation in Peru. Today, temperatures in this city have reached historical limits, being 39.6 degrees in January 2016. Considering this, the best option to achieve an adequate level of comfort in the summer periods is the use of air conditioning systems, however, connection to the mains can become a problem because of its high electricity consumption.
Given this scenario, we wished to study the feasibility of a solar air conditioning system, which would be applied to a building at the University of Piura. In the case of the photovoltaic application, it would be used in one classroom and the absorption system could satisfy the consumption of three classrooms. This will allow for, if not eliminate, a reduction in the need for connection to the electrical system, meaning a benefit to both electricity consumption and for the future cost of such facilities in areas where there is a high level of solar radiation.
In this paper, the methodology for calculating thermal load will be firstly explained, then the scheme components and devices needed for both systems, photovoltaic and absorption, will be described, then we will detail the calculation procedure or selection. In addition, the simulation performed by the TRNSYS software will be explained. Finally, the results obtained and conclusions will be displayed.
II. METHODOLOGY
2.1. TRNSYS software TRNSYS is a modular program for the dynamic
simulation of power systems, which has been specially designed for the simulation of active solar systems and thermal simulation of buildings. TRNSYS uses a graphical description of the energy systems, in which the user can select the modules that constitute the system and indicate how they are interconnected.
The TRNSYS library includes modules, called TYPES, representing the equipment commonly used in energy systems, processing modules, meteorological data processing modules of simulation results, etc. The TRNSYS modular structure gives great flexibility to analyze different types of energy systems.
2.2. Calculation of thermal load Thermal load refers to the amount of thermal energy
per unit time (thermal power, QR) as an enclosure exchanges with the outside because of the different hydrothermal
Energetic Assessment of Two Solar Cooling Systems in Piura using the TRNSYS Software
Kelly G. Regalado, Carlos N. Quispe
S
Proceedings of the World Congress on Engineering and Computer Science 2016 Vol II WCECS 2016, October 19-21, 2016, San Francisco, USA
ISBN: 978-988-14048-2-4 ISSN: 2078-0958 (Print); ISSN: 2078-0966 (Online)
(revised on 9 October 2016) WCECS 2016
conditions inside and outside, considering the exterior as being the most unfavorable possible. In essence, it is the amount of heat energy, which is removed from a defined space, in order to achieve specific desired applications, such as human comfort.
Table I shows the parameters necessary to evaluate and determine the thermal load of a single enclosure. We should consider the type of environment, whether it is a bedroom, a workplace, a schoolroom, etc. From the calculation factors, the cooling capacity, which should be covered, can be determined.
TABLE I
CONSIDERATIONS IN DETERMINING THE THERMAL LOAD
Location Unit Factor BTU/h
1- Soil m² 32
2- Volume of the room m³ 20
3- Windows exposed to the sun
S or E m² 480
SW m² 880
W m² 1200
NW or SE m² 660
4- All windows (not in item 3) m² 160
5- Walls exposed to the sun m² 144
6- All exterior walls (not in 5) m² 100 7- Partitions (All interior walls adjacent to unconditioned spaces)
m² 44
8- Roof (only one)
Unconditioned spaces m² 32
Roof Uninsulated m² 108
2" or more m² 32
Uninsulated roof m² 212
9- People 480
10- Electrical equipment
Incandescent W 3.44
Fluorescent W 4.25
Total Cooling Capacity RQ BTU/h
2.3. Determination of power consumption
The first step is to calculate the ideal energy consumption (ET) required by the compressor or absorption chiller. To this value, the performance factor of a refrigeration system, called COP, which represents the ratio between the cooling load and the compressor power, is used. For a practical purpose, ET will be in the same units of QR.
RT
QE
COP
(1) Photovoltaic system Once the ideal energy consumption is estimated, it is
necessary to calculate the actual consumption that the photovoltaic (PV) system will have after installation, that is, considering the use of proper equipment installation (inverter, batteries, etc.), and the effect of the losses associated with its operation.
1 1 ab c v
d
k NR k k k
p
(2)
The overall performance factor is represented by R,
where according to the project SIMEC in Chile, the factors of the equation (2) are:
bk : Loss ratio performance battery bank
0.05 on systems that do not demand deep discharges
0.1 on systems with deep discharge
ck : Coefficient of losses in the inverter
0.05 for pure sine wave inverters, working at rated speed
0.1 for inverters working outside the rated speed
vk : Coefficient of several losses (losses in conductors,
joule effect, etc.)
are considered reference values between 0.05 and 0.15
ak : Coefficient of daily self-discharge
0.002 for battery low self-discharge Ni-Cd
0,005 for stationary batteries lead acid
0.012 for batteries self-discharge high (car boot)
N: number of days of autonomy installation
Days in the installation work under conditions of minimum irradiation (continuous cloudy days), more energy will be consumed than is generated. 4 to 10 days as reference values.
pd : Depth of daily battery discharge
Should not exceed 80% of its nominal capacity in order to avoid affecting the life of the battery bank.
Absorption system Having estimated the ideal energy consumption, which
should be considered by incorporating thermal storage and equipment losses, it will suffer a reduction to 67% [3], which will be its performance.
Having found the overall performance factor of the installation (R) for both systems, the actual energy consumption is obtained from the following expression:
TEE
R
(3)
2.4. Determination of solar irradiation without losses This will be done using data obtained from the
average daily insolation in the city or place of the project implementation. After that, the evaluated radiation losses year after year must be deducted, which will have an order of between 10 - 15% according to the project SIMEC in Chile.
2.5. PV installation
The photovoltaic effect is based on the transformation of the energy provided by the sun into electrical energy. The autonomous air conditioning is added to the components of a conventional air, evaporator, compressor and condenser, a photovoltaic system is responsible for providing electricity to the compressor, as shown in Fig. 1. This installation, in turn, is composed of solar panels, an inverter and batteries for storing the
Proceedings of the World Congress on Engineering and Computer Science 2016 Vol II WCECS 2016, October 19-21, 2016, San Francisco, USA
ISBN: 978-988-14048-2-4 ISSN: 2078-0958 (Print); ISSN: 2078-0966 (Online)
(revised on 9 October 2016) WCECS 2016

transformed energy. These devices must be sized correctly to enable the transformation of solar radiation into electrical energy, and if excess energy is injected into the network, it will reduce the costs of the electricity.
Fig. 1. Photovoltaic solar cooling system
Calculation of the Battery Bank: If the real value of
energy consumption of the installation is already known, it is possible to calculate the capacity of the battery bank that will be necessary to accumulate the energy generated by the system, which represents the nominal battery voltage.
p
batd
E NC
V p
(4)
Calculation of Solar Panels: Once the capacity of the battery bank is obtained, the number of solar panels required for installation can be calculated.
Moreover, once the level of daily irradiation is known, without losses, it is necessary to estimate the hours of daily sunshine, or also known as Peak Sun Hours (PSH), which correspond to the solar equivalent hours per day, based on a standard level of radiation of 1 kW/m2 [4].
Alongside this, the type of photovoltaic panel to be used must be selected, according to the power, where the factors or operating data are some as nominal power - watts peak (WP), short-circuit current (ISC), open circuit voltage, voltage at the maximum power point, current at maximum power point and area, which correspond to those provided by the manufacturers.
Taking a percentage of safety, in this case assume 90% working [4], the number of panels pN will be determined
by:
0.9p
p
EN
W HSP
(5) Then, the coverage provided by the installation for
each of the months of the year should be checked, which corresponds to the Utilization Factor (Fi), or Coverage Factor of the month i, which is defined as the ratio of available energy and the energy consumed.
0.9p p i
i
N W HSPF
E
(6)
Where PSHi corresponds to the Peak Sun Hours of a specific month.
Calculation of the regulator: To estimate the necessary charge controller, the maximum operating current
maxI should be specified, which depends on the number of
panels used and its consumed current.
max SCI I NP
(7) Inverter calculation. To select an inverter, the
maximum instantaneous consumption should be estimated and that is the minimum value of the inverter.
Calculation of the switch: The switch can be set for
future connections to the mains, which may be manual or automatic, to perform switching between the power generation and photovoltaic system power supply via the wired network. This actuator will operate under low battery power (30% of the maximum capacity to calculate the battery bank), which upon detection of a level below 30% of the maximum load, will change towards providing the conventional power grid [4].
Simulation – PV system. An overview of the
components used in this application is provided in Fig. 2, whereas in Table II what types of elements were used for this simulation, highlighting the identification code and specific name in bookstores.
Fig. 2. Graphical environment in TRNSYS of a
photovoltaic system
TABLE II SYSTEM COMPONENTS IN TRNSYS
TYPE Component Type 65 Online graphical plotter Type 15 Weather Data Processor
Type 194
Photovoltaic Array
Type 2 ON / OFF Differential Type 47 Electrical Storage Battery Type 48 Regulator / Inverter
Type 964
Cooling Coil Bypass Using Fraction Approach
2.6. Absorption system
Thermodynamic cycles of absorption cooling are similar to vapour compression cycles; the main difference is that the compressor is replaced by a chemical cycle that occurs between an absorber pump, a heat exchanger and a
Proceedings of the World Congress on Engineering and Computer Science 2016 Vol II WCECS 2016, October 19-21, 2016, San Francisco, USA
ISBN: 978-988-14048-2-4 ISSN: 2078-0958 (Print); ISSN: 2078-0966 (Online)
(revised on 9 October 2016) WCECS 2016

generator, as shown in Fig. 3. Basically, instead of the refrigerant vapour compression, the absorption cycle dissolves this vapour into a liquid (called the absorbent); it pumps the solution to a higher pressure (with much less work input required by a compressor) and then uses the heat input to evaporate the steam coolant out of the solution [5].
Fig. 3. Absorption Cooling System
Fig. 3 shows the global view of the system showing
the five components that replace the compressor in a conventional air conditioner, which can be found commercially in a single device called an "absorption chiller".
Calculation of flat solar collectors: For this
application, this type of collector was chosen because the system requires less heat (to 100°C) and it is more economical at the same time [6]. The flat solar collector selected had certain features, which are some as gross area/aperture area, optical performance, collector heat loss coefficient and maximum possible load. These parameters will help discover the necessary number of them.
Having defined the solar surface needed per month
(SSi), resulting from the division of the actual consumption between the net average monthly consumption (RNi), which is already affected by 15% of losses in installation [7].
ii
ESS
RN (8)
Finally, we determined the number of flat solar collectors required by dividing the required monthly solar surface with its effective area (AE).
iSSNC
AE (9)
Calculation of the hot water storage tank: It was
necessary to store the heat transfer water coming from the solar collector to increase the efficiency of the absorption system when there was no sunshine. As in every piece of equipment, it had a loss coefficient but it was minimum when the storage tank was kept indoors. Having this requirement and being a vertical cylindrical tank, its ratio was 2 ~ 3:1, according to ASHRAE standards [8].
Selection of auxiliary heater: This is used to elevate,
or maintain, the fluid medium temperature, which feeds the steam generator and it is set around 84 °C (183.2 °F). The auxiliary heater loss coefficient is set to 0.21 [8].
Absorption chiller Yazaki WFC-SC10: This is a
single effect absorption chiller, LiBr based, associated with a cooling tower. The nominal operating conditions of the absorption chiller are reported in Table XII.
Selection of Cooling Tower: The most widely used
cooling tower design is one in which the hot water is sprayed from the top and the air flow runs in the opposite direction, from bottom to top, in order to prevent water loss. Having determined these conditions with a chiller COP of 0.7, we selected a cooling tower between 0.02 or 0.08 kWhel per kWh of cold [9], where kWhel refers strictly, electrical potential energy.
Selection of Fan Coils: The TRNSYS software used
allowed us to monitor the return air temperature and the percentage of the opening valve. For the actual energy consumption, we selected a product data for Daikin Air conditioning UK Ltd, FWD12AT Fan Coil Unit with the conditions specified in Table XIII.
Simulation – Absorption system. Fig. 4 provides an
overview of the environment. Part of this model and components was based on TRNSYS examples [10].
Fig. 4. Graphical environment in TRNSYS of an absorption system
Proceedings of the World Congress on Engineering and Computer Science 2016 Vol II WCECS 2016, October 19-21, 2016, San Francisco, USA
ISBN: 978-988-14048-2-4 ISSN: 2078-0958 (Print); ISSN: 2078-0966 (Online)
(revised on 9 October 2016) WCECS 2016

TABLE III
PRINCIPAL COMPONENTS IN TRNSYS
TYPE Component Type71 Solar collector Type60 Hot storage
Type107 Absorption chiller Type15 Weather Data Processor Type51 Cooling tower Type52 Cooling coil (fan coil) Type65 Online graphical plotter
III. RESULTS
Taking the measures and characteristics described in the classroom, located in the building, to assess its cooling load calculation, is shown in Table IV in BTU/h. Some locations have being omitted in the chart because they aren’t being affected by a factor.
TABLE IV CALCULATION OF THERMAL LOAD IN CLASSROOM
Location Unit Factor BTU/h
1- Soil 24 32 768
2- Volume of the room 84 20 1680 3- Windows exposed to the sun
S or E 28 480 13440
5- Walls exposed to the sun (included in item 3)
29 144 4176
8- Roof
Unconditioned spaces 0 32 0
Uninsulated roof 24 212 5088
9- People 65 480 31200
Total Cooling Capacity RQ BTU/h 56352
With the value obtained, the nominal heat output of
the air conditioner of 55000 BTU/h was ratified. After that, the calculations (in kWh/m². day) started
by considering the following data from the Atlas of Solar Energy of Peru, shown in the second line of Table V. These values are deducted radiation losses, which are considered in the order of 13%, obtained in the third line of the Table V.
Month 1 2 3 4 5 6 7 8 9 10 11 12 Aver.Radiation 5.5 6 5.5 5 5 4.5 5 5.5 6 6.5 6.5 6 5.6
Radiation with losses
4.8 5.2 4.8 4.4 4.4 3.9 4.4 4.8 5.2 5.7 5.7 5.2 4.9
TABLE VMONTHLY SOLAR RADIATION – PIURA
3.1. PV system By converting the cooling capacity to kW, and using
our air conditioner COP equal to 2.3 in equation (1), an input power of about 7 kW was obtained.
Having the solar radiation without losses, the PSH shown in Table VI were determined.
Month 1 2 3 4 5 6 7 8 9 10 11 12 Aver.Temp. (°C)
26.5 28 27.5 26 24 22.5 22 22 22.5 23 23.5 26 24.5
PSH (h) 4.8 5.2 4.8 4.4 4.4 3.9 4.4 4.8 5.2 5.7 5.7 5.2 4.9
TABLE VIAVERAGE TEMPERATURE PER MONTH (°C) - PSH PER MONTH
(h)
Selecting photovoltaic panels with operating characteristics, according to Table VII and using the equations specified in the previous section, the PV system parameters are summarized in Table VIII.
TABLE VII
PARAMETERS OF THE PHOTOVOLTAIC PANEL SELECTED
Specifications Value
Nominal power - Watts Peak (Wp) 130 Wp Short-circuit current (ISC) 7.87 A Open circuit voltage 21.7 V Voltage at the maximum power point
17.5 V
Current at maximum power point 7.43 A
Area 1.002
m2
TABLE VIII PARAMETERS OF THE PHOTOVOLTAIC INSTALLATION
Values for Photovoltaic Installation Ideal energy consumption 7000 W Loss ratio performance battery bank
0.05
Loss ratio in the inverter 0.05 Loss coefficient number 0.1 Self-discharge coefficient daily 0.005 Number of days of autonomy of the installation (N)
4
Depth daily battery discharge 0.7 Nominal battery voltage 24 V Short circuit current 7.87 A Power Inverter 10 kW Watts-peak solar panels 130 Wp Peak Solar Hours (PSH): Conditions less favorable - The most favorable - Average peak solar hours.
3.9 5.7 4.9
Solar panels number (according to scenarios)
20 14 16
Maximum current (A) 157.4
110.2
125.9
Switch 10 kW The values of the Coverage Factor (CF) for the three
scenarios studied in the table above are analyzed in Table IX, obtaining an annual average according to the monthly data.
Month 1 2 3 4 5 6 7 8 9 10 11 12 Aver.CF for NP=20
1.2 1.4 1.2 1.1 1.1 1 1.1 1.2 1.4 1.5 1.5 1.4 1.3
CF for NP=14
0.9 0.9 0.9 0.8 0.8 0.7 0.8 0.9 0.9 1 1 0.9 0.9
CF for NP=16
1 1.1 1 0.9 0.9 0.8 0.9 1 1.1 1.2 1.2 1.1 1
TABLE IXCOVERAGE FACTOR FOR 3 SCENARIOS
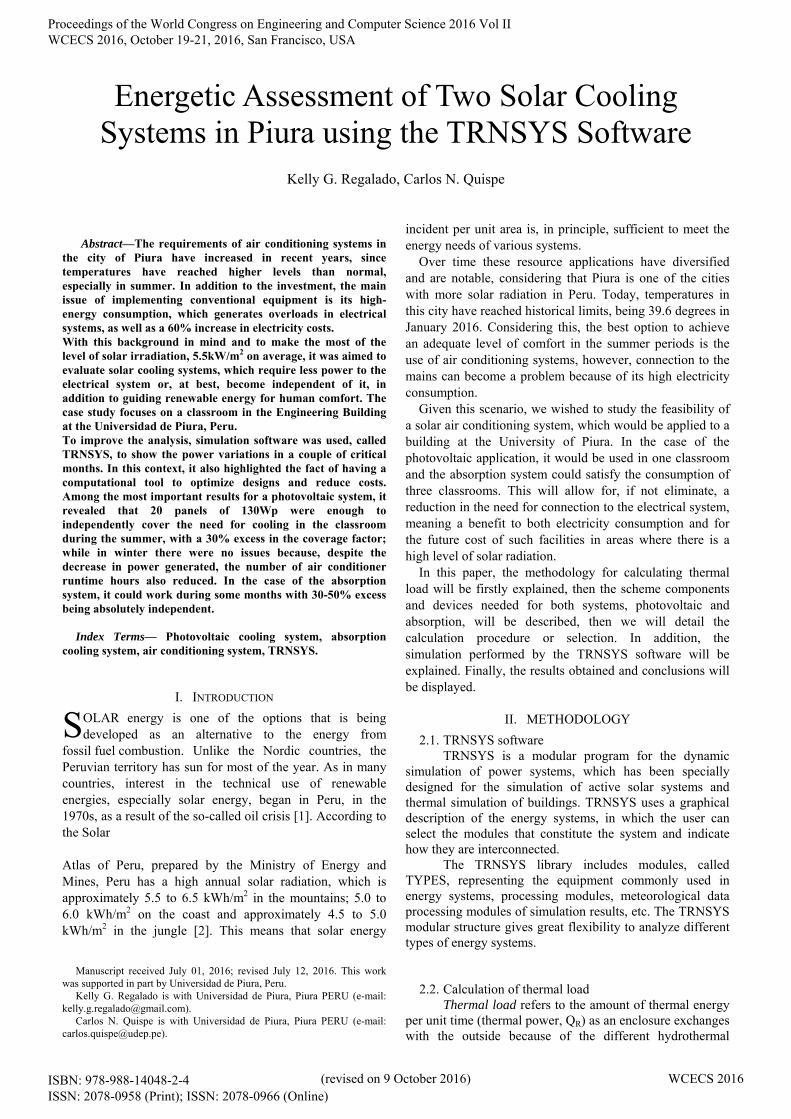
Simulation In Fig. 5, the less favorable scenario is simulated for
the month of June, which would be the month with the
Proceedings of the World Congress on Engineering and Computer Science 2016 Vol II WCECS 2016, October 19-21, 2016, San Francisco, USA
ISBN: 978-988-14048-2-4 ISSN: 2078-0958 (Print); ISSN: 2078-0966 (Online)
(revised on 9 October 2016) WCECS 2016
highest demand for air conditioning; and the more favorable scenario for November [11].
Fig. 5. Power in the photovoltaic solar cooling system for
June and November
3.2. Absorption system Converting the cooling capacity to kW, and using the
COP shown in Table XII equal to 0.7011 in equation (1), an ideal energy consumption of about 23 kW was obtained. After being affected by the factor of installation, R=0.67 [3], the actual power needed is 34.33 kW.
The solar flat plate collector will be LBM 10 HTF and Table X gives detailed specifications.
TABLE X
TECHNICAL SPECIFICATIONS OF THE SOLAR FLAT PLATE COLLECTOR SELECTED
Specifications Value
Gross area/aperture area, m2 11.1 / 10.1
Optical performance, % 83.00
Collector heat loss coefficient (W/m2K) 3.523
Maximum possible load (kN/m2) 2.25
On the other hand, having the specifications of the
collector and the solar surface shown in Table XI, the number of collectors shown in Table XI were determined.
Month 1 2 3 4 5 6 7 8 9 10 11 12 Aver.Solar surface (m²)
172 158 172 187 187 211 187 172 158 145 145 158 168
Number of collectors (N)
17 16 17 19 19 21 19 17 16 14 14 16 17
TABLE XISOLAR SURFACE (m²) - NUMBER OF COLLECTORS (N)
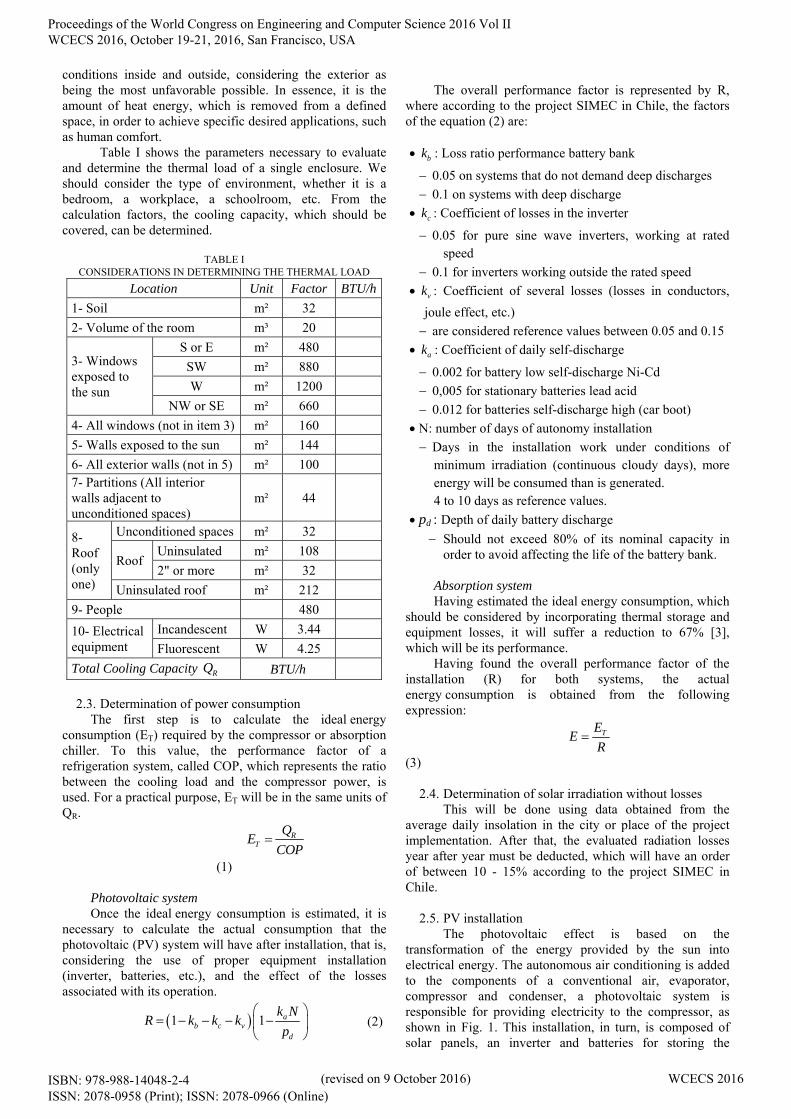
Once these parameters were defined and having selected the other components, now we can present in Table XII, the specifications of the absorption chiller and in Table XIII, the fan coil.
TABLE XII
NOMINAL CONDITIONS OF THE YAZAKI ABSORPTION CHILLER WFC-SC 10
Description Value Cooling capacity (kW) kW 35.2
COP 0.7011
Chilled water
Inlet temperature °C 12.5 Outlet temperature °C 7.0 Rated flow rate m3/hr 5.47 Max operating pressure kPa 588
Cooling water
Rated inlet temperature °C 31.0 Rated outlet temperature °C 35.0 Max operating pressure kPa 588 Rated flow rate m3/hr 18.4
Hot water
Rated inlet temperature °C 88 Rated outlet temperature °C 83 Max operating pressure kPa 70-95 Rated flow rate m3/hr 588 Intel limit °C 8.64
Electrical
Consumption W 210
TABLE XIII
SPECIFICATIONS OF FAN COILS
Description Value Cooling capacity (kW) 12 Temperature in/out (°C) 12 / 6 Flow rate (m3/h) 3.4 Connection 1’ internal
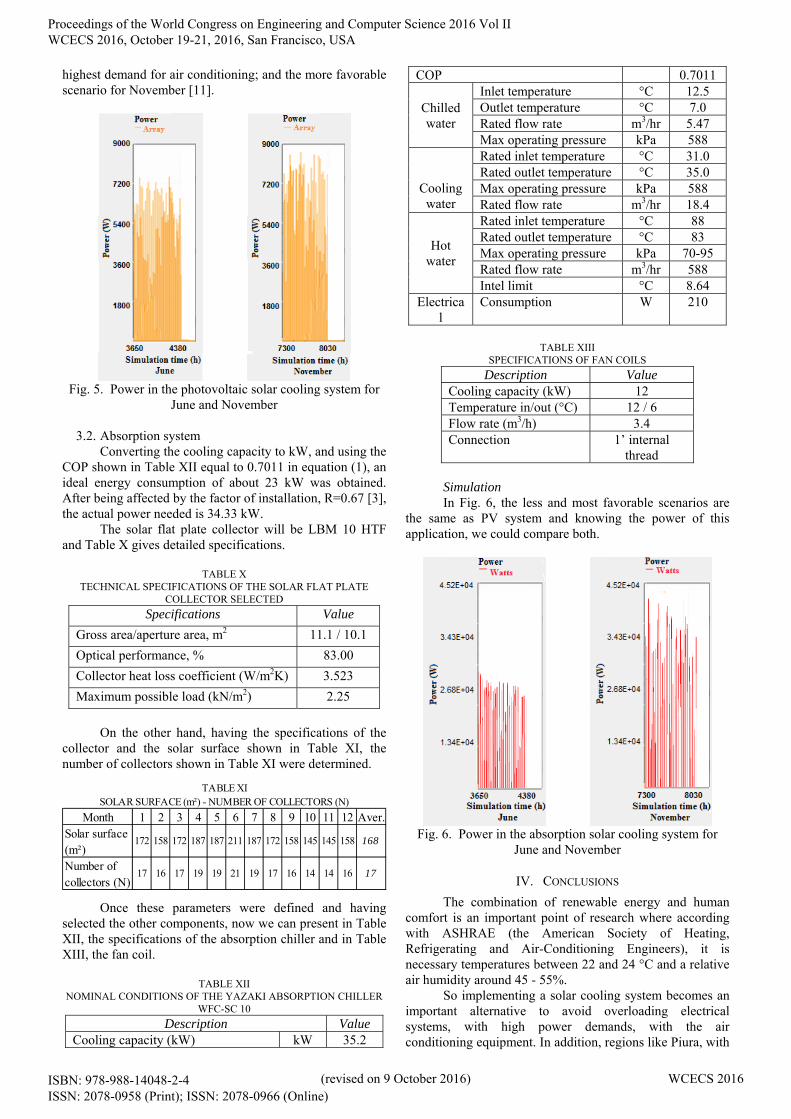
thread Simulation In Fig. 6, the less and most favorable scenarios are
the same as PV system and knowing the power of this application, we could compare both.
Fig. 6. Power in the absorption solar cooling system for
June and November
IV. CONCLUSIONS
The combination of renewable energy and human comfort is an important point of research where according with ASHRAE (the American Society of Heating, Refrigerating and Air-Conditioning Engineers), it is necessary temperatures between 22 and 24 °C and a relative air humidity around 45 - 55%.
So implementing a solar cooling system becomes an important alternative to avoid overloading electrical systems, with high power demands, with the air conditioning equipment. In addition, regions like Piura, with
Proceedings of the World Congress on Engineering and Computer Science 2016 Vol II WCECS 2016, October 19-21, 2016, San Francisco, USA
ISBN: 978-988-14048-2-4 ISSN: 2078-0958 (Print); ISSN: 2078-0966 (Online)
(revised on 9 October 2016) WCECS 2016

good sunlight and high temperature records, are potential areas for solar energy utilization, as the case study of an Engineering classroom at the University of Piura shows.
Table IX shows the case of 20 panels, when the installation fully covered the energy requirements, including the month of June (the most critical month), which was covered exactly. This shows that the installation was working correctly, independently of the power grid, generating 100% of the energy it consumed. The average was set at 1.3 (130%), which indicates that the facility annually produces 0.3 times more energy than it requires.
For the case of 14 panels, in the same Table IX, assessing the most favourable situation, there is a risk of its underperformance in the months of lower production. In the latter cases, it could supply the missing energy from the power grid, however, must be considered that these correspond to the winter months, so the demand for air conditioning is much lower and there would be drawbacks.
On the other hand, the TRNSYS software also provides an opportunity to make an assessment of an absorption system. Fig. 6 shows that using 21 solar collectors in the month of June, met 80% of the current demand of 34330 watts, which may be due to the low radiation in the area, since it was the beginning of winter.
In the case of using 17 collectors in November, an excess of about 30% was noticed, which although satisfactory, in the long term, this could damage the system. The main influences on the absorption system performance are the external temperature levels in the absorber, condenser, evaporator and generator, so this behaviour could allude to the sudden change of climate in the region. Given this, in future we could perform further research and evaluation of this anomaly and, perhaps, redirect or modify it so the months near July can see the benefit.
The analysis of renewable energy systems is more efficient using simulation software because when establishing a methodology, it has a tool to optimize designs, reduce costs and gives easy handling of results and indicators. Therefore, use of the TRNSYS 17 software, allowed us to appreciate the theoretical calculations and as we appreciate them from the results above, they may vary compared to the actual behaviour of the proposed system, having random values of power above 90%, as 8000W, is expected during the year for the photovoltaic system and a 15% above the average, 40000W, for the absorption application.
In the case of failure to achieve the required power for both systems, we can use a switch to achieve the necessary feedstock air conditioning, although this may not work with a completely independent application, we expect to reduce the current consumption and, above all, to be a feasible solution to the overload that has been generated in the power grid of the Universidad de Piura.
If we had to select one of the applications, we would prefer the absorption system because it is 30-50% higher when compared to an engine-driven chiller.
REFERENCES [1] Horn, M. (Noviembre de 2006). Los retos energéticos del Perú. Perú
Económico, XXIX(11), pp. 10-11. [2] Grupo de Apoyo al Sector Rural. (13 de Agosto de 2012). Boletín
Grupo-PUCP. Obtained from El desarrollo de la energía solar en el Perú: http://gruporural.pucp.edu.pe/noticias/nacionales/el-desarrollo-de-la-energia-solar-en-el-peru/
[3] CIBSE. (2012 de February de 2012). Absorption Cooling. Combined Heat and Power for Buildings (CHP Group). Obtained from http://www.flexiblespace.com/wp-content/uploads/2012/07
[4] Ibañez, M., Rossell, J. R. & Rossell, J. I. (2004). Tecnología Solar. Madrid: Mundiprensa, pp. 148-149; 249; 441.
[5] Lozano, M., Renin, L., Guallar, J., Monné , C., & Ramos , J. (2007). Análisis de las prestaciones de un sistema de climatización solar. Lima: IX Congreso Iberoamericano de Aire Acondicionado y Refrigeración, pp. 7-9.
[6] Eicker, U., & Pietruschka, D. (January de 2009). Design and performance of solar powered absorption cooling systems in office buildings. Energy and Buildings, 41, pp. 1-.
[7] Ssembatya, M. (2013). Performance evaluation of a Solar Cooling system in UAE – Ras Al Khaimah by both experiment and simulation. University of Gävle, pp. 6-8.
[8] Masson, S. V., Qu, M., & Archer, D. H. (2006). Performance modeling of a solar driven absorption cooling system for Carnegie Mellon university's intelligent workplace. Proceedings of International Conference of Enhanced Building Operation.
[9] Henning, H. M. (2004). Solar-assisted air-conditioning in buildings –a handbook for planners. Michigan: Springer.
[10] Solar Energy Laboratory. (2000). TESS HVAC Library Examples - Restaurant with Solar Absorption Cooling. En TRNSYS 17 Manual. Wisconsin: University of Wisconsin.
[11] Mao , C., Baltazar, J. C., & Haberl, J. (2012). Comparisons between TRNSYS software simulation and PV F-CHART program on photovoltaic system. Texas: Energy Systems Laboratory.
1) Date of modification: October 09, 2016
2) Brief description of the changes
There was a typing error in page 4: Selection of auxiliary heater: This is used to elevate, or maintain, the fluid medium temperature, which feeds the steam generator and it is set around 184 °C (363.2 °F). The auxiliary heater loss coefficient is set to 0.21 [8].
Where it has to be "84 °C (183.2 °F)".
Proceedings of the World Congress on Engineering and Computer Science 2016 Vol II WCECS 2016, October 19-21, 2016, San Francisco, USA
ISBN: 978-988-14048-2-4 ISSN: 2078-0958 (Print); ISSN: 2078-0966 (Online)
(revised on 9 October 2016) WCECS 2016