Embed Size (px)
Citation preview

© 2018 Superior Drilling Products
NYSE American: SDPI
www.sdpi.com
Troy MeierChairman and Chief Executive Officer
EnerCom Dallas
February 22, 2018
Christopher CashionChief Financial Officer
© 2018 Superior Drilling Products 2
Safe Harbor Statement
These slides and the accompanying oral presentation contain “forward-looking statements” within the meaning of the safe harbor provisions,
15 U.S.C. § 78u-5, of the Private Securities Litigation Reform Act of 1995. All statements, other than statements of historical fact included in
these slides and the accompanying oral presentation, regarding our strategy, future operations, financial position, estimated revenue and
losses, projected costs, prospects, plans and objectives of management, are forward-looking statements. The use of words “could,”
“believe,” “anticipate,” “intend,” “estimate,” “expect,” “may,” “continue,” “predict,” “potential,” “project”, “forecast,” “should” or “plan, and similar
expressions are intended to identify forward-looking statements, although not all forward-looking statements contain such identifying words.
Certain statements in these slides and the accompanying oral presentation may constitute forward-looking statements, including statements
regarding the volatility of oil and natural gas prices; the cyclical nature of the oil and gas industry; availability of financing, flexibility in
restructuring existing debt and access to capital markets; consolidation within our customers’ industries; competitive products and pricing
pressures; our reliance on significant customers, specifically, Baker Hughes; our limited operating history; fluctuations in our operating
results; our dependence on key personnel; costs of raw materials; our dependence on third party suppliers; unforeseen risks in our
manufacturing processes; the need for skilled workers; our ability to successfully manage our growth strategy; unanticipated risks associated
with and our ability to integrate, acquisitions; current and potential governmental regulatory actions in the United States and regulatory
actions and political unrest in other countries; terrorist threats or acts, war and civil disturbances; our ability to protect our intellectual
property; impact of environmental matters, including future environmental regulations; implementing and complying with safety policies;
breaches of security in our information systems; related party transactions with our founders; and risks associated with our common stock .
These statements reflect the beliefs and expectations of the Company and are subject to risks and uncertainties that may cause actual
results to differ materially. These risks and uncertainties include, among other factors, worldwide economic activity; the level of exploration
and production activity; interest rates and the cost of capital; environmental regulation; federal, state and foreign policies regarding
exploration and development of oil and gas; the ability of OPEC to set and maintain production levels and pricing; governmental regulations
regarding future oil and gas exploration and production; the cost of exploring and producing oil and gas; the cost of developing alternative
energy sources; the availability, expiration date and price of leases; the discovery rate of new oil and gas reserves; the success of drilling
for oil and gas in unconventional resource plays such as shale formations; technological advances; terrorist attacks and similar disruptive
unlawful activities; weather conditions. These and other factors could adversely affect the outcome and financial effects of the Company’s
plans and described herein. Therefore, you should not rely on any of these forward-looking statements. Any forward-looking statement
made by us in these slides and the accompanying oral presentation is based only on information currently available to us and speaks only
as of the date on which it is made. We undertake no obligation to publicly update any forward-looking statement, whether written or oral,
that may be made from time to time, whether as a result of new information, future developments or otherwise.
This presentation will discuss some non-GAAP financial measures, which the Company believes are useful in evaluating our performance.
You should not consider the presentation of this additional information in isolation or as a substitute for results compared in accordance with
GAAP. The Company has provided reconciliations of comparable GAAP to non-GAAP measures in tables found in the Supplemental
Information portion of this presentation.
© 2018 Superior Drilling Products 3
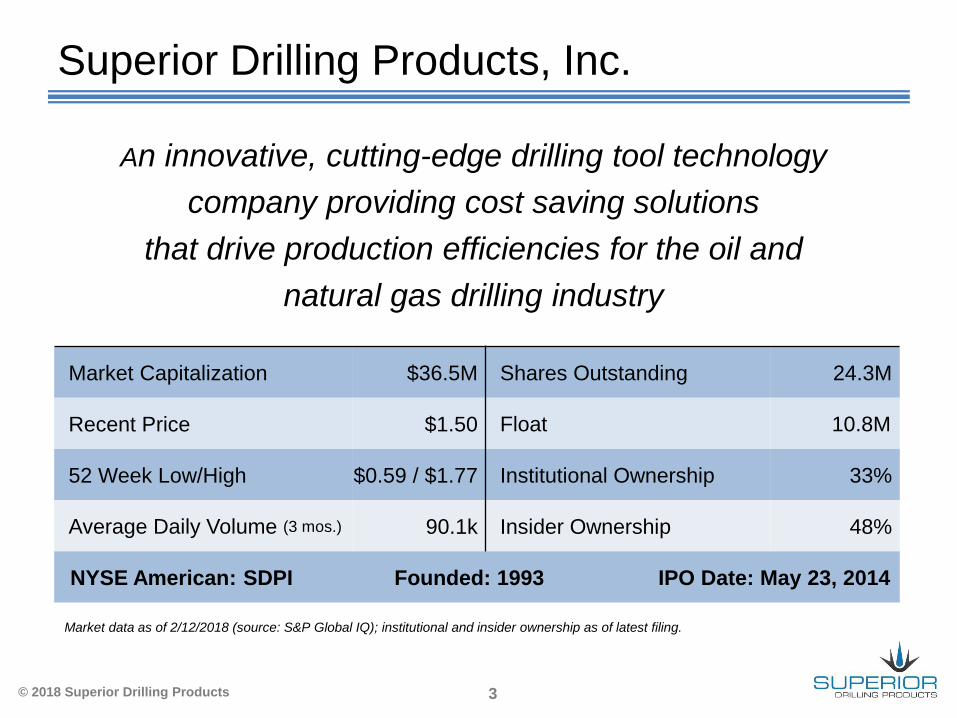
Superior Drilling Products, Inc.
An innovative, cutting-edge drilling tool technology
company providing cost saving solutions
that drive production efficiencies for the oil and
natural gas drilling industry
Market Capitalization $36.5M Shares Outstanding 24.3M
Recent Price $1.50 Float 10.8M
52 Week Low/High $0.59 / $1.77 Institutional Ownership 33%
Average Daily Volume (3 mos.) 90.1k Insider Ownership 48%
NYSE American: SDPI Founded: 1993 IPO Date: May 23, 2014
Market data as of 2/12/2018 (source: S&P Global IQ); institutional and insider ownership as of latest filing.

© 2018 Superior Drilling Products 4
Innovator, Designer and Manufacturer
Innovation
The Brain Nucleus CHUCK DnR Smart Shop
DRC E Collett V Stream BK Cutters PDC bit repair
Solutions for the upstream oil & gas industry
Drill-N-Ream® wellbore conditioning tool (DnR)
StriderTM oscillating system technology
V Stream
Drilling tool fleet maintenance and repair
BHI, DTI
Engineer, develop and manufacture new tools and technologies
13 patents or patents pending in last three years
© 2018 Superior Drilling Products 5
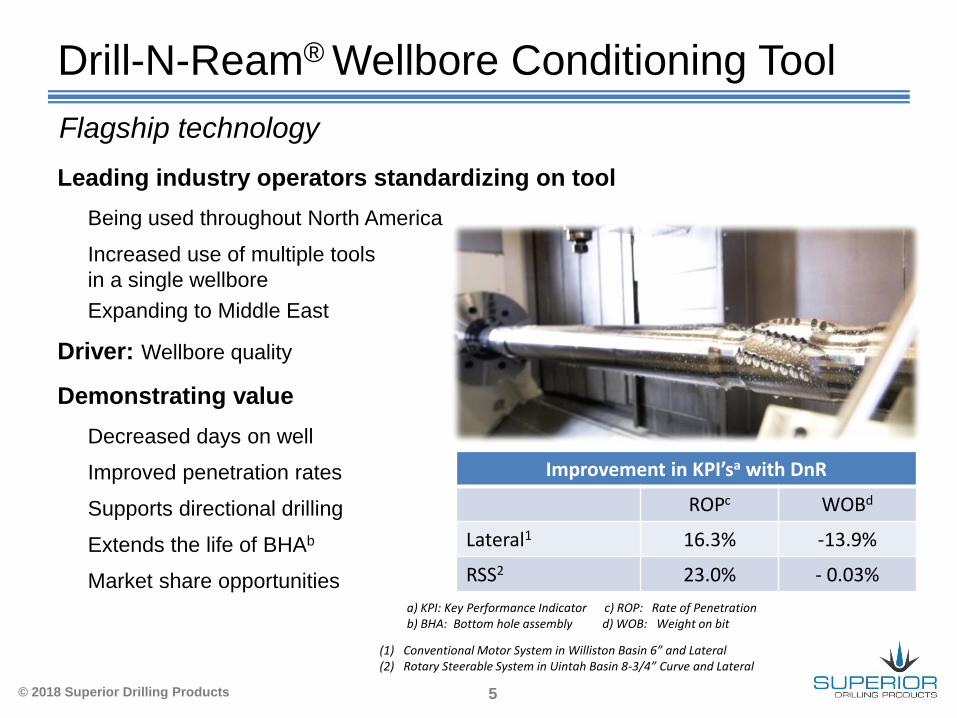
Drill-N-Ream® Wellbore Conditioning Tool
Leading industry operators standardizing on tool
Being used throughout North America
Increased use of multiple tools
in a single wellbore
Expanding to Middle East
Driver: Wellbore quality
Demonstrating value
Decreased days on well
Improved penetration rates
Supports directional drilling
Extends the life of BHAb
Market share opportunities
Flagship technology
a) KPI: Key Performance Indicator c) ROP: Rate of Penetrationb) BHA: Bottom hole assembly d) WOB: Weight on bit
Improvement in KPI’sa with DnR
ROPc WOBd
Lateral1 16.3% -13.9%
RSS2 23.0% - 0.03%
(1) Conventional Motor System in Williston Basin 6” and Lateral(2) Rotary Steerable System in Uintah Basin 8-3/4” Curve and Lateral

© 2018 Superior Drilling Products 6
Teaming up with Success
Go-to-market strategy: Qualified partners
Drill-N-Ream distribution: Market leader in downhole tool rentals
Exclusive U.S. and Canada marketing rights requires successful market penetration:
Exclusivity requirements determined by number of horizontal rigs*
Achieved 6/30/2017 market share goal. Currently evaluating status of 12/31/17 goal.
Multiple revenue streams
Initial sale, per run royalty, maintenance and repair, product replacement
New: Joint market development agreement with Weatherford for
the Middle East
Market channel partnerships
6/30/2017 12/31/2017 12/31/2018 12/31/2019 12/31/2020
10% 12.5% 17.5% 22.5% 25%
* DTI market share evaluated using last 30 days prior to each target date; further detail can be found on slide 19
© 2018 Superior Drilling Products 7
Middle East Expansion
Joint market development agreement
Agreement executed with Weatherford in December 2017
Demonstrate Drill-N-Ream capabilities to large Middle East operators
Saudi Arabia, Kuwait, and Oman
Pilot test program for 16 DnR tools; increased to 18 tools
Several tools downhole currently in Kuwait
In country Product Champions from SDPI and Weatherford
Parties plan to enter into a long-term commercial agreement
Upon technology being proven in the region
Development agreement runs through June 30, 2018
Shared rental fees during market development program
Rental fee split: SDPI 60% / 40% Weatherford
SDPI reimbursed for cost of repairs and maintenance
SDPI carries the tool cost & shipping to Weatherford (Houston)
© 2018 Superior Drilling Products 8
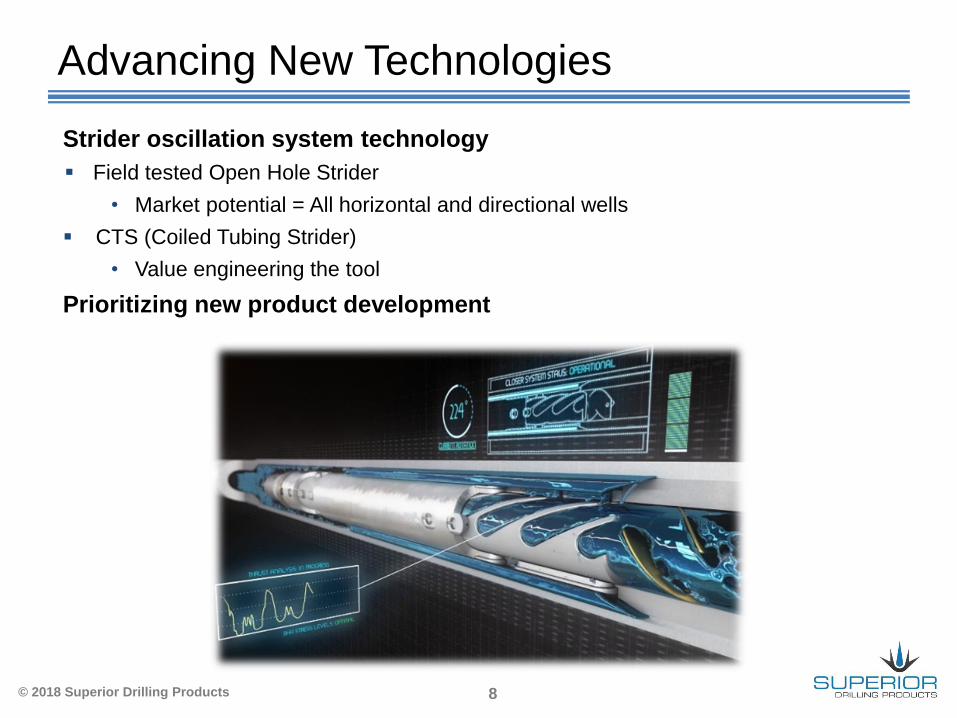
Advancing New Technologies
Strider oscillation system technology
Field tested Open Hole Strider
• Market potential = All horizontal and directional wells
CTS (Coiled Tubing Strider)
• Value engineering the tool
Prioritizing new product development

© 2018 Superior Drilling Products
Financial Results
© 2018 Superior Drilling Products 10
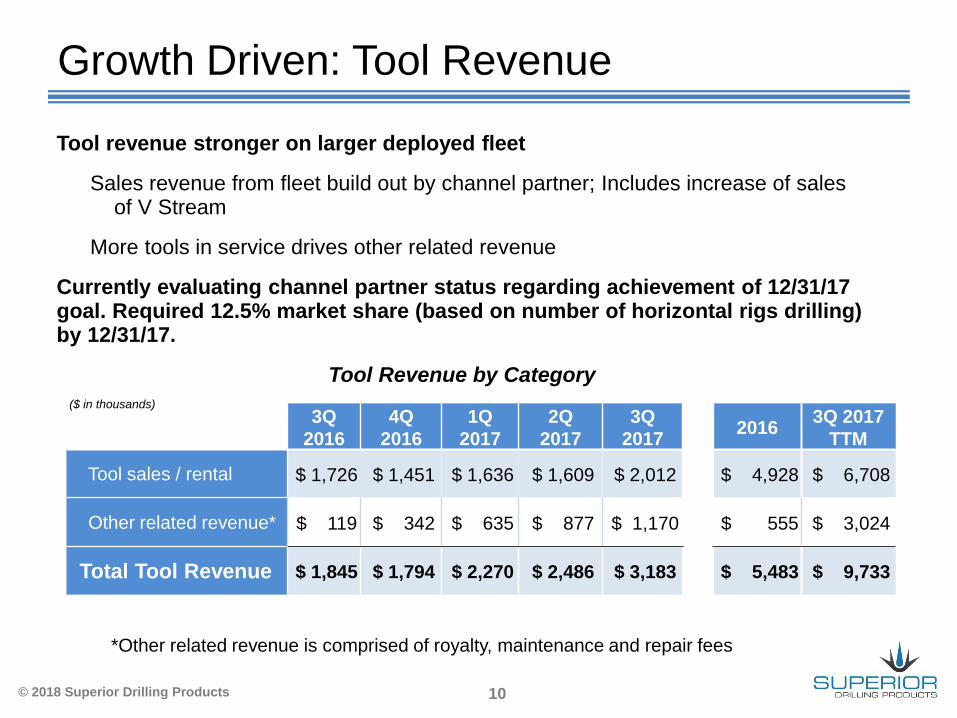
Tool revenue stronger on larger deployed fleet
Sales revenue from fleet build out by channel partner; Includes increase of sales of V Stream
More tools in service drives other related revenue
Currently evaluating channel partner status regarding achievement of 12/31/17 goal. Required 12.5% market share (based on number of horizontal rigs drilling) by 12/31/17.
Growth Driven: Tool Revenue
Tool Revenue by Category
3Q
2016
4Q
2016
1Q
2017
2Q
2017
3Q
20172016
3Q 2017
TTM
Tool sales / rental $ 1,726 $ 1,451 $ 1,636 $ 1,609 $ 2,012 $ 4,928 $ 6,708
Other related revenue* $ 119 $ 342 $ 635 $ 877 $ 1,170 $ 555 $ 3,024
Total Tool Revenue $ 1,845 $ 1,794 $ 2,270 $ 2,486 $ 3,183 $ 5,483 $ 9,733
($ in thousands)
*Other related revenue is comprised of royalty, maintenance and repair fees
© 2018 Superior Drilling Products 11
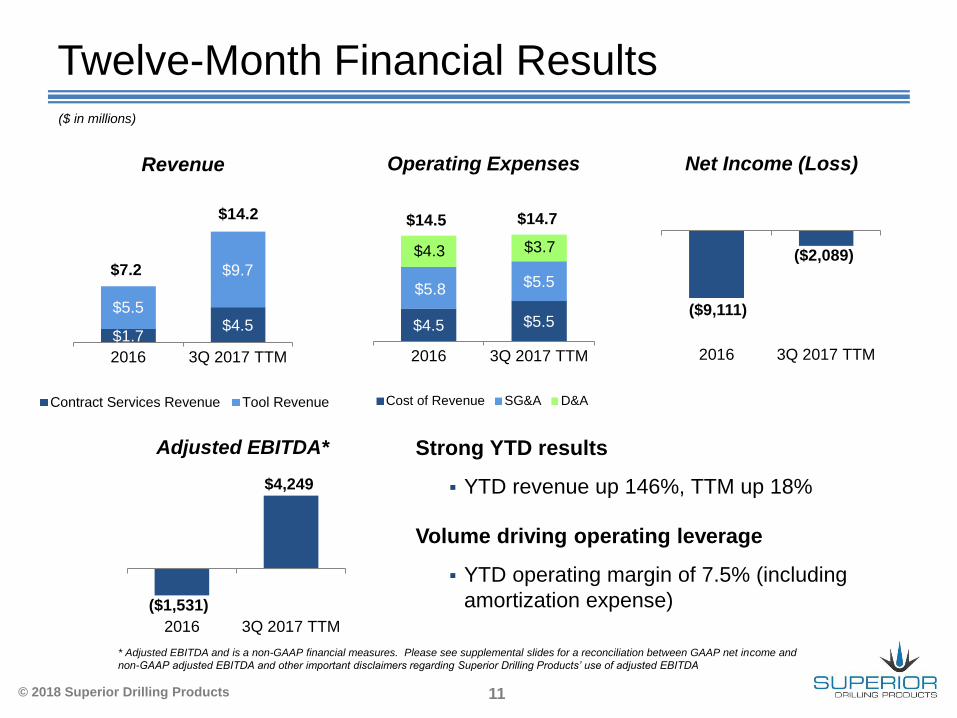
Twelve-Month Financial Results($ in millions)
$1.7$4.5
$5.5
$9.7
2016 3Q 2017 TTM
Contract Services Revenue Tool Revenue
$14.2
$7.2
Revenue
$4.5 $5.5
$5.8 $5.5
$4.3 $3.7
2016 3Q 2017 TTM
Cost of Revenue SG&A D&A
$14.5 $14.7
Operating Expenses
Adjusted EBITDA*
($1,531)
$4,249
2016 3Q 2017 TTM
* Adjusted EBITDA and is a non-GAAP financial measures. Please see supplemental slides for a reconciliation between GAAP net income and
non-GAAP adjusted EBITDA and other important disclaimers regarding Superior Drilling Products’ use of adjusted EBITDA
Strong YTD results
YTD revenue up 146%, TTM up 18%
Volume driving operating leverage
YTD operating margin of 7.5% (including
amortization expense)
($9,111)
($2,089)
2016 3Q 2017 TTM
Net Income (Loss)
© 2018 Superior Drilling Products 12
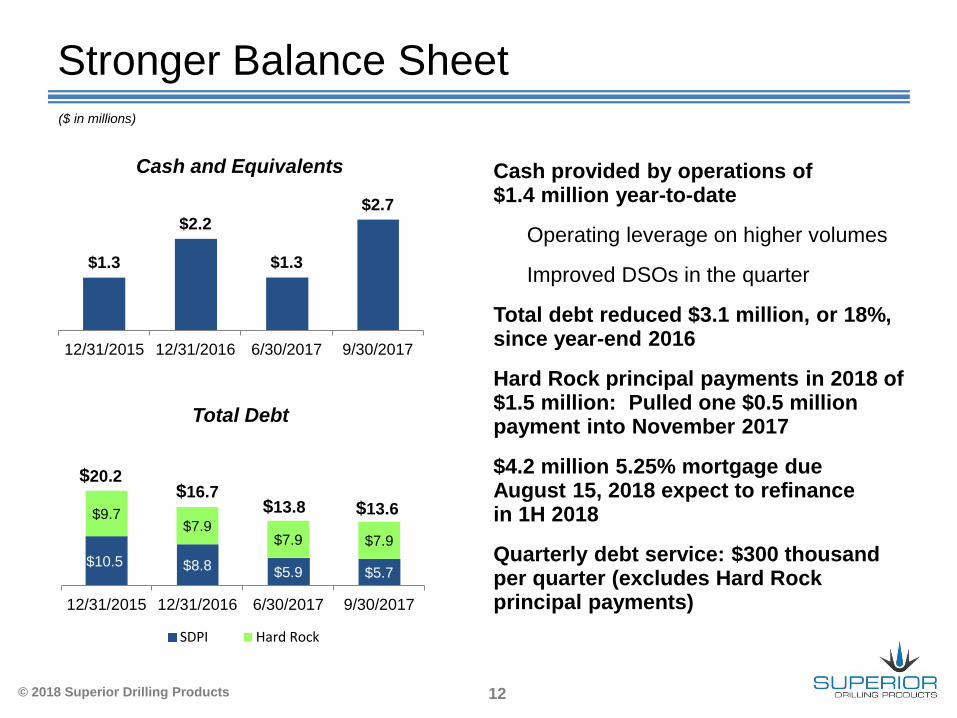
Stronger Balance Sheet
Cash and Equivalents
Total Debt
$10.5 $8.8 $5.9 $5.7
$9.7$7.9
$7.9 $7.9
12/31/2015 12/31/2016 6/30/2017 9/30/2017
SDPI Hard Rock
$20.2$16.7
$13.6$13.8
($ in millions)
$1.3
$2.2
$1.3
$2.7
12/31/2015 12/31/2016 6/30/2017 9/30/2017
Cash provided by operations of $1.4 million year-to-date
Operating leverage on higher volumes
Improved DSOs in the quarter
Total debt reduced $3.1 million, or 18%, since year-end 2016
Hard Rock principal payments in 2018 of $1.5 million: Pulled one $0.5 million payment into November 2017
$4.2 million 5.25% mortgage due August 15, 2018 expect to refinance in 1H 2018
Quarterly debt service: $300 thousand per quarter (excludes Hard Rock principal payments)
© 2018 Superior Drilling Products 13
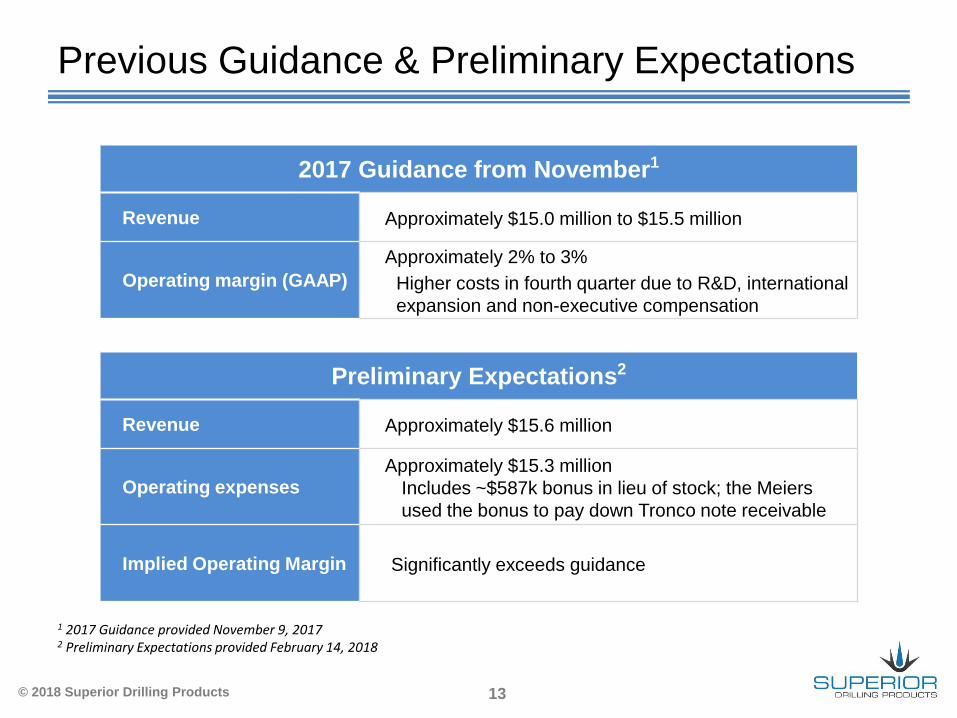
Previous Guidance & Preliminary Expectations
1 2017 Guidance provided November 9, 20172 Preliminary Expectations provided February 14, 2018
2017 Guidance from November1
Revenue Approximately $15.0 million to $15.5 million
Operating margin (GAAP)
Approximately 2% to 3%
Higher costs in fourth quarter due to R&D, international
expansion and non-executive compensation
Preliminary Expectations2
Revenue Approximately $15.6 million
Operating expensesApproximately $15.3 million
Includes ~$587k bonus in lieu of stock; the Meiers
used the bonus to pay down Tronco note receivable
Implied Operating Margin Significantly exceeds guidance

© 2018 Superior Drilling Products
NYSE American: SDPI
www.sdpi.com
EnerCom Dallas
February 22, 2018
© 2018 Superior Drilling Products
NYSE American: SDPI
www.sdpi.com
Supplemental Information
© 2018 Superior Drilling Products 16
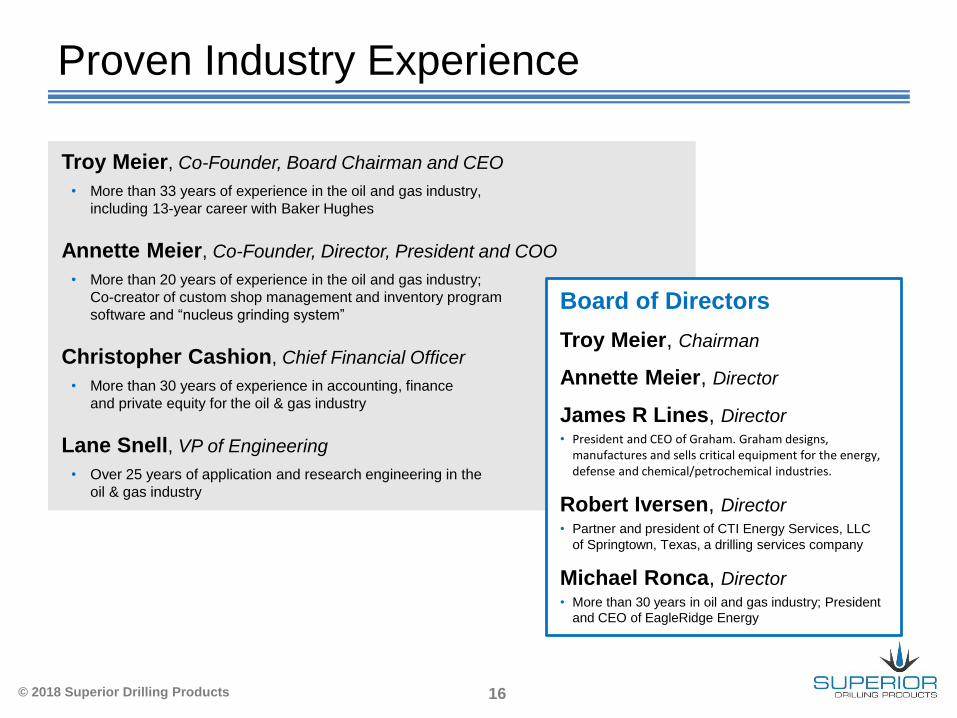
Proven Industry Experience
Troy Meier, Co-Founder, Board Chairman and CEO
• More than 33 years of experience in the oil and gas industry,
including 13-year career with Baker Hughes
Annette Meier, Co-Founder, Director, President and COO
• More than 20 years of experience in the oil and gas industry;
Co-creator of custom shop management and inventory program
software and “nucleus grinding system”
Christopher Cashion, Chief Financial Officer
• More than 30 years of experience in accounting, finance
and private equity for the oil & gas industry
Lane Snell, VP of Engineering
• Over 25 years of application and research engineering in the
oil & gas industry
Board of Directors
Troy Meier, Chairman
Annette Meier, Director
James R Lines, Director• President and CEO of Graham. Graham designs,
manufactures and sells critical equipment for the energy, defense and chemical/petrochemical industries.
Robert Iversen, Director• Partner and president of CTI Energy Services, LLC
of Springtown, Texas, a drilling services company
Michael Ronca, Director• More than 30 years in oil and gas industry; President
and CEO of EagleRidge Energy
© 2018 Superior Drilling Products 17
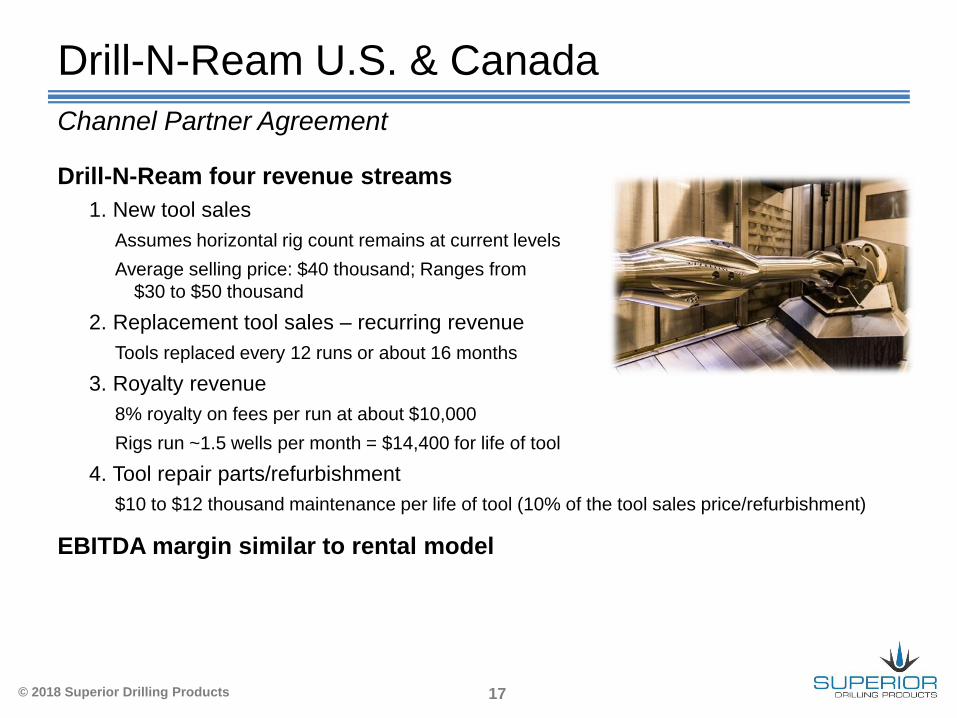
Drill-N-Ream four revenue streams
1. New tool sales
Assumes horizontal rig count remains at current levels
Average selling price: $40 thousand; Ranges from
$30 to $50 thousand
2. Replacement tool sales – recurring revenue
Tools replaced every 12 runs or about 16 months
3. Royalty revenue
8% royalty on fees per run at about $10,000
Rigs run ~1.5 wells per month = $14,400 for life of tool
4. Tool repair parts/refurbishment
$10 to $12 thousand maintenance per life of tool (10% of the tool sales price/refurbishment)
EBITDA margin similar to rental model
Drill-N-Ream U.S. & Canada
Channel Partner Agreement
© 2018 Superior Drilling Products 18
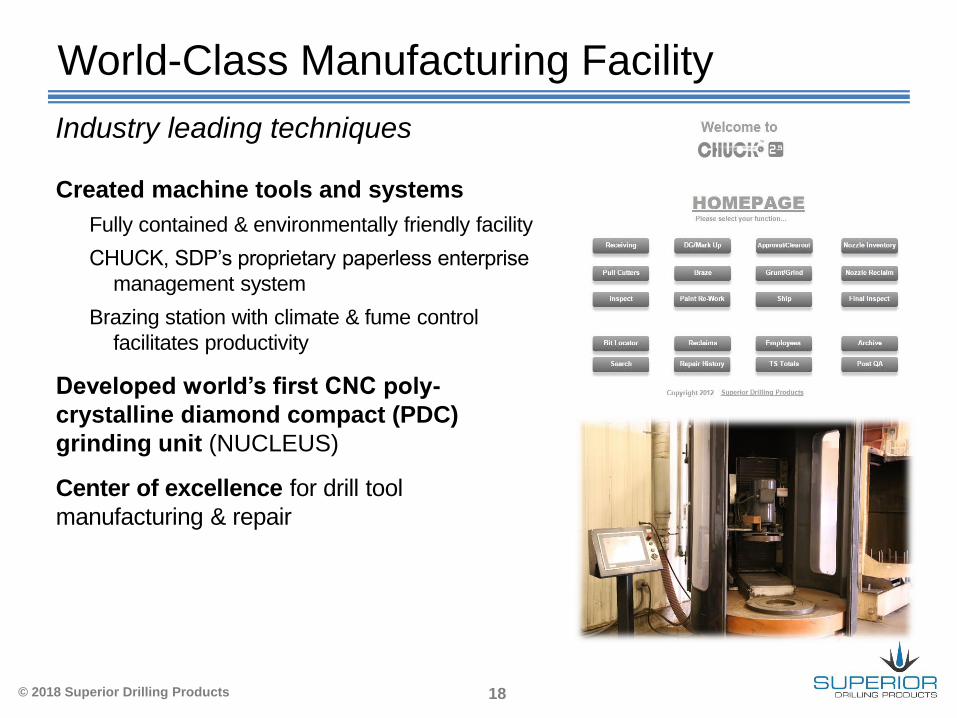
World-Class Manufacturing Facility
Created machine tools and systems
Fully contained & environmentally friendly facility
CHUCK, SDP’s proprietary paperless enterprise
management system
Brazing station with climate & fume control
facilitates productivity
Developed world’s first CNC poly-
crystalline diamond compact (PDC)
grinding unit (NUCLEUS)
Center of excellence for drill tool
manufacturing & repair
Industry leading techniques

© 2018 Superior Drilling Products 19
Adjusted EBITDA Reconciliation
Adjusted EBITDA represents net income adjusted for income taxes, interest, depreciation and amortization and other items as noted in the
reconciliation table. The Company believes Adjusted EBITDA is an important supplemental measure of operating performance and uses it to
assess performance and inform operating decisions. However, Adjusted EBITDA is not a GAAP financial measure. The Company’s calculation
of Adjusted EBITDA should not be used as a substitute for GAAP measures of performance, including net cash provided by operations, operating
income and net income. The Company’s method of calculating Adjusted EBITDA may vary substantially from the methods used by other
companies and investors are cautioned not to rely unduly on it.
Three Months Ended
September 30,
2016
December 31,
2016
March 31,
2017
June 30,
2017
September 30,
2017
GAAP net income (loss) $ (1,173,432) $ (2,595,946) $ (385,985) $ 306,807 $ 586,039
Add back:
Depreciation and amortization 932,250 912,034 938,022 899,373 907,837
Impairment of assets - 1,050,855 - - -
Interest expense, net 294,685 433,225 177,166 132,594 133,551
Share-based compensation 157,266 249,411 175,380 175,361 147,643
Functional Drill-N-Ream sales - - - - -
(Gain) loss on sale of assets (4,003) 17,841 5,828 (17,995) -
Unrealized gain on warrant derivative (28,301) - - - -
Income tax (benefit) expense (2,000) - - - -
Non-GAAP adjusted EBITDA(1) $ 176,465 $ 67,420 $ 910,411 $ 1,496,140 $ 1,775,070
GAAP Revenue $ 2,261,310 $ 2,332,659 $ 3,369,612 $ 4,049,497 $ 4,446,540
Non-GAAP EBITDA Margin 7.8% 2.9% 27.0% 36.9% 39.9%

© 2018 Superior Drilling Products 20
Adjusted EBITDA Reconciliation
Full Year Ended
September 30, 2017
TTM December 31, 2016
GAAP net loss $ (2,089,085) $ (9,110,621)
Add back:
Depreciation and amortization 3,657,266 4,291,249
Interest expense, net 876,536 1,299,667
Share-based compensation 747,795 783,462
Impairment of assets 1,050,855 1,413,028
(Gain) loss on sale of assets 5,674 (177,611)
Income tax benefit - (2,000)
Unrealized gain on warrant derivative - (28,301)
Non-GAAP adjusted EBITDA(1) $ 4,249,041 $ (1,531,127)
Adjusted EBITDA represents net income adjusted for income taxes, interest, depreciation and amortization and other items as noted in the
reconciliation table. The Company believes Adjusted EBITDA is an important supplemental measure of operating performance and uses it to
assess performance and inform operating decisions. However, Adjusted EBITDA is not a GAAP financial measure. The Company’s calculation
of Adjusted EBITDA should not be used as a substitute for GAAP measures of performance, including net cash provided by operations, operating
income and net income. The Company’s method of calculating Adjusted EBITDA may vary substantially from the methods used by other
companies and investors are cautioned not to rely unduly on it.